

Abstract
Psychophysical studies indicate that perception of the colour and brightness of a surface depends on neural signals evoked by the borders of the surface rather than its interior. The visual cortex emphasizes contrast borders, but it is unclear whether colour surface signals also exist, whether colour border signals are orientation selective or mainly non-oriented, and whether cortical processing tends to separate colour and form information. To address these questions we examined the representation of uniform colour figures by recording single neuron activity from areas V1 and V2 in alert macaque monkeys during behaviourally induced fixation. Three aspects of coding were quantified: colour, orientation and edge selectivity. The occurrence of colour selectivity was not correlated with orientation or edge selectivity. The fraction of colour-selective cells was the same (64 % in layers 2 and 3 of V1, 45 % in V2) for oriented and non-oriented cells, and for edge-selective and surface-responsive cells. Oriented cells were often highly selective in colour space, and about 40 % of them were selective for edge polarity or border ownership. Thus, contrary to the idea of feature maps, colour, orientation and edge polarity are multiplexed in cortical signals. The results from V2 were similar to those from upper-layer V1, indicating that cortical processing does not strive to separate form and colour information. Oriented cells were five times more frequent than non-oriented cells. Thus, the vast majority of colour-coded cells are orientation tuned. Based on response profiles across a 4 deg square figure, and the relative frequency of oriented and non-oriented cells, we estimate that the cortical colour signal is 5–6 times stronger for the edges than for the surface of the figure. The frequency of oriented colour cells and their ability to code edge polarity indicate that these cells play a major role in the representation of surface colour.
One of the most striking differences between the visual cortex and its afferent pathways relates to the coding of surfaces of uniform colour. While the vast majority of cells in the dorsal lateral geniculate nucleus (LGN) respond vigorously to diffuse light of appropriate colour (De Valois, 1965; Wiesel & Hubel, 1966; Reid & Shapley, 1992), most cortical neurons respond weakly or not at all to diffuse light (Hubel & Wiesel, 1968). A uniform colour figure activates cortical cells representing the borders, but few if any of those representing the interior (Hubel, 1988). This is contrary to the intuitive assumption that surface colour should be represented by the neurons whose receptive fields point at the surface, and that uniformity of colour should be represented by uniform distribution of cortical activity. To resolve this paradox, theories of perception have often postulated a central process of ‘filling-in’ which would restore the uniform pattern of colour signals at some level in the visual cortex (Walls, 1954; Gerrits & Vendrik, 1970; Cohen & Grossberg, 1984; for a review see Pessoa et al. 1998).
Studies of the neural coding of colour have generally focused on the colour selectivity of cells, and relatively few data are available on the question of whether colour information is carried by surface or border signals. De Valois & Pease (1971) showed that type I colour-opponent cells of the LGN are edge selective when stimulated with luminance patterns, but respond best to full-field stimuli (i.e. surfaces) when tested with equiluminant chromatic patterns. In the visual cortex, it was found that colour opponency is generally paired with spatial antagonism (Livingstone & Hubel, 1984; Hubel & Livingstone, 1987), which means that most colour-coded cells would be activated only in the presence of contrast borders. Most cells in area V1 show band-pass spatial frequency tuning for chromatic gratings, which also indicates selectivity for contrast borders (Thorell et al. 1984; Lennie et al. 1990; Johnson et al. 2001).
A related question is whether colour and form processing are separated early on in the cortex. Some studies found that colour-sensitive cells in V1 and V4 are generally not orientation selective (Zeki, 1983), but others found that cells in area V1 are often colour- and orientation selective (Poggio et al. 1975; Michael, 1978a,b; 1979; Thorell et al. 1984; Leventhal et al. 1995; Johnson et al. 2001). Livingstone & Hubel related colour processing to the non-oriented cells in the cytochrome oxidase (CO) dense blobs of V1 and the thin CO dense stripes of V2 and concluded that the visual cortex tends to process colour and form in separate streams (Livingstone & Hubel, 1984; Hubel & Livingstone, 1987). DeYoe & Van Essen (1985) also found cells in the thin CO dense stripes of V2 to be relatively more colour sensitive and less orientation selective. However, in the inter-blobs of V1, Livingstone & Hubel (1984) also found many colour- and orientation-selective cells. Recent studies have re-examined the question of segregation of colour and orientation signals in V1 (Leventhal et al. 1995) and V2 (Levitt et al. 1994; Kiper et al. 1997) but did not find a clear correlation between colour selectivity and lack of orientation tuning.
It has been argued that colour-orientation-selective cells are primarily needed for the detection of contours (which can be defined by contrast in luminance or chromaticity) and therefore belong to the form-processing path. Cells of the same orientation, but different colour selectivities, would subsequently be combined to form ‘universal colour cells’ (cells that respond to borders of any colour or luminance contrast; Krüger & Gouras, 1980). Similarly, it has been argued that cells that serve colour vision should be non-oriented (Livingstone & Hubel, 1984). Comparing the frequency of these types of cells between V1 and V2 might give us a clue to understanding the goals of cortical processing. If separation of colour and form information is a goal of processing, then colour-orientation-selective cells should be less frequent in the secondary visual area.
We have studied the neural activity of V1 and V2 in the alert monkey during behaviourally induced fixation, a method that approximates the natural conditions of vision. The aim was to describe how exactly a large, uniformly coloured figure is represented in the visual cortex of the monkey. One might think that this information could be derived from the responses to chromatic sinusoidal gratings, but this would require the assumption of linear spatial summation, which is generally not valid. The goal here is to provide a picture of the actual distribution of activity for a prototypical figure. The results should be valuable as a basis for theories of colour surface perception, specifically for understanding the phenomenon of ‘filling-in’ of colour and brightness (Walls, 1954; Yarbus, 1967; Gerrits & Vendrik, 1970; Pessoa et al. 1998; Friedman et al. 1999). Our results will also provide a quantitative answer to the question of colour and orientation coding, which is crucial for understanding the mechanisms of feature binding and the principles of object coding in the visual system.
METHODS
All procedures conformed to National Institutes of Health and USDA guidelines as verified by the Animal Care and Use Committee of the Johns Hopkins University.
Single neurons were recorded from areas V1 and V2 in eight hemispheres of four alert, behaving monkeys (Macaca mulatta). The animals were first habituated to the laboratory and to sitting in a box-like monkey chair, and then trained for several months on a visual task (see below). Later, a peg for head fixation and two recording chambers (over the left and right visual cortex) were attached to the skull. The surgery was performed under aseptic conditions. The animal was first sedated with ketamine hydrochloride (20 mg kg−1i.m.) and then deeply anaesthetized with sodium pentobarbital (25 mg kg−1i.v.). A single dose of 300 000 i.u. long-acting penicillin was administered i.m. Incision margins were infiltrated with a topical anaesthetic (2 % xylocaine). Buprenorphine hydrochloride was used for postoperative analgesia (0.03 mg kg−1 injected i.m. every 12 h for 2 days). The T-shaped peg (35 mm wide, 40 mm long, with a 20 mm high post) was mounted on the calotte with bone cement and eight small cortical screws. The implants, including screws and cement, weighed about 80 g, and did not impair head movements or balance in any way. The behaviour of the animal was carefully monitored, especially after the surgery; no signs of distress were evident. Two weeks or more were allowed for recovery. For recording, the animal was seated in the box-like chair and its head fixed by means of the implanted peg. The animals adjusted quickly to this condition. The box was wide enough so that the animal could move its limbs and body, and take-up a comfortable position. Mild fluid deprivation and liquid reward were used for training and to induce fixation during recording. Training sessions lasted 0.5–4 h, and recording sessions about 5 h, during which the animals were fed raisins and dry fruit, and could also take a nap. Training or recording periods of 2–3 weeks were alternated with rest periods of one week or more. Large, baboon-size cages were used for housing. The animals stayed healthy and gained weight during the experiments. After completion of recording, the animals were killed with an overdose of barbiturate and their brains perfused through the heart with phosphate buffer and formaldehyde.
Single cell activity was recorded extracellularly with glass-coated Pt-Ir microelectrodes inserted through small (3 mm) trephinations. Electrodes with fine tips were used that easily isolate single cells (taper 0.07–0.1, impedance 3–15 MΩ at 1 kHz). These electrodes isolated about 22 cells on average in vertical penetrations through V1 and also picked up action potentials of fibres in the white matter. Action potentials were generally well above the noise level so that recordings of more than one cell could easily be recognized by ear and from the oscilloscopic display. The recorded size of the action potentials of a cell generally varies at some time (usually at the beginning or before the termination of isolation). In the case of double recordings, we always found that the action potentials from the two cells changed differentially at some time. Thus, even when spikes from different cells were temporarily indistinguishable, double recording would always become apparent at some point, and such data were discarded. While advancing the electrode, we monitored the entry into the cortex, the strength of neural activity, its orientation and ocular preference, the entry into the white matter, the entry into the cortex below the white matter, etc. These observations were recorded graphically as a function of depth. The resulting track charts helped in identifying cortical layers and in diagnosing the state of the dura mater and possible dimpling. Area V1 was recorded right under the dura, and V2 either in the posterior bank of the lunate sulcus, after passing through V1 and the white matter, or in the lip of the post-lunate gyrus. The two areas were distinguished primarily by their retinotopic organization. The recording sites were also verified by histological reconstruction (see Zhou et al. 2000).
Visual stimulation and behavioural paradigm
For half of the experiments (animals M12 and M15) stereoscopic stimulation was used, and visual stimuli were generated by an Omnicomp GDS 2000 PC graphics processor and displayed on a Hitachi HM4119 colour monitor with a 60 Hz refresh rate. The fixation target and test stimuli were viewed through a mirror stereoscope at a distance of 51 cm. The visual field measured 11.5 deg square, with a resolution of 400 pixels × 400 pixels, for each eye. For the other experiments (animals M13 and M16), visual stimuli were generated by a Silicon Graphics Indigo2 workstation and displayed on a Barco CCID 121 FS colour monitor with a resolution of 1280 pixels × 1024 pixels and 72 Hz refresh rate. This display was viewed directly with both eyes at a distance of 93 cm and subtended 21 deg × 17 deg visual angle. The stimuli were coloured or achromatic bars and squares presented on a neutral grey background, as specified in Table 1.
Table 1.
Specification in CIE (1931) coordinates of the colours typically used for measuring colour selectivity
| Colour | x | y | Y(cd m−2) |
|---|---|---|---|
| Red-brown | 0.60 | 0.35 | 14/2.7 |
| Green-olive | 0.31 | 0.58 | 37/6.7 |
| Blue-azure | 0.16 | 0.08 | 6.8/1.8 |
| Yellow-beige | 0.41/0.46 | 0.50/0.45 | 37/6.5 |
| Violet-purple | 0.30 | 0.15 | 20/3.4 |
| Aqua-cyan | 0.23 | 0.31 | 38/7.3 |
| White-grey-black | 0.30 | 0.32 | 38/8.8/1.2 |
| Background | 0.30 | 0.32 | 20*, 16† |
Y is luminance, and x and y are the chromaticity coordinates. Two (or 3) luminance values were used with each chromaticity, except for yellow and beige for which slightly different chromaticities were used in some experiments to compensate for the Betzold-Brücke hue shift. In addition, we used a set of 7 equiluminant colours with the same chromaticities, but Y = 7 cd m−2. These colours were presented on backgrounds of 20 or 2.5 cd m−2, depending on the contrast preference of the cell.
For setup 1
for setup 2.
The animals were trained to fixate their gaze by requiring them to respond to an orientation change of a small fixation target that could only be resolved in foveal vision. The regular trial sequence was as follows: target onset, monkey responds by pulling a lever and begins to fixate, 0.5–5 s random interval (fixation period), target rotates, monkey responds by releasing lever, 1–2 s random interval, target onset etc. Eye movements were monitored with a video-based infrared pupil tracking system. Two of the monkeys (M13 and M16) served also in a study on perceptual filling-in, in which they were trained to respond to a colour change of a peripherally viewed disk-ring stimulus. No difference was noticed between these and the other two monkeys in the results of the present experiments.
Data collection and analysis
In order to study a representative sample of cells, an exhaustive analysis was attempted. Upon isolation of a cell, the receptive field was examined with rectangular bars, and the optimal stimulus parameters were determined by varying the length, width, colour, orientation and binocular disparity (in the stereoscopic setup). Using this optimal bar stimulus, we then determined the ‘minimum response field’ of the cell (see Zhou et al. 2000, for details). The size of the minimum response field characterizes the precision of positional information in the neural responses (see Results). After this initial exploration and mapping, colour, orientation and edge selectivity were measured.
Edge selectivity. This was measured by recording position-response profiles orthogonal to the optimal orientation using a square, typically 4 deg on each side, of the preferred colour. A size of 6 deg was occasionally used, in the case of larger receptive fields. The display was static and neuronal activity was analysed during the fixation periods (0.5–5 s). Responses were recorded for 16 positions of the square in 40 % of the cells (see examples in Fig. 1), and for 4 positions (figure centre, edges and 2 deg outside the figure) in the remaining cells. Each position was presented for about 6 s, distributed over 2–6 trials, in pseudorandom order. Mean firing rates were analysed and an index of edge enhancement (EEI) was calculated according to:
| (1) |
where RE is the edge response and RS the surface response. RE was defined as the maximum of the responses to the two optimally oriented edges of the square, each of which was the maximum of three adjacent positions, minus the response outside the figure. RS was defined as the response to the centre of the square minus the response outside the figure. The centre, and two positions 0.5 deg to either side of the centre, were averaged for the ‘centre’ response, and three positions 1.5–2 deg outside the figure borders were averaged for the ‘outside’ response. An index of zero means that the cell responded equally to the edges and centre of the figure, and an index of one means that the centre response was either zero, or the same as the outside response. In most cells the activity for the outside position was zero or very low, as was the spontaneous firing rate. We also calculated an asymmetry index (AI) that characterizes the asymmetry of the responses to the two opposite sides of the square:
| (2) |
This index is zero if the two edge responses are equal, and one if the cell responds only to one side of the square.
Figure 1. Four types of spatial selectivity of colour-coded neurons.
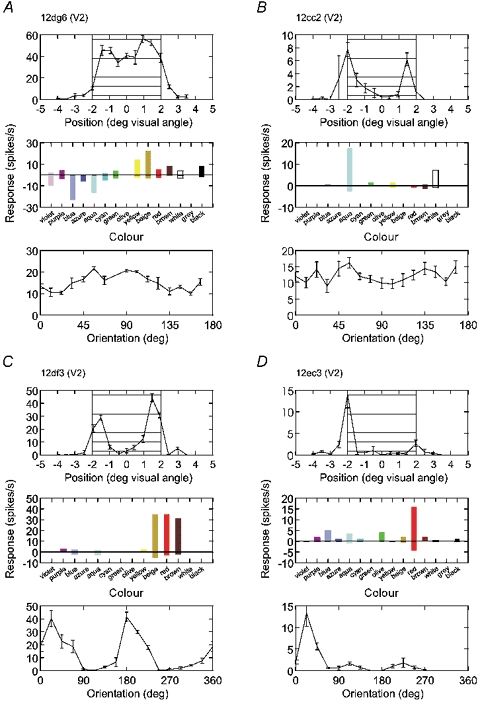
A–D, examples of neurons from area V2. For each neuron, edge selectivity, colour selectivity and orientation tuning is illustrated. In each panel, the top graphs represent the activity produced by static displays of a 4 deg square of preferred colour presented at 16 positions relative to the receptive field. Hatching indicates the range where the receptive field centre was inside the square or centred on the edges (positions −2 and +2). The middle bar graphs represent responses to flashing bars of various colours, as indicated on the abscissae. Colours of high and low luminance were tested for each chromaticity (hue), for example, violet and purple, blue and azure, etc., and the three achromatic colours white, grey and black. On-responses are plotted upwards, off-responses downwards. The bottom graphs show orientation tuning curves obtained with a bar 2 deg × 0.2 deg (A and B) or with the edge of a 4 deg square (C and D). The cell in A responds to the surface, the cells in B–D only to the edges of the square; those in A and B are non-oriented, those in C and D are orientation selective; those in B and C respond to both edges, that in D is selective for edge contrast polarity. In this figure and in Figs 2 and 3, the numbers at the top of each panel are unit identification codes with cortical area assignment.
Orientation selectivity. This was determined with bars of optimum size and colour oscillating back and forth across the receptive field at 1 Hz, usually at 16 orientations spaced evenly across 180 or 90 deg, depending on the sharpness of orientation tuning. About 6 cycles were sampled for each orientation. In 10 % of the cells, only the responses to the preferred and the orthogonal orientation were recorded for calculation of the modulation index, or an index of one was assigned if a complete modulation was obvious in the initial exploration. Using the mean firing rates, orientation selectivity was quantified in two ways: (1) by the orientation modulation index (OMI):
| (3) |
where Rmax and Rmin are the maximum and minimum responses of the orientation tuning, and (2) by measuring the (full) width at half-height of the orientation-tuning curve.
Colour selectivity. This was determined with flashing bars that were optimally oriented and centred on the receptive field. A standard set of 15 colours and a neutral background were used as specified in Table 1. The colours were presented one per trial, and a number of trials without a stimulus were included for measuring the spontaneous activity. To minimize colour adaptation, the sequence was balanced for chromaticity by grouping together triplets of colours that would sum to neutral grey. The sequence was run forwards and backwards. The stimulus was flashed on and off at 1 Hz for the duration of the fixation period (0.5–5 s). In total, each colour was presented about eight times. Three measures of colour selectivity were computed from these data. The first is based on a linear model. Response was defined as the difference between the numbers of spikes in the on- and off-periods (0.5 s each). The stimulus colours were placed in seven categories of chromaticity and four categories of luminance. For each neuron, the effects of luminance and chromaticity on the response were determined by analysis of variance (ANOVA) using the hierarchical approach for unbalanced designs (Yates, 1934). (The design is necessarily unbalanced because we wished to sample the entire physiological colour space approximately evenly, and colours of some chromaticities require a higher luminance than those of other chromaticities; see Results.) A two-factor ANOVA was initially run, and, if a factor was not significant (P≥ 0.01), it was eliminated and a single factor ANOVA was then performed. The resulting F and P values were then assigned to the neuron. The second measure was a colour selectivity index (CSI), calculated according to:
| (4) |
where Ri is the response to colour i, Rmax the response to the preferred colour and n the number of colours. For this index only the number of spikes in the on-response was counted. The index estimates the relative volume in colour space of the colours to which a cell does not respond. For a cell that responded equally to all colours, this index would be zero, and for a cell that responded only to one of the 15 colours, the index would equal 1 − 1/15 = 0.93. The third measure of colour selectivity used was the white index, the ratio of the response to the most effective chromatic colour over the response to white (Burkhalter & Van Essen, 1986). We also calculated the ratio of the response to the most effective chromatic colour over the response to the most effective achromatic colour. The difference between on- and off-responses was used for these indices.
To characterize the statistical relationships between the various selectivity measures in a population of neurons, scatter plots and Spearman's rank correlation coefficient (ρ) were used. The scatter plots were ‘jittered’ to reduce overlap.
RESULTS
We studied three aspects of neural coding: orientation tuning, edge selectivity and colour coding. The following analysis is based on quantitative data from 842 cells, 425 of V1, and 417 of V2, recorded in eight hemispheres of four monkeys. For 670 of these cells, 280 from V1, and 290 from V2, we have data on at least two aspects. Most of our V1 data are from layers 2 and 3 (338/425). We were primarily interested in these layers, because they provide the main input to V2. Thus, we will focus our discussion on those upper-layer cells of V1 and the cells of V2.
Each cell was studied by finding the optimal shape, orientation, colour and motion for a bar stimulus, mapping its receptive field, and then applying the three tests described below. Since we were interested in the responses to the surface and edges of squares, strongly end-stopped cells (hypercomplex cells of Hubel & Wiesel, 1968) were excluded. Relatively rare cases of special selectivity, for example cells that respond exclusively to thin bars, or only to periodic patterns (von der Heydt et al. 1992), were also excluded. About half of our experiments were done with stereoscopic stimulation, and in these, the binocular disparity was optimized for the cell under study. In the other experiments, the stimulus display was viewed directly with both eyes, and in this case, we have probably missed some of the disparity-selective cells or underestimated their responses. However, the results concerning the questions addressed here were not noticeably different between the data obtained with and without stereoscopic stimulation. Overall, the fraction of cells that could not be activated was small.
Three aspects of neural coding
In this section we illustrate the kind of data we recorded from each cell and explain how we measured selectivity in each case. We first use these measurements for a classification of cells, which is shown in Table 2. In the next section we examine the correlations between these measurements.
Table 2.
Classification of cells according to orientation, colour and edge selectivity
| VI (2,3) | V2 | |||||
|---|---|---|---|---|---|---|
| Tested | Selective | % | Tested | Selective | % | |
| Orientation (modulation > 0.6) | 313 | 253 | 81 | 388 | 306 | 79 |
| Colour (selectivity index > 0.5) | 207 | 132 | 64 | 254 | 115 | 45 |
| Hue (Pchrom < 0.01) | 180 | 79 | 44 | 223 | 79 | 35 |
| Brightness (Plum < 0.01) | 180 | 124 | 69 | 223 | 132 | 59 |
| Hue and brightness (Pchrom < 0.01 and Plum < 0.01) | 180 | 62 | 34 | 223 | 55 | 25 |
| Edge (enhancement index > 0.6) | 154 | 129 | 84 | 210 | 165 | 79 |
| Side (asymmetry ratio > 2) | 134 | 58 | 42 | 163 | 67 | 41 |
Data from layers 2 and 3 of striate cortex and from area V2. Pchrom and Plum are the P values of the chromaticity and luminance effects, respectively (see Methods).
Figure 1 shows data from four colour-selective cells to illustrate the characteristic features of the three aspects of neural coding. In all three tests, the stimuli were presented on a neutral grey background. The top plots in Fig. 1A–D show position-response profiles for a static uniform square of 4 deg size of the preferred colour of each cell. The square was oriented for optimum edge orientation, and position was varied along the axis perpendicular to this orientation. The square was presented at a randomly selected position for each trial, and appeared 1–2 s before the beginning of fixation. The response strength, measured in spikes per second, is plotted as a function of the position of the cell's receptive field relative to the square. The hatched area indicates positions inside the square.
The middle bar graphs of Fig. 1A–D represent the responses to flashing bars of various colours. The bars were optimized for width and length and presented at the position that produced the maximal response. The bars were switched on and off at 500 ms intervals. The activity during the on-phase is plotted upwards (positive), the activity during the off-phase downwards (negative).
The bottom graphs of Fig. 1A–D show the orientation tuning curves of the cells. Moving bars were generally used for this test because this method gives the most reliable results, but in Fig. 1C and D we show the results obtained with static edges to illustrate the orientation dependence of edge responses in cells with symmetric and asymmetric edge selectivity.
Edge selectivity. The position-response profiles show that the cell in Fig. 1A responded whenever the receptive field was inside the square, whereas those in Fig. 1B–D showed peaks of response at positions where the receptive field was centred on an edge, or close to an edge, but almost no response at positions inside the square. We have quantified this aspect by an ‘edge enhancement index’, which is the difference between edge and surface responses divided by their sum (eqn (1)). The values of this index for the cells illustrated in Fig. 1A–D were 0.18, 0.87, 0.85 and 1.06, respectively. For ease of discussion, we refer to cells that respond like that illustrated in Fig. 1A as ‘surface cells’, and cells that respond like those illustrated in Fig. 1B–D as ‘edge cells’. The criterion for ‘edge cell’ was an edge enhancement index greater than 0.6, which means the edge response was more than four times the surface response. Most edge cells gave virtually no surface response. Surface cells generally responded under surface and edge conditions, as illustrated in Fig. 1A. As will be evident later, the criterion is somewhat arbitrary since the distribution of the index does not provide a clear border between two classes of cells. Many cells responded more to one side of the square than the other, as shown in Fig. 1D, suggesting selectivity for edge contrast polarity. We quantified this by an ‘asymmetry index’, the absolute difference between the two edge responses divided by their sum (eqn (2)).
Orientation selectivity. The orientation tuning curves show that the cells in Fig. 1A and B were non-oriented, while those in Fig. 1C and D were orientation selective. At least two parameters are needed to characterize orientation tuning adequately: one that captures the degree of modulation of responses, and another that measures the width of tuning. Cells can be more or less strongly modulated by the orientation of a stimulus, and those that are modulated can have narrow or broad tuning. We therefore calculated an orientation modulation index (eqn (3)), and the (full) width at half-amplitude of the orientation tuning. The cells in Fig. 1A–D had modulation indices of 0.37, 0.25, 1.0 and 0.85, respectively (as determined with moving bars; for the plot of Fig. 1D, which is based on edge responses, the index would be 1.0). We used an index > 0.6 as a criterion, meaning that the response for the best orientation was more than four times stronger than that for the worst orientation. The width of orientation tuning was 60 deg for the cell in C and 35 deg for the cell in D.
Colour selectivity. While the determination of orientation tuning and edge selectivity is straightforward, the characterization of neural colour selectivity is notoriously difficult. Colour selectivity is often defined as the ability to discriminate equiluminant colours. However, as noted by Hering (1905/1964), white, black and grey are also ‘colours’ in a wider sense, and the brightness aspect is an important ingredient of colour perception. This becomes apparent if colour stimuli are viewed against a luminous background (as opposed to presentation in darkness). A patch of dim ‘red’ light, for example, is then perceived as brown, a colour that seems to have little in common with red. Thus, a set of equiluminant colours cannot include red and brown. Moreover, it cannot comprise yellow and deep blue: either the yellow would appear ochre, or the blue would appear desaturated. To explore the entire range of colour perception (as accessible with our computer display), we have tested each cell with a set of 15 colours representing seven hues, or spectral compositions, on a neutral grey background (Table 1). Six of the hues were chromatic colours whose CIE loci were distributed on the perimeter of the triangle subtended by the primaries of the display. The chromaticities of the mixed colours were derived from white by setting one primary to zero, except for yellow, which was defined by adjusting a red-green mixture to yield ‘pure yellow’ as perceived by the authors (normal trichromats, one presbyopic). Each of these hues was presented with two luminance values, one near the available maximum, the other about 0.7 log units darker. This produced colour pairs like red and brown, yellow and beige, green and olive etc. The seventh hue was achromatic, and three luminance values were used to produce white, grey and black. We did not choose test colours according to their relation to the cardinal axes of colour space because identifying the weights of the cone inputs to each cell (Lennie et al. 1990; Johnson et al. 2001) was not the goal of this study. Our goal was to sample perceptual colour space as evenly as possible with a limited number of colours (Boynton & Olson, 1987). Flashing bars were used in order to facilitate comparison with previous studies. The results obtained with flashing bars should apply also to natural viewing of uniform figures (see Discussion). The use of two (or three) luminance values for each spectral composition served two purposes. First, as already stated, it allowed us to include the full gamut of colours. Second, it enabled us to separate the effects of chromaticity and luminance. We did this by arranging the test colours in four groups of nearly equiluminant colours and performing a two-factor analysis of variance with the factors chromaticity and luminance. The associated F values are measures of a cell's sensitivity for each factor (the amount of variance produced by a factor relative to the variance of repeated presentation). For the examples of Fig. 1A–D, we obtained F values for the effect of chromaticity of 39, 15, 58 and 4.7, respectively (all significant). The cells illustrated in Fig. 1A, B and D also showed significant luminance effects (F values 13, 7.2 and 6.7, respectively), the cell in A preferring dark colours, and those in B and D light colours.
A significant chromaticity effect in the two-way ANOVA means that a cell is sensitive to the chromatic variation of the stimulus (even in the presence of luminance variations). Thus, cells with significant chromaticity effect should also be able to differentiate equiluminant colours. To show this, we performed control experiments with a set of seven equiluminant colours (Table 1). Figure 2 shows a comparison of the results obtained with the standard colour set and the equiluminant colour set. With the standard colour set (left), the cells illustrated in A and B were classified as colour selective (F values for chromaticity > 10) and these cells also showed a strong variation of responses across the equiluminant colours (right). It can be seen that the cells in A and B preferred similar hues in the standard colour test and the equiluminant colour test (cell in A: blue and aqua; cell in B: red and violet). The cell in C was not colour selective in the standard test, and responded about equally to each of the equiluminant colours, including grey. All three cells showed strong luminance effects in the responses to the standard colours (F values > 10), but this effect did not interfere with the colour selectivity classification. Overall, the F values for chromaticity were strongly correlated between standard and equiluminant colour tests (Fig. 2D). Of 15 cells tested both ways, 14 were classified the same in both tests (10 as selective and 4 as non-selective); only one turned out to be selective in the equiluminant colour test but non-selective in the standard colour test. Thus, the ANOVA predicts the selectivity for equiluminant colours well. Tests with equiluminant colours can overestimate chromatic sensitivity because the luminance match may be inaccurate. This problem can be avoided by testing a range of intensity levels for each chromaticity (Gouras & Krüger, 1979). Because this method is time consuming, we chose to test each chromaticity at two intensity levels and measure both chromaticity and luminance effects. The resulting chromaticity effect is relatively insensitive to inaccuracies of the luminance measurement because it measures chromatic sensitivity in the presence of large intensity variations. Thus, the two-factor ANOVA method provides a more reliable assessment of chromatic sensitivity than a test with equiluminant colours. In the case of linearity it would be equivalent to the method of Gouras & Krüger (1979).
Figure 2. Measuring chromatic sensitivity with luminance-varying and equiluminant colour sets.
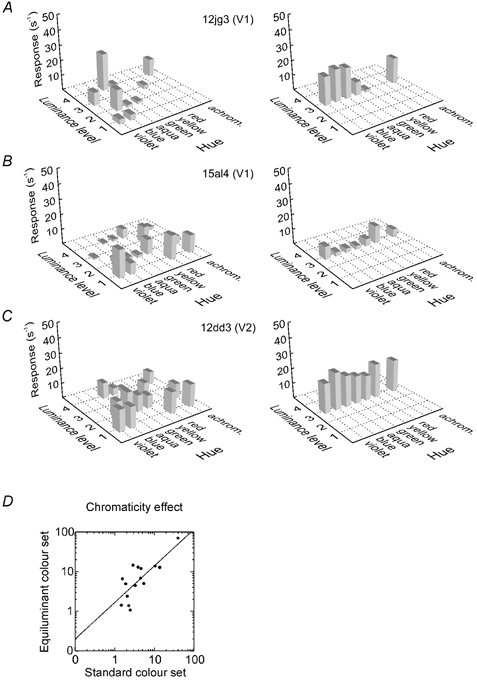
A–C, results from three example cells. The plots on the left show the responses (spikes s−1) to the standard set of 15 colours varying in hue and luminance. The plots on the right show the responses to a set of equiluminant colours. The bars represent the difference between on- and off-responses (only positive values are shown). A neutral background of 20 cd m−2 luminance was used with the standard set. The equiluminant colours were presented with the same background for the cells in B and C, but with a dim background (2.5 cd m−2) for the cell in A, to match the contrast preferences of the cells. Analysis of variance showed significant chromaticity effects for the standard set in the cells in A and B, but not in the cell in C. The graphs show that the equiluminant colours produce corresponding variations of responses in A and B, but little variation in C. The standard set also reveals brightness selectivity: the cell in A is selective for bright colours, responding to aqua at luminance level 4, but not at level 2, and to blue at level 2, but not at level 1. The cell in B prefers dark colours, responding to violet at level 1, but not at level 3, etc. The brightness selectivity is also apparent in the responses to achromatic colours: the cell in A responds to white, but not to grey and black; that in B responds to black, but not to grey and white. D, scatterplot of the F values associated with chromatic variation in the two colour tests in single cells. The results are correlated (Spearman ρ= 0.71), indicating that chromatic sensitivity is measured similarly by the two tests.
Inspection of the colour test data indicated that using the strength of the chromaticity effect may not be the best way of measuring colour selectivity because some cells that responded to about half of the 15 colours showed equally strong chromaticity effects as cells that responded to only one or two colours. Also, some cells with a relatively small modulation of responses had highly significant chromaticity effects because of high firing rates and low variability of responses. When listening to the responses during the experiment these cells would not stand out as particularly colour selective. To capture colour selectivity in a more intuitive way, we calculated a colour selectivity index that measures the sparseness of responses across the set of 15 colours (eqn (4)). This index would be 0.93 for a cell that responds to only one of the 15 colours, and zero for a cell that responds equally to all colours. The index measures selectivity for the hue as well as the brightness aspect. For example, a cell that responds only to brown would have a higher index than a cell that responds to red and brown. For the cells of Fig. 1A–D, the colour selectivity index values were 0.71, 0.86, 0.80 and 0.79, respectively. As can be seen from Fig. 6 below, selectivity indices of 0.80 and higher are not unusual. In the case of the cell illustrated in Fig. 1A, a high index is obtained because the calculation uses only the on-responses (see Methods). One could argue that on- and off-responses are intermixed under natural conditions, and to distinguish them requires additional information. If the on- and off-responses were averaged, the index for the cell in Fig. 1A would be lower. However, in the cells in Fig. 1B–D, the index characterizes the average firing rates because these cells produced no off-responses. These cells would allow colour discrimination for static and flashing stimuli even if only the average firing rates were used. The selectivity of these cells is remarkable.
Figure 6. Colour and orientation selectivity.
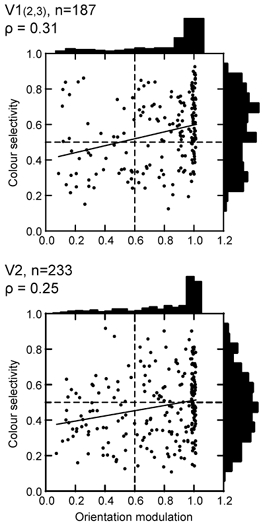
The colour selectivity index is plotted as a function of the orientation modulation index. Dashed lines show criterion values. Continuous lines represent least-square fits. Note that non-oriented colour cells (top left) and oriented non-colour cells (bottom right) are no more frequent than oriented colour and non-oriented non-colour cells (top right and bottom left, respectively). The vast majority of colour-coded cells are orientation selective (top right).
The preferred colours of the cells were distributed about evenly across the range of test colours, and highly selective cells were found for each colour. Preference for violet was about as frequent as preference for red or blue. Many cells were selective for combinations of hue and brightness. For example, the cell in Fig. 1B responded to aqua, but not to cyan, the dark version of the same hue, and that in C responded to beige, but not to yellow. Some cells responded to green, others to olive, more strongly than to any other colour. We also found cells that responded to grey, but much less to white and black or any chromatic colour.
For comparison with other studies we also calculated the ratio between the best chromatic colour response and the response to white (white index). If a cell receives colour-opponent inputs, the response to white should be weaker than the response to the preferred colour (Livingstone & Hubel, 1984; Burkhalter & Van Essen, 1986; Gegenfurtner et al. 1996; Tamura et al. 1996; Shipp & Zeki, 2002). Using the criterion of a white index > 1.4 (Gegenfurtner et al. 1996), we would classify 70 % of the upper-layer V1 cells and 68 % of the V2 cells as colour selective. These proportions are much higher than the ones based on the chromaticity effect (Table 1) and the estimates of those previous studies. One reason for this is that the white index criterion accepted a number of cells without significant chromaticity effect because they responded to black, grey, and other dark colours, but weakly or not at all to white. Such cells (and the converse, with light colour preference) were common in our experiments (we used a background luminance midway between the black and white test colours, whereas dim backgrounds were used in the other studies). Therefore, we also calculated the ratio between the best chromatic colour response and the maximum of the responses to black, white and grey. With the same criterion value (1.4), this index classified 50 % of cells in V1 and 46 % in V2 as colour selective, in good agreement with Gegenfurtner et al. (1996).
On- and off-responses. The cells illustrated in Fig. 1 also show an interesting difference in the time course of responses to the colour stimuli. The cell in Fig. 1A gave on-responses for yellow and beige, and off-responses for blue and aqua. This response pattern is known as opponent-colour coding (De Valois, 1965). Off-responses are usually taken as evidence for inhibition, and this cell would accordingly be classified as Y+B-. However, most colour-selective cells in our sample did not produce off-responses. The cells in Fig. 1B–D gave on-responses for some colours, but no off-responses for the corresponding opponent colours. For example, the cell in B responded best to aqua (blue-green), but gave simply no response to red, and the cells in C and D responded ‘on’ to red, but not ‘off’ to blue or green. These different response patterns are illustrated in the form of raster plots in Fig. 3. Figure 3A shows an example of a cell with on- and off-responses. In this cell, blue-green colours evoked on-responses, while brown, red, purple and violet produced off-responses, and it can be seen that the latter colours also caused suppression of activity about 60 ms after stimulus onset (compare with blank field response shown at the bottom). Figure 3B shows the responses of the cell illustrated in Fig. 1C. In this cell, red, brown and beige produced on-responses, but off-responses were virtually absent. Nevertheless, it is clear that blue-green light had a suppressive effect, because, when such light was added to red, producing white, the response was null. Thus, opponent-colour processing can be found in the absence of off-responses. The median ratio of off-response to on-response was 0.20 for neurons of upper-layer V1, and 0.25 for neurons of V2 (note some of this fraction is due to on-activity spilling over into the off-period; see Fig. 3). Thus, absence of off-responses as shown in Fig. 3B is the rule rather than the exception.
Figure 3. Raster plots of colour responses of two V2 cells.
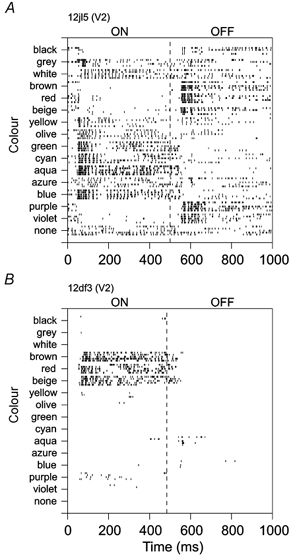
Both cells respond during the on-phase of stimuli of the preferred colours, but the cell in A also responds at the offset of stimuli of colours opponent to the preferred colours, whereas the cell in B does not produce off-responses at all. While the cell in A shows a classical pattern of colour opponency (green-on, red-off), colour opponency of the cell in B is evident from the fact that it responds to red, but not to white (which is the sum of red and aqua).
We have used the difference between on- and off-responses to compute the ANOVA, but only the on-responses for calculating the selectivity index. The first method should be the most sensitive in detecting opponent-colour mechanisms, while the second should be more relevant to perception, because colour perception is based on the activity during the presence of a stimulus rather than the activity that occurs after the stimulus is turned off.
Summary of classifications.Table 2 summarizes the classification of orientation, colour and edge selectivity in the two cortical areas. The table shows that in both areas about 80 % of the cells were strongly orientation selective. The frequency of colour-selective cells ranged between 44 and 64 % in upper-layer V1, depending on the criterion, and between 35 and 45 % in V2. The smaller proportion of colour-selective cells in V2 might reflect the fact that V2 also receives input from layer 4B of V1, which is non-chromatic (Livingstone & Hubel, 1987). The results of the two-factor analysis show that about three-quarters of the cells that were selective for chromaticity are also selective for the brightness aspect of the stimulus (62/79 in V1, 55/79 in V2). About 80 % of the cells were edge selective and about 40 % of these showed asymmetric edge responses as illustrated in Fig. 1D. Note that we used restrictive criteria for orientation and edge selectivity. Most of the non-oriented cells in this classification also had an orientation bias, and most of the ‘surface cells’ showed some edge enhancement.
Relationships between the three aspects of neural coding
Figure 1 shows that colour-selective cells can have a variety of spatial characteristics. They can be of ‘surface’ or ‘edge’ type (Fig. 1Aversus B–D), and, in the case of edge-type cells, they can be oriented or non-oriented (Fig. 1C–Dversus B). Furthermore, oriented edge-selective cells may respond either symmetrically to both sides of a square, as in Fig. 1C, or only to one side, as in Fig. 1D. We also found orientation-selective surface cells, that is, cells that show orientation tuning when tested with bars or edges, but nevertheless respond to uniform illumination of the receptive field (not illustrated). In the following, we examine the relationship between the three aspects of neural coding. To this end, we present scatter plots of the indices for each pair of selectivity features. We begin with orientation and edge selectivity.
Orientation and edge selectivity. We expected that these properties would be positively correlated because the typical simple and complex cells are both orientation- and edge selective, whereas cells that respond well to surface should be non-oriented. In Fig. 4 the orientation modulation index is plotted against the edge enhancement index. Each circle represents the measurements for one neuron. The two plots show the results from upper-layer V1 (top) and the pooled results from all layers of V2 (bottom). The distributions of each single variable are shown on the margins. Both plots show heavy clusters in the upper right quadrant, representing orientation- and edge-selective cells (72 % of V1 cells, 63 % of V2 cells). The other combinations of selectivity are more sparsely represented. The lower left quadrant represents non-oriented surface cells. These cells apparently have circular receptive fields that lack inhibitory surrounds. Non-oriented edge-selective cells appear in the lower right quadrant. This combination indicates concentric centre-surround organization. The occurrence of such cells in layers 2 and 3 of V1 is well known. The double-opponent cells, as defined by Livingstone & Hubel (1984), fall into this category. We also found oriented surface cells (upper left quadrant). These cells respond to uniform stimuli, but show orientation tuning when stimulated with bars or edges. The existence of oriented surface cells was unexpected. They seem to be rare in V1, but more common in V2. The plots show some positive correlation between orientation and edge selectivity, but it is weak (Spearman's ρ= 0.33 for upper-layer V1; 0.15 for V2). The reason why the correlations are so weak is the presence of non-oriented edge cells and oriented surface cells.
Figure 4. Orientation and edge selectivity in neurons of V1 (layers 2 and 3) and V2.
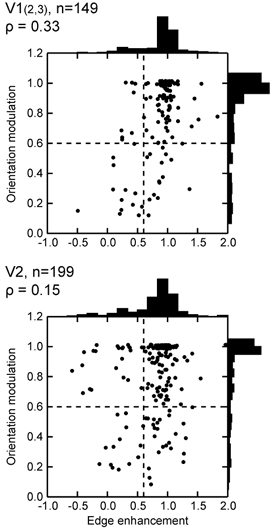
Orientation modulation index and edge enhancement index are plotted for each cell. An index of 0 for edge enhancement means edge response = surface response, a value of 1 indicates no surface response, negative values indicate edge response < surface response, values greater than 1 indicate negative surface response (centre response < surround response). Dashed lines show criterion values. In this and subsequent figures, ρ is Spearman's rank correlation coefficient and n is the number of cells. In V1, but not in V2, orientation-selective cells tend to be more edge-selective than non-oriented cells.
Colour and orientation selectivity. Some previous studies (Zeki, 1983; Livingstone & Hubel, 1984; Hubel & Livingstone, 1987) suggested that non-oriented cells tend to be more colour selective than oriented cells, and that the non-oriented cells serve colour vision, while the oriented cells support form perception. We examined the relationship between colour and orientation tuning first by means of the chromaticity effect determined by ANOVA, and then with the colour selectivity index.
In Fig. 5, the F values of the chromaticity effect are plotted against the orientation modulation index. It can be seen that the strength of the chromaticity effect varied widely between cells, with a continuous distribution. The distributions of the orientation modulation index show narrow peaks at 1, representing cells that were completely shut off at non-preferred orientations. Cells to the right of the dashed line are orientation selective by our criterion. The scatter plots show that there is virtually no correlation between colour and orientation sensitivity (Spearman's ρ=−0.18 for V1; −0.09 for V2). Filled symbols indicate cells with significant chromaticity effect (P < 0.01). It can be seen that the majority of colour-sensitive cells were orientation selective (106/146 = 73 %) and their proportion in V2 (74 %) was similar to that in V1 (71 %).
Figure 5. Colour and orientation selectivity.
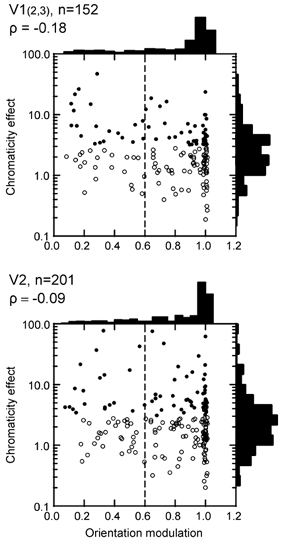
The F value of the effect of stimulus chromaticity in a two-factor ANOVA is plotted as a function of the orientation modulation index. An F value of 10, for example, means that the response variance produced by changes of stimulus chromaticity was 10 times greater than the variance of repeated presentation. Filled symbols indicate significant chromaticity effect (P < 0.01). Chromatic selectivity is not higher for non-oriented (left of dashed line) than oriented cells (right of dashed line). The vast majority of chromatic cells are orientation selective.
Since the chromaticity effect measured by ANOVA might not capture the degree of colour selectivity very well, we also calculated a colour selectivity index, as explained above. This index was only weakly correlated with the effects measured by ANOVA (ρ= 0.31 for chromaticity, 0.36 for luminance, n = 405), which is to be expected, because the selectivity index measures the narrowness of tuning in colour space, whereas the ANOVA measures the strength of response modulation. The resulting scatter plots are shown in Fig. 6. Again, we found practically no correlation between colour and orientation selectivity. Statistically, there is now a small positive coefficient of correlation (ρ= 0.31 for V1; 0.25 for V2), whereas the colour-form separation hypothesis would predict a negative correlation. Many of the oriented cells were highly selective for colour. If chromatic information were used merely for the definition of contours, then the system would combine the various chromatic edge signals successively to produce a robust contour signal (‘universal colour cells’; Krüger & Gouras, 1980). In this case, we would expect to see colour selectivity of oriented cells dramatically reduced in V2. However, this was not the case. The slopes of the regression lines indicate that colour selectivity is slightly higher in the oriented than the non-oriented population, in V1 as well as in V2. Thus, we see that the cortex maintains oriented colour signals up to the level of area V2.
Are colour-selective cells less sharply tuned for orientation than non-colour-selective cells?Figure 7 shows the joint distribution of colour selectivity index and width of orientation tuning for orientation-selective cells (modulation > 0.6). It can be seen that colour-selective cells were often sharply tuned for orientation. Tuning curves with 30 deg full width at half-amplitude were not unusual, and the width of tuning did not vary with the degree of colour selectivity. The median width was 45 deg (range 10–200 deg) in V1 and 48 deg (range 15–150 deg) in V2. The result was the same when colour sensitivity was measured by the ANOVA method.
Figure 7. Colour and orientation selectivity.
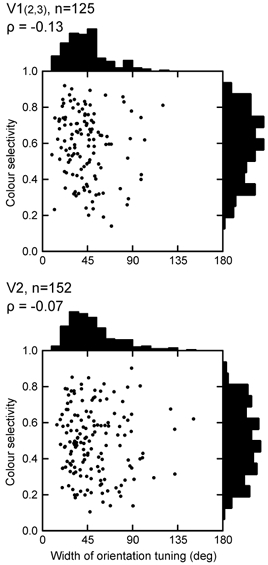
The colour selectivity index is plotted as a function of the width of orientation tuning. Colour-selective cells show the same widths of orientation tuning as non-colour-selective cells.
We also used the white index to check whether colour selectivity was negatively correlated with orientation tuning. This index showed no correlation with the orientation modulation index (ρ= 0.17 for V1; 0.05 for V2) or the width of orientation tuning (ρ= 0.06 for V1; 0.02 for V2). Nor was the ratio between the best chromatic and achromatic responses correlated with the orientation modulation index (ρ=−0.04 for V1; −0.06 for V2) or the width of orientation tuning (ρ= 0.11 for V1; 0.14 for V2).
The results presented in Figs 5–7 show that, for all practical purposes, colour and orientation selectivity are orthogonal dimensions of neural coding. The vast majority of colour-coded cells are orientation selective, suggesting that orientation-selective signals play a role not only in form perception, but also in the definition of object colour.
Colour and edge selectivity.Figure 8 shows the relationship between colour selectivity and edge enhancement. One might think that colour-selective cells should respond to the surface of the square because colour is a surface quality, but this was not the case. Colour-selective cells were distributed between surface and edge type just as non-colour-selective cells, the vast majority being edge selective. Thus, colour information is concentrated in the border signals. However, contrary to generalizing statements made in the literature, cells responding to uniform colour also exist. Their proportion was about 20 %, and this did not vary between upper-layer V1 and V2, suggesting that cells of this type are still required at later stages and may have a specific function in colour vision.
Figure 8. Colour and edge selectivity.
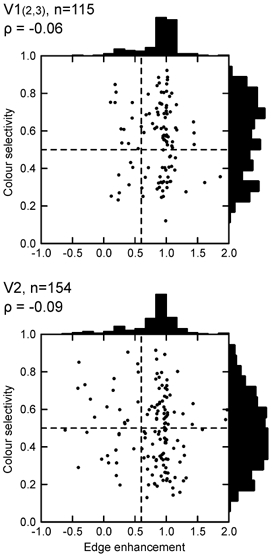
The colour selectivity index is plotted as a function of the edge enhancement index. Dashed lines show criterion values. Colour selectivity is equally frequent among ‘surface cells’ (left of criterion line) and ‘edge cells’ (right of criterion line).
Finally, we analyse the relationship between colour coding and the asymmetry of edge responses. As illustrated above (Fig. 1), some of the orientation-selective cells responded equally to both of the optimally oriented edges of the square, while others only responded to one of them. In Fig. 9, we have plotted colour selectivity against the asymmetry index. Asymmetry of edge responses was relatively common: in 44 % of the cells of V1, and 41 % of the cells of V2, the two edge responses differed by more than a factor of two (asymmetry index > 0.33). Figure 9 shows that cells with asymmetric responses tend to be more colour selective (slope of regression, 0.23 for V1, 0.24 for V2, P < 0.001 for both).
Figure 9. Colour selectivity and asymmetry of edge responses.
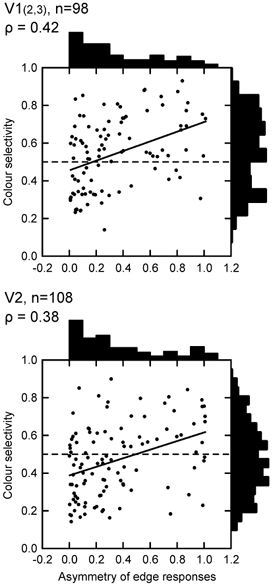
The colour selectivity index is plotted as a function of the edge asymmetry index. Continuous lines represent least-square fits. Cells with asymmetric edge responses tend to be more colour selective.
Effects of retinal eccentricity
We wondered whether the absence of a correlation between colour and orientation selectivity in our data was specific for a certain eccentricity of receptive fields. It has been suggested that the proportions of orientation- and colour-selective cells change with retinal eccentricity. Colour-selective cells were found to be concentrated in the fovea, and less frequent at increasing eccentricities, while the opposite trend was found for orientation selectivity (Zeki, 1983). Livingstone & Hubel (1984) also found a higher frequency of non-oriented cells in the fovea (36 %) than in the periphery (20 % at 6–10 deg).
In Fig. 10, our data on chromatic sensitivity are plotted as a function of retinal eccentricity. The flat regression lines indicate that chromatic sensitivity is independent of eccentricity. We computed, for each area, the linear regressions on retinal eccentricity of five parameters: orientation modulation index, width of orientation tuning, log chromaticity effect, colour selectivity index and edge enhancement index. None of the ten indices showed a significant dependence on eccentricity (all P values > 0.09, number of cells between 172 and 379). We conclude that orientation tuning, colour selectivity and the degree of edge selectivity do not depend on eccentricity in the range studied.
Figure 10. The dependence of colour selectivity on retinal eccentricity.
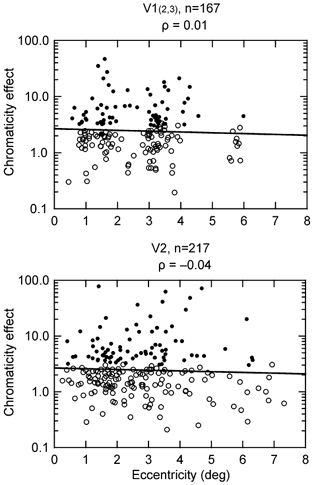
The F value of the effect of stimulus chromaticity in a two-factor ANOVA is plotted as a function of the distance of receptive fields from the fovea. Filled symbols indicate significant chromaticity effect (P < 0.01). Continuous lines represent linear regression fits. Chromatic sensitivity does not depend on retinal eccentricity.
Comparison of our results from V1 with those of the cited studies shows that the main discrepancy lies in the foveal sample (eccentricity < 2.5 deg), where Livingstone & Hubel (1984) find 36 %, and Zeki (1983) more than 50 % of non-oriented cells, whereas we find only 23 % of cells with poor orientation selectivity (cells with a ratio of best to worst response less than 4). In V2, only 18 % of the foveal cells fall into this category.
Summary of three-way classification
The main results of our analysis of neuronal selectivity are summarized in Fig. 11. This figure is a graphical representation of a three-way contingency table. Each partition of the cube corresponds to a category of classification in terms of orientation, colour and edge selectivity, according to the above criteria, volume representing the relative frequency of cells. The shading represents increasing degree of selectivity, from white, for non-oriented, non-colour-selective surface cells, to dark grey, for orientation-, colour- and edge-selective cells. Illustrated are the data of upper-layer V1. For colour, we use here the selectivity index, which makes the top portion 64 % of the total volume. Had we used instead the criterion of significant chromaticity effect, this portion would be 44 %.
Figure 11. Schematic representation of the contingencies of colour-, orientation- and edge selectivity for layers 2 and 3 of V1.
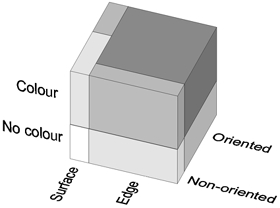
The number of cells with each combination of selectivity is represented by the volumes of the compartments of the contingency cube. Darker shading indicates higher selectivity. The darkest block, for example, represents orientation- and edge-selective colour cells (46 % of the total number); the medium grey block at the front top right represents non-oriented edge-selective colour cells (10 %). Note that the top and bottom parts of the cube have the same ground plan, that is, the relative frequencies of the four combinations of orientation- and edge selectivity are the same for colour-coded and non-colour-coded cells. The result for V2 was similar except for a slightly lower incidence of colour selectivity. This ‘factorial’ scheme of representation is contrary to previous reports suggesting that the visual cortex strives to separate colour and form information.
The principal finding is that the occurrence of colour selectivity is virtually independent of either orientation or edge selectivity. Consequently, the cube consists of four vertical columns whose cross-sections can be seen at the top of the cube. The cross-sections do not change between the top and bottom part. Only the ground plan of the cube shows deviation from independence: only a small fraction of the edge cells is non-oriented (compare front right to rear right), whereas surface cells are mostly non-oriented (compare front left to rear left); oriented surface cells are rare (rear left, 7 % of the total).
The predominance of oriented edge-selective cells among both colour and non-colour cells (rear right, 72 %) is remarkable. The large dark block represents oriented edge-selective colour cells (46 %, see examples in Fig. 1C and D). The medium-grey slab at the front represents non-oriented cells that are colour selective, but do not respond to a large colour surface (10 %, e.g. Fig.1B). Many of the cells in this group would be ‘double-opponent cells’ according to the criteria of Livingstone & Hubel (1984), that is, they ‘respond poorly or not at all to white light in any form, or to diffuse light at any wavelength’. However, many of the oriented edge-selective colour cells (dark block) would also meet these criteria (cf. Johnson et al. 2001).
The picture for area V2 would be quite similar to that of upper-layer V1, with a slightly smaller volume of colour cells (probably reflecting the fact that V2 also receives input from layer 4B of V1).
Spatial profile of population response
Our results indicate that colour signals are concentrated in cells representing the figure edges. As exemplified in Fig. 1, edge-selective cells show almost no activity for the centre of the figure, while cells with strong surface responses, such as that illustrated in Fig. 1A, are rare (see Fig. 8). To visualize the distribution of colour signals of the cortical population we derived a spatial profile across the representation of a 4 deg square figure. Since edge enhancement and orientation selectivity were found to be independent of the colour-coding property, the data of colour and non-colour cells were combined. The position-response curves were normalized by their maximum and averaged separately for oriented and non-oriented cells (Fig. 12, top and middle graphs). We ignore here the variation of receptive field size and cortical magnification factor with eccentricity. It can be seen that the signals of oriented cells are confined to the vicinity of edges. The peaks of responses have different widths for V1 and V2, reflecting the different average size of receptive fields in the two areas. Of course, fixational eye movements also contributed to the widths of the peaks. Non-oriented cells provide some amount of surface activity, but their responses are also enhanced at the edges by a factor of three. This is because the majority of non-oriented cells are edge selective. Thus, cortical non-oriented cells differ markedly from opponent-colour cells of the LGN which would respond best to the uniform centre of the figure (De Valois et al. 1977; Derrington et al. 1984). We do not see peaks of activity in the centre of the profiles, as was found for the representation of textured figures (Lee et al. 1998).
Figure 12. Spatial profiles of the population responses to squares of 4 deg size.

Average normalized response profiles of 78 V1 neurons (layers 2 and 3) and 42 V2 neurons. Top, orientation-selective cells; middle, non-oriented cells; bottom, combined activity of oriented (filled) and non-oriented (dotted) cells. Baseline activity has been subtracted (∼10 % of peak for oriented, 17 % for non-oriented cells). See Results for explanation.
Since non-oriented cells are five times less frequent than oriented cells, it might seem that the representation of the figure centre is quite scarce. However, we have to bear in mind that the profile for oriented cells shows the activity of those cells whose preferred orientation matches the orientation of the square, which is only a fraction of the oriented cells, whereas the profile for non-oriented cells represents the average activity. Therefore, we have combined the two profiles with different weights (Fig. 12, bottom). The weighting accounts for the different frequency of oriented and non-oriented cells, and for the fact that all non-oriented cells, but only a fraction of oriented cells, are activated for any given orientation of the stimulus.
The ratio of oriented to non-oriented cells was 4.7 for upper-layer V1 and 4.0 for V2. The mean response profile for oriented cells was scaled up by this factor. The mean width of the orientation tuning at half-amplitude was 44 deg for V1 and 51 deg for V2, which means that a fraction of approximately 44/180 = 0.24 of the V1 cells, and 51/180 = 0.28 of the V2 cells, were active on average for a given edge orientation. The profile for oriented cells was scaled down correspondingly. Note that the profile for oriented cells is also reduced because many of them respond differently to the two sides of the square. Both sides were averaged for Fig. 12, making the curves symmetrical. Our calculation ignores the fact that many cells in the ‘non-oriented’ category have an orientation bias.
The combined profiles show that colour signals are 5–6 times stronger on the edges than in the centre of the figure.
DISCUSSION
We examined the representation of uniform colour figures in the visual cortex of alert macaque monkeys. Cells recorded from layers 2 and 3 of V1 and from V2 were characterized according to their colour selectivity, orientation selectivity, and the degree to which they responded to surface and edges of the figures. About 80 % of the cells in both areas were found to be strongly orientation selective, and a similar percentage of cells were edge selective. The percentage of colour-selective cells ranged between 44 and 64 % in upper-layer V1, and between 35 and 45 % in V2, depending on the criterion. There was no indication of non-oriented cells being more frequently colour coded than oriented cells. Rather, the degree of colour selectivity was virtually independent of either orientation or edge selectivity, as summarized in Fig. 11. This means that the vast majority of colour-coded cells are orientation- and edge selective. Also, many of the orientation-selective cells in both areas respond asymmetrically to the two opposite sides of a square figure, representing information about polarity of contrast and border ownership (Zhou et al. 2000). This asymmetry is stronger in colour-selective than non-colour-selective cells. Spatial profiles of the population activity across the representation of a 4 deg square show that colour signals are concentrated at the edges of the figure.
Colour coding
We have used two principal measures to characterize colour coding: the effect of stimulus chromaticity, as assessed by a linear model, and an index of colour selectivity. The linear model (two-factor ANOVA) measures the effect of chromaticity in the responses to independent variation of chromaticity and luminance. We show that this method measures the ability of neurons to differentiate equiluminant colours, which has often been used as a criterion for neural colour selectivity (Gouras & Krüger, 1979; Thorell et al. 1984). Since differentiation of equiluminant colours depends on differential L and M cone processing and/or the presence of S cone input, this method reflects the characteristics of the cone input to the neuron.
The colour selectivity index measures the sparseness of neuronal responses in three-dimensional colour space. The colour selectivity of cortical neurons can be defined by the dominant wavelength of light as well as its relative intensity and saturation. We found many cells that were sensitive to spectral composition and luminance contrast (Thorell et al. 1984; Yoshioka et al. 1996; Johnson et al. 2001), and cells that responded selectively to desaturated and achromatic colours, such as grey (Komatsu et al. 1992; Hanazawa et al. 1997). Some neurons responded only to one or two of the 15 test colours. Thus, relatively small volumes of colour space are explicitly represented. This selectivity is reminiscent of the tuning of neurons in the inferior temporal cortex which often show islands of activation in the chromaticity plane (Komatsu et al. 1992). Such selectivity is incompatible with models based on linear summation of the cone signals which describe the colour representation at lower levels, and therefore indicates an additional non-linear transformation of colour signals (Komatsu, 1998).
The preferred colours were diverse and covered the whole range of chromaticities and luminances about evenly. As was observed previously, cortical cells do not cluster in clearly defined chromatic groups like LGN cells (Lennie et al. 1990). The high selectivity of many cortical neurons in our data suggests that these are related to the task of colour identification (see also Vautin & Dow, 1985; Boynton & Olson, 1990; Yoshioka et al. 1996). However, there was no suggestion that the so-called ‘pure colours’ were represented more often than other colours. For example, violet was the preferred colour as frequently as red or blue (which is remarkable also because violet was nearly equiluminant with the background, whereas red and blue had luminance contrast). One would need a denser grid of test colours to see if there is a pattern in the distribution of preferred colours.
We have measured colour selectivity with flashing bars in order to facilitate comparison with previous studies. We believe that the results from the on-responses to flashing stimuli are not much different from those that would be obtained with static stimuli (which is the more natural condition), because the responses were generally sustained (Fig. 3), and we have verified that the strength of the on-response to flashing stimuli generally correlates well with the mean firing rate during static presentation. Another question is whether colour selectivity depends on the geometry of the test stimulus. We have the impression that bars and edges (of the preferred polarity) generally produce similar results. Comparison of both stimuli in seven cells showed no major differences. However, the question of separability of chromatic and spatial mechanisms is a complex problem (Thorell et al. 1984; Lennie et al. 1990; Johnson et al. 2001), which is related to perceptual phenomena such as colour induction and colour assimilation. Thus, the question of interaction of spectral and spatial variables needs further investigation.
On- and off-responses. We found that colour-selective cells often do not produce a response at the offset of a flashing stimulus. The dynamics of the onset response have been studied systematically (Cottaris & De Valois, 1998), but the absence of off-responses has only been mentioned occasionally (Livingstone & Hubel, 1984). It has been proposed that studies of cortical colour coding should be limited to cells that show explicit opponency, meaning cells that produce onset responses to one colour, and offset responses to the opponent colour (Conway, 2001). We disagree with this view. It is based on the assumption that the suppressive effect of a light is equal in magnitude but opposite in sign to the excitation produced by the removal of that light. This may be the rule in cells of the afferent pathways, but is generally not true in the cortex. As shown in the examples of Fig. 1 and Fig. 3, parts of the spectrum can have strong suppressive effects resulting in complete cancellation of the activation by other wavelengths, without giving rise to off-responses. We find that the absence of off-responses is the rule in colour-selective cells of layers 2 and 3 of V1 and area V2. In the end, it must be the activity evoked by the presence of the stimulus that produces the perception of colour, because this perception does not depend on the stimulus being turned off. The functional significance of the off-responses remains unclear.
Coding of colour and form
The absence of correlation between colour and orientation tuning in our data from behaving monkeys agrees with recent studies in anaesthetized monkeys (V1: Leventhal et al. 1995; V2: Gegenfurtner et al. 1996), but disagrees with earlier studies (also in anaesthetized monkeys) that found negative correlation between colour selectivity and orientation tuning (V1: Livingstone & Hubel, 1984; V2: DeYoe & Van Essen, 1985; Hubel & Livingstone, 1987). Zeki (1983) and Yoshioka & Dow (1996) also found this negative correlation in V1, but their data are not comparable because they include the granular layers which contain high proportions of non-oriented colour-selective cells. The reason for the disagreement is not entirely clear. However, it seems that the problem is not the classification of colour coding, but the assessment of orientation selectivity. We have used three different methods of measuring colour selectivity and each of them shows that orientation and colour selectivity are independent. Furthermore, despite different methods and criteria, most studies found proportions of colour-selective cells of about 40–50 % for foveal V1: 49 % (oriented and non-oriented pooled) in Livingstone & Hubel (1984), versus 44 % in this study (ANOVA criterion). Leventhal et al. (1995) did not classify, but their Fig. 10 shows that about 48 % of cells have best-colour to opponent-colour response ratios of 2 or greater. In V2, Gegenfurtner et al. (1996) classified 50 % of the cells to be colour selective, Shipp & Zeki (2002) 39 %, and this study 35 % (ANOVA criterion). DeYoe & Van Essen (1985) found colour selectivity in 39 % of the multi-unit recording sites in V2. Hubel & Livingstone (1987) did not assess colour selectivity for oriented cells. The results on orientation tuning are more diverse. Peterhans & von der Heydt (1993), Leventhal et al. (1995), Gegenfurtner et al. (1996), Shipp & Zeki (2002), and the present study all found about 20 % of non-oriented and weakly oriented cells, whereas Livingstone & Hubel (1984) found 36 % non-oriented cells in the foveal sample of upper-layer V1. DeYoe & Van Essen (1985) classified 59 % of the multi-unit recording sites in V2 to be non-oriented. This is not a matter of criterion, because the former studies used more restrictive criteria than the latter. Thus, an underestimation of orientation selectivity in the latter studies could be at the root of the disagreement. The discrepancies might be due to different recording techniques (anaesthesia, single versus multi-unit recording) and biased sampling. Nothing in our data suggests that colour or orientation selectivity depends on retinal eccentricity.
The question of whether there is anatomical separation of colour and non-colour cells has received much attention and often overshadowed the question of segregation of function (Livingstone & Hubel, 1984; DeYoe & Van Essen, 1985; Shipp & Zeki, 1985; Hubel & Livingstone, 1987; Shipp & Zeki, 2002). We have ignored the anatomical issue in the present study. For understanding the function of the visual cortex the question of whether colour and orientation are represented by the same cells or by different cells is more important than the question of anatomical separation, because segregation of function would be possible even with anatomically intermingled populations. If the CO blobs of V1 and the thin CO stripes of V2 contained in fact a high proportion of colour-coded non-oriented cells, as proposed (Livingstone & Hubel, 1984; DeYoe & Van Essen, 1985; Hubel & Livingstone, 1987; Shipp & Zeki, 2002; but see Levitt et al. 1994; Leventhal et al. 1995; Gegenfurtner et al. 1996), then our results would imply that non-oriented cells outside these regions are more often achromatic (to explain the overall correlation of zero).
Despite evidence to the contrary, the assumption that colour and form are processed separately early on in the cortex is still widely accepted as true. Our results indicate the opposite, namely that colour and form (i.e. location and orientation of edges) are orthogonal dimensions of coding, that is, the various degrees of orientation and edge selectivity are crossed with all the variants of colour selectivity. This is the picture that emerges in striate layers 2 and 3, the main output layers of V1. The picture is quite similar in V2, indicating that the principles of coding for colour and form are not changed, and that the further processing is based on the feature representation established in V1.
To appreciate the significance of this feature of cortical engineering, it should be remembered that chromatic and spatial information are not processed as independent dimensions in the retina; here visual information is funnelled into magno and parvo channels, the spatio-temporal characteristics of the non-chromatic magno channel being different from those of the chromatic parvo channel. Also, up to the level of the LGN, the colour-opponent centre-surround receptive field structure predominates, which means that luminance information is filtered through spatial band-pass channels, while the chromatic information is transmitted through low-pass channels (De Valois et al. 1977; Derrington et al. 1984). The theoretical reason for this design is optimization of the transmission of colour and luminance information from the eye to the cortex. The signature of this coding scheme can still be found in V1: the average V1 cell shows less low-frequency attenuation for colour- than for luminance-varying gratings (Thorell et al. 1984). By contrast, the lack of a correlation between colour and edge selectivity in our data suggests that, in layers 2 and 3, there is little difference in low-frequency attenuation between colour- and non-colour-selective cells. Thus, layer 2 and 3 cells might differ in this respect from the average V1 cell. (Note, however, that we did not compare chromatic and achromatic stimuli in the same cells as did Thorell et al. 1984.) The orientation tuning of V1 neurons is similar for colour- and luminance-varying stimuli (Elfar & De Valois, 1991; Johnson et al. 2001), and the same is true for V2 (Kiper et al. 1997).
Taken together, these findings suggest that the cortical mechanisms of orientation and edge selectivity process chromatic and non-chromatic signals in exactly the same way. The result is that orientation selectivity is independent of colour, while edge selectivity (low-frequency attenuation) may still reflect the difference inherited from the chromatic and non-chromatic peripheral channels, but this difference disappears as signals reach the main output layers of V1, and V2, where the vast majority of cells become strongly edge selective for luminance and colour patterns. Thus, the factorial representation of colour and border information shown in Fig. 11 appears as a purposeful design that ensures that colour information is carried along with form information. Ultimately, this design enables us to perceive colour and form as independent qualities of objects. If colour and form information were represented in separate maps at this level, special mechanisms would be needed to ‘bind’ these attributes together for a given object. However, such maps apparently do not exist in the monkey visual cortex. Recent studies of the extrastriate areas consistently indicate that neural signals all along the ventral stream carry both colour and form information (Desimone et al. 1985; Tanaka et al. 1991; Komatsu & Ideura, 1993; Levitt et al. 1994; Gegenfurtner et al. 1996; Kiper et al. 1997). Specifically, factorial representation of colour and form has been found in inferior temporal cortex (Komatsu & Ideura, 1993).
Colour and form are often cited in theoretical studies as the prime example for demonstrating the necessity of feature-binding mechanisms in perceptual systems. It is time to recognize that early physiological reports were misleading. This is not to say that the binding problem does not exist. Certainly, a theory is needed to explain how objects are represented in our brain, so that we can independently refer to either their colour, or their form, and search for an object of a given colour, or an object of a given shape, etc. Feature binding and object categorization remain important theoretical problems, but a binding problem does not exist for the representation of colour and orientation in the visual cortex.
Computing surface colour from edge signals
As shown in Fig. 12, cortical colour signals are 5–6 times stronger on the borders than in the uniform centre of a colour figure. Figure 12 should not be interpreted as suggesting an isomorphic (image-like) representation in the cortex. Information about the form of the figure is encoded not only in the distribution of activity across the retinotopic position, but also in the distribution of activity along the orientation dimension. Similarly, the sharpness of the figure edges is probably represented not so much by the shape of the response profiles of Fig. 12, but encoded in the distribution of activity along the spatial frequency dimension (Thorell et al. 1984; Johnson et al. 2001). Thus, each small patch of the image is represented by an assembly of cells that are selective in a multi-dimensional feature space. These cell assemblies can be compared to the feature vectors used in computer vision (cf. Shi & Malik, 2000). Our finding that colour information resides mostly in the activity of oriented cells indicates that surface colour is also encoded in this manner.
The use of edge signals in representing surface colour poses some interesting questions. Theoretical studies postulate that colour is computed from signals generated at contrast borders (Gerrits & Vendrik, 1970; Land & McCann, 1971; Cohen & Grossberg, 1984) since retinal image stabilization experiments have shown the importance of border activity. In addition, border signals reflect contrast rather than absolute light intensity, which is important for modelling colour constancy. It has been proposed that concentric double-opponent cells provide those contrast border signals needed for the computation of surface colour and brightness (Cohen & Grossberg, 1984; Livingstone & Hubel, 1984). However, neurons with concentric receptive fields (or any even symmetrical operator) lack information about the direction of contrast. Such neurons would be activated equally by a red figure on a grey background as by a grey figure on a red background, the only difference being the exact spatial distribution of activity relative to the figure borders; for the red figure, the activity of red-selective cells would peak along the inner side of the contour, for the grey figure, along the outer side of the contour. Thus, an additional stage of processing is needed to determine whether the figure is red or grey. In the filling-in model of Cohen & Grossberg (1984) this is achieved by postulating that the colour border signals interact with a ‘contour boundary system’, which defines the boundaries for the lateral spreading of colour signals. In one case, the ‘red’ signals would spread towards the inner of the figure and gradually fill it up, in the other case, the ‘red’ signals would spread outwards and decay, while the ‘grey’ signals would fill up the figure.
We propose that object colour is derived from orientation-specific signals rather than the responses of concentric double-opponent cells. Many oriented cells are selective for edge polarity (Fig. 9; see also Zhou et al. 2000), which eliminates the ambiguity about the side of the colour and greatly simplifies further computations. Table 2 and Fig. 9 of the present paper and Fig. 18 of Zhou et al. (2000) show that contrast polarity-sensitive cells are equally frequent in V2 as in upper-layer V1. Thus, this feature is not limited to the initial stages of cortical processing such as the simple cells of V1.
The unresponsiveness of edge-selective cells to diffuse light indicates spatial antagonism in the receptive field. In the case of polarity-selective edge cells, this antagonism must be spatially asymmetric. We have only measured the colour selectivity of the excitatory part, and further studies will have to clarify the colour selectivity of the suppressive influence. To produce colour and brightness constancy, it should have a similar selectivity to the excitatory input. Such a double-opponent structure has indeed been demonstrated in receptive fields of V1 simple cells (Poggio et al. 1975; Michael, 1978a; Thorell et al. 1984; Conway, 2001; Johnson et al. 2001). Whether the spatial antagonism in complex cells of V2 and upper-layer V1 is also colour opponent, and whether these mechanisms can account for colour constancy remains to be seen.
The apparent neglect of cortical neurons for the interior of a colour figure contradicts the intuitive concept of brightness and colour as surface qualities (Hubel, 1988). However, our results show that this neglect is not total. Although surface responses tend to be rare and weak, they have a relatively high weight because they are not conditional on the orientation of a contrast border like the responses of most edge-selective cells (Fig. 12). The surface responses might be an inheritance from the LGN and simply reflect incomplete surface suppression at the cortical level. Alternatively, they might be the result of the hypothetical ‘filling-in’ process that has been postulated to account for the perceptual uniformity of colour stimuli and the colour changes perceived under retinal image stabilization (Walls, 1954; Gerrits et al. 1966; Yarbus, 1967; Pessoa et al. 1998). The results of the present study leave open which of these alternatives is true. The crucial experiment is to monitor the activity during perceptual filling-in. Komatsu et al. (2000) show that some cells in the representation of the blind spot in V1 display filling-in activity. Our results on filling-in under steady fixation indicate that the colour surface signals of V1 and V2 remain unaltered when the perceptual colour change occurs, whereas the responses of polarity-selective edge cells show a steady decay with a time course that could explain the delayed perception of filling-in (von der Heydt et al. 2003). These results contradict the neural filling-in hypothesis and suggest that the system computes surface colour from oriented edge signals. This hypothesis is further supported by the recent discovery of border ownership coding, specifically the observation that many edge-selective neurons of V2 are figure-ground sensitive and signal the colour on the figure side of the edge (Zhou et al. 2000).
Conclusion
The present results provide a detailed picture of the representation of uniform colour figures in the visual cortex as it emerges in the awake monkey brain when the eyes fixate on a static display. In the main output layers of V1, as well as in V2, the spatial characteristics of orientation and edge selectivity are the same for colour and non-colour cells. Form and colour are largely encoded in the responses of the same neurons. When figures are greater than the size of the receptive fields, colour information is concentrated in the edge signals. At the level of V2, edge-selective cells code for orientation, colour, edge contrast polarity, and border ownership, suggesting that the system derives surface colour from oriented edge signals.
Acknowledgments
We wish to thank Ofelia Garalde for technical assistance, Keiko Endo for help with data analysis, and Gian F. Poggio for critical comments on the manuscript. We acknowledge the use of an experimental setup and software developed by G. F. Poggio. This work was supported by National Institutes of Health grant EY02966 and Human Frontier Science Program grant RG-31. H.S.F. was supported by the Whitaker Foundation.
references
- Boynton RM, Olson CX. Locating basic colors in the OSA space. Color Res Appl. 1987;12:94–105. [Google Scholar]
- Boynton RM, Olson CX. Salience of chromatic basic color terms confirmed by 3 measures. Vision Res. 1990;30:1311–1317. doi: 10.1016/0042-6989(90)90005-6. [DOI] [PubMed] [Google Scholar]
- Burkhalter A, Van Essen DC. Processing of color, form and disparity information in visual areas VP and V2 of ventral extrastriate cortex in the macaque monkey. J Neurosci. 1986;6:2327–2351. doi: 10.1523/JNEUROSCI.06-08-02327.1986. [DOI] [PMC free article] [PubMed] [Google Scholar]
- Cohen MA, Grossberg S. Neural dynamics of brightness perception: features, boundaries, diffusion, and resonance. Percept Psychophys. 1984;36:428–456. doi: 10.3758/bf03207497. [DOI] [PubMed] [Google Scholar]
- Conway BR. Spatial structure of cone inputs to color cells in alert macaque primary visual cortex (V-1) J Neurosci. 2001;21:2768–2783. doi: 10.1523/JNEUROSCI.21-08-02768.2001. [DOI] [PMC free article] [PubMed] [Google Scholar]
- Cottaris NP, De Valois RL. Temporal dynamics of chromatic tuning in macaque primary visual cortex. Nature. 1998;395:896–900. doi: 10.1038/27666. [DOI] [PubMed] [Google Scholar]
- Derrington AM, Krauskopf J, Lennie P. Chromatic mechanisms in lateral geniculate nucleus of macaque. J Physiol. 1984;357:241–265. doi: 10.1113/jphysiol.1984.sp015499. [DOI] [PMC free article] [PubMed] [Google Scholar]
- Desimone R, Schein SJ, Moran J, Ungerleider LG. Contour, color and shape analysis beyond the striate cortex. Vision Res. 1985;25:441–452. doi: 10.1016/0042-6989(85)90069-0. [DOI] [PubMed] [Google Scholar]
- De Valois RL. Analysis and coding of color vision in the primate visual system. Cold Spring Harb Symp Quant Biol. 1965;30:567–579. doi: 10.1101/sqb.1965.030.01.055. [DOI] [PubMed] [Google Scholar]
- De Valois RL, Pease PL. Contours and contrast: responses of macaque lateral geniculate cells to color and luminance figures. Science. 1971;171:694–696. doi: 10.1126/science.171.3972.694. [DOI] [PubMed] [Google Scholar]
- De Valois RL, Snodderly DM, Yund EW, Hepler NK. Responses of macaque lateral geniculate cells to luminance and color figures. Sens Processes. 1977;1:244–259. [PubMed] [Google Scholar]
- De Yoe EA, Van Essen DC. Segregation of efferent connections and receptive field properties in visual area V2 of the macaque. Nature. 1985;317:58–61. doi: 10.1038/317058a0. [DOI] [PubMed] [Google Scholar]
- Elfar SD, De Valois RL. Orientation tuning of monkey V1 cells to luminance-varying and color-varying patterns. Invest Ophthalmol Vis Sci (suppl.) 1991;32:2866. [Google Scholar]
- Friedman HS, Zhou H, von der Heydt R. Color filling-in under steady fixation: Behavioral demonstration in monkeys and humans. Perception. 1999;28:1383–1395. doi: 10.1068/p2831. [DOI] [PubMed] [Google Scholar]
- Gegenfurtner KR, Kiper DC, Fenstemaker SB. Processing of color, form, and motion in macaque area V2. Vis Neurosci. 1996;13:161–172. doi: 10.1017/s0952523800007203. [DOI] [PubMed] [Google Scholar]
- Gerrits HJM, de Haan B, Vendrik AJH. Experiments with retinal stabilized images. Relations between the observations and neural data. Vision Res. 1966;6:427–440. doi: 10.1016/0042-6989(66)90051-4. [DOI] [PubMed] [Google Scholar]
- Gerrits HJM, Vendrik AJH. Simultaneous contrast, filling-in process and information processing in man's visual system. Exp Brain Res. 1970;11:411–430. doi: 10.1007/BF00237914. [DOI] [PubMed] [Google Scholar]
- Gouras P, Krüger J. Responses of cells in foveal visual cortex of the monkey to pure color contrast. J Neurophysiol. 1979;42:850–860. doi: 10.1152/jn.1979.42.3.850. [DOI] [PubMed] [Google Scholar]
- Hanazawa A, Murakami I, Kondo H, Komatsu H. Hue/saturation selectivity originates in V1, not in LGN, of the macaque monkey. Soc Neurosci Abstr. 1997;23:1026. [Google Scholar]
- Hering E. Outlines of a Theory of the Light Sense. Cambridge: Blackwell Science Inc; 1905. Grundzüge der Lehre vom Lichtsinn. Breitkopf & Härtel, Leipzig. (Hering E (1964) [Google Scholar]
- Hubel DH. Eye, Brain, and Vision. New York: Blackwell Science Inc; 1988. pp. 86–87. [Google Scholar]
- Hubel DH, Livingstone MS. Segregation of form, color, and stereopsis in primate area 18. J Neurosci. 1987;7:3378–3415. doi: 10.1523/JNEUROSCI.07-11-03378.1987. [DOI] [PMC free article] [PubMed] [Google Scholar]
- Hubel DH, Wiesel TN. Receptive fields and functional architecture of monkey striate cortex. J Physiol. 1968;195:215–243. doi: 10.1113/jphysiol.1968.sp008455. [DOI] [PMC free article] [PubMed] [Google Scholar]
- Johnson EN, Hawken MJ, Shapley R. The spatial transformation of color in the primary visual cortex of the macaque monkey. Nat Neurosci. 2001;4:409–416. doi: 10.1038/86061. [DOI] [PubMed] [Google Scholar]
- Kiper DC, Fenstemaker SB, Gegenfurtner KR. Chromatic properties of neurons in macaque area V2. Vis Neurosci. 1997;14:1061–1072. doi: 10.1017/s0952523800011779. [DOI] [PubMed] [Google Scholar]
- Komatsu H. Mechanisms of central color vision. Curr Opin Neurobiol. 1998;8:503–508. doi: 10.1016/s0959-4388(98)80038-x. [DOI] [PubMed] [Google Scholar]
- Komatsu H, Ideura Y. Relationships between color, shape, and pattern selectivities of neurons in the inferior temporal cortex of the monkey. J Neurophysiol. 1993;70:677–693. doi: 10.1152/jn.1993.70.2.677. [DOI] [PubMed] [Google Scholar]
- Komatsu H, Ideura Y, Kaji S, Yamane S. Color selectivity of neurons in the inferior temporal cortex of the awake macaque monkey. J Neurosci. 1992;12:408–424. doi: 10.1523/JNEUROSCI.12-02-00408.1992. [DOI] [PMC free article] [PubMed] [Google Scholar]
- Komatsu H, Kinoshita M, Murakami I. Neural responses in the retinotopic representation of the blind spot in the macaque V1 to stimuli for perceptual filling-in. J Neurosci. 2000;20:9310–9319. doi: 10.1523/JNEUROSCI.20-24-09310.2000. [DOI] [PMC free article] [PubMed] [Google Scholar]
- Krüger J, Gouras P. Spectral sensitivity of cells and its dependence on slit length in monkey visual cortex. J Neurophysiol. 1980;43:1055–1069. doi: 10.1152/jn.1980.43.4.1055. [DOI] [PubMed] [Google Scholar]
- Land EH, McCann JJ. Lightness and retinex theory. J Opt Soc Am. 1971;61:1–11. doi: 10.1364/josa.61.000001. [DOI] [PubMed] [Google Scholar]
- Lee TS, Mumford D, Romero R, Lamme VAF. The role of the primary visual cortex in higher level vision. Vision Res. 1998;38:2429–2454. doi: 10.1016/s0042-6989(97)00464-1. [DOI] [PubMed] [Google Scholar]
- Lennie P, Krauskopf J, Sclar G. Chromatic mechanisms in striate cortex of macaque. J Neurosci. 1990;10:649–669. doi: 10.1523/JNEUROSCI.10-02-00649.1990. [DOI] [PMC free article] [PubMed] [Google Scholar]
- Leventhal AG, Thompson KG, Liu D, Zhou Y, Ault SJ. Concomitant sensitivity to orientation, direction, and color of cells in layers 2, 3, and 4 of monkey striate cortex. J Neurosci. 1995;15:1808–1818. doi: 10.1523/JNEUROSCI.15-03-01808.1995. [DOI] [PMC free article] [PubMed] [Google Scholar]
- Levitt JB, Kiper DC, Movshon JA. Receptive fields and functional architecture of macaque V2. J Neurophysiol. 1994;71:2517–2542. doi: 10.1152/jn.1994.71.6.2517. [DOI] [PubMed] [Google Scholar]
- Livingstone MS, Hubel DH. Anatomy and physiology of a color system in the primate visual cortex. J Neurosci. 1984;4:309–356. doi: 10.1523/JNEUROSCI.04-01-00309.1984. [DOI] [PMC free article] [PubMed] [Google Scholar]
- Livingstone MS, Hubel DM. Connections between layer 4B of area 17 and thick cytochrome oxidase stripes of area 18 in the squirrel monkey. J Neurosci. 1987;7:3371–3377. doi: 10.1523/JNEUROSCI.07-11-03371.1987. [DOI] [PMC free article] [PubMed] [Google Scholar]
- Michael CR. Color vision mechanisms in monkey striate cortex: Simple cells with dual opponent-color receptive fields. J Neurophysiol. 1978a;41:1233–1249. doi: 10.1152/jn.1978.41.5.1233. [DOI] [PubMed] [Google Scholar]
- Michael CR. Color-sensitive complex cells in monkey striate cortex. J Neurophysiol. 1978b;41:1250–1266. doi: 10.1152/jn.1978.41.5.1250. [DOI] [PubMed] [Google Scholar]
- Michael CR. Color-sensitive hypercomplex cells in monkey striate cortex. J Neurophysiol. 1979;42:726–744. doi: 10.1152/jn.1979.42.3.726. [DOI] [PubMed] [Google Scholar]
- Pessoa L, Thompson E, Noe A. Finding out about filling-in: a guide to perceptual completion for visual science and the philosophy of perception. Behav Brain Sci. 1998;21:723–748. doi: 10.1017/s0140525x98001757. [DOI] [PubMed] [Google Scholar]
- Peterhans E, von der Heydt R. Functional organization of area V2 in the alert macaque. Eur J Neurosci. 1993;5:509–524. doi: 10.1111/j.1460-9568.1993.tb00517.x. [DOI] [PubMed] [Google Scholar]
- Poggio GF, Baker FH, Mansfield RJW, Sillito A, Grigg P. Spatial and chromatic properties of neurons subserving foveal and parafoveal vision in rhesus monkeys. Brain Res. 1975;100:25–59. doi: 10.1016/0006-8993(75)90240-1. [DOI] [PubMed] [Google Scholar]
- Reid RC, Shapley RM. Spatial structure of cone inputs to receptive fields in primate lateral geniculate nucleus. Nature. 1992;356:716–718. doi: 10.1038/356716a0. [DOI] [PubMed] [Google Scholar]
- Shi J, Malik J. Normalized cuts and image segmentation. IEEE Transactions on Pattern Analysis and Machine Intelligence. 2000;22:888–905. [Google Scholar]
- Shipp S, Zeki S. Segregation of pathways leading from area V2 to areas V4 and V5 of macaque monkey visual cortex. Nature. 1985;315:322–325. doi: 10.1038/315322a0. [DOI] [PubMed] [Google Scholar]
- Shipp S, Zeki S. The functional organization of area V2, I: specialization across stripes and layers. Vis Neurosci. 2002;19:187–210. doi: 10.1017/s0952523802191164. [DOI] [PubMed] [Google Scholar]
- Tamura H, Sato H, Katsuyama N, Hata Y, Tsumoto T. Less segregated processing of visual information in v2 than in v1 of the monkey visual cortex. Eur J Neurosci. 1996;8:300–309. doi: 10.1111/j.1460-9568.1996.tb01214.x. [DOI] [PubMed] [Google Scholar]
- Tanaka K, Saito H, Fukada Y, Moriya M. Coding visual images of objects in the inferotemporal cortex of the macaque monkey. J Neurophysiol. 1991;66:170–189. doi: 10.1152/jn.1991.66.1.170. [DOI] [PubMed] [Google Scholar]
- Thorell LG, De Valois RL, Albrecht DG. Spatial mapping of monkey V1 cells with pure color and luminance stimuli. Vision Res. 1984;24:751–769. doi: 10.1016/0042-6989(84)90216-5. [DOI] [PubMed] [Google Scholar]
- Vautin RG, Dow BM. Color cell groups in foveal striate cortex of the behaving macaque. J Neurophysiol. 1985;54:273–292. doi: 10.1152/jn.1985.54.2.273. [DOI] [PubMed] [Google Scholar]
- von der Heydt R, Friedman HS, Zhou H. Searching for the neural mechanisms of color filling-in. In: Pessoa L, De Weerd P, editors. Filling-in: From Perceptual Completion to Skill Learning. New York: Blackwell Science Inc; 2003. pp. 106–127. [Google Scholar]
- von der Heydt R, Peterhans E, Dürsteler MR. J Neurosci. Vol. 12. 1992. Periodic-pattern-selective cells in monkey visual cortex; pp. 1416–1434. [DOI] [PMC free article] [PubMed] [Google Scholar]
- Walls GL. The filling-in process. Am J Optom. 1954;31:329–341. doi: 10.1097/00006324-195407000-00001. [DOI] [PubMed] [Google Scholar]
- Wiesel TN, Hubel DH. Spatial and chromatic interactions in the lateral geniculate body of the rhesus monkey. J Neurophysiol. 1966;29:1115–1156. doi: 10.1152/jn.1966.29.6.1115. [DOI] [PubMed] [Google Scholar]
- Yarbus AL. Eye Movements and Vision. New York: Blackwell Science Inc; 1967. [Google Scholar]
- Yates F. The analysis of multiple classifications with unequal numbers in the different classes. J Am Stat Assoc. 1934;29:52–66. [Google Scholar]
- Yoshioka T, Dow BM. Color, orientation and cytochrome oxidase reactivity in areas V1, V2 and V4 of macaque monkey visual cortex. Behav Brain Res. 1996;76:71–88. doi: 10.1016/0166-4328(95)00184-0. [DOI] [PubMed] [Google Scholar]
- Yoshioka T, Dow BM, Vautin RG. Neuronal mechanisms of color categorization in areas V1, V2 and V4 of macaque monkey visual cortex. Behav Brain Res. 1996;76:51–70. doi: 10.1016/0166-4328(95)00183-2. [DOI] [PubMed] [Google Scholar]
- Zeki S. The distribution of wavelength and orientation selective cells in different areas of monkey visual cortex. Proc R Soc Lond B Biol Sci. 1983;217:449–470. doi: 10.1098/rspb.1983.0020. [DOI] [PubMed] [Google Scholar]
- Zhou H, Friedman HS, von der Heydt R. Coding of border ownership in monkey visual cortex. J Neurosci. 2000;20:6594–6611. doi: 10.1523/JNEUROSCI.20-17-06594.2000. [DOI] [PMC free article] [PubMed] [Google Scholar]