

Abstract
We assessed the relationship between phosphocreatine (PCr) and creatine (Cr) content and creatine kinase (CK) activity in skeletal muscle of mice. The PCr and total Cr (tCr) concentrations, as well as CK activity, in hindlimb muscles of mice, with or without the cytosolic and mitochondrial isoforms of muscle creatine kinase (wild-type or CK−/− mice), were determined by in vivo magnetic resonance (MR) spectroscopy and by biochemical means during postnatal growth and adulthood. In wild-type muscle the [tCr], PCr/ATP ratio and CK activity increased rapidly in the first 4–7 weeks. Remarkably, CK−/− mice showed a similar increase in the PCr/ATP ratio during the first month in the presence of only minor brain-type BB-CK activity. Uptake of Cr in muscle was seemingly unrelated to CK activity as tCr increased in the same way in the muscles of both mouse types. At older ages the PCr/ATP ratio decreased in CK−/− muscles, in contrast to wild-type where it still slowly increased, whereas [tCr] was similar for muscle of both mouse types. Using a new in vivo MR approach with application of [4-13C]Cr, a lower PCr/tCr ratio was also observed in CK−/− muscle. From these data it follows that in vivo global ATP levels at rest are similar in the presence or absence of CK. Although Cr could still be converted to PCr in mature CK−/− muscle, the immediate availability of PCr decreased, and PCr became partly inconvertible at older ages. Apparently, catalysis of the CK reaction by BB-CK, although significant in muscles of newborn mice, gradually declines to very low levels in adulthood. Part or all of this BB-CK may arise from satellite cells fusing with myotubes, a process that is most active during the first months of life. Finally, our observation that the MR and chemical assessment of muscle [tCr] and PCr/tCr ratio were similar for all mice does not support the existence of a significant MR-invisible or immobile pool of Cr, with a role for CK in this phenomenon.
Creatine kinases (CKs; EC 2.7.3.2) form a small family of isoenzymes that catalyse the reaction:
where Cr is creatine and PCr2- is phosphocreatine. These proteins play a key role in the energetics of excitable tissues, such as muscle and brain, by keeping ATP/ADP ratios balanced and the adenylate pool highly charged (Wallimann et al. 1992; Wyss & Kaddurah-Daouk, 2000). Apart from forming a temporal energy buffer, the CK circuit may also act as an intermediate in spatial energy networks (Walsh et al. 2001). Other roles of the CK system, which follow from the presence of other CK reactants, are intracellular regulation of pH (Edstrom et al. 1982; Wallimann et al. 1992) and inorganic phosphate (Pi) levels (Meyer et al. 1984).
To study the overall physiological significance of the CK/PCr system in muscle, we have generated mice with null mutations in the muscle-specific cytosolic M-CK and mitochondrial ScCKmit genes (van Deursen & Wieringa, 1992; van Deursen et al. 1993; Steeghs et al. 1997). Apart from specific functional losses, some remarkable metabolic adaptations were observed in the muscles of CK-lacking animals (e.g. van Deursen et al. 1993; Steeghs et al. 1998; de Groof et al. 2001). Early in life a significant part of the total skeletal muscle CK activity comes from the BB-CK isoform, and it has been shown for some species that the expression of this isoform becomes gradually suppressed during maturation of skeletal muscle, leaving only trace amounts at adulthood (Eppenberger et al. 1983; Trask & Billadello, 1990). Skeletal muscle of adult mice with combined null mutations for M-CK and ScCKmit (M-CK−/−/ScCKmit−/−, further referred to as CK−/−) showed no up-regulation of BB-CK activity. Nevertheless, substantial amounts of PCr were found in these muscles. However, this pool was not accessible for energy buffering (Steeghs et al. 1997; Heerschap et al. 1999) and moreover, the exchange-flux of phosphate between the PCr and ATP pools measured in MR transfer experiments had dropped to below detection levels in adult animals (Steeghs et al. 1998; Heerschap et al. 1999).
The main purpose of the present study was to obtain a more precise characterization of the origin and fate of the PCr pool in muscle without muscle-type CKs as compared with PCr in muscle of wild-type mice. It is of particular interest to know what happens with the muscle PCr content in relation to CK activity and total Cr levels. These key parameters in the setting of PCr tissue levels are expected to change in skeletal muscle of mice during postnatal development and aging. To address how they relate to PCr levels in wild-type and CK−/− mice, the total content of Cr (tCr) and PCr in hindlimb muscle was assessed by in vivo MR spectroscopy in parallel with biochemical determinations of muscle Cr levels and CK activity as a function of age. To identify whether uptake and phosphorylation of creatine indeed occur in muscle of adult CK−/− mice we introduce a new approach involving the administration of [4-13C]Cr to monitor its phosphorylation in vivo by 13C MR spectroscopy. From this approach also the muscle [PCr]/[tCr] ratio can be determined which, together with tCr content and [PCr]/[ATP] ratios, allows for an assessment of in vivo ATP levels in a novel way. Finally, we also compared the potential to de-phosphorylate PCr in muscle of wild-type and of double-knockout mice as a function of age. The results provided further clues on the presence of PCr in (developing) skeletal muscle of wild-type mice and of mice without cytosolic MM-CK and mitochondrial ScCKmit. Moreover, the particular results of this study of metabolite levels also have interesting implications for views on Cr mobility and visibility as seen by MR spectroscopy in skeletal muscle.
METHODS
Animals
In this study a comparison was made between mice lacking cytosolic M-CK and sarcomeric mitochondrial ScCKmit (i.e. CK−/−) and wild-type C57Bl/6 controls. All procedures were approved by the Animal Care Committee of the University of Nijmegen and conformed to the Dutch Council for Animal Care. Animals were anaesthetized with 1.2 % isoflurane in a gas mixture of 50 % O2−50 % N2O delivered through a facemask. Their body temperature was monitored using a fluoroptic thermometer (Luxtron 712, CA, USA) and was maintained at 36.8 ± 0.5 °C using a warm water circuit.
Magnetic resonance (MR) equipment
The MR experiments were performed on a horizontal 7.0 T magnet (Magnex Scientific, Abingdon, UK), which was equipped with 150 mT m−1 shielded gradients, and interfaced to a SMIS (Surrey Medical Imaging Systems, Surrey, UK) spectrometer, operating at 300.22 MHz for 1H, at 121.53 MHz for 31P and at 75.49 MHz for 13C. The receiver channel was slightly modified by using home-built ultra-low noise preamplifiers and a low-loss active transmit/receive switch.
Phosphorus (31P) MR study of postnatal development
For non-localized 31P MR measurements, a three-turn solenoid coil with a diameter of 8 mm was used with an Alderman-Grant type 1H coil surrounding it (Alderman & Grant, 1979). For young mice (7–14 days of age), a special plastic insert was used to ensure that only the hindlimb muscles were measured. After the shimming procedure, a scout image was obtained in three perpendicular directions to ensure that only the hindlimb was situated in the radio-frequency (RF) field of the coil. Experiments on a phantom (100 mm inorganic phosphate solution) showed that the field of view of the 1H coil corresponded to that of the 31P coil. This was verified by the combined application of localized 31P MR spectroscopy (Ordidge et al. 1986) and 1H MRI, which showed the absence of 31P MR signals outside the phantom. MR spectra were acquired using a 90 deg RF pulse of 40 μs with a repetition time of 7 s and were obtained from the hindlimb of mice starting at ages 7 days up to 300 days (n = 3–6 for each data point). Additional spectra were obtained with a repetition time of 25 s from animals at ages 90 and 110 days to obtain metabolite levels under fully relaxed conditions and to assess saturation factors (n = 3 for each mouse type).
Post-mortem study
31P MR spectra were acquired from wild-type mice aged 21 days and 12 months (n = 2 each), and CK−/− mice aged 21 days (n = 3) and 6, 9 and 12 months (n = 1 per time point). The 31P MR spectra (Tr = 7 s, 128 scans) were acquired using the same coil setup as used in the postnatal development study. After the acquisition of a reference spectrum, the animal was killed with an overdose of isoflurane and the PCr resonance was monitored until its level became constant.
In vivo monitoring of [4-13C]creatine by 13C magnetic resonance spectroscopy (MRS)
CK−/− (n = 5) and wild-type (n = 5) mice between 3 and 6 months of age were injected intravenously with 100 % [4-13C]Cr (11.25 mg ml−1, 200 μl), three times a week, for 3 weeks. The labelled Cr was obtained from Mercachem (Mercachem, Nijmegen, the Netherlands) and synthesized according to Han & Sillerud (1986). Hindlimb muscles of these mice were analysed weekly by 13C MR spectroscopy, using a 4-turn solenoid 13C coil with a diameter of 8 mm surrounded by an Alderman-Grant 1H coil. 13C MR spectra were acquired with a 90 deg RF pulse of 40 μs, a repetition time of 3 s, and Waltz-4 1H decoupling (40 W, duty cycle 0.7 %) to ensure that the resonances of PCr and Cr are maximally resolved. Heating caused by decoupling power was evaluated by monitoring the temperature of the hindlimb and of the body by a two-channel fluoroptic thermometer (Luxtron 712); no warming of the animal could be detected during 1.5 h.
Ischaemia protocol
To make hindlimb muscles ischaemic the MR probe was provided with a diaphragm plate, which allows reversible and reproducible occlusion of the hindlimb (in 't Zandt et al. 1999). Before, during and after ischaemia, sequential 13C MR measurements were made essentially as described above, except that the number of scans was reduced to 600 with a repetition time of 1 s. These experiments were performed on mice between 3 and 6 months of age.
Quantification of the total Cr pool in muscle using localized 1H MR spectroscopy
Creatine levels were determined by quantitative localized 1H MRS in gastrocnemius muscle, oriented at 55 deg with respect to the static magnetic field (Bo) direction (magic angle) to avoid complications due to dipolar coupling (in 't Zandt et al. 2000b). Localized 1H MRS was performed as described previously (in 't Zandt et al. 2000b). A stimulated echo pulse sequence with an echo time of 10 ms and a repetition time of 5 s was used to select a voxel (typical size 2 × 2 × 2 mm3) in the gastrocnemius muscle, guided by MR images acquired in three oblique, perpendicular directions. Localized shimming on this (oblique) voxel was performed until an H2O peak with full width at half maximum of less than 22 Hz was reached. Creatine levels were estimated from the peak area of its methyl protons using the 1H signal of water as an internal reference and assuming a muscle water content of 76 % (Sjogaard & Saltin, 1982). Corrections were made for T2 transverse relaxation times. The relaxation time T2 for Cr methyl and water proton spins was estimated by the acquisition of 1H MR spectra at different echo times and applying a mono-exponential fit to the signal intensities obtained at increasing echo times. At a repetition time of 5 s, the proton spin system was considered to be fully relaxed and hence no correction for T1 was applied. Creatine content was determined in this way at the ages of 60, 120 and 200 days (n = 3 each).
Biochemical determination of CK activity and metabolite levels
Mice were killed by cervical dislocation and hindlimb muscles snapshot frozen and stored at −80 °C. Muscles were homogenized in a Teflon-glass Potter-Elvehjem using 10 volumes of an ice-cold buffer containing 200 mm sucrose, 2 mm EDTA, 10 mm TrisHCl (pH 7.4), supplemented with heparin (50 units ml−1) and protease inhibitors (Boehringer Mannheim, Germany). The suspension was diluted 1:1 in a 30 mm phosphate buffer (pH 7.4), with 0.2 mm DTT, 0.05 % (v/v) Triton X-100 and protease inhibitors. Extracts were incubated at room temperature for 20 min and subsequently centrifuged at 15 000 g (Eppendorf) at 4 °C for 20 min. Total CK activity was measured at 37 °C using a CK-NAC-activated kit (Boehringer) and expressed in mmol (l intracellular water)−1 s−1, assuming 20 % protein content in skeletal muscle (Zuurveld et al. 1985) and 1 g of muscle being equivalent to 0.69 ml intracellular water. For zymogram analysis, total protein extracts (5 μg) were resolved on a 0.7 % (v/v) Seakem ME agarose gel (FMC Bioproducts, Rockland, ME, USA). Enzyme activities were visualized by a CK isoenzyme colourimetric detection kit (Sigma Diagnostics, St Louis, USA (Steeghs et al. 1997)).
For chemical analysis of the Cr content in the gastrocnemius- plantaris-soleus (GPS) complex, tissues were extracted by 0.6 m HClO4 and neutralized with 3 m KOH. Total Cr levels were assayed via coupled enzymatic reactions using a spectrophotometer operating at 340 nm (Bergmeyer, 1974). Creatine levels were determined in μmol (g wet weight)−1 and mmol (l tissue)−1, assuming a muscle density of 1.06 g ml−1 (Mendez & Keys, 1960). These were converted to mmol l−1 intracellular water assuming a cellular water fraction of 0.73 (Sjogaard & Saltin, 1982; Forsberg et al. 1991). PCr was determined as described previously (Steeghs et al. 1997; Steeghs et al. 1998).
MR data analysis
MRS data were evaluated in the time domain using MR user interface (MRUI) 97.1 software:http://www.mrui.uab.es/mrui/mruiHomePage.html
The processing of 1H MR spectra was performed as described previously (in 't Zandt et al. 2000b). The creatine peak at a chemical shift of 3.03 parts per million (p.p.m.) was fitted assuming a Gaussian line shape model function. Resonances in 31P MR spectra were also fitted with a Gaussian line shape model function. No further prior knowledge was used. For the assessment of ATP content only the γ-ATP and the β-ATP signals were considered. Intracellular pH was derived from the chemical shift difference between Pi and PCr peaks (Heerschap et al. 1988)
In 13C MR spectra, all signals originating from carbons in lipids were filtered using Hankel Lanczos singular value decomposition (de Beer & van Ormondt, 1992), leaving Cr and PCr signals around 157 p.p.m. for further analysis. As prior knowledge, a chemical shift difference of 0.8 p.p.m. (Han & Sillerud, 1986) and equal damping for these resonances was assumed.
Differences between mean parameter values were analysed by Student's unpaired t test.
RESULTS
Postnatal development of (phospho)creatine levels
Energy metabolites in developing hindlimb muscles of control and CK−/− mice aged 7–300 days were monitored by 31P MR spectroscopy. All 31P MR spectra (Fig. 1A) showed signals for PCr, γ-, α- and β-ATP, inorganic phosphate (Pi) and phosphomonoesters (PME). During the first 4 weeks of life the PCr/ATP signal ratio gradually increased to a value of about 2.5 (uncorrected for spin saturation), with a similar slope for wild-types and mutants (Fig. 1B). Thereafter, this ratio slightly increased further in controls, but gradually declined in CK−/− mice.
Figure 1. 31P MRS of hindlimb skeletal muscle as a function of age.
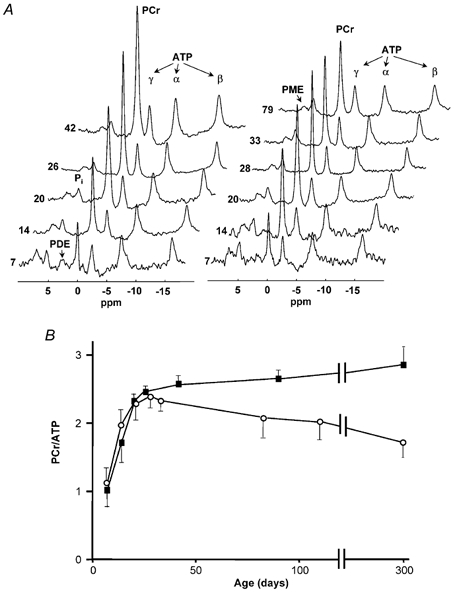
A, spectral changes for a wild-type (left panel) and a CK−/− mouse (right panel) reflect postnatal development of high energy phosphate metabolism. Spectra are vertically scaled to the ATP content. The age of the animals (days) is indicated at the left. PME, phosphomonoesters; Pi, inorganic phosphate; PDE, phosphodiesters; PCr, phosphocreatine; ATP, adenosine triphosphate. B, the PCr to ATP signal ratio as a function of age for CK−/− (○) and control (▪) mice. Ratios are not corrected for partial signal saturation. Each data point represents the average of at least three different mice. Standard deviations are indicated when outside the symbol sizes.
To assess how the size of the cellular Cr pool determines the ratio of PCr over ATP we measured total Cr levels as a function of age, in the same cohort of mice as studied by 31P MRS. Using a chemical assay the creatine content appeared to increase similarly in both wild-type and CK−/− mice during postnatal development and levelled off after about 7 weeks of age at values between 27 and 35 mmol (l tissue)−1 (see Fig. 2). Total creatine was also determined by quantitative localized 1H MRS, with the muscle oriented at the so-called magic angle (Kreis et al. 1997; in 't Zandt et al. 2000b), from the peak area of its methyl protons and using the water peak as a reference. The T2 relaxation times used for signal correction were estimated to be 83 ± 4 ms (n = 6) for creatine methyl protons and 21.9 ± 0.1 ms (n = 6) for water proton spins. At 60 and 120 days of age, tCr levels were determined in this way by MRS and also chemically, in the same skeletal muscles (n = 3). At 60 days of age, total creatine concentration was 27.9 ± 0.9 mmol (l tissue)−1 by MRS, which is not different from the creatine tissue content determined chemically (27.3 ± 1.4 mmol (l tissue)−1). Although the average value determined by MRS at 120 days (32.5 ± 0.7 mmol (l tissue)−1) is somewhat higher than that determined chemically (30.3 ± 0.9 mmol (l tissue)−1) it is within the range of chemically determined values between 90 and 160 days of age (see Fig. 2). 1H MRS analysis at 200 days of age found tCr to be 33.2 ± 1.1 mmol (l tissue)−1 in controls (n = 3) and 34.5 ± 1.2 mmol (l tissue)−1 in CK−/− muscles (n = 3).
Figure 2. Creatine levels in hindlimb skeletal muscle as a function of mouse age.
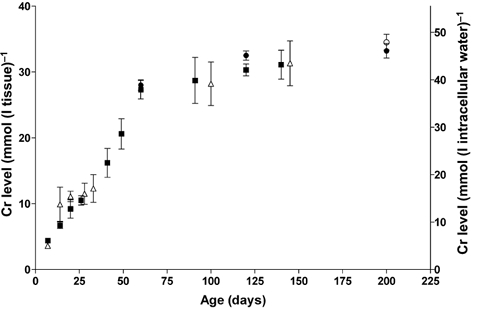
Data are presented as mmol (l tissue)−1 (left axis) and as mmol (l intracellular water)−1 (right axis) assuming an intracellular water fraction of 0.73 (see Methods). Values for CK−/− mice are indicated by open symbols and for wild-type control mice by filled symbols. Data points at 60, 120 and 200 days, indicated by filled circles, were obtained by quantitative 1H MRS of wild-type gastrocnemius muscle (n = 3) and at 200 days of age also in CK−/− muscle (n = 3), indicated by an open circle. The other data points have been obtained by biochemical means from the muscle GPS complex. The data points at 60 and 120 days (n = 3) have been determined from the same leg on which the MRS quantification was performed. The data points at 140 and 145 days are averages of six and five mice, respectively, varying in age between 120 and 160 days. Each other point represents an average of 3–6 mice, except at 7 days postpartum, which are single measurements. Standard deviations are indicated if extending beyond the symbol size.
Postnatal changes in creatine kinase activity
During postnatal development of mammalian skeletal muscles a gradual repression of B-CK gene expression takes place. In order to assess the possible involvement of this CK family member in PCr pool build-up and depletion, we quantified the residual level of BB-CK isoenzyme in CK−/− muscles in relation to normal wild-type CK activity over time. The zymogram assay confirmed complete absence of MM-CK and ScCKmit in double mutant muscle, whereas the BB-CK isoenzyme was clearly visible in both wild-type and mutant muscle extracts at 7 and 14 days of age (Fig. 3A). During further progression to adulthood, isoenzyme staining on zymograms dropped to undetectably low levels, but the corresponding residual BB-CK enzyme activity could still be assessed with spectrophotometric analysis of tissue lysates. In wild-type hindlimb skeletal muscle, CK activity increases during the first month of life from about 75 mm s−1 at an age of 7 days to a value of about 200 mm s−1 at adulthood (Fig. 3B). In 7-day-old CK−/− muscles this activity was about 2.5 mm s−1 or 4 % of the normal overall CK activity (combined BB-CK, MM-CK and ScCKmit activities in wild-type controls) and decreased to values of less than 1 mm s−1 within about 40 days (Fig. 3C).
Figure 3. CK isoenzyme and adenylate kinase 1 (AK1) distribution in skeletal muscle as a function of mouse age.
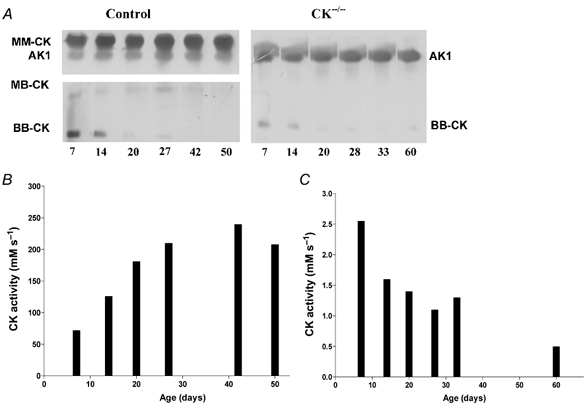
A, zymogram analysis of extracts from wild-type (left panel) and CK−/− mouse muscle (right panel) reveals low levels of BB-CK activity during the first 2 weeks. Note the complete absence of MM-CK activity in CK−/−animals. AK1 activity staining appears different in the right and left panels due to the use of differential staining protocols, necessary to avoid overexposure of MM-CK signal and blurring of the AK1 band by the presence of vast amounts of MM-CK in wild-type muscles. Staining of (low) ScCKmit activity is not visible under the present conditions. B, CK enzyme activity measured as a function of age in wild-type muscle. Activities are given as mmol (l intracellular water)−1 s−1. C, CK activity in CK−/− muscle, which is the non-MM-CK/ScCKmit activity, expressed as mmol (l intracellular water)−1 s−1. Note the different scaling from B.
Uptake and phosphorylation of 13C-labelled creatine in muscle of adult mice
To assess the uptake and phosphorylation of creatine in mature wild-type and CK−/− mice we explored a new approach by which we could assess Cr and PCr simultaneously in muscle in vivo using 13C MR spectroscopy after injection of [13C]Cr. After 1 week, this resulted in well-resolved signals in the 13C MR spectrum of wild-type muscle for Cr and PCr (Fig. 4A). Strikingly, uptake and phosphorylation of [13C]Cr were also detectable in CK−/− mice (Fig. 4B). The phosphorylated fraction of the Cr pool remained constant during 3 weeks of creatine injection in both mouse strains (Fig. 4C). The average PCr/tCr ratio as determined by 13C MRS in CK−/− mice (0.56 ± 0.05) was significantly lower than in wild-type muscle (0.74 ± 0.04). In a determination by chemical analysis (Steeghs et al. 1997) similar values were found for CK−/− mice (0.55 ± 0.06) and slightly lower values for wild-types (0.66 ± 0.07), which is probably due to some PCr breakdown during the extraction procedure because of the high CK activity.
Figure 4. 13C MRS of adult hindlimb muscle, after administration of [4-13C]Cr.
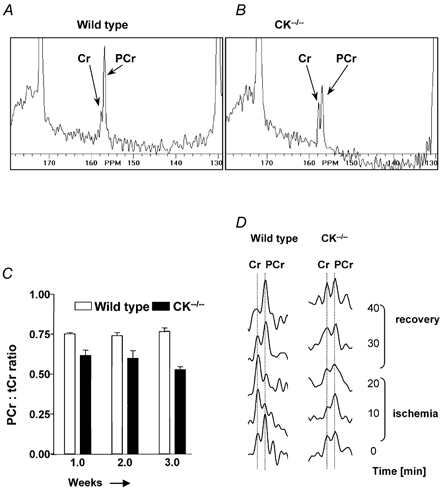
13C MR spectra (128–180 p.p.m. spectral range) of wild-type control (A) and CK−/− mice (B). C, PCr/tCr ratios derived from these spectra assessed over a 3 week period. D, zoomed 13C MR spectra obtained before and during 20 min of ischaemia and recovery. Hydrolysis of PCr and rephosphorylation of Cr are evident in wild-type muscles, while in CK−/− muscles no conversion was detected within the limits set by the signal-to-noise ratio.
To verify whether the [13C]PCr in muscle is metabolically active, we applied ischaemia to the hindlimb muscle. 13C MR spectra were acquired at a time resolution of 10 min, during a total ischaemic period of 20 min. In wild-type mice we observed a clear conversion of PCr to Cr during this time interval, and full recovery of PCr levels occurred after reperfusion (Fig. 4D). In CK−/− mice, no changes in PCr and Cr levels could be observed, within limits set by the signal-to-noise ratio.
Non-invasive estimation of intracellular ATP and ADP content at rest
Usually the in vivo levels of compounds in skeletal muscle involved in the CK reaction are assessed by 31P MRS by taking the chemically determined contents of ATP and total creatine as starting points. The availability in this study of absolute Cr levels and of the [PCr]/[tCr] and [PCr]/[ATP] ratios allowed the non-invasive estimation of PCr and ATP levels. The average [tCr] for muscle of wild-type mice between 60 and 200 days of age was 30.5 ± 2.0 mmol (l tissue)−1 (see Table 1). With a PCr/tCr ratio of 0.74 ± 0.04 we calculate an average value for [PCr] of 22.5 ± 1.9 mmol (l tissue)−1 and with a PCr/ATP ratio of 2.90 ± 0.19 we arrive at an average [ATP] of 7.8 ± 0.8 mmol (l tissue)−1. In previous studies we obtained similar [ATP] values for wild-type skeletal muscle (GPS complex) by chemical means: i.e. 8.2 ± 0.8 mmol (l tissue)−1 (Steeghs, 1995) and 8.3 ± 0.5 mmol (l tissue)−1 (van Deursen et al. 1993). [ATP] in CK−/− muscle derived by the MRS approach was not different from wild-types, but it was substantially lower in the chemical determination. Assuming a fraction of 73 % for intracellular water the intracellular concentrations of tCr, PCr and ATP were also determined (Table 1). Free intracellular ADP levels were derived from these concentrations and the CK reaction assuming this reaction to be at near-equilibrium with an equilibrium constant of 1.66 × 10⁹ (Veech et al. 1979) and including intracellular pH data from 31P MR spectra of skeletal muscle. The near-equilibrium condition generally seems valid for skeletal muscle at rest (e.g. Veech et al. 1979). This condition also appears to occur in muscle of wild-type mice (van Deursen et al. 1993), but may not necessarily be valid for CK−/− muscle.
Table 1.
Average metabolite concentrations, ratios and tissue pH for adult mouse skeletal muscle
| Wild type | M-CK/ScCKmit knock-out (CK−/−) | |||||
|---|---|---|---|---|---|---|
| mmol | mmol | mmol | mmol | |||
| (1 tissue)−1 | (1 intracellular water)−1 | (1 tissue)−1 | (1 intracellular water)−1 | |||
| [tCr]a | 30.5 ± 2.0 | 41.8 ± 2.7 | 31.4 ± 2.8 | 43.0 ± 3.8 | ||
| PCr/tCrb* | 0.74 ± 0.04 | 0.56 ± 0.05 | ||||
| [PCr] | 22.5 ± 1.9 | 30.8 ± 2.6 | 17.6 ± 2.2 | 24.1 ± 3.0 | ||
| PCr/ATPcb* | 2.90 ± 0.19 | 2.36 ± 0.21 | ||||
| [ATP]MRS | 7.8 ± 0.8 | 10.7 ± 1.1 | 7.5 ± 1.1 | 10.3 ± 1.5 | ||
| [ATP]chemd* | 8.2 ± 0.8 | 11.2 ± 1.1 | 5.7 ± 0.6 | 7.8 ± 0.8 | ||
| pHe | 7.22 ± 0.03 | 7.24 ± 0.04 | ||||
| [ADP]f | 0.037 | (0.083) | ||||
All the data (±s.d.) are obtained from measurements of animals between 60 and 200 days of age. Metabolite concentrations in mmol (1 tissue)−1 (left column for each mouse type) were converted to mmol (1 intracellular water)−1 (right columns) assuming a fraction of 0.73 for intracellular water. [PCr] and [ATP]MRS were derived from the PCr/tCr and PCr/ATP ratios, respectively.
Difference comparison between wild-type and CK−/− by unpaired t test: two-tailed P value < 0.0001. atCr: phosphorylated + unphosphorylated creatine. bData from chemical and 1H MRS determinations have been taken together, n = 24 for wild type and 12 for CK−/−. Data from 13C MRS of the hindlimb, averaged from measurements obtained 1, 2 and 3 weeks after the start of [4-13C] creatineadministration for four wild type and four CK−/− mice, n = 11 for each mouse species. cRatios obtained from 31P MR spectra measured under relaxed spin conditions (Tr > 20 s) or corrected for spin saturation if obtained at a pulse repetition time of 7 s. n = 9 for wild type and CK−/−. dData taken from Steeghs (1995) in μmol (g wet weight)−1 and converted to mmol (1 intracellular water)−1 assuming a muscle density of 1.06 and an intracellular water fraction of 0.73. n = 5 for wild type and n = 6 for CK−/−. eDetermined from 31P MRS data, n = 6 for wild type and n = 5 for CK−/−. fADP is estimated asdescribed in the text, using the [ATP]MRS values and assuming the CK reaction to be at equilibrium (this may not be valid for CK−/−).
Post-mortem de-phosphorylation of phosphocreatine as a function of age
Having demonstrated that Cr phosphorylation can occur in both developing and mature muscle of CK−/− mice at rest, we next investigated to what extent also the inverse reaction, i.e. de-phosphorylation of the PCr pool, could still ensue in these animals. We therefore quantified this activity as a function of age by measuring the rate of PCr signal decay in hindlimbs after a maximal physiological challenge: the onset of death in the MR magnet. Post-mortem PCr breakdown occurs at the same rate in 21-day- and 12-month-old wild-type mice (Fig. 5). In contrast, CK−/− mice showed delayed depletion of PCr at the age of 21 days, while de-phosphorylation of PCr was further slowed down at 3, 9 and 12 months of age (Fig. 5). In these latter measurements, the PCr signal did not drop to zero, but reached a plateau at about 50 % of the initial concentration, indicating that on the time scale of the experiment a significant portion of PCr had become metabolically inactive.
Figure 5. Post-mortem depletion of PCr in mouse skeletal muscle followed by 31P MRS.
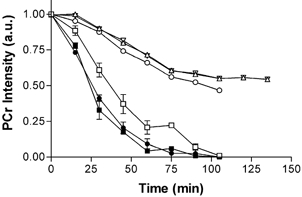
The animals were killed at t = 0 as described in the text. Data point symbols for wild-type are: ▪, 21 days (n = 2); •, 12 months (n = 3). Those for CK−/− are: □, 21 days (n = 3); ▽, 3 months (n = 1); △, 9 months (n = 2); ○, 12 months (n = 1). In control mice at 21 days and 12 months of age the decay is the same. In CK−/− muscle, the ability to hydrolyse PCr decreases with age. In 21-day-old CK−/− mice, PCr gets completely depleted, but at 3 months or older, PCr appears to decrease only to 50 % and at a lower rate.
DISCUSSION
Differences in PCr, total Cr content and CK activity during development and at adulthood
The increase of the CK activity and of the PCr/ATP ratio during postnatal development of skeletal muscle in wild-type mice confirms results of previous studies in rodents (e.g. Zuurveld et al. 1985; Heerschap et al. 1988). In the present study we also observed a postnatal increase for total muscle creatine (tCr) content in these mice, which in the first 4 weeks occurs in parallel with increasing CK activity and PCr/ATP ratios. In general for different tissues there appears to be a positive correlation between CK activity and Cr content (Wyss & Kaddurah-Daouk, 2000). However, it is clear that this correlation does not hold strictly. An increasing tCr level paralleled a minor and steadily decreasing CK activity in the CK−/− mice, which declined to levels below 1 mm s−1. A decline of BB-CK activity has also been observed for the hearts of these mice (Saupe et al. 2000). Interestingly, the PCr/ATP ratio in skeletal muscle of CK−/− mice increased in a very similar fashion to wild-type mice during the first 4 weeks after birth, despite the fact that the total CK activity differed profoundly between mutants and controls. It appears that the initial increase in PCr levels relates to the postnatal increase in the tCr pool, which is largely identical in wild-type and CK−/− mice. While beyond 30 days of age the PCr/ATP ratio increased more slowly in wild-type or even decreased in CK−/− mice, the increase of the muscle tCr content levelled off somewhat later. Resting PCr/ATP ratios are not only determined by the tCr level and CK activity (see below), but also by the intracellular energy charge and total adenylate levels, which may change during the postnatal development of skeletal muscle (e.g. Isselhard et al. 1973). The present study indicates that Cr uptake in skeletal muscle is independent of its phosphorylation by CK. This uptake is an active process, regulated by specific Na+-Cr co-transporters (Guerrero-Ontiveros & Wallimann, 1998; Wyss & Kaddurah-Daouk, 2000), the activity of which is coupled to energy- and Na+−, K+- and Ca2+-homeostasis. Creatine transporter activity shows regional and developmental differences (Kekelidze et al. 1999; Murphy et al. 2001), but it seems unaffected in CK-lacking mutants.
Once CK−/− mice become older than 4 weeks, they display lower PCr/ATP and PCr/tCr ratios than wild-type mice. To put this in the proper perspective we first consider how CK activity, the in vivo flux through the CK reaction and ATPase activity relate to each other. The maximum activity (Vmax) of CK from adult wild-type GPS muscle is about 200 mm s−1 at 37 °C (see Fig. 3B). This is in agreement with other studies on rodent (fast twitch) skeletal muscle (e.g. Zuurveld et al. 1985; Bittl et al. 1987; van Dorsten et al. 1996), but it is in contrast to the actual resting CK flux in vivo as derived from 31P MRS magnetization transfer in our earlier studies (van Deursen et al. 1993), which is approximately 8 mm s−1 and thus only about 5 % of the in vitro values. Similar discrepancies have been noted previously for skeletal muscle and are explained by specific kinetic behaviour of CK enzymes under in vivo conditions (Bittl et al. 1987; McFarland et al. 1994; Nicolay et al. 1998). Still, these fluxes are well above maximum values of ATPase activity so that adequate backup during the early phase of muscle contraction is ensured. In the cytosolic M-CK single-knockout mice the in vitro CK activity at 37 °C drops to about 5 mm s−1 and the in vivo CK flux to below 0.4 mm s−1 (van Deursen et al. 1993, 1994; van Dorsten et al. 1996; Saupe et al. 1998). These mice lack muscle burst activity as demonstrated by electrical stimulation at 5 Hz. As the rate of ATP breakdown may easily increase above 1 mm s−1 at such muscle activity (calculated from data in Hood et al. (1986) and Foley & Meyer (1993)), the CK flux cannot follow ATP breakdown during the first 10 s of contraction when ATP regeneration nearly completely relies on PCr (Foley & Meyer, 1993). The concomitant ADP increase may explain why burst activity is lacking in the muscle of these mice (Roman et al. 2002). In muscle of adult CK−/− mice the in vitro CK activity is further reduced to less than 1 mm s−1. These mice not only lack burst activity but in addition showed lower muscle force and slower relaxation compared with the M-CK single-knockout mice (Steeghs et al. 1997). If the in vivo activity is also only 5 % of the in vitro value (i.e. ≈0.02 mm s−1) this comes close to ATPase flux rates as estimated for resting rat skeletal muscle, which are between about 0.01 and 0.04 mm s−1 (Meyer et al. 1985; Hood et al. 1986; Bittl et al. 1987; McFarland et al. 1994). With similar ATPase fluxes occurring in resting CK−/− muscle the CK reaction might be out of equilibrium upon work transitions, which, at comparable total Cr and adenylate pools, would result in an altered PCr/ATP ratio. In addition this altered ratio could represent a situation in which the (entire) muscle pool of CK substrates no longer is in continuous open contact with the, now only sparsely present, CK molecules, for instance due to compartmentalization such as discussed for the presumed role of satellite cells below. If, on the other hand, the residual CK activity would still be sufficient to keep the overall CK reaction at or near equilibrium in the resting state, it follows that the concentration of ADP must differ between wild-type and mutant muscle as tissue pH, total creatine and ATP levels are similar. Under equilibrium conditions we estimate an increase of resting free ADP levels by a factor of about 2 in CK−/− muscle (see Table 1). As resting PCr content may vary with fibre type (Kushmerick et al. 1992), the different PCr levels might be related to an overall change in fibre type composition in the mutant mouse compared with control. Moreover, postnatal changes in CK activity appear to correlate with changes in myosin heavy chain phenotype (Watchko et al. 1996). However, the myosin heavy chain distribution did not appear to differ much in skeletal muscle of CK−/− mice, although a shift towards a more oxidative character of mainly the type II fast twitch glycolytic muscles in CK−/− mice has been identified (Steeghs et al. 1998; de Groof et al. 2001).
On the origin of the Cr (de)phosphorylation activity in mature muscle of CK−/− mice
As the 13C MRS experiments showed that even in mature CK−/− muscle older than 3 months Cr can be converted to PCr, the question remains of what the origin of this catalytic activity is. It is conceivable that BB-CK activity arises from non-muscle cells, such as vascular endothelium, or that some unknown Cr phosphorylating activity is present in muscle cells. These possibilities seem rather unlikely, in particular as mice with combined deficiency of cytosolic BB-CK and mitochondrial ubiquitous-CK (UbCKmit) isoforms completely lack PCr in the brain (in 't Zandt et al. 2000a). This provides indirect evidence for the supposition that Cr ⇆ PCr conversion in mammalian tissues becomes fully blocked if activity of all CK isoforms is completely ablated.
If we assume that Na+-Cr co-transporters do not transport PCr, formed elsewhere and transported by circulation, into muscle directly, and that the negatively charged PCr (PCr2-) will not freely pass the sarcolemma against a concentration gradient, we can only explain our results by assuming that trace CK activity in adult CK double-mutant muscles causes PCr to occur. Two possibilities remain for this residual CK activity. The first is that even in mature myotubes the expression of the B-CK gene, although decreasing with age, is still not completely blocked. Another interesting explanation for the build-up of a PCr pool in mature hindlimb muscle would be the deposition of BB-CK molecules from satellite cells in the process of fusion (Schultz & McCormick, 1994). Muscle satellite cells are prominently present and active in the growing muscles of young animals, but their population decreases with age (Schultz & McCormick, 1994). Satellite cell nuclei are 30 % of the total muscle nuclei at birth, 4 % at 8 months and 2.4 % at 30 months of age in mouse soleus muscle. Moreover, at adult age when muscle growth has slowed down the remaining satellite cells become quiescent, only being re-activated when myofibres are over-challenged. Thus in the adult stage when little satellite fusion is occurring, a considerable fraction of myofibres may hardly have any BB-CK left. This view is corroborated by the post-mortem data of CK−/− muscle, which shows that at older age the rate of PCr de-phosphorylation is slower and that 50 % of the total PCr pool size virtually is unaffected during the observation period. If a significant part of the total cellular Cr pool has no access to the enzyme, this would indeed explain the lower PCr/tCr ratio in adult mutants. In this context CK−/− mice could become a convenient model to study the role of satellite cells, using BB-CK and PCr as sensitive reporters for their fate under different physiological conditions.
Estimation of in vivo ATP content using 4-13C-PCr/tCr ratios
From the experiments with [13C]creatine the in vivo PCr/tCr ratio was derived for skeletal muscle. Because we also have total Cr levels and PCr/ATP ratios available this gives the opportunity to estimate in vivo ATP levels in a novel manner. The tissue concentration derived in this way (≈8 mmol (l tissue)−1) is in the order of ATP values for (fast twitch) skeletal muscle that have been reported by others (e.g. Shoubridge et al. 1984; Meyer et al. 1985; Kushmerick et al. 1992) and conforms with ATP tissue concentrations determined by chemical means in wild-type mouse skeletal muscle (van Deursen et al. 1993; Steeghs, 1995). Moreover, in this way we demonstrate that ATP levels in wild-type and CK−/− muscle are similar, and that differences seen previously in chemical analysis (Steeghs, 1995; Steeghs et al. 1997) can be explained by rapid breakdown of ATP during the clamping procedure for the extraction (Meyer et al. 1985), which cannot be compensated in CK−/− muscle, because it has a very inefficient CK reaction. In contrast in wild-type muscle PCr is more depleted during this procedure, thus sustaining ATP levels, which is reflected in a slightly lower PCr/ATP ratio when determined by chemical means (Steeghs et al. 1997).
The MR visibility of creatine
The present results also bear on the issue of MR visibility of the cellular Cr pool, and the presumed existence of significant free-Cr pools that do not participate in the CK reaction. Based on experiments using 14C-labelled Cr in heart muscle (Lee & Visscher, 1961; Savabi, 1988) and in fast twitch muscle of fish (Hochachka & Mossey, 1998) it has been proposed that a significant fraction of Cr (about 30 %) is not immediately available for the CK reaction in these tissues. MR magnetization transfer experiments on skeletal muscle indeed revealed a pool of Cr that may be bound to matrix or cellular macromolecules, but this pool is in exchange with ‘mobile’, MRS-visible creatine and comprises only about 2 % of total creatine (Kruiskamp et al. 1999; Renema et al. 2002). The observation in human skeletal muscle that the methylene peak of Cr in 1H MR spectra disappears during exercise (Kreis et al. 1999) further stimulated the discussion that a significant immobile Cr pool may exist, which is not readily accessible to creatine kinase. In another study a decrease in T2 relaxation time of creatine methyl proton spins was observed during ischaemic fatigue in humans (Trump et al. 2001), suggesting reduced mobility of creatine. In contrast, 1H MRS investigations of mouse skeletal muscle indicated that changes in Cr signals, observed immediately after death of the animal, mainly result from altered dipolar interactions related to removal of the phosphate moiety of this compound and not from changes in its cyto-architectural environment (in 't Zandt et al. 2000b). After eliminating the spectral appearance of these interactions by orienting the fibre direction of the muscle at 55 deg with the main magnetic field (magic angle), the Cr signal did not change in the early post-mortem phase. Interestingly, a recent study indicated that the electric charge of small molecules and proteins affects dipolar coupling interactions in skeletal muscle (Asslani et al. 2001).
Our quantification of total Cr content in adult mouse skeletal muscle, by 1H MRS of muscles placed at the magic angle to avoid complications by dipolar interactions (Kreis et al. 1997), yielded similar values to those obtained by chemical means. In the GPS complex of animals at an age from 2 to about 6 months the intracellular total creatine concentrations were about 40 mm. This is close to the values published for type 2a/b muscles in mouse and rat (Kushmerick et al. 1992), which is what can be expected as the gastrocnemius muscle is dominating in this complex. Altogether these results do not point to a significant MR-invisible Cr pool (i.e. more than the error of the measurements, which is less than 10 %) in mouse skeletal muscle, as was already concluded for PCr in these muscles (Wiseman & Kushmerick, 1995). Further support for ‘full MR visibility’ of the total Cr pool comes from the observation that PCr/tCr ratios determined by 13C MRS resemble the chemically determined values. Ischaemia experiments indicate that the MR-visible-PCr and free-Cr pools are in direct contact with each other in wild-type mouse skeletal muscle. Finally, the similarity of creatine levels in wild-type and mutant muscles as detected by 1H MRS indicates that the mere presence of CK itself does not affect the MR visibility at rest of the Cr pool and hence its mobility.
Acknowledgments
This work was supported by a programme grant from the Netherlands Organization for Scientific Research (Medical Sciences).
REFERENCES
- Alderman DW, Grant DM. An efficient decouple coil design which reduces heating in conductive samples in superconducting spectrometers. J Magn Res. 1979;36:447–451. [Google Scholar]
- Asslani I, Shankland E, Kushmerick MJ. Charge influences dipolar coupling interactions of lactate and alanine in skeletal muscle. Proc Intl Soc Mag Reson Med. 2001;9:329. [Google Scholar]
- Bergmeyer HU. Methods of Enzymatic Analysis. New York: Academic Press; 1974. [Google Scholar]
- Bittl JA, Delayre J, Ingwall JS. Rate equation for creatine kinase predicts the in vivo reaction velocity: 31P NMR surface coil studies in brain, heart, and skeletal muscle of the living rat. Biochemistry. 1987;26:6083–6090. doi: 10.1021/bi00393a021. [DOI] [PubMed] [Google Scholar]
- de Beer R, van Ormondt D. In-vivo magnetic resonance spectroscopy I: probeheads and radiofrequency pulses spectrum analysis. In: Diehl P, Fluck E, Gunther H, Kosfeld R, Seelig J, editors. NMR. Vol. 26. New York: Springer-Verlag; 1992. pp. 201–258. [Google Scholar]
- DeGroof AJ, Smeets B, Groot Koerkamp MJ, Mul AN, Janssen EE, Tabak HF, Wieringa B. Changes in mRNA expression profile underlie phenotypic adaptations in creatine kinase-deficient muscles. FEBS Lett. 2001;506:73–78. doi: 10.1016/s0014-5793(01)02879-4. [DOI] [PubMed] [Google Scholar]
- Edstrom L, Hultman E, Sahlin K, Sjoholm H. The contents of high energy phosphates in different fibre types in skeletal muscles from rat, guinea-pig and man. J Physiol. 1982;332:47–58. doi: 10.1113/jphysiol.1982.sp014399. [DOI] [PMC free article] [PubMed] [Google Scholar]
- Eppenberger HM, Perriard J-C, Walliman T. Analysis of creatine kinase during muscle differentation. In: Rattazi M, Scandalios JC, Whitt GS, editors. Isoenzymes: Current Topics in Biologial and Medical Research, vol. 7, Molecular Structure and Regulation. New York: Alan Liss; 1983. pp. 19–38. [Google Scholar]
- Foley JM, Meyer RA. Energy cost of twitch and tetanic contractions of rat muscle estimated in situ by gated 31P NMR. NMR Biomed. 1993;6:32–38. doi: 10.1002/nbm.1940060106. [DOI] [PubMed] [Google Scholar]
- Forsberg AM, Nilsson E, Werneman J, Bergstrom J, Hultman E. Muscle composition in relation to age and sex. Clin Sci. 1991;81:249–256. doi: 10.1042/cs0810249. [DOI] [PubMed] [Google Scholar]
- Guerrero-Ontiveros ML, Wallimann T. Creatine supplementation in health and disease. Effects of chronic creatine ingestion in vivo: down-regulation of the expression of creatine transporter isoforms in skeletal muscle. Mol Cell Biochem. 1998;184:427–437. [PubMed] [Google Scholar]
- Han CH, Sillerud LO. Synthesis of [guanidino-13C]creatine and measurement of the creatine phosphokinase reaction in vitro by 13C NMR spectroscopy. Magn Reson Med. 1986;3:626–633. doi: 10.1002/mrm.1910030415. [DOI] [PubMed] [Google Scholar]
- Heerschap A, Bergman AH, Van Vaals JJ, Wirtz P, Loermans HMT, Veerkamp JH. Alterations in relative phosphocreatine concentrations in preclinical mouse muscular dystrophy revealed by in vivo NMR. NMR Biomed. 1988;1:27–31. doi: 10.1002/nbm.1940010106. [DOI] [PubMed] [Google Scholar]
- Heerschap A, Houtman C, in 't Zandt HJA, van den Bergh AJ, Wieringa B. Introduction to in vivo 31P MR spectroscopy of (human) skeletal muscle. Proc Nutr Soc. 1999;58:861–870. doi: 10.1017/s0029665199001160. [DOI] [PubMed] [Google Scholar]
- Hochachka PW, Mossey MKP. Does muscle creatine phosphokinase have access to the total pool of phosphocreatine plus creatine? Am J Physiol. 1998;274:R868–872. doi: 10.1152/ajpregu.1998.274.3.R868. [DOI] [PubMed] [Google Scholar]
- in 't Zandt HJ, Jost C, Oerlemans F, Klomp DWJ, Wieringa B, Heerschap A. Brains of creatine kinase mice lack phosphocreatine and exhibit an increased NAA level. Proc Int Soc Mag Reson Med. 2000a;8:174. [Google Scholar]
- in 't Zandt HJA, Klomp DWJ, Oerlemans F, Wieringa B, Hilbers CW, Heerschap A. Proton MR spectroscopy of wild type and creatine kinase deficient mouse skeletal muscle: dipole-dipole coupling effects and postmortem changes. Magn Reson Med. 2000b;43:517–524. doi: 10.1002/(sici)1522-2594(200004)43:4<517::aid-mrm5>3.0.co;2-i. [DOI] [PubMed] [Google Scholar]
- in 't Zandt HjA, Oerlemans F, Wieringa B, Heerschap A. Effects of ischemia on skeletal muscle energy metabolism in mice lacking creatine kinase monitored by in vivo 31P nuclear magnetic resonance spectroscopy. NMR Biomed. 1999;12:327–334. doi: 10.1002/(sici)1099-1492(199910)12:6<327::aid-nbm570>3.0.co;2-9. [DOI] [PubMed] [Google Scholar]
- Isselhard W, Fisher JH, Kapune H, Stock W. Metabolic patterns of several tissues of rabbits and guinea pigs during postnatal development. Biol Neonate. 1973;22:201–221. doi: 10.1159/000240554. [DOI] [PubMed] [Google Scholar]
- Kekelidze T, Khait I, Togliatti A, Benzycry J, Mulkern R, Holtzman D. Maturational changes in rabbit brain phosphocreatine and creatine kinase. Ann NY Acad Sci. 1999;893:309–313. doi: 10.1111/j.1749-6632.1999.tb07844.x. [DOI] [PubMed] [Google Scholar]
- Kreis R, Jung B, Felblinger J, Boesch C. Effect of exercise on the creatine resonance in 1H MR spectra of human skeletal muscle. J Mag Reson. 1999;137:350–357. doi: 10.1006/jmre.1998.1683. [DOI] [PubMed] [Google Scholar]
- Kreis R, Koster M, Kamber M, Hoppeler H, Boesch C. Peak assignment in localized 1H MR spectra of human muscle based on oral creatine supplementation. Magn Reson Med. 1997;37:159–163. doi: 10.1002/mrm.1910370202. [DOI] [PubMed] [Google Scholar]
- Kruiskamp MJ, de Graaf RA, van Vliet G, Nicolay K. Magnetic coupling of creatine/phosphocreatine protons in rat skeletal muscle, as studied by 1H-magnetization transfer MRS. Magn Reson Med. 1999;42:665–672. doi: 10.1002/(sici)1522-2594(199910)42:4<665::aid-mrm7>3.0.co;2-9. [DOI] [PubMed] [Google Scholar]
- Kushmerick MJ, Moerland TS, Wiseman RW. Mammalian skeletal muscle fibers distinguished by contents of phosphocreatine, ATP and Pi. Proc Natl Acad Sci U S A. 1992;89:7521–7525. doi: 10.1073/pnas.89.16.7521. [DOI] [PMC free article] [PubMed] [Google Scholar]
- Lee YCP, Visscher MB. On the state of creatine in heart muscle. Proc Natl Acad Sci USA. 1961;47:1510–1515. doi: 10.1073/pnas.47.9.1510. [DOI] [PMC free article] [PubMed] [Google Scholar]
- McFarland EW, Kushmerick MJ, Moerland TS. Activity of creatine kinase in a contracting mammalian muscle of uniform fiber type. Biophys J. 1994;67:1912–1924. doi: 10.1016/S0006-3495(94)80674-5. [DOI] [PMC free article] [PubMed] [Google Scholar]
- Mendez J, Keys A. Density and composition of mammalian muscle. Metabolism. 1960;9:184–188. [Google Scholar]
- Meyer RA, Brown TR, Kushmerick MJ. Phosphorus nuclear magnetic resonance of fast- and slow-twitch muscle. Am J Physiol. 1985;248:C279–287. doi: 10.1152/ajpcell.1985.248.3.C279. [DOI] [PubMed] [Google Scholar]
- Meyer RA, Sweeney HL, Kushmerick MJ. A simple analysis of the ‘phosphocreatine shuttle’. Am J Physiol. 1984;15:C365–377. doi: 10.1152/ajpcell.1984.246.5.C365. [DOI] [PubMed] [Google Scholar]
- Murphy R, McConell G, Cameron-Smith D, Watt K, Ackland L, Walzel B, Wallimann T, Snow R. Creatine transporter protein content, localization, and gene expression in rat skeletal muscle. Am J Physiol. 2001;280:C415–422. doi: 10.1152/ajpcell.2001.280.3.C415. [DOI] [PubMed] [Google Scholar]
- Nicolay K, Van Dorsten FA, Reese T, Kruiskamp MJ, Gellerich JF, Van Echteld CJA. In situ measurements of creatine kinase flux by NMR. The lessons from bioengineered mice. Mol Cell Biochem. 1998;184:195–208. [PubMed] [Google Scholar]
- Ordidge RJ, Connely A, Lohman JAB. Image-selected in vivo spectroscopy (ISIS). A new technique for spatially selective NMR spectroscopy. J Magn Res. 1986;66:293–294. [Google Scholar]
- Renema WKJ, Klomp DWJ, van den Bergh AJ, Wieringa B, Heerschap A. Off resonance magnetisation transfer of creatine in human gastrocnemius muscle studied by CW irradiation. MAGMA. 2002;15(suppl. 1):272. [Google Scholar]
- Roman BB, Wiseman RW, Jayaraman R, Meyer R. Gated 31P-NMR demonstrates profound energy deficit at the onset of contractions in MM creatine kinase knockout mice. Proc Int Soc Mag Reson Med. 2002;10:1876. [Google Scholar]
- Saupe KW, Spindler M, Hopkins CA, Shen W, Ingwall JS. Kinetic, thermodynamic, and developmental consequences of deleting creatine kinase isoenzymes from the heart. J Biol Chem. 2000;275:19 742–19 746. doi: 10.1074/jbc.M001932200. [DOI] [PubMed] [Google Scholar]
- Saupe KW, Spindler M, Tian R, Ingwall JS. Impaired cardiac energetics in mice lacking muscle-specific isoenzymes of creatine kinase. Circ Res. 1998;82:898–907. doi: 10.1161/01.res.82.8.898. [DOI] [PubMed] [Google Scholar]
- Savabi F. Free creatine available to the creatine phosphate energy shuttle in isolated rat atria. Proc Natl Acad Sci U S A. 1988;85:7476–7480. doi: 10.1073/pnas.85.20.7476. [DOI] [PMC free article] [PubMed] [Google Scholar]
- Schultz E, McCormick KM. Skeletal muscle satellite cells. Rev Physiol Biochem Pharmacol. 1994;123:213–257. doi: 10.1007/BFb0030904. [DOI] [PubMed] [Google Scholar]
- Shoubridge EA, Bland JL, Radda GK. Regulation of creatine kinase during steady-state isometric twitch contraction in rat skeletal muscle. Biochim Biophys Acta. 1984;805:72–78. doi: 10.1016/0167-4889(84)90038-7. [DOI] [PubMed] [Google Scholar]
- Sjogaard G, Saltin B. Extra- and intracellular water spaces in muscles of man at rest and with dynamic exercise. Am J Physiol. 1982;243:R271–280. doi: 10.1152/ajpregu.1982.243.3.R271. [DOI] [PubMed] [Google Scholar]
- Steeghs K. Consequences of Creatine Kinase Deficiencies in Mice. Nijmegen, The Netherlands: University of Nijmegen; 1995. [Google Scholar]
- Steeghs K, Benders A, Oerlemans F, de Haan A, Heerschap A, Ruitenbeek W, Jost C, van Deursen J, Perryman B, Pette D, Brueckwilder M, Koudijs J, Jap P, Veerkamp JH, Wieringa B. Altered Ca2+ responses in muscles with combined mitochondrial and cytosolic creatine kinase deficiencies. Cell. 1997;89:93–103. doi: 10.1016/s0092-8674(00)80186-5. [DOI] [PubMed] [Google Scholar]
- Steeghs K, Oerlemans F, de Haan A, Heerschap A, Verdoodt L, de Bie M, Ruitenbeek W, Benders A, Jost C, van Deursen J, Tullson P, Terjung R, Jap P, Jacob W, Pette D, Wieringa B. Cytoarchitectural and metabolic adaptations in muscles with mitochondrial and cytosolic creatine kinase deficiencies. Mol Cell Biochem. 1998;184:183–194. [PubMed] [Google Scholar]
- Trask RV, Billadello JJ. Tissue-specific distribution and developmental regulation of M and B creatine kinase mRNA's. Biochim Biophys Acta. 1990;1049:182–188. doi: 10.1016/0167-4781(90)90039-5. [DOI] [PubMed] [Google Scholar]
- Trump ME, Hanstock CC, Allen PS, Gheorghiu D, Hochachka PW. An 1H-MRS evaluation of the phosphocreatine/creatine pool (tCr) in human muscle. Am J Physiol. 2001;280:R889–896. doi: 10.1152/ajpregu.2001.280.3.R889. [DOI] [PubMed] [Google Scholar]
- van Deursen J, Heerschap A, Oerlemans F, Ruitenbeek W, Jap P, ter Laak H, Wieringa B. Skeletal muscles of mice deficient in muscle creatine kinase lack burst activity. Cell. 1993;74:621–631. doi: 10.1016/0092-8674(93)90510-w. [DOI] [PubMed] [Google Scholar]
- van Deursen J, Ruitenbeek W, Heerschap A, Jap P, ter Laak H, Wieringa B. Creatine kinase (CK) in skeletal muscle energy metabolism: a study of mouse mutants with graded reduction in muscle CK expression. Proc Natl Acad Sci U S A. 1994;91:9091–9095. doi: 10.1073/pnas.91.19.9091. [DOI] [PMC free article] [PubMed] [Google Scholar]
- van Deursen J, Wieringa B. Targeting of the creatine kinase M gene in embryonic stem cells using isogenic and nonisogenic vectors. Nucl Acids Res. 1992;20:3815–3820. doi: 10.1093/nar/20.15.3815. [DOI] [PMC free article] [PubMed] [Google Scholar]
- van Dorsten FA, Reese T, van Echteld CJA, Nederhoff MGJ, Nicolay K. In vivo fluxes through mitochondrial and cytoplasmic creatine kinase. P31 NMR of skeletal and cardiac muscle from transgenic mice. New York: 1996. [Google Scholar]
- Veech RL, Lawson JWR, Cornell NW, Krebs HA. Cytosolic phosphorylation potential. J Biol Chem. 1979;254:6538–6547. [PubMed] [Google Scholar]
- Wallimann T, Wyss M, Brdiczka D, Nicolay K, Eppenberger HM. Intracellular compartmentation, structure and function of creatine kinase isoenzymes in tissues with high and fluctuating energy demands: the phosphocreatine circuit for cellular energy homeostatis. Biochem J. 1992;281:21–40. doi: 10.1042/bj2810021. [DOI] [PMC free article] [PubMed] [Google Scholar]
- Walsh B, Tonkonogi M, Soederland K, Hultman E, Saks S, Sahlin K. The role of phosphorylcreatine and creatine in the regulation of mitochondrial respiration in human skeletal muscle. J Physiol. 2001;537:971–978. doi: 10.1111/j.1469-7793.2001.00971.x. [DOI] [PMC free article] [PubMed] [Google Scholar]
- Watchko JF, Daood MJ, LaBella JJ. Creatine kinase activity in rat skeletal muscle relates to myosin phenotype during development. Pediat Res. 1996;40:53–58. doi: 10.1203/00006450-199607000-00010. [DOI] [PubMed] [Google Scholar]
- Wiseman RW, Kushmerick MJ. Creatine kinase equilibration follows solution thermodynamics in skeletal muscle. 31P NMR studies using creatine analogs. J Biol Chem. 1995;270:12428–12438. doi: 10.1074/jbc.270.21.12428. [DOI] [PubMed] [Google Scholar]
- Wyss M, Kaddurah-Daouk R. Creatine and creatinine metabolism. Physiol Rev. 2000;80:1107–1213. doi: 10.1152/physrev.2000.80.3.1107. [DOI] [PubMed] [Google Scholar]
- Zuurveld JG, Wirtz P, Loermans HM, Veerkamp JH. Postnatal growth and differentiation in three hindlimb muscles of the rat. Characterization with biochemical and enzyme-histochemical methods. Cell Tissue Res. 1985;241:183–192. doi: 10.1007/BF00214640. [DOI] [PubMed] [Google Scholar]