

Abstract
Neurotransmitter release in response to a single action potential has a precise time course. A significant fraction of the releasable vesicles is exocytosed synchronously, within a few milliseconds after the arrival of an action potential. If repeatedly activated, stimulus-locked phasic synchronous release declines, but synaptic transmission can be maintained through tonic asynchronous transmitter release. The desynchronisation of release during repetitive activation is generally attributed to a build-up of intraterminal Ca2+ concentration. However, the precise relationship between presynaptic Ca2+ level and asynchronous release rate at small central synapses has remained unclear. Here we characterise this relationship for single GABAergic terminals in rat collicular cultures. In the presence of tetrodotoxin, inhibitory postsynaptic currents (IPSCs) and presynaptic Ca2+ transients were recorded in response to direct presynaptic depolarisation of individual boutons. Repetitive stimulation indeed resulted in a shift from phasic to asynchronous neurotransmitter release. A clear dominance of the asynchronous release mode was observed after 10 pulses. The steady-state asynchronous release rate showed a third-power dependency on the presynaptic Ca2+ concentration, which is similar to that of evoked release. The Ca2+ sensor for asynchronous release exhibited a high affinity for Ca2+ and was far from saturation. These properties of the Ca2+ sensor should make the asynchronous release very sensitive to any modification of presynaptic Ca2+ concentration, including those resulting from changes in presynaptic activity patterns. Thus, asynchronous release represents a powerful but delicately regulated mechanism that ensures the maintenance of appropriate inhibition when the readily releasable pool of vesicles is depleted.
The invasion of a synaptic terminal by an action potential results in a rapid increase of presynaptic Ca2+ concentration ([Ca2+]pre). The latter triggers the fusion of synaptic vesicles with the synaptic plasma membrane and the release of neurotransmitter into the synaptic cleft (Katz, 1969). This phasic release is thought to be triggered by a brief, localised [Ca2+] increase in the vicinity of open, presynaptic Ca2+ channels. Unfortunately, the rapidly decaying, local Ca2+ signal that triggers vesicle fusion in presynaptic terminals cannot be resolved with the imaging techniques available. Modelling studies predicted that the Ca2+ sensor for vesicle fusion is activated by local [Ca2+]pre elevations above 100 μm (Simon & Llinas, 1985; Zucker & Fogelson, 1986; Augustine et al. 1991; Llinas et al. 1995; Neher, 1998). However, the Ca2+ dependence of transmitter release is determined not only by the Ca2+ affinities of the Ca2+ sensors, but also by the topography of the sites of Ca2+ influx and Ca2+ sensors (Meinrenken et al. 2002). Recently, the Ca2+ sensitivity of glutamate release was measured directly in a giant synapse in the auditory brainstem (the calyx of Held) using laser (Bollmann et al. 2000) or flash (Schneggenburger & Neher, 2000) Ca2+ photolysis. The results showed that a step-like [Ca2+]pre elevation to only 10 μm was sufficient to induce fast transmitter release with the capacity to deplete about 80 % of the available vesicle pool.
In contrast to large synapses, like the calyx of Held, most axonal terminals in the central nervous system (CNS) are small, with a typical volume of about 1 μm3. This miniaturisation imposes constraints on studies of transmitter release. Therefore, a quantitative description of the Ca2+ dependence of phasic release in small CNS terminals remains problematic. However, in many preparations, rapid phasic release is followed by a tail of miniature-like events (del Castillo & Katz, 1954; Goda & Stevens, 1994; Ravin et al. 1997; Atluri & Regehr, 1998; Jensen et al. 2000; Lu & Trussell, 2000; Oleskevich & Walmsley, 2002). This delayed release is driven by bulk [Ca2+]pre (Kamiya & Zucker, 1994; Cummings et al. 1996; Ravin et al. 1997; Jensen et al. 2000). Furthermore, during repetitive firing or stimulation (i.e. under conditions that lead to depletion of the readily releasable vesicle pool, RRP), synapses may switch to the asynchronous mode of release (Lu & Trussell, 2000). When the stimulation is long enough, both [Ca2+]pre and the rate of vesicle release reach a steady-state level. This offers an opportunity to investigate the relationship between [Ca2+]pre and asynchronous release under quasi-stationary conditions. Using this approach, the affinity of the Ca2+ sensor for asynchronous release in neuromuscular junctions was shown to be in a lower micromolar range (Ravin et al. 1997; Angleson & Betz, 2001).
In low-density cultures from central nervous structures, individual boutons can be selectively activated by focal electrical stimulation. Simultaneous recordings of presynaptic Ca2+ responses and respective inhibitory GABAergic postsynaptic currents (IPSCs) provide an opportunity to shed light on the link between pre- and postsynaptic sites at individual inhibitory synaptic contacts (Kirischuk et al. 1999a,b, 2002; Kirischuk & Grantyn, 2002). The present work pursued two goals: (1) to determine the activation patterns that lead to a shift from phasic to asynchronous neurotransmitter release, and (2) to estimate the Ca2+ sensitivity of asynchronous release.
METHODS
Cultures
Cell cultures were prepared as described before (Perouansky & Grantyn, 1989). Neonatal rats were anaesthetised with ether before decapitation. The superior colliculi of embryonic day 21 rats were removed and dissociated. The neurones were grown at low density (about 5000 cells cm−2) on laminin-coated glass coverslips. Experiments were performed on cultures between 14 and 21 days in vitro. All experiments were carried out according to the guidelines laid down by the Landesamt für Arbeitsschutz, Gesundheitsshutz und technische Sicherheit Berlin (T0406/98).
Imaging
A detailed description of the method used is given elsewhere (Kirischuk et al. 1999b). Briefly, cultures were incubated in standard extracellular solution (mm: 140 NaCl, 3 KCl, 1 MgCl2, 2 CaCl2, 20 Hepes, 30 glucose; pH set to 7.4 with NaOH) supplemented with either Magnesium Green-AM (MG-AM) or Oregon Green 488 BAPTA-5N-AM (OGB-5N-AM, 5 μm, 30 min at 36 °C) and then kept for an additional 20 min in standard saline to ensure de-esterification. Next, synaptic vesicles were stained with a fluorescent marker. FM4–64 was loaded in two steps. Cultures were incubated first in solution containing high K+ (50 mm) and FM4–64 (10 μm) for 1 min, and were then switched to extracellular solution containing FM4–64 (10 μm) for a further 1 min, before being washed twice in extracellular solution alone. The coverslip with the stained cultures formed the bottom of a recording chamber on the stage of an inverted microscope (Axiovert 100, Zeiss, Jena, Germany). A × 100 phase contrast, oil-immersion objective with a numerical aperture of 1.3 (Zeiss) was used in all experiments. The excitation wavelengths were controlled by a fast monochromator system, and fluorescence signals were recorded using a CCD camera (TILL Photonics, Munich, Germany). All measurements were performed using 4 × 4 binning (1 pixel = 0.4 μm × 0.4 μm). The acquisition rate for [Ca2+] measurement was one image per 50 ms. The probes were excited at 490 nm. The excitation and emission light was separated using a 510 nm dichroic mirror. The emitted light was filtered at 550 ± 30 nm for Ca2+-sensitive probes and at 600 nm for FM4-64. Phase contrast and FM4–64 images were captured at the beginning of each experiment. The FM4–64 image was converted to binary format using a threshold set to half-maximal intensity above the background. The binary image was used as a mask (by multiplication) to define the presynaptic region of interest for subsequent MG or OGB-5N images. The background fluorescence originating from glial cells was calculated from a region in the immediate vicinity of the stimulated bouton and subtracted. To decrease contamination of the presynaptic signal by fluorescence from the underlying dendrite, all measurements were performed after at least 15 min dialysis of the postsynaptic neurone. Fluorescence signals are expressed as the relative change from the prestimulus level (ΔF/F0).
Patch-clamp recordings
Whole-cell patch-clamp recordings were performed using glass pipettes containing (mm): 100 potassium gluconate, 50 KCl, 5 NaCl, 2 MgCl2, 1 CaCl2, 10 EGTA and 20 Hepes; the pH was set to 7.2 with KOH. The holding potential was −70 mV, and the ECl was about −20 mV. Signals were acquired at 10 kHz using an EPC-7 patch-clamp amplifier and TIDA 3.7 acquisition software (HEKA Electronics, Lambrecht/Pfalz, Germany). Series resistance (10–25 MΩ) was compensated up to 70 %.
Selection and stimulation of synaptic boutons
All experiments were carried out on well-isolated GABAergic axodendritic boutons (about 1 μm in diameter) located on the side of a first order dendrite (Fig. 1A and B). The stimulating pipette was placed at a distance of approximately 1 μm from an FM4-64-labelled terminal (Fig. 1A–C), and an isolated stimulator delivered short depolarising pulses. The following precautions ensured that only one bouton was activated at a time (Kirischuk et al. 1999b). The selected bouton was always > 2 μm away from its closest FM4-64-labelled neighbour. A small (≈1 μm) displacement of the stimulation pipette reversibly abolished both the Ca2+ transient and the evoked IPSC. A Ca2+ response was detected only in the stimulated boutons.
Figure 1. Simultaneous recording of presynaptic Ca2+ ([Ca2+]pre) transients and inhibitory postsynaptic currents.
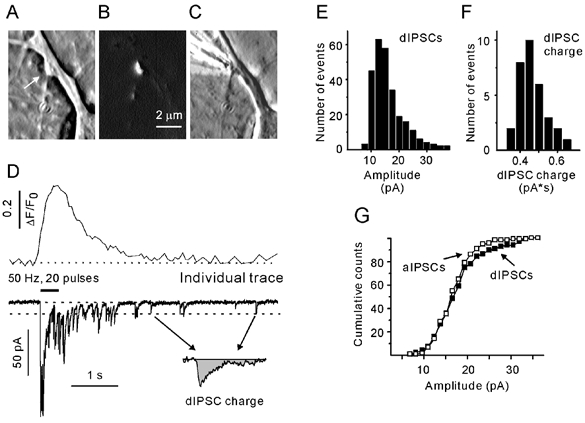
Phase contrast (A) and FM4–64 images (B) of a single terminal (arrow). C, phase contrast image showing a stimulation pipette in close proximity to a terminal. D, single [Ca2+]pre transient and postsynaptic response induced by focal stimulation of a bouton with 20 standard pulses at 50 Hz. The dotted line at the current traces indicate the average amplitude of delayed IPCSs (dIPSCs). The origin of the arrows corresponds to dIPSCs selected for the calculation of dIPSC charge transfer (inset). E and F, amplitude histograms of dIPSCs (E) and dIPSC charge transfer (F). G, cumulative probability histograms of dIPSCs (filled) and asynchronous IPSCs (aIPSCs; open symbols). All data were obtained from the same synapse.
In the presence of tetrodotoxin (TTX) and antagonists of ionotropic glutamate receptors, the focal stimulation of an individual bouton resulted in a postsynaptic chloride current. The GABAergic nature of the synaptic response was identified by its sensitivity to bicuculline (10 μm), slow time course and reversal at the chloride equilibrium potential (not illustrated). We have shown previously that a 2 ms, 2 μA pulse induces a [Ca2+]pre elevation that is similar to the Ca2+ increase caused by an action potential (Kirischuk et al. 2002). Therefore, a 2 ms, 2 μA pulse was selected as the standard single-terminal stimulus for all experiments, unless otherwise stated. The period between successive trains of stimuli was at least 1 min.
Selection of stimulation protocol
A stimulation protocol must satisfy the following criteria: (1) it should not modify the postsynaptic cell and (2) it should lead to conditions at which both asynchronous release and [Ca2+]pre remain at quasi-stationary levels. Steady-state conditions could be reached by applying a high-frequency stimulation (Ravin et al. 1997) or by using local application of elevated extracellular KCl or ionomycin (Angleson & Betz, 2001). Both approaches have advantages and disadvantages. The efficacy of individual stimuli may fluctuate during a high-frequency train, increasing the [Ca2+]pre variability. Application of a Ca2+ ionophore-containing or hyperkalaemic solution appears to provide a reliable way to elicit steady-state [Ca2+]pre elevations, but it affects the postsynaptic cell, inducing, for instance, a postsynaptic [Ca2+] elevation. In contrast, local electrical stimulation only slightly affects postsynaptic [Ca2+] (Kirischuk et al. 1999b) and does not activate any significant voltage-dependent postsynaptic conductance (results from three experiments performed in Ca2+-free solution, data not shown). As GABAA receptors were reported to be sensitive to intracellular [Ca2+] (Inoue et al. 1986), we selected local electrical stimulation to induce presynaptic Ca2+ influx in individual boutons (but also see Discussion).
Analysis of synchronous, asynchronous and delayed release
Figure 1D shows a presynaptic Ca2+ transient and a corresponding trace of the postsynaptic chloride current in response to a train of 20 pulses at 50 Hz. Repetitive stimulation causes a compound postsynaptic response. IPSCs that peak within a 3 ms interval following the end of a stimulus pulse will be referred to as synchronous, evoked IPSCs (eIPSCs). All other events during a train will be referred to as asynchronous IPSCs (aIPSCs). IPSCs that were generated after the termination of stimulation will be referred to as delayed IPSCs (dIPSCs). As miniature IPSC (mIPSC) frequencies are quite low (< 0.5 s−1) in these low-density cultures, a possible contribution of mIPSCs stemming from other contacts was ignored.
To make the values obtained from different boutons comparable, eIPSCs were normalised to the mean amplitude of delayed IPSCs (dIPSC) induced at the same synapse (Fig. 1E). The mean amplitude of dIPSCs varied from cell to cell (ranging from 12 to 43 pA). The value of normalised eIPSC amplitude was used as an estimate of the number of released vesicles per stimulus (Schneggenburger et al. 1999).
The delayed response (DR) was defined as the area under a current trace calculated over the first 3 s after the termination of stimulation. The asynchronous response was defined as the average charge transfer per second calculated over the second half of the stimulation period (for a more precise definition see Results). Stimulus-related capacitance artefacts exhibited a decay time constant of about 1 ms. Therefore, to minimise contamination of the measured parameters by stimulation artefacts, the first 5 ms after the onset of a pulse was excluded from analysis. For each cell, the average dIPSC charge transfer was calculated using well separated individual dIPSCs (Fig. 1D and E) that had an amplitude close to the mean dIPSC amplitude (Fig. 1D, inset). The distribution of dIPSC charge was almost Gaussian (Fig. 1F). There was no significant difference between the mean amplitudes of aIPSCs and dIPSCs (Fig. 1G, n = 6). The separation of dIPSCs and aIPSCs was made according to the time of their appearance and does not imply that different processes govern the respective release events. To make asynchronous and delayed responses independent of the kinetic properties of IPSCs, both parameters were normalised to the mean dIPSC charge obtained from the same postsynaptic cell. It should be noted that the normalised asynchronous response has the dimension ‘s−1‘, and will be referred to as the asynchronous release rate (ARR).
Superfusion
All experiments were performed at room temperature (23–25 °C). A slow superfusion system with a flow rate of 0.5 ml min−1 was used. To test the effect of Ca2+-free or Sr2+-containing solution, a glass superfusion pipette (40 μm tip diameter) was placed at a distance of about 50 μm. The Ca2+-free solution contained 2.5 mm MgCl2, no added Ca2+ and no EGTA. In Sr2+-containing solution, Ca2+ was replaced by Sr2+ at equimolar concentration. TTX (1 μm) was added to prevent action potential generation. dl-2-Amino-5-phosphonopentanoic acid (50 μm) and 6,7-dinitroquinoxaline-2,3-dione (10 μm) were added to prevent glutamatergic synaptic transmission. Magnesium Green-AM, Oregon Green BAPTA 488-5N-AM and FM4–64 were obtained from Molecular Probes (Eugene, OR, USA). All other chemicals were from Sigma-Aldrich (Deisenhofen, Germany).
Data analysis and statistics
IPSCs were analysed using the software PeakCount V2.02 (C. Henneberger, Berlin, Germany). The software employed a derivative threshold-crossing algorithm to detect IPSCs. Each automatically detected event was displayed that allowed visual inspection. Rise times and decay time (a single exponential fit) constants of individual IPSCs were calculated. When quantal events overlapped, their decays were obscured and, therefore, respective dIPSCs were not analysed. All results are presented as means ±s.e.m., with n indicating the number of boutons tested. The error bars in all figures indicate s.e.m. All comparisons between means were tested for significance using Student's unpaired t test, unless otherwise stated.
RESULTS
To examine the temporal relationship between IPSC occurrence and electrical stimulation, we applied trains of 20 pulses at 50 Hz and aligned the responses to the onset of each stimulus. Figure 2A and B shows that the IPSC patterns were quite different during the first five and the last 10 stimulation intervals. Early in the train, IPSCs peaked within the first 3 ms after the termination of stimulus, reflecting the predominantly synchronous mode of release. Later in the train, IPSCs occurred at almost any time (Fig. 2B and C), reflecting the predominantly asynchronous mode of release.
Figure 2. Desynchronisation of neurotransmitter release during a train of stimuli.

A and B, examples of IPSCs during a 50 Hz train. IPSCs after each stimulus were aligned to the onset of the stimulation artefact. Comparing responses to stimuli 1–5 (A) and 10–20 (B) reveals asynchrony in B. C, latency distribution of aIPSCs for stimuli 10–20.
Dynamics of asynchronous release
Next we wanted to determine the conditions under which the asynchronous mode predominates. As generation of asynchronous IPSCs was paralleled by an augmentation of delayed release (Jensen et al. 2000; Lu & Trussell, 2000), pulse trains of increasing duration (3, 5, 7, 10, 15 and 20 stimuli) were delivered to a terminal at 20, 50 (Fig. 3A) and 100 Hz, and the DR was calculated. Figure 3B shows that at all tested frequencies, the DR reached a plateau after 10 pulses. We conclude that the DR is fully developed after 10–15 stimuli.
Figure 3. Transition into an asynchronous mode of transmission requires 10 pulses.
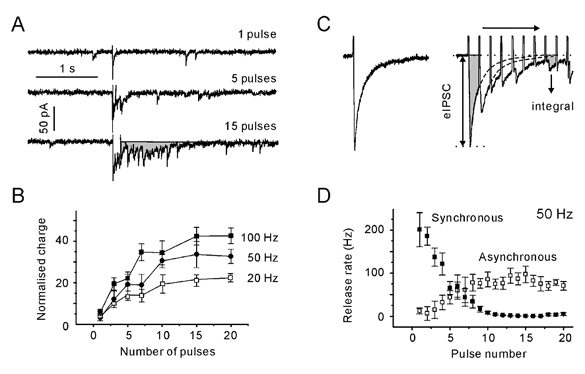
A, postsynaptic responses elicited with a single pulse and with 50 Hz trains of 5 and 15 pulses. The shaded area represents the delayed response. B, dependence of normalised charge transferred after the termination of stimulation on the number of pulses in a train. The delayed response was normalised to the mean charge of the dIPSCs. Note that regardless of the stimulation frequency, the transferred charge reaches a plateau after 10 stimuli. All data points are averages from five synapses. C, individual synchronous, evoked IPSC (eIPSC) and IPSCs evoked with a 50 Hz train. eIPSCs were assumed to decay with a typical single exponential time constant. The latter was determined by a single exponential fitting of the decay phase of pretetanic eIPSCs. eIPSCs were constructed using the eIPSC waveform as a template (dotted lines). The total evoked response was constructed by adding the contribution from each eIPSC. The reconstructed eIPSC response was integrated to obtain the synchronous charge transfer. The difference between the observed (shaded areas) and constructed current integrals represents the charge transferred by the asynchronous release. D, synchronous and asynchronous release rates during a 50 Hz stimulation. The release rates were obtained by dividing the synchronous/asynchronous charge per second by the mean charge of the dIPSC. Data points are averages from five synapses. Note that the frequency of asynchronous release reached a steady state after 10 pulses.
Is the above conclusion also valid for the asynchronous release during the train? The impact of asynchronous release was assessed in the following way. We assumed that after each stimulus, eIPSCs rose instantaneously and decayed with a typical single exponential time constant. The latter was determined by a single exponential fitting of the decay phase of pretetanic eIPSCs. Using the typical eIPSC waveform as a template and considering the amplitudes of individual eIPSCs during the train (Fig. 3C), the compound evoked response was constructed by adding the contribution from each consecutive eIPSC. The reconstructed eIPSC response was integrated (Microsoft Excel 97), providing the synchronous charge transfer. The difference between the total (observed) and stimulus-locked (constructed) current integrals represents the charge transfer attributed to asynchronous release. During a 50 Hz train, the impact of synchronous release approached zero and asynchronous release reached a plateau with a lag of about 10 pulses (Fig. 3D). Similar results were obtained for all frequencies (> 10 Hz) tested (data not shown). In this regard asynchronous release behaves like delayed release. We can conclude that the full shift from the synchronous to the asynchronous mode of transmission is accomplished after 10 pulses
Dependence of asynchronous release on stimulation frequency
Figure 4A shows postsynaptic responses elicited with 80 pulse trains delivered to a terminal at increasing rates (20, 50 and 100 Hz). The asynchronous response was defined as the average normalised charge transfer rate calculated over the second half of the stimulation train (40 pulses). The ARR varied dramatically between terminals (Fig. 4B). For example, the ARR ranged from 4 to 167 s−1 (n = 19) when activated with 100 Hz trains. The observed interbouton heterogeneity of ARR could reflect the variability in the number of docking/release sites available for presynaptic vesicles. Indeed, ARR normalisation to the ARR elicited with 100 Hz trains revealed that its dependence on the stimulation frequency was quite similar in different terminals (Fig. 4C). A strong frequency dependence of the ARR was observed between 10 and 50 Hz. A further increase of the stimulation frequency induced little ARR increment.
Figure 4. Dependence of the asynchronous release rate (ARR) on stimulation frequency.
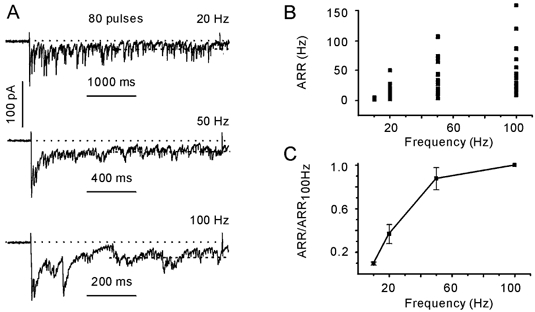
A, examples of IPSCs evoked with 80 pulses delivered at 20, 50 and 100 Hz. Data from the same cell. B, interbouton variability of ARRs. Data obtained from 19 presynaptic terminals. C, dependence of the ARR on stimulation frequency. For each cell, values of ARRs were normalised to the ARR elicited with a 100 Hz train. Same data set as in B.
Normalisation of ARRs
In principle, the ARR should be dependent on at least two parameters: the number of release sites available for asynchronous release and the rate of vesicle recruitment. We can assume that the former is not dependent on [Ca2+]pre (see below). Therefore, to study the Ca2+ dependence of asynchronous release, it is preferable to normalise the obtained ARR values to the number of docking/release sites (N). As N is difficult to measure directly, the size of the RRP has been used to obtain an approximate mean value of N. Repetitive stimulation induces a strong depression of eIPSC amplitudes. Assuming that this depression is largely caused by a transient decrease in the number of readily releasable quanta, it is possible to estimate the RRP on the basis of cumulative eIPSC amplitudes (Schneggenburger et al. 1999; Kirischuk & Grantyn, 2000; Lu & Trussell, 2000). Cumulative eIPSC amplitudes were plotted versus stimulus number (Fig. 5A and B). After 10 pulses, the cumulative eIPSCs reached a steady state, as indicated by the linear slope dependency of the cumulative eIPSC amplitude on the pulse number. Assuming that the linear component reflects vesicle recycling, back-extrapolation to the start of the train gives an estimate for the cumulative eIPSC amplitude in the absence of pool replenishment. If the above approach is correct, the estimate of the RRP must be independent of the stimulation frequency. Figure 5C shows that this was the case. The RRP was estimated to contain 6.3 ± 0.8, 6.7 ± 0.9, 6.4 ± 0.8 and 6.2 ± 0.7 vesicles when stimulated at 10, 20, 50 and 100 Hz, respectively (n = 7, P > 0.1, Student's paired t test).
Figure 5. Estimation of the size of the readily releasable pool (RRP) at individual boutons.
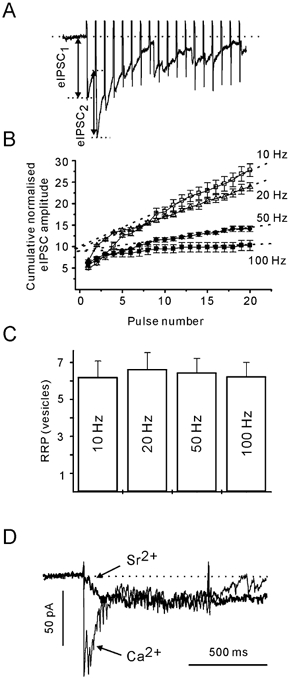
A, postsynaptic responses to first 15 stimuli of a 50 Hz train. B, peak eIPSC amplitude values were summed to determine the cumulative eIPSC amplitude during trains of different frequencies. Evoked IPSCs were normalised to the mean dIPSC amplitude. Each data point is an average of three trials. Data from the same cell. Data points during a steady state phase (from the 10th to the 20th pulse) were fitted by linear regression (dotted lines), and back-extrapolated to time 0. The intersects provide an estimate of the number of available vesicles. C, RRP size does not depend on stimulation frequency. Shown data are from seven cells. D, the ARR is not modified by the substitution of Sr2+ (thick line) for extracellular Ca2+ (thin line). Each trace is an average of five responses.
The use of the RRP as a normalising factor for the ARR would be precluded if synchronously and asynchronously released vesicles originated from different pools. This could be tested. Replacement of extracellular Ca2+ by Sr2+ was shown to result in a significant suppression of the stimulus-locked postsynaptic response, while the contribution of delayed postsynaptic responses increases (Dodge et al. 1969; Mellow et al. 1982; Augustine & Eckert, 1984; Goda & Stevens, 1994; Rumpel & Behrends, 1999; Xu-Friedman & Regehr, 2000). If phasic and asynchronous release were mediated by vesicles from different pools, replacement of Ca2+ by Sr2+ should lead to an increase in the ARR. This was not the case. Phasic release was indeed strongly suppressed in Sr2+-containing solution, but the ARR was not affected (Fig. 5D). For example, if stimulated at 50 Hz, ARRs were 15 ± 4 and 16 ± 3 s−1 in Ca2+- and Sr2+-containing solution, respectively (P > 0.1, n = 6, Students's paired t test). We conclude that ARR could be normalised to the RRP estimate from the same bouton, thereby correcting for the pool size variability between terminals.
[Ca2+]pre responses
[Ca2+]pre transients were measured during trains of constant frequency (10, 20, 50 and 100 Hz). [Ca2+]pre rapidly reached a steady state (after about 20 pulses) and then fluctuated around a plateau level that depended on the stimulation frequency (Fig. 6A). As the acquisition rate was one image per 50 ms and the number of pulses in a train was set to 80, only 16 experimental points were acquired during a 100 Hz train. To exclude that the amplitudes of [Ca2+]pre transients were underestimated, trains of 200 pulses were tested as well. No additional [Ca2+]pre increase was observed (n = 3, data not shown). Therefore, a plateau level of [Ca2+]pre was defined as the average fluorescence signal during the last half of the stimulation trains (40 pulses). The amplitude of train-induced [Ca2+]pre elevation varied dramatically between terminals (Fig. 6B). The observed heterogeneity of [Ca2+]pre transients presumably reflects the interbouton variability of single pulse-induced [Ca2+]pre transients (Kirischuk & Grantyn, 2002). Indeed, normalisation to the amplitude of the [Ca2+]pre transient elicited by a 100 Hz train revealed that the dependence of [Ca2+]pre increase on the stimulation frequency was quite similar in different terminals (Fig. 6C). A 10 Hz train only induced a slight [Ca2+]pre elevation. Stimulation frequencies of 20 or 50 Hz resulted in a substantially higher [Ca2+]pre rise, but further frequency increase produced little additional increment in the [Ca2+]pre responses.
Figure 6. [Ca2+]pre responses exhibit a non-linear dependency on stimulation frequency.
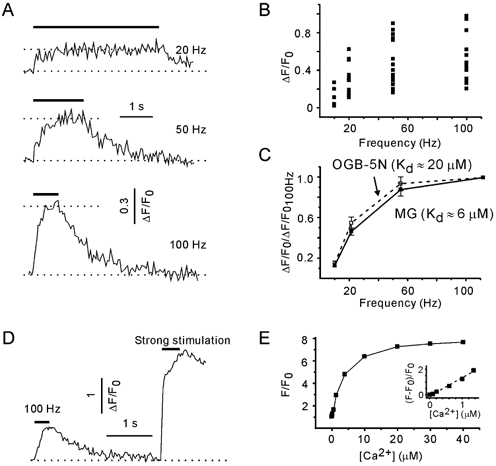
A, examples of [Ca2+]pre transients induced with 20, 50 and 100 Hz trains. Data from the same synapse. [Ca2+]pre transients were visualised using Magnesium Green (MG). B, interbouton variability of [Ca2+]pre responses. Data obtained from 13 presynaptic terminals. C, dependence of [Ca2+]pre plateau levels on the stimulation frequency. For each synapse, [Ca2+]pre responses were normalised to the peak amplitude of [Ca2+]pre at 100 Hz. Same data as in B. Oregon Green 488 BAPTA-5N (OGB-5N), a Ca2+ probe with lower affinity, did not modify the frequency dependence (five boutons). D, a train of stronger pulses induced a much larger (although irreversible) elevation of presynaptic fluorescence than a 100 Hz train with standard pulses. E, calibration curve for MG. Calibration was performed in vitro using droplets of solutions containing 10 μm MG-K5 and variable Ca2+ concentrations. F0 is the fluorescence of MG in Ca2+-free solution. Inset, expansion of the lower part of the curve with a modified y-axis. Note the linear relationship between ΔF/F0 and [Ca2+] (dotted line).
The affinity of MG for Ca2+ is reported to be about 6 μm (Molecular Probes catalogue). The [Ca2+]pre elevation in response to a long, high-frequency train can potentially saturate the Ca2+ indicator. To examine this possibility, the cultures were loaded with another Ca2+ probe, Oregon Green 488 BAPTA-5N (OGB-5N). The latter is reported to have an affinity for Ca2+ of 20 μm (Molecular Probes catalogue) or even 32 μm (DiGregorio & Vergara, 1997). Figure 6C shows that the relationship between the peak amplitude of [Ca2+]pre and the stimulation frequency was not dependent on the indicator. In five experiments, a control pulse train was followed by a test train of stronger (4 μA) pulses. The [Ca2+]pre elevations elicited with a train of strong shocks were irreversible, presumably reflecting bouton damage (Fig. 6D). The mean increase in the fluorescence signal was 3.5 ± 0.5 (range 3–4.5), which is much higher than the maximal experimental values. Next, we performed in vitro calibration of the MG signals. The fluorescence signals were measured using droplets of solutions containing different Ca2+ concentrations (0–39 μm, Calibration Buffer Kit 2, Molecular Probes) and supplemented with 10 μm of MG-K5 (Fig. 6E). The maximum:minimum fluorescence ratio for MG in vitro was 7.7. We conclude that under given experimental conditions, MG is still far from saturation and, regardless of the stimulation frequency, [Ca2+]pre levels reach a steady state during trains of 80 pulses.
In the present study, [Ca2+]pre was measured by means of the non-ratiometric Ca2+-sensitive indicator MG. Consequently, a linear dependence of obtained fluorescence changes (ΔF/F0) and [Ca2+] is of particular importance, while any non-linearity will, in turn, have an effect on the ARR-[Ca2+]pre relationship. The power function fitting of the lower part (ΔF/F0 from 0 to 2) of the calibration curve had an exponent of 1.1 ± 0.1 (Fig. 6E, inset). Thus, the relationship was indeed close to linear for the observed fluorescence changes.
The ARR exhibits a third-power function dependence on [Ca2+]pre
First, the relationship between ARR and [Ca2+]pre was investigated at individual boutons. The ARR increased in a non-linear fashion as [Ca2+]pre rose (Fig. 7A). The power function fitting the data points had an exponent of 2.8 ± 0.5 (range 2.1–3.9, n = 13). Next, ARRs were normalised to the RRPs. The power function fitting the pooled data set revealed an exponent of 2.6 ± 0.3 (Fig. 7B), which is close to the mean value obtained from individual boutons (i.e. before normalisation to the RRPs). This result represents an additional piece of evidence supporting the use of the RRP value for the normalisation of the ARR.
Figure 7. Relationship between [Ca2+]pre and ARR.

A, dependence of ARR on the peak amplitude of [Ca2+]pre elevation. Different symbols represent data obtained from different boutons. B, ARR as a function of [Ca2+]pre (pooled results, 19 boutons). ARRs were normalised to the corresponding RRP size. The dashed line represents the power function fit. C, the delayed response decays faster than the [Ca2+]pre transient. The [Ca2+]pre trace was shifted up for clarity. Dotted lines represent the baselines for IPSCs and [Ca2+]pre. Traces represent the average of five recordings. D, correlation between decay time constants of delayed response (τDR) and [Ca2+]pre. Data from 12 boutons. The line represents a linear regression fit. E, estimation of the maximal ARR (ARRmax) and the affinity of the Ca2+ sensor (KAR). Data obtained from two boutons (filled and open squares). Linear regression fits (lines) are based on eqn (2). F, pooled data from 19 boutons. The dashed line is computed according to eqn (2).
As delayed release is driven by residual [Ca2+]pre (Katz & Miledi, 1967; Delaney & Tank, 1994; Lu & Trussell, 2000), we investigated its Ca2+ dependence. Figure 7C shows that delayed activity terminated much faster than the [Ca2+]pre transients. The decay phase of delayed release and [Ca2+]pre was fitted with a single exponent. The difference between the time constants was highly significant (P < 0.0001, 12 cells, Student's paired t test), but they were strongly correlated (r = 0.68, Fig. 7D), consistent with the notion that residual [Ca2+]pre underlies the delayed release. The slope of the linear regression line was 2.2. Assuming a power function dependence of delayed release on [Ca2+]pre, this result means that the respective exponent equals 2.2. Although the high-power law relationship between the delayed release and [Ca2+]pre under non-stationary conditions should be considered with caution (Atluri & Regehr, 1998), we may tentatively conclude that this dependence can be described as a power function with an exponent larger than 2.
Estimation of the affinity of the Ca2+ sensor for asynchronous release
The lack of clear saturation in the Ca2+ dependence of ARR prohibits a direct determination of the affinity of Ca2+ sensors for asynchronous release. However, an estimate of the Ca2+ sensitivity of asynchronous release can be obtained using the following approach. The Hill equation for the Ca2+ dependence of synaptic responses (modified eqn (2) from Dodge & Rahamimoff, 1967):
| (1) |
can be rearranged to give:
| (2) |
where ARRmax is the maximal possible frequency of asynchronous release, n is the Hill coefficient, and Kar is the half-effective Ca2+ concentration for asynchronous release (Ravin et al. 1997). In this case, however, Kar is a dimensionless parameter, because MG is a non-ratiometric Ca2+-sensitive probe. The 1/(ARR)1/nvs. 1/(ΔF/F0) plot represents a straight line with a slope of Kar/(ARRmax)1/n and a y-axis intercept of 1/(ARRmax)1/n (Ravin et al. 1997).
Based on the present results, the Hill coefficient was set to 3. Figure 7E shows the results from two boutons. The average Kar and ARRmax values were 0.6 ± 0.1 s−1 (range 0.36–1.1 s−1) and 43 ± 13 s−1 (range 17–86 s−1, n = 7). The pooled data from 19 boutons were best fitted with 0.72 and 63 s−1 for Kar and ARRmax, respectively (Fig. 7F). Two data points with fluorescence changes less than 0.05 (about the instrumental noise level) were excluded from this analysis. It is worth mentioning that amplitude of [Ca2+]pre transients induced by 100 Hz stimulation was between 0.12 and 0.95: These values are close to the Kar estimate. This result allows us to suggest that the Ca2+ sensor for asynchronous release is not saturated, at least under the conditions used in this study.
DISCUSSION
We have studied the Ca2+ dependence of asynchronous release at single GABAergic boutons during repetitive stimulation. Delayed synaptic responses were observed when individual inhibitory boutons were activated at frequencies higher than 10 Hz. During the trains, the stimulus-locked quantal release drastically declined, and vesicles were liberated asynchronously. The asynchronous mode of transmission became dominant after 10–15 pulses. These values are close to those reported for hippocampal cells (Jensen et al. 2000) and nMag neurones in the avian cochlear nucleus (Fig. 2 in Lu & Trussell, 2000). In those studies, synaptic connections were activated using action potentials. The good agreement between data obtained with action potential- or pulse-induced release lends further support to our claim that direct electrical stimulation of small terminals can be used to study particular aspects of synaptic transmission.
Phasic and asynchronous release use the same set of release sites
Because of the bleaching of the Ca2+-sensitive probe, we were only able to collect four to five experimental points per bouton. This number is too small to allow a detailed analysis of the [Ca2+]pre-ARR relationship. To circumvent this problem, a pooled data set from 13 boutons was composed by normalising the data to the size of RRP (Schneggenburger et al. 1999). This normalisation was based on the assumption that the size of the RRP determines the number of release sites available for asynchronous release (Lu & Trussell, 2000; Hagler & Goda, 2001). However, the question as to whether phasic and asynchronous release originate from the same pool has not yet been resolved. Based on the different sensitivity of phasic and asynchronous release to Sr2+, delayed release was suggested to result from the action of residual Ca2+ on a specific high-affinity sensor (Goda & Stevens, 1994; Gad et al. 1998; Zucker, 1999), presumably synaptotagmin III (Li et al. 1995). However, later investigations showed that less efficient buffering and extrusion of Sr2+ may underlie the potentiating effect of Sr2+ on asynchronous release (Rumpel & Behrends, 1999; Xu-Friedman & Regehr, 2000). In line with the latter reports, replacement of extracellular Ca2+ by Sr2+ had no effect on the steady-state level of ARR in the present study. This result allows us to suggest that during repetitive stimulation, Ca2+ and Sr2+ activate the same pool of vesicles. But would it be correct to refer to that pool as RRP? Some indirect results favour the idea. Firstly, the RRP size was not dependent on the stimulation frequency and, as a consequence, on the [Ca2+]pre level. Although one cannot completely exclude the effect of unreliability of extracellular electrical stimulation, this result supports the idea that high [Ca2+]pre does not activate additional release sites. Secondly, if distinct vesicle pools served the stimulus-locked and asynchronous modes of release, ARR normalisation to the RRP should affect the [Ca2+]pre-ARR relationship for the pooled data. However, the Hill coefficients calculated from individual and normalised pooled data sets were similar (2.8 and 2.6, respectively), while the Hill coefficient estimated from the non-normalised pooled data (1.4) differed significantly. Thus, although direct evidence is still missing, our data are consistent with the assumption that phasic and asynchronous release both originate from the same pool of vesicles in these GABAergic synapses.
Consequently, the normalised ARR is a quantitative parameter for one release site and reflects the mean time required for a vesicle to be recruited and released. The observed maximal release rate per vesicle was about 20 s−1 (i.e. the cycle time was 50 ms). At chicken calyx synapses, the vesicle recovery time during the 200 Hz trains was calculated to be 40 ms (Lu & Trussell, 2000). Our directly measured value is in good agreement with the theoretical prediction.
The Ca2+ sensor for asynchronous release exhibits a high affinity for Ca2+
Direct measurement of the half-effective Ca2+ concentration (Kar in our notation) of the Ca2+ sensor for asynchronous transmitter release has been carried out in few preparations. The Kar of the neuromuscular junction is reported to be in a range of 2–4 μm in frog (Ravin et al. 1997) or about 1 μm in crayfish (Angleson & Betz, 2001). The relatively low Ca2+ level requirement of exocytosis has also been shown in rod photoreceptor cells (Rieke & Schwartz, 1996) and in chromaffin cells (Augustine & Neher, 1992).
Our estimate of Kar is 0.7 a.u. Kar can also be estimated by using eqn (1) and the assumed value of ARRmax. At calyces of Held, the maximal release rate per vesicle measured after the depletion of RRP is reported to be about 200 s−1 (Fig. 4 in Sakaba & Neher, 2001). Therefore, ARRmax was varied between 20 (the highest value observed in this study) and 200 s−1. The resulting Kar ranged from 0.3 to 1.1. Kar increased with elevation of the assumed ARRmax value. Higher values of the Hill coefficient resulted in lower values of Kar. The Kar range obtained with this method is quite similar to that obtained from fitting the pooled experimental data with eqn (2).
The fact that the Ca2+ indicator is far from saturation (Fig. 6C and D) provides an opportunity to convert fluorescence changes (ΔF/F) to absolute [Ca2+] values using the formula (Jaffe et al. 1992):
| (3) |
where (ΔF/F)max is the maximal fluorescence change upon saturation, and KD is the affinity of MG for Ca2+. Suggesting [Ca2+]rest«KD(ΔF/F)/(ΔF/F)max and [Ca2+]i, eqn (3) simplifies as:
| (4) |
Taking values of 3.5 (Fig. 6D) and 6 μm (Molecular Probes catalogue) for (ΔF/F)max and KD, respectively, we obtain a Kar value of 1.5 μm. However, this Kar estimate is dependent on several still unclear conditions. Firstly, it is assumed that there is a linear relationship between ΔF/F and [Ca2+]pre. Although our in vitro calibration curve (Fig. 6E, inset) supports this assumption, it remains unclear whether this relationship can be extended to the in vivo situation. Secondly, the in vivo affinity of MG for Ca2+ was not determined in the present study. The in vivo KD could be two times higher than in vitro (Zhao et al. 1996). Therefore, the Kar value obtained here (1.5 μm) cannot be much more than an order estimate for the affinity of the Ca2+ sensor. In other words, in these GABAergic terminals the affinity of the Ca2+ sensor for asynchronous release should be in the lower micromolar range.
The Ca2+ sensor for asynchronous release is most likely not saturated
As the affinity of the Ca2+ sensor for asynchronous release is high, it is important to know whether it is saturated during the periods of activity. When the terminals were stimulated in standard solution, the Ca2+ dependence of ARR did not exhibit clear saturation. To induce larger [Ca2+]pre transients, two additional experiments were performed. First, terminals were stimulated with 50 Hz trains in control and in high extracellular Ca2+ (5 mm) solutions. However, the steady-state levels of [Ca2+]pre were not significantly different in normal and in elevated [Ca2+] (n = 4). Consequently, no difference was found between the ARR values in control and elevated Ca2+ solutions. The observed ceiling level of [Ca2+]pre presumably reflects the Ca2+-dependent inactivation of Ca2+ channels (Kirischuk et al. 2002). Therefore, as a next step, we used a Ca2+ ionophore, ionomycin, which induces a Ca2+-channel-independent Ca2+ influx. Ionomycin (10 μm) was applied to a synaptic terminal very locally, via a stimulation pipette. It caused an increase of [Ca2+]pre to 2.5–3 a.u., and the ARR reached 60–100 s−1 (n = 3). However, the development of [Ca2+]pre increase in the bouton was rather slow (minutes), and [Ca2+]pre elevations were also detected in neighbouring terminals. Therefore, it is quite possible that the measured ARRs represented the activity of several boutons. Thus, we have to admit than the attempts to show a non-saturation of the Ca2+ sensor directly were not successful.
Nevertheless, our data present indirect evidence against the saturation of the Ca2+ sensor. First, the ARR-[Ca2+]pre plots for individual boutons or pooled data did not exhibit a plateau (Fig. 7). Second, the measured amplitudes of Ca2+ transients were in the same order of magnitude as the affinity of the Ca2+ sensor. Although direct measurements are still required to underscore this conclusion, it seems very likely that in these GABAergic terminals the Ca2+ sensor for asynchronous transmitter release is not saturated.
Ca2+ sensitivity of asynchronous release
Provided the Ca2+ sensor for asynchronous release is not saturated, the shape of the Ca2+ dependence of asynchronous release gains additional importance. If the relationship is highly supralinear, small fluctuations in presynaptic Ca2+ levels should have strong impact on synaptic strength. Both delayed and asynchronous release exhibited a non-linear dependence on the [Ca2+]pre in our preparation. The power function fitting revealed an exponent of 2.2 and 2.8 for delayed and asynchronous release, respectively. It may well be that the smaller exponent for delayed release results from our attempt to link two non-stationary processes: delayed release and decay of [Ca2+]pre. The relationship may also contain a time-dependent component, as was suggested for cerebellar synapses (Atluri & Regehr, 1998). We therefore suggest that the exponent of this power function is closer to 3. Interestingly, the cooperativity of Ca2+ binding is similar to that previously obtained for stimulus-locked IPSCs (Kirischuk et al. 1999a). The Ca2+ sensor for phasic release has also been reported to be far from saturated (Bollmann et al. 2000; Schneggenburger & Neher, 2000). A lack of saturation of the Ca2+ sensor and a highly supralinear dependence of release on [Ca2+]pre makes the asynchronous as well as the stimulus-locked response very sensitive to modulatory mechanisms resulting in changes of [Ca2+]pre.
Taken together, the present data show that asynchronous release may be a powerful but delicately regulated mechanism that ensures the maintenance of appropriate inhibition when the RRP of vesicles is depleted.
Acknowledgments
We would like to express our particular gratitude to John Clements (Canberra, Australia) and Ian Forsythe (Leicester, UK) for critical reading and very helpful comments on an earlier version of the manuscript. The technical assistance of Mrs Przezdziecki is highly appreciated. This study was supported by the DFG (Deutsche Forschungsgemeinschaft, Project Grant SFB515-B2 to RG).
REFERENCES
- Angleson JK, Betz WJ. Intraterminal Ca2+ and spontaneous transmitter release at the frog neuromuscular junction. J Neurophysiol. 2001;85:287–294. doi: 10.1152/jn.2001.85.1.287. [DOI] [PubMed] [Google Scholar]
- Atluri PP, Regehr WG. Delayed release of neurotransmitter from cerebellar granule cells. J Neurosci. 1998;18:8214–8227. doi: 10.1523/JNEUROSCI.18-20-08214.1998. [DOI] [PMC free article] [PubMed] [Google Scholar]
- Augustine GJ, Adler EM, Charlton MP. The calcium signal for transmitter secretion from presynaptic nerve terminals. Ann N Y Acad Sci. 1991;635:365–381. doi: 10.1111/j.1749-6632.1991.tb36505.x. [DOI] [PubMed] [Google Scholar]
- Augustine GJ, Eckert R. Divalent cations differentially support transmitter release at the squid giant synapse. J Physiol. 1984;346:257–271. doi: 10.1113/jphysiol.1984.sp015020. [DOI] [PMC free article] [PubMed] [Google Scholar]
- Augustine GJ, Neher E. Calcium requirements for secretion in bovine chromaffin cells. J Physiol. 1992;450:247–271. doi: 10.1113/jphysiol.1992.sp019126. [DOI] [PMC free article] [PubMed] [Google Scholar]
- Bollmann JH, Sakmann B, Borst JG. Calcium sensitivity of glutamate release in a calyx-type terminal. Science. 2000;289:953–957. doi: 10.1126/science.289.5481.953. [DOI] [PubMed] [Google Scholar]
- Cummings DD, Wilcox KS, Dichter MA. Calcium-dependent paired-pulse facilitation of miniature EPSC frequency accompanies depression of EPSCs at hippocampal synapses in culture. J Neurosci. 1996;16:5312–5323. doi: 10.1523/JNEUROSCI.16-17-05312.1996. [DOI] [PMC free article] [PubMed] [Google Scholar]
- Delaney KR, Tank DW. A quantitative measurement of the dependence of short-term synaptic enhancement on presynaptic residual calcium. J Neurosci. 1994;14:5885–5902. doi: 10.1523/JNEUROSCI.14-10-05885.1994. [DOI] [PMC free article] [PubMed] [Google Scholar]
- DelCastillo J, Katz B. Statistical factors involved in neuromuscular facilitation and depression. J Physiol. 1954;124:574–585. doi: 10.1113/jphysiol.1954.sp005130. [DOI] [PMC free article] [PubMed] [Google Scholar]
- DiGregorio DA, Vergara JL. Localized detection of action potential-induced presynaptic calcium transients at a Xenopus neuromuscular junction. J Physiol. 1997;505:585–592. doi: 10.1111/j.1469-7793.1997.585ba.x. [DOI] [PMC free article] [PubMed] [Google Scholar]
- Dodge FA, Jr, Miledi R, Rahamimoff R. Strontium and quantal release of transmitter at the neuromuscular junction. J Physiol. 1969;200:267–283. doi: 10.1113/jphysiol.1969.sp008692. [DOI] [PMC free article] [PubMed] [Google Scholar]
- Dodge FA, Jr, Rahamimoff R. Co-operative action of calcium ions in transmitter release at the neuromuscular junction. J Physiol. 1967;193:419–432. doi: 10.1113/jphysiol.1967.sp008367. [DOI] [PMC free article] [PubMed] [Google Scholar]
- Gad H, Low P, Zotova E, Brodin L, Shupliakov O. Dissociation between Ca2+-triggered synaptic vesicle exocytosis and clathrin-mediated endocytosis at a central synapse. Neuron. 1998;21:607–616. doi: 10.1016/s0896-6273(00)80570-x. [DOI] [PubMed] [Google Scholar]
- Goda Y, Stevens CF. Two components of transmitter release at a central synapse. Proc Natl Acad Sci U S A. 1994;91:12942–12946. doi: 10.1073/pnas.91.26.12942. [DOI] [PMC free article] [PubMed] [Google Scholar]
- Hagler DJ, Jr, Goda Y. Properties of synchronous and asynchronous release during pulse train depression in cultured hippocampal neurons. J Neurophysiol. 2001;85:2324–2334. doi: 10.1152/jn.2001.85.6.2324. [DOI] [PubMed] [Google Scholar]
- Inoue M, Oomura Y, Yakushiji T, Akaike N. Intracellular calcium ions decrease the affinity of the GABA receptor. Nature. 1986;324:156–158. doi: 10.1038/324156a0. [DOI] [PubMed] [Google Scholar]
- Jaffe DB, Johnston D, Lasser-Ross N, Lisman JE, Miyakawa H, Ross WN. The spread of Na+ spikes determines the pattern of dendritic Ca2+ entry into hippocampal neurons. Nature. 1992;357:244–246. doi: 10.1038/357244a0. [DOI] [PubMed] [Google Scholar]
- Jensen K, Lambert JD, Jensen MS. Tetanus-induced asynchronous GABA release in cultured hippocampal neurons. Brain Res. 2000;880:198–201. doi: 10.1016/s0006-8993(00)02746-3. [DOI] [PubMed] [Google Scholar]
- Kamiya H, Zucker RS. Residual Ca2+ and short-term synaptic plasticity. Nature. 1994;371:603–606. doi: 10.1038/371603a0. [DOI] [PubMed] [Google Scholar]
- Katz B. The Release of Neural Transmission Substances. Liverpool: Liverpool University Press; 1969. [Google Scholar]
- Katz B, Miledi R. The release of acetylcholine from nerve endings by graded electric pulses. Proc R Soc Lond B Biol Sci. 1967;167:23–38. doi: 10.1098/rspb.1967.0011. [DOI] [PubMed] [Google Scholar]
- Kirischuk S, Clements JD, Grantyn R. Presynaptic and postsynaptic mechanisms underlie paired pulse depression at single GABAergic boutons in rat collicular cultures. J Physiol. 2002;543:99–116. doi: 10.1113/jphysiol.2002.021576. [DOI] [PMC free article] [PubMed] [Google Scholar]
- Kirischuk S, Grantyn R. A readily releasable pool of single inhibitory boutons in culture. Neuroreport. 2000;11:3709–3713. doi: 10.1097/00001756-200011270-00024. [DOI] [PubMed] [Google Scholar]
- Kirischuk S, Grantyn R. Inter-bouton variability of synaptic strength correlates with heterogeneity of presynaptic Ca2+ signals. J Neurophysiol. 2002;88:2172–2176. doi: 10.1152/jn.2002.88.4.2172. [DOI] [PubMed] [Google Scholar]
- Kirischuk S, Veselovsky N, Grantyn R. Relationship between presynaptic calcium transients and postsynaptic currents at single gamma-aminobutyric acid (GABA)ergic boutons. Proc Natl Acad Sci U S A. 1999a;96:7520–7525. doi: 10.1073/pnas.96.13.7520. [DOI] [PMC free article] [PubMed] [Google Scholar]
- Kirischuk S, Veselovsky N, Grantyn R. Single-bouton-mediated synaptic transmission: postsynaptic conductance changes in their relationship with presynaptic calcium signals. Pflügers Arch. 1999b;438:716–724. doi: 10.1007/s004249900075. [DOI] [PubMed] [Google Scholar]
- Li C, Davletov BA, Sudhof TC. Distinct Ca2+ and Sr2+ binding properties of synaptotagmins. Definition of candidate Ca2+ sensors for the fast and slow components of neurotransmitter release. J Biol Chem. 1995;270:24898–24902. doi: 10.1074/jbc.270.42.24898. [DOI] [PubMed] [Google Scholar]
- Llinas R, Sugimori M, Silver RB. The concept of calcium concentration microdomains in synaptic transmission. Neuropharmacology. 1995;34:1443–1451. doi: 10.1016/0028-3908(95)00150-5. [DOI] [PubMed] [Google Scholar]
- Lu T, Trussell LO. Inhibitory transmission mediated by asynchronous transmitter release. Neuron. 2000;26:683–694. doi: 10.1016/s0896-6273(00)81204-0. [DOI] [PubMed] [Google Scholar]
- Meinrenken CJ, Borst JG, Sakmann B. Calcium secretion coupling at calyx of held governed by nonuniform channel-vesicle topography. J Neurosci. 2002;22:1648–1667. doi: 10.1523/JNEUROSCI.22-05-01648.2002. [DOI] [PMC free article] [PubMed] [Google Scholar]
- Mellow AM, Perry BD, Silinsky EM. Effects of calcium and strontium in the process of acetylcholine release from motor nerve endings. J Physiol. 1982;328:547–562. doi: 10.1113/jphysiol.1982.sp014283. [DOI] [PMC free article] [PubMed] [Google Scholar]
- Neher E. Vesicle pools and Ca2+ microdomains: new tools for understanding their roles in neurotransmitter release. Neuron. 1998;20:389–399. doi: 10.1016/s0896-6273(00)80983-6. [DOI] [PubMed] [Google Scholar]
- Oleskevich S, Walmsley B. Synaptic transmission in the auditory brainstem of normal and congenitally deaf mice. J Physiol. 2002;540:447–455. doi: 10.1113/jphysiol.2001.013821. [DOI] [PMC free article] [PubMed] [Google Scholar]
- Perouansky M, Grantyn R. Separation of quisqualate- and kainate-selective glutamate receptors in cultured neurons from the rat superior colliculus. J Neurosci. 1989;9:70–80. doi: 10.1523/JNEUROSCI.09-01-00070.1989. [DOI] [PMC free article] [PubMed] [Google Scholar]
- Ravin R, Spira ME, Parnas H, Parnas I. Simultaneous measurement of intracellular Ca2+ and asynchronous transmitter release from the same crayfish bouton. J Physiol. 1997;501:251–262. doi: 10.1111/j.1469-7793.1997.tb00001.x. [DOI] [PMC free article] [PubMed] [Google Scholar]
- Rieke F, Schwartz EA. Asynchronous transmitter release: control of exocytosis and endocytosis at the salamander rod synapse. J Physiol. 1996;493:1–8. doi: 10.1113/jphysiol.1996.sp021360. [DOI] [PMC free article] [PubMed] [Google Scholar]
- Rumpel E, Behrends JC. Sr2+-dependent asynchronous evoked transmission at rat striatal inhibitory synapses in vitro. J Physiol. 1999;514:447–458. doi: 10.1111/j.1469-7793.1999.447ae.x. [DOI] [PMC free article] [PubMed] [Google Scholar]
- Sakaba T, Neher E. Quantitative relationship between transmitter release and calcium current at the calyx of Held synapse. J Neurosci. 2001;21:462–476. doi: 10.1523/JNEUROSCI.21-02-00462.2001. [DOI] [PMC free article] [PubMed] [Google Scholar]
- Schneggenburger R, Meyer AC, Neher E. Released fraction and total size of a pool of immediately available transmitter quanta at a calyx synapse. Neuron. 1999;23:399–409. doi: 10.1016/s0896-6273(00)80789-8. [DOI] [PubMed] [Google Scholar]
- Schneggenburger R, Neher E. Intracellular calcium dependence of transmitter release rates at a fast central synapse. Nature. 2000;406:889–893. doi: 10.1038/35022702. [DOI] [PubMed] [Google Scholar]
- Simon SM, Llinas RR. Compartmentalization of the submembrane calcium activity during calcium influx and its significance in transmitter release. Biophys J. 1985;48:485–498. doi: 10.1016/S0006-3495(85)83804-2. [DOI] [PMC free article] [PubMed] [Google Scholar]
- Xu-Friedman MA, Regehr WG. Probing fundamental aspects of synaptic transmission with strontium. J Neurosci. 2000;20:4414–4422. doi: 10.1523/JNEUROSCI.20-12-04414.2000. [DOI] [PMC free article] [PubMed] [Google Scholar]
- Zhao M, Hollingworth S, Baylor SM. Properties of tri- and tetracarboxylate Ca2+ indicators in frog skeletal muscle fibers. Biophys J. 1996;70:896–916. doi: 10.1016/S0006-3495(96)79633-9. [DOI] [PMC free article] [PubMed] [Google Scholar]
- Zucker RS. Calcium- and activity-dependent synaptic plasticity. Curr Opin Neurobiol. 1999;9:305–313. doi: 10.1016/s0959-4388(99)80045-2. [DOI] [PubMed] [Google Scholar]
- Zucker RS, Fogelson AL. Relationship between transmitter release and presynaptic calcium influx when calcium enters through discrete channels. Proc Natl Acad Sci U S A. 1986;83:3032–3036. doi: 10.1073/pnas.83.9.3032. [DOI] [PMC free article] [PubMed] [Google Scholar]