

Abstract
Bipolar sensory neurons within the vomeronasal organ (VNO) are thought to mediate the detection of pheromones in vertebrates. In the mouse, VNO neurons respond to pheromones with a rise in intracellular Ca2+ that accompanies a depolarization of the cell. Transduction of the pheromone appears to occur through the activation of a phosphatidylinositol signalling pathway, but the ion channels that respond to this signalling pathway have not been identified. In this report patch-clamp recording from hamster vomeronasal sensory neurons was used to identify second-messenger-gated channels that might play a role in transduction. The results demonstrate that VNO neurons show abundant expression of a Ca2+-activated non-selective (CaNS) cation channel. The CaNS channel does not discriminate between Na+ and K+ and has a slope conductance of 22 pS. Half-activation of the channel occurs at a Ca2+ concentration of 0.5 mm (at −80 mV). The probability of opening (Po) of the channel is further augmented at positive potentials, and shows an e-fold voltage dependence per 37 mV. The channel exhibits rapid rundown following patch excision with Po decreasing from near 1.0 to near 0. The adenine nucleotides ATP and cAMP block the channel with an apparent affinity of 3 and 42 μm, respectively (−80 mV). Both the activation of the channel by Ca2+ and the block of the channel by adenine nucleotides show a mild voltage dependence, which can be accounted for by the voltage dependence of Po. The properties of this channel make it a candidate to either directly mediate vomeronasal sensory transduction, or to amplify the primary sensory response.
The vomeronasal organ (VNO), a pair of cigar-shaped structures, that lies beneath the rostral end of the nasal cavity, is thought to be the primary site for the detection of pheromones in mammals (Halpern, 1987; Wysocki & Meredith, 1987). Sensory transduction in the VNO is poorly understood, but is likely to be distinct from sensory transduction in the olfactory epithelium (Liman, 1996). In the olfactory epithelium, G protein-coupled receptors activate a Gs-like G protein (Golf), which leads to the activation of adenylyl cyclase, the generation of cAMP, and ultimately the opening of cyclic-nucleotide-gated (CNG) ion channels. Most of the components of transduction from the main olfactory epithelium are not expressed in the VNO, and VNO neurons do not respond electrically to intracellular injection of cAMP or cGMP (Dulac & Axel, 1995; Berghard et al. 1996; Liman and Corey, 1996; Wu et al. 1996).
Recently, putative molecular components of pheromone transduction in the VNO have been identified including a transient receptor potential ion channel, TRP2 that is expressed in all VNO sensory neurons and is likely to mediate transduction (Liman et al. 1999). TRP2 is specifically localized to sensory microvilli of VNO sensory neurons and targeted ablation of the TRP2 gene in mice greatly reduces the sensory response to pheromones (Liman et al. 1999; Leypold et al. 2002; Stowers et al. 2002). The TRP2 gene is structurally related to ion channels that mediate phototransduction in Drosophila melanogaster, suggesting a similarity in the signalling pathways used by the two systems. Phototransduction in Drosophila involves a phospholipase C (PLC) signalling pathway and several lines of evidence, likewise, suggest that VNO transduction is mediated by a PLC signalling transduction cascade: (1) in several species, including hamster, pig and snake, biochemical studies show that inositol 1,4,5-triphosphate (IP3) levels in VNO sensory epithelia increase in response to pheromones and other appropriate ligands (Luo et al. 1994; Kroner et al. 1996; Wekesa & Anholt, 1997); (2) a specific blocker of PLC (U73122) has been shown in the mouse to block sensory responses of VNO neurons to pheromones present in urine (Holy et al. 2000; Spehr et al. 2002). The mechanism by which PLC signalling leads to the generation of an electrical response is not known. Recent work suggests that polyunsaturated fatty acids activate a Ca2+ current in VNO sensory neurons, although the characteristics of this current have not been described (Spehr et al. 2002).
To further elucidate the mechanism of sensory transduction in the VNO, I looked for second-messenger-gated channels in patches from VNO sensory neurons. In this report I describe a Ca2+-activated non-selective channel that is abundantly expressed in VNO neurons. I propose that this channel plays a role in amplifying the initial sensory response.
METHODS
Cell preparation
Procedures were reviewed and approved by the Institutional Animal Care and Use Committee of The Massachusetts General Hospital and the University of Southern California in accordance with the Guide for the Care and Use of Laboratory Animals (National Research Council, USA). Male golden hamsters (Charles River Breeding Laboratories, Kingston, NY, USA) were killed by inhalation of a rising concentation of CO2 and the vomeronasal organ was removed. Preparation of singly dissociated VNO neurons was essentially as described by Liman & Corey (1996) for the preparation of mouse VNO neurons. In brief, the tissue was digested with 0.2 mg ml−1 crude collagenase type I (Worthington Biochemical, Freehold, NJ, USA) and 0.2 mg ml−1 trypsin type III (Sigma, St Louis, MO, USA) in PBS (10 min), washed two times with fresh PBS and then treated with DNase (40 μg ml−1; Worthington Biochemical). Gentle trituration through a fire-polished Pasteur pipette resulted in the release of single cells. Cells were stored at 4 °C, plated immediately prior to recording, and used within 6–8 h of preparation.
Electrophysiological recording and data analysis
Voltage-clamp recordings were performed with an Axopatch 200A (Axon Instruments). Currents were low-pass filtered at one-fifth of the sampling frequency (typically 5 or 10 kHz) and digitized with the LM900 Laboratory interface (Dagan Corp.). Patch pipettes were constructed from borosilicate microcapillary glass (VWR Scientific) and coated with Sylgaard (Dow Corning). Pipettes had resistances after fire polishing of 2–5 MΩ. Junction potentials were measured to be less than 10 mV and were not corrected. Fast (1–2 s and complete solution exchange was achieved by gravity flow through an array of microcapillary tubes (Drummond) that was manually positioned in front of the patch pipette. Most traces are shown following leak subtraction using the current in the absence of Ca2+ as the leak. All recordings were performed at room temperature. For whole-cell recording, the pipette solutions were as follows (mm): (1) 145 KCl, 0.1 CaCl2, 4 MgCl2, 0.5 EGTA, 10 Hepes; (2) 145 NaCl, 10 Hepes, 2 CaCl2; (3) 145 KCl, 10 Hepes, 2 CaCl2. The external solution was Tyrode solution (mm: 140 NaCl, 5 KCl, 2 CaCl2, 1 MgCl2, 10 dextrose, 10 Hepes). For excised patch recording the pipette contained (mm): 145 NaCl, 2 CaCl2, 10 dextrose, 10 Hepes. Bath solutions were as described in the text. All solutions were adjusted to 300–310 mosmol l−1 and pH 7.4. ATP and cAMP were from Sigma.
If no channel activity was seen following patch excision, the patch pipette was passed through the liquid-air interface so as to disrupt any vesicles that may have formed. This often resulted in the appearance of channels in previously quiet patches. Because of the rapid rundown of the channels, all measurements were made by bracketing the test solution with control solutions, and then using the average value of the response in the control solution to normalize the data. All data were fitted using Origin (Microcal). Statistical evaluation of the data was by Student's t test, and error values are provided as the standard error of the mean (s.e.m.).
RESULTS
Whole-cell currents in response to Ca2+
To look for second-messenger-gated currents, the response of VNO neurons to dialysis through the patch pipette of putative second messengers was measured. Previously we had found no response when high concentrations of cAMP, cGMP, IP3 or inositol 1,3,4,5-tetrakisphosphate (IP4) were dialysed into VNO neurons (Liman & Corey, 1996). In contrast, upon dialysis with Na+ and Ca2+ together, a current was induced in nearly all cells tested. Figure 1A shows a current that reverses at −12 mV in a hamster VNO neuron that was dialysed with 2 mm Ca2+ and 145 NaCl (trace b). TTX (1 μm) was present in the bath to block voltage-activated Na+ currents. The inward current (measured at −85 mV) developed over 20 s after break-in to whole-cell recording mode (Fig. 1B; point a) and then remained steady for several minutes (data not shown). The average magnitude of the current at −80 mV in cells dialysed with 0.5 to 2 mm Ca2+, and 145 mm NaCl was −177 ± 43 pA (n = 9). A current (Fig. 1C) was also induced in cells dialysed with a solution containing 2 mm Ca2+ with 145 mm KCl rather than NaCl, indicating that the current was activated by intracellular Ca2+ and not Na+. The average magnitude of the current at -80 mV was -122 ± 17 pA (n = 13) with 2 mm Ca2+, 145 mm KCl as compared with an average current of −8.7 ± 1.6 pA (n = 11) in cells in which Ca2+ was chelated to nanomolar concentrations by inclusion of 0.5 mm EGTA or 0.5 mm BAPTA. Figure 1C shows that the inward current was nearly abolished upon replacement of external monovalent cations by N-methyl-d-glucamine ion (NMDG+), indicating that the current was mostly carried by Na+ and K+.
Figure 1. A Ca2+-activated current in whole-cell recordings from a VNO neuron.
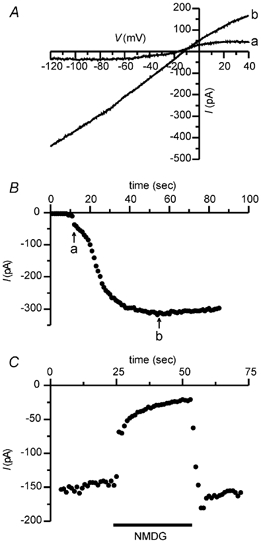
A, current in response to a ramp depolarization (0.35 V s−1) immediately upon break-in in whole-cell recording mode (a) and after dialysis with 2 mm Ca2++ 145 mm NaCl (b). B, time course of the development of the current at −85 mV from the same cell as shown in A. The ramp I-V data in A were taken at the times indicated by a and b in B. C, in a different cell, dialysis with 2 mm Ca2++ 145 mm KCl led to the development of a large inward current measured at −80 mV that was blocked by replacement of all external monovalent cations with NMDG.
The Ca2+-activated current in VNO neurons is a non-selective cation current
Ca2+ applied to the internal side of inside-out patches from the dendritic knob of VNO neurons evoked currents in nearly all excised patches. Figure 2A shows a ramp depolarization applied to a patch in the absence and presence of 2 mm Ca2+. The Ca2+-activated current was nearly 80 pA at +100 mV and displayed mild outward rectification. To determine the ionic selectivity of the current, the solution at the internal face of the patch was exchanged, keeping the concentration of Ca2+ constant at 2 mm (to activate the current). For these and all other experiments the current in the absence of Ca2+ was considered to be leak current and was subtracted prior to analysis of the data. To determine whether the conductance was cation or anion permeable, the patch was exposed to a 10-fold dilution of Na+ and Cl− by substitution with sucrose (Fig. 2B). This led to a positive shift in the reversal potential of 60 mV (from 1 to 61 mV), close to the predicted value of 58 mV for a conductance that is perfectly cation selective. Replacement of Na+ by K+ also yielded a reversal potential of 0 mV, indicating that the conductance does not select between K+ and Na+ (Fig. 2C). Substitution of Na+ with 50 mm Ca2+ led to a substantial, but not complete, block of the inward current carried by Na+ (discussed below). No appreciable outward current was detected under these conditions, indicating a low permeability to Ca2+ (Fig. 2D). Ba2+ was also not detectably permeant (data not shown). Because it did not select between Na+ and K+, this current is referred to as ICaNS and the channel that presumably underlies it as CaNS. ICaNS was detected in patches both from the dendritic knob and from the cell body, and the magnitudes of the currents recorded at the two locations were not significantly different (53.7 ± 11.2 pA, n = 8, at the soma and 57.2 ± 13.9 pA, n = 12 at the dendritic knob; P > 0.05). Thus all further characterization of the channel was conducted with patches from either location.
Figure 2. Ion selectivity of the Ca2+-activated cation current in patches from the dendritic knob of VNO neurons.
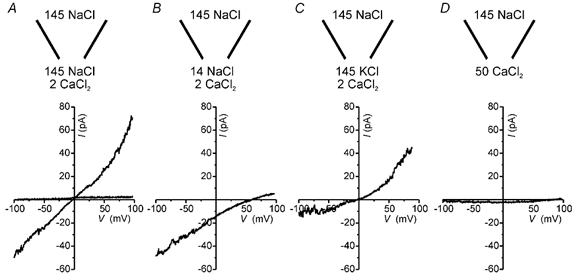
A, current in response to a ramp depolarization (0.39 V s−1) in an excised inside-out patch with symmetrical NaCl on both sides of the membrane differed in the absence and presence of 2 mm Ca2+. B, a 10-fold NaCl dilution of the solution at the internal face of the membrane resulted in a shift in the reversal potential of the current of +60.8 mV. C, replacement of the solution at the internal face of the patch by 145 mm KCl gave a reversal potential of 0 mV. D, replacement of the solution at the internal face of the patch with 50 mm CaCl2 produced no significant outward current. For B, C and D, a small linear leak current in the absence of Ca2+ was subtracted.
Single channel properties
The unitary properties of the CaNS channel were examined in recordings from patches that contained small numbers of channels. Figure 3A shows a recording from a patch in which openings of single channels in response to Ca2+ could be clearly resolved. Four current levels were detected (Fig. 3B), each a multiple of the lowest current level (2.65 pA), indicating the presence of at least four channels with identical conductance. Indeed, overall remarkably little heterogeneity in the conductance of the channels activated by Ca2+ was found, and only infrequently were other channel types observed. The channel showed a nearly linear current-voltage (I-V) relationship with symmetrical NaCl solutions, and the slope conductance was 22.6 ± 0.6 pS (n = 7) (Fig. 3C and D).
Figure 3. Single Ca2+-activated channels.
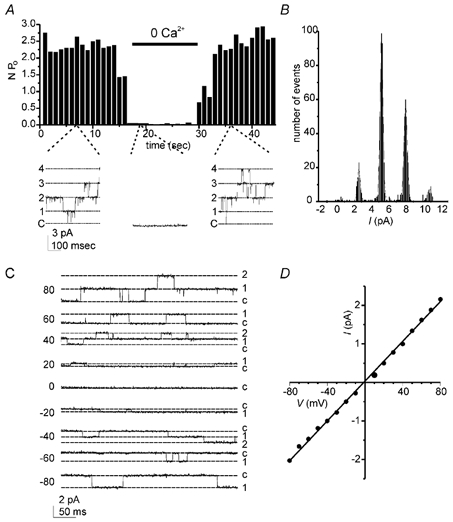
A, channel activity in an excised patch was detected in the presence of 2 mm Ca2+ but not with 0 Ca2+. B, an all-points amplitude histogram of channel activity in the presence of Ca2+ was constructed from the data shown in A. The four peaks, corresponding to the opening of 1, 2, 3 or 4 channels, were fitted with Gaussian distributions with midpoints of 2.7, 5.3, 8.1, and 10.9 pA. C, in a different patch, openings of one or two channels (labelled 1′ and 2′) are shown at the holding potentials indicated. Recordings were with symmetrical NaCl solution. D, a single channel I-V relation measured from the data shown in C was fitted with a slope conductance of 25.6 pS.
Channel rundown
The Ca2+-activated current was largest immediately following patch excision, and thereafter rapidly diminished in amplitude, a phenomenon known as rundown. This is shown in Fig. 4A, where the current during a ramp depolarization declined over 8 min to approximately 10 % of its initial amplitude. At this time the current also displayed an increase in outward rectification, as seen when the current is scaled to its initial magnitude at negative potentials (Fig. 4A).
Figure 4. Rundown of ICaNS.
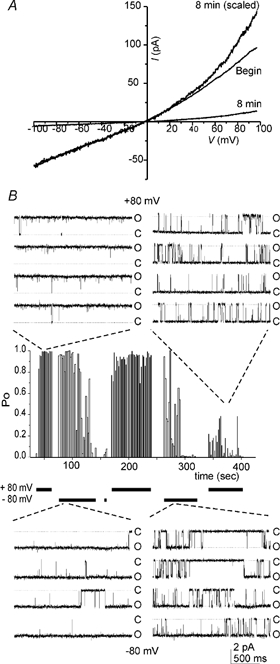
A, the current in response to a ramp depolarization (0.39 V s−1) immediately following patch excision, and 8 min later. Currents were recorded in the presence of symmetrical 2 mm Ca2+ and 145 NaCl on both sides of the patch membrane. The current at 8 min is also shown scaled so that the current at −100 mV is the same as that at the beginning of the experiment. Note the more pronounced outward rectification. B, recording from an excised patch containing a single Ca2+-activated channel illustrating non-stationary unitary properties. O, open; C, closed. The centre plot shows that the probability of opening (Po) of the channel declined within minutes following patch excision. Step depolarizations were applied to either +80 or −80 mV from a holding potential of −80 mV as indicated below the plot. Initially (left insets) Po was nearly 1.0 at both +80 mV (top) and −80 mV (bottom). At later times a decline in Po to near 0 was accompanied by a change in gating such that channel openings were briefer and closings were longer (right insets). Note that the channel appeared to recover at +80 mV from the rundown that occurs at −80 mV, and that at later time points the gating of the channel exhibited a more pronounced voltage dependence.
The rundown of the magnitude of ICaNS was due to a change in the gating of the channel, as seen in Fig. 4B. In this patch, which contained only one active channel, the probability of opening (Po) of the channel was initially very high, approaching unity at both +80 and −80 mV. Over time Po diminished, and the channel entered a more flickery mode of gating (Fig. 4). At this time Po was greater at positive voltages than it was at negative voltages (discussed below). Eventually channel activity disappeared entirely. Rundown could not be prevented or reversed by exposing the internal surface of the patch to a higher concentration of Ca2+, or to Ca2+-calmodulin (2 mm Ca2+, 200 μm calmodulin).
Gating by voltage
From both recordings of single channels (Fig. 4B) and of macroscopic currents (Fig. 5A), a voltage dependence of CaNS channel gating was inferred. The macroscopic current displayed an outward rectification, such that it was twice as large at +80 mV as it was at −80 mV. The magnitude of the macroscopic current is determined by i×N×Po, where i is the current carried by a single channel and N is the number of channels. Since i was linear over the voltage range used and under the ionic conditions of the experiment, and the number of channels (N) presumably did not change significantly during the time of the ramp, the rectification of the current must be explained by a voltage dependence of Po. The kinetics of the voltage-dependent transition are shown in Fig. 5B where, following a step depolarization, the current showed an instantaneous jump, followed by a slower relaxation to a higher current level (Fig. 5B). The apparent increase in Po was fitted with a time constant of 39 ms. To further describe the voltage dependence of gating, the relative Po was estimated as a function of voltage (Fig. 5C) by dividing the macroscopic I-V (Fig. 5A) by the single channel I-V (Fig. 3D). Note that the ramp depolarization in Fig. 5A was applied slowly so that channel opening would be nearly at equilibrium at each voltage. Fitting the data from five cells with a Boltzmann equation of the form:
Figure 5. Voltage dependence of gating.
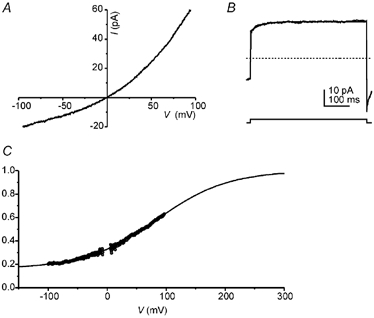
A, a slow ramp depolarization (0.39 V s−1) revealed the non-linear I-V relationship of the Ca2+-activated current. Data averaged from 21 traces in the presence of 2 mm Ca2+ and leak current subtracted from a trace recorded in the absence of Ca2+. B, current elicited by a voltage step from −80 to 60 mV in the presence of 2 mm Ca2+ (average of 30 traces). Following the instantaneous increase in the current, a slower increase occurred that was fitted with a single exponential function with a time constant of 39 ms; this component constitutes 27 % of the final current. C, relative Po as a function of voltage was obtained by dividing the magnitude of the current (from A) by the driving force and a scaling factor. The data were fitted with a Boltzmann equation of the form Po = Po,i+ (Po,f - Po,i)(1 + exp(Vo - V)/dV))−1 with a midpoint (Vo) 84 mV, a slope factor (dV) of 60 mV, a final value for Po,f of 1 and an initial value for Po,i of 0.16. The scaling factors were determined so that the fitted Boltzmann equation would approach unity at positive potentials.
| (1) |
where Po,i is the value of Po at infinitely negative voltages and Po,f is the value of Po at infinitely positive voltages, giving values of Vo = 41 ± 11 mV, dV = 37 ± 6 mV and Po,i/Po,f = 0.33 ± 0.06 (n = 5). These data indicate that the channels were not fully closed at negative voltages; rather Po was reduced to approximately 33 % of its maximal value.
A voltage dependence to the gating of the CaNS channel was also noted in recordings of single channel activity, such as that in Fig. 4B. However, the variability over time in the gating of the channel precluded quantitative analysis.
Gating by Ca2+
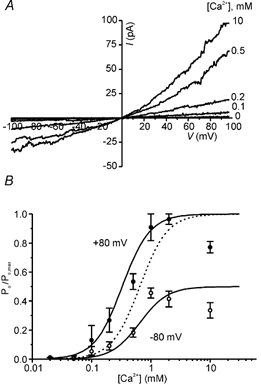
Increasing concentrations of intracellular Ca2+ induced a dose-dependent increase in the current in multi-channel patches, as seen in Fig. 6A. The activation of ICaNS by Ca2+ is plotted in Fig. 6B, and fitted with a Hill equation. High concentrations (> 5 mm) of Ca2+ resulted in a decrease in the magnitude of the current, presumably due to a very low affinity Ca2+ block of the channel. Data with 10 mm Ca2+ were, therefore, not included in the analysis. Ca2+ activated the current with a K½ of 0.43 mm at + 80 mV and a Hill coefficient (nH) of 1.9 (data from five patches). At −80 mV the currents were somewhat less sensitive to Ca2+; when dose-response data were fitted with the Hill equation a K½ of 0.51 mm and a Hill coefficient of 2.1 (data from 4 patches) were obtained. The voltage dependence of K½ was also noted in side-by-side comparisons of data at the two voltages obtained from the same patch. The Hill coefficient of approximately 2 at both voltages suggests that at least two Ca2+ ions are required for activation of CaNS. The difference in K½ at the two voltages could be attributed either to a difference in the affinity of the binding site for Ca2+, for example if the binding site is within the membrane electric field, or to a difference in the availability of the binding site at the two voltages. I favour this latter interpretation, as discussed later, and data shown in Fig. 6 are fitted with the allosteric model described below.
Figure 6. Ca2+ dependence of gating.
Block by adenine nucleotides
Because adenylyl cyclase is abundant in the dendritic region of the VNO, the effects of cAMP on CaNS were examined. Figure 7A shows that 200 μm cAMP blocks ICaNS from the intracellular side. The block was fully reversible (data not shown) and did not depend on the presence of ATP, indicating that it was likely to be due to a direct interaction between cAMP and the channel and not to phosphorylation of the channel. Other nucleotides were tested and it was found that intracellular cGMP and cADP ribose did not block the current, whereas ATP and ATPγS were potent blockers of the current. This indicates that the blocking site of the CaNS channel is unlike the binding site for cyclic nucleotides of the cyclic nucleotide-gated channels, and is more like the ATP binding site of ATP-regulated proteins. Fits to dose-response curves measured at +80 mV gave values of K½ for cAMP of 77 μm (data from 9 patches) and for ATP of 4.5 μm (data from 8 patches) and Hill coefficients of 0.74 and 0.58, respectively (Fig. 7B and C). Because there was considerable variability in the K½ for block in different patches, the value of the Hill coefficient measured from the averaged data is likely to underestimate the true value. In two patches in which complete dose-response curves were obtained for block by cAMP, values for K½ were 166 and 88 μm and the Hill coefficients were 1.44 and 0.84. Similarly in two patches in which complete dose-response curves were obtained for block by ATP, the values of K½ were 6.7 and 2.9 μm and the Hill coefficients were 0.69 and 0.75. From these data it seems most likely that one nucleotide binds per channel.
Figure 7. Adenine nucleotide block of the current.
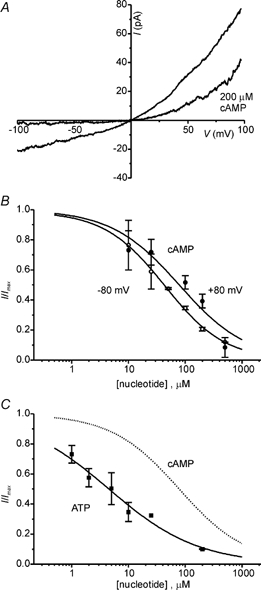
A, block of the current in a patch by 200 μm cAMP applied to the intracellular surface. Note the more pronounced block at negative potentials than at positive potentials. B, dose-response relationships for block by cAMP measured at +80 and −80 mV. Dose-response data were fitted with the Hill equation with values of K1/2 of 78 μm at +80 mV and 43 μm at −80 mV, and of the Hill coefficient nH of 0.72 at +80 mV and 0.81 at −80 mV. Data are the means ±s.e.m. of 9 and 8 patches. C, dose-response data for block of the current by ATP at +80 mV. Data are the means ±s.e.m. of 5 patches. A fit to the Hill equation gave values of K1/2 of 4.5 μm and nH of 0.55. The dotted line shows the fit to the block by cAMP for comparison.
The affinity of the channel for adenine nucleotides was higher at negative potentials than it was at positive potentials. This is apparent as the steeper outward rectification of the I-V curve for the current in the presence of 200 μm cAMP (Fig. 7A) due to a more complete block at negative voltages. It was also demonstrated by dose-response curves at negative potentials that were shifted to the left as compared with those at positive potentials (Fig. 7B); the K½ for cAMP was 42 μm at −80 mV as compared with 81 μm at +80 mV. Similarly, the K½ for block by ATP was 3.0 μm at −80 mV as compared with 4.4 μm at +80 mV.
Voltage dependence
The voltage dependence of the affinity of the channel for Ca2+ and adenine nucleotides could be due either to binding of Ca2+ and adenine nucleotides within the membrane electric field, or to allosteric effects resulting from the voltage dependence of Po. I favour the latter interpretation, as it can account in a semi-quantitative way for all the observed voltage-dependent effects with a single voltage-sensitive transition.
To explain the voltage dependence of Ca2+ activation I propose the following model:
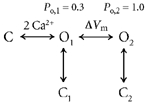 |
The channel binds Ca2+ and enters an open state, O1, with a relatively low Po (Po,1). It then undergoes a voltage-sensitive transition to a state (O2) that has a higher Po (Po,2). This scheme explains the observation that at negative voltages, Po should approach a non-zero value (Po,1). In this model, the voltage dependence of Ca2+ binding comes about because as the initial open state (O1) is depleted by the voltage-dependent transition to O2, it is refilled by channels entering it from a closed, unbound state. Equation (2) describes the Ca2+ dose-response relationship for this model:
| (2) |
Po,max is the maximal value of Po at a particular voltage. Using the measured values that describe the voltage dependence of Po, this model can entirely account for the voltage-dependent shift in the K½ for Ca2+ activation. This is seen in Fig. 6B where eqn (2) was fitted to the Ca2+ dose-response data at +80 mV. A remarkably good fit to the data at -80 mV was then obtained by simply changing the value of Vm and Po,max in eqn (2).
In contrast, the data are not well described by a model where Ca2+ binds within the electric field. In this model the voltage dependence of Po is assumed to result from the voltage dependence of Ca2+ activation. This model predicts that at high concentrations of Ca2+, Po at negative voltages would approach that at positive voltages. Furthermore, using a simple version of this model, where binding of one calcium ion opens the channel, one can estimate from the shift in K½ with voltage that the calcium ion binds 1.4 % of the way through the membrane field. This would confer a negligible voltage dependence on Po.
The voltage dependence of nucleotide block can also be explained by the voltage-dependent transition postulated above. Let us suppose that adenine nucleotides block the channel by binding to and stabilizing a closed state of the channel:
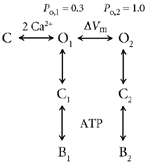 |
In this scheme, C2 is a closed state visited at saturating concentrations of Ca2+, and the relative occupancy of C2 and O is measured as Po. The apparent affinity (K½) of the nucleotide for the channel at saturating concentrations of Ca2+ is then related to Po and the microscopic binding constant of the nucleotide, Kd, as follows:
| (3) |
The voltage dependence of K½ follows from the voltage dependence of Po. For CaNS, Po increases by a factor of about 2 between the voltages of −80 and +80 mV. From eqn (3), a three-fold lower affinity at +80 than at -80 mV is predicted. This is in very good agreement with the experimental data, which showed a 2-fold decrease in affinity for cAMP and a 1.5-fold decrease in affinity for ATP at positive potentials. One prediction of this model is that the open times of the channel should not change in the presence of the nucleotide; rather, closed times should lengthen. This has been observed in other cell types, where it has been studied (van den Abbeele et al. 1994).
DISCUSSION
The response of VNO sensory neurons to pheromones undoubtedly involves a second messenger signalling cascade. What is the nature of this cascade? The present experiments demonstrate that VNO sensory neurons abundantly express an ion channel that is gated by Ca2+ and adenine nucleotides. This channel may be involved as the primary target of the transduction cascade, or it may be activated as a secondary response.
Comparison with other Ca2+-activated ion channels and TRP channels
The Ca2+-activated non-selective channel that I have described closely resembles Ca2+-activated channels described in a number of preparations (Partridge & Swandulla, 1988). This class of channels exhibits the following characteristics: (1) a single channel conductance of ≈25 pS, (2) a low selectivity among monovalent cations, (3) a low permeability to divalent cations, (4) activation requiring greater than 1 μm Ca2+, and (5) block by micromolar concentrations of adenine nucleotides. Channels that fit this description, known as CaNS, are found in the pancreas, in acinar cells, in duct cells and in an insuloma cell line (Maruyama & Petersen, 1984; Sturgess et al. 1986, 1987; Gray & Argent, 1990); in the kidney, in cells from the thick ascending loop and the renal tubule, and in a cortical collecting duct-derived cell line (Teulon et al. 1987; Ahmad et al. 1992; Chraibi et al. 1994; Korbmacher et al. 1995); and in cells from a variety of other tissues, including secretory cells from the mandibular gland, lacrimal gland, a human colonic cell line, outer hair cells of the inner ear, and Schwann cells (Bevan et al. 1984; Marty et al. 1984; Cook et al. 1990; Champigny et al. 1991; van den Abbeele et al. 1994). Interestingly, many of the cells in which CaNS has been described are, like VNO neurons, microvillar epithelial cells.
At present, the molecular nature of the channel described in this report is not known. It is possible that it is a member of the transient receptor potential family (TRP) of ion channels. The TRPC2 channel is expressed abundantly in VNO sensory neurons, and is likely to mediate sensory transduction in these cells (Liman et al. 1999; Leypold et al. 2002; Stowers et al. 2002). However, due to the difficulty of obtaining functional expression of the TRPC2 channel, no information concerning its functional properties is presently available (Liman et al. 1999; Hofmann et al. 2000). The properties of CaNS do not match those of other TRPC channels, none of which are directly activated by Ca2+ and most of which are more permeable to Ca2+ (Clapham et al. 2001; Minke & Cook, 2002). They most closely match those of TRPM4, which is also a calcium-activated non-selective cation channel (Launay et al. 2002). However, a notable difference is that TRPM4 is sensitive to high nanomolar concentrations of Ca2+ whereas CaNS is activated by high micromolar concentrations of Ca2+. This difference might be due to a difference in the subunit composition of native channels as compared with channels that are expressed as homomultimers in a heterologous system.
Voltage dependence of gating
Our description of the CaNS channel in VNO demonstrates a voltage dependence of Po, of the apparent affinity of the channel for Ca2+, and of the block by adenine nucleotides. While a voltage dependence of Po has been noted in other cell types, few reports have noted a voltage dependence of Ca2+ activation or adenine nucleotide block and none have provided a mechanistic model for how this voltage dependence might arise (Bevan et al. 1984; Cook et al. 1990; Gray & Argent, 1990; Champigny et al. 1991; Ahmad et al. 1992; Chraibi et al. 1994; Korbmacher et al. 1995). The data presented in this report suggest that the voltage dependence of block by adenine nucleotides and of activation by Ca2+ can be explained as a result of the voltage dependence of Po.
Functional role of Ca2+-activated non-selective channels
While Ca2+-activated channels were first described more than 20 years ago (Colquhoun et al. 1981; Yellen, 1982), their functional significance in many cases remains mysterious. The requirement for a high concentration of Ca2+ to activate the CaNS channels, and high sensitivity to block by ATP, would suggest that these channels should have a relatively low open probability under normal resting conditions. Physiological activation might occur if the channels are localized in a restricted space close to the site of Ca2+ entry; microvilli present such a restricted compartment. In the microvillous rhabdomere of Drosphila melanogaster, it has been argued that the Ca2+ concentrations may reach as much as 700 μm at the peak of the light response (Oberwinkler & Stavenga, 2000). It is also possible that the affinity of the channel for Ca2+ is higher when the patch is intact, but decreases upon patch excision. A higher affinity for Ca2+ has, indeed, been reported in recordings made immediately after patch excision (Maruyama & Petersen, 1984). Further indication that Ca2+ may gate these channels under physiological conditions comes from the observation that the CaNS channel in pancreatic acinar cells can be activated in response to agonists that are known to increase levels of intracellular Ca2+ (Thorn & Petersen, 1992).
Ca2+-activated non-selective channels, with properties distinct from those of the mammalian CaNS, have also been described in insect pheromone-detecting sensory neurons (Zufall et al. 1991). In insect olfactory cells the mechanism of pheromone transduction remains obscure, but most evidence suggests a role for the inositol phosphate pathway. The Ca2+-activated channels are most abundant on the inner dendrite, rather than the outer dendrite where pheromone binding occurs. They have, therefore, been proposed to play a role in shaping the electrical response to the pheromones, rather than in directly mediating it.
In the VNO, the role of CaNS channels in sensory transduction is unclear. They could directly mediate sensory transduction, or they might play a more indirect role in amplifying or shaping the primary electrical response. Recent work has shown that in mouse vomeronasal neurons pheromones elicit a rise in intracellular Ca2+ (Leinders-Zufall et al. 2000). Thus, one possibility is that entry of Ca2+ through the primary transduction channel activates CaNS channels, leading to a further depolarization of the cell. A similar type of amplification occurs in the olfactory system, where Ca2+ entering through cyclic nucleotide-gated channels opens a depolarizing Cl− current (Kleene & Gesteland, 1991; Kleene, 1993; Kurahashi & Yau, 1993; Lowe & Gold, 1993).
Acknowledgments
I thank D. Corey in whose lab many of these experiments were performed and D. Corey, D. Arnold and J. Holt for helpful comments on an earlier version of this manuscript. This work was supported by the Howard Hughes Medical Institute and by NIH grant DC04213.
REFERENCES
- Ahmad I, Korbmacher C, Segal AS, Cheung P, Boulpaep EL, Barnstable CJ. Mouse cortical collecting duct cells show nonselective cation channel activity and express a gene related to the cGMP-gated rod photoreceptor channel. Proc Natl Acad Sci U S A. 1992;89:10262–10266. doi: 10.1073/pnas.89.21.10262. [DOI] [PMC free article] [PubMed] [Google Scholar]
- Berghard A, Buck LB, Liman ER. Evidence for distinct signaling mechanisms in two mammalian olfactory sense organs. Proc Natl Acad Sci U S A. 1996;93:2365–2369. doi: 10.1073/pnas.93.6.2365. [DOI] [PMC free article] [PubMed] [Google Scholar]
- Bevan S, Gray PTA, Ritchie JM. A calcium-activated cation-selective channel in rat cultured Schwann cells. Proc R Soc Lond B. 1984;222:349–355. doi: 10.1098/rspb.1984.0068. [DOI] [PubMed] [Google Scholar]
- Champigny G, Verrier B, Lazdunski M. A voltage, calcium, and ATP sensitive non selective cation channel in human colonic tumor cells. Biochem Biophys Res Commun. 1991;176:1196–1203. doi: 10.1016/0006-291x(91)90412-z. [DOI] [PubMed] [Google Scholar]
- Chraibi A, van den Abbeele T, Guinamard R, Teuleon J. A ubiquitous non-selective cation channel in the mouse renal tubule with variable sensitivity to calcium. Pflugers Arch. 1994;429:90–97. doi: 10.1007/BF02584034. [DOI] [PubMed] [Google Scholar]
- Clapham DE, Runnels LW, Strubing C. The TRP ion channel family. Nat Rev Neurosci. 2001;2:387–396. doi: 10.1038/35077544. [DOI] [PubMed] [Google Scholar]
- Colquhoun D, Neher E, Reuter H, Stevens CF. Inward current channels activated by intracellular Ca in cultured cardiac cells. Nature. 1981;294:752–754. doi: 10.1038/294752a0. [DOI] [PubMed] [Google Scholar]
- Cook DJ, Poronnik P, Young JA. Characterization of a 25-pS nonselective cation channel in a cultured secretory epithelial cell line. J Membr Biol. 1990;114:37–52. doi: 10.1007/BF01869383. [DOI] [PubMed] [Google Scholar]
- Dulac C, Axel R. A novel family of genes encoding putative pheromone receptors in mammals. Cell. 1995;83:195–206. doi: 10.1016/0092-8674(95)90161-2. [DOI] [PubMed] [Google Scholar]
- Gray MA, Argent BA. Non-selective cation channel on the pancreatic duct cells. Biochim Biophys Acta. 1990;1029:33–42. doi: 10.1016/0005-2736(90)90433-o. [DOI] [PubMed] [Google Scholar]
- Halpern M. The organization and function of the vomeronasal system. Annu Rev Neurosci. 1987;10:325–362. doi: 10.1146/annurev.ne.10.030187.001545. [DOI] [PubMed] [Google Scholar]
- Hofmann T, Schaefer M, Schultz G, Gudermann T. Cloning, expression and subcellular localization of two novel splice variants of mouse transient receptor potential channel 2. Biochem J. 2000;351:115–122. doi: 10.1042/0264-6021:3510115. [DOI] [PMC free article] [PubMed] [Google Scholar]
- Holy TE, Dulac C, Meister M. Responses of vomeronasal neurons to natural stimuli. Science. 2000;289:1569–1572. doi: 10.1126/science.289.5484.1569. [DOI] [PubMed] [Google Scholar]
- Kleene SJ. Origin of the chloride current in olfactory transduction. Neuron. 1993;11:123–132. doi: 10.1016/0896-6273(93)90276-w. [DOI] [PubMed] [Google Scholar]
- Kleene SJ, Gesteland RC. Calcium-activated chloride conductance in frog olfactory cilia. J Neurosci. 1991;11:3624–3629. doi: 10.1523/JNEUROSCI.11-11-03624.1991. [DOI] [PMC free article] [PubMed] [Google Scholar]
- Korbmacher C, Volk T, Segal AS, Boulpaep EL, Fromter E. A calcium-activated and nucleotide-sensitive nonselective cation channel in M-1 mouse cortical collecting duct cells. J Membr Biol. 1995;146:29–45. doi: 10.1007/BF00232678. [DOI] [PubMed] [Google Scholar]
- Kroner C, Breer H, Singer AG, O'Connell RJ. Pheromone-induced second messenger signaling in the hamster vomeronasal organ. Neuroreport. 1996;7:2989–92. doi: 10.1097/00001756-199611250-00038. [DOI] [PubMed] [Google Scholar]
- Kurahashi T, Yau KW. Co-existence of cationic and chloride components in odorant-induced current of vertebrate olfactory receptor cells. Nature. 1993;363:71–74. doi: 10.1038/363071a0. [DOI] [PubMed] [Google Scholar]
- Launay P, Fleig A, Perraud AL, Scharenberg AM, Penner R, Kinet JP. TRPM4 is a Ca2+-activated nonselective cation channel mediating cell membrane depolarization. Cell. 2002;109:397–407. doi: 10.1016/s0092-8674(02)00719-5. [DOI] [PubMed] [Google Scholar]
- Leinders-Zufall T, Lane AP, Puche AC, Ma W, Novotny MV, Shipley MT, Zufall F. Ultrasensitive pheromone detection by mammalian vomeronasal neurons. Nature. 2000;405:792–796. doi: 10.1038/35015572. [DOI] [PubMed] [Google Scholar]
- Leypold BG, Yu CR, Leinders-Zufall T, Kim MM, Zufall F, Axel R. Altered sexual and social behaviors in trp2 mutant mice. Proc Natl Acad Sci U S A. 2002;99:6376–6381. doi: 10.1073/pnas.082127599. [DOI] [PMC free article] [PubMed] [Google Scholar]
- Liman ER. Pheromone transduction in the vomeronasal organ. Curr Opin Neurobiol. 1996;6:487–493. doi: 10.1016/s0959-4388(96)80054-7. [DOI] [PubMed] [Google Scholar]
- Liman ER, Corey DP. Electrophysiological characterization of chemosensory neurons from the mouse vomeronasal organ. J Neurosci. 1996;16:4625–4637. doi: 10.1523/JNEUROSCI.16-15-04625.1996. [DOI] [PMC free article] [PubMed] [Google Scholar]
- Liman ER, Corey DP, Dulac C. TRP2: a candidate transduction channel for mammalian pheromone sensory signaling. Proc Natl Acad Sci U S A. 1999;96:5791–5796. doi: 10.1073/pnas.96.10.5791. [DOI] [PMC free article] [PubMed] [Google Scholar]
- Lowe G, Gold GH. Nonlinear amplification by calcium-dependent chloride channels in olfactory receptor cells. Nature. 1993;366:283–286. doi: 10.1038/366283a0. [DOI] [PubMed] [Google Scholar]
- Luo Y, Lu S, Chen P, Wang D, Halpern M. Identification of chemoattractant receptors and G-proteins in the vomeronasal system of garter snakes. J Biol Chem. 1994;269:16867–77. [PubMed] [Google Scholar]
- Marty A, Tan YP, Trautmann A. Three types of calcium-dependent channel in rat lacrimal glands. J Physiol. 1984;357:293–325. doi: 10.1113/jphysiol.1984.sp015501. [DOI] [PMC free article] [PubMed] [Google Scholar]
- Maruyama Y, Petersen OH. Single calcium-dependent cation channels in mouse pancreatic acinar cells. J Membr Biol. 1984;81:83–87. doi: 10.1007/BF01868812. [DOI] [PubMed] [Google Scholar]
- Minke B, Cook B. TRP channel proteins and signal transduction. Physiol Rev. 2002;82:429–472. doi: 10.1152/physrev.00001.2002. [DOI] [PubMed] [Google Scholar]
- Oberwinkler J, Stavenga DG. Calcium transients in the rhabdomeres of dark- and light-adapted fly photoreceptor cells. J Neurosci. 2000;20:1701–1709. doi: 10.1523/JNEUROSCI.20-05-01701.2000. [DOI] [PMC free article] [PubMed] [Google Scholar]
- Partridge LD, Swandulla D. Calcium-activated non-specific cation channels. Trends Neurosci. 1988;11:69–72. doi: 10.1016/0166-2236(88)90167-1. [DOI] [PubMed] [Google Scholar]
- Spehr M, Hatt H, Wetzel CH. Arachidonic acid plays a role in rat vomeronasal signal transduction. J Neurosci. 2002;22:8429–8437. doi: 10.1523/JNEUROSCI.22-19-08429.2002. [DOI] [PMC free article] [PubMed] [Google Scholar]
- Stowers L, Holy TE, Meister M, Dulac C, Koentges G. Loss of sex discrimination and male-male aggression in mice deficient for TRP2. Science. 2002;295:1493–1500. doi: 10.1126/science.1069259. [DOI] [PubMed] [Google Scholar]
- Sturgess NC, Hales CN, Ashford MLJ. Inhibition of a calcium-activated, non-selective cation channel, in a rat insulinoma cell line, by adenine derivatives. FEBS Letters. 1986;208:397–400. doi: 10.1016/0014-5793(86)81056-0. [DOI] [PubMed] [Google Scholar]
- Sturgess NC, Hales CN, Ashford MLJ. Calcium and ATP regulate the activity of a non-selective cation channel in a rat insulinoma cell line. Pflugers Arch. 1987;409:607–615. doi: 10.1007/BF00584661. [DOI] [PubMed] [Google Scholar]
- Teulon J, Paulais M, Bouthier M. A Ca2+-activated cation-selective channel in the basolateral membrane of the cortical thick ascending limb of Henle's loop of the mouse. Biochim Biophys Acta. 1987;905:125–132. doi: 10.1016/0005-2736(87)90016-2. [DOI] [PubMed] [Google Scholar]
- Thorn P, Petersen OH. Activation of nonselective cation channels by physiological cholecystokinin concentrations in mouse pancreatic acinar cells. J Gen Physiol. 1992;100:11–25. doi: 10.1085/jgp.100.1.11. [DOI] [PMC free article] [PubMed] [Google Scholar]
- van den Abbeele T, Huy PTB, Teulon J. A calcium-activated nonselective cation channel in the basolateral membrane of outer hair cells of the guinea-pig cochlea. Pflugers Arch. 1994;417:56–63. doi: 10.1007/BF00585942. [DOI] [PubMed] [Google Scholar]
- Wekesa KS, Anholt RR. Pheromone regulated production of inositol-(1,4,5)-trisphosphate in the mammalian vomeronasal organ. Endocrinology. 1997;138:3497–3504. doi: 10.1210/endo.138.8.5338. [DOI] [PubMed] [Google Scholar]
- Wu YM, Tirindelli R, Ryba NjP. Evidence for different chemosensory signal transduction pathways in olfactory and vomeronasal neurons. Biochem Biophys Res Commun. 1996;220:900–904. doi: 10.1006/bbrc.1996.0503. [DOI] [PubMed] [Google Scholar]
- Wysocki CJ, Meredith M. The vomeronasal system. In: Finger TE, Silver WL, editors. Neurobiology of Taste and Smell. London: John Wiley & Sons; 1987. pp. 125–150. [Google Scholar]
- Yellen G. Single Ca2+-activated nonselective cation channels in neuroblastoma. Nature. 1982;296:357–359. doi: 10.1038/296357a0. [DOI] [PubMed] [Google Scholar]
- Zufall F, Hatt H, Keil TA. A calcium-activated nonspecific cation channel from olfactory receptor neurones of the silkmoth antheraea polyphemus. J Exp Biol. 1991;161:455–468. doi: 10.1242/jeb.161.1.455. [DOI] [PubMed] [Google Scholar]