Abstract
In smooth muscle, non-selective cation conductances contribute to agonist-evoked depolarisation and contraction, and in the present study using patch-pipette techniques we describe the properties of a constitutively active cation channel. With whole-cell recording in K+-free conditions, there was a spontaneous current with a reversal potential (Er) that was altered by replacement of external Na+ by an impermeant cation, but not when external Cl− was replaced by an impermeant anion. The tonic cation inward current could be carried by Ca2+ ions and was greatly enhanced when the external Ca2+ concentration was reduced. In outside-out patches there was spontaneous cation channel activity that could be resolved into three conductance states of about 15, 25 and 40 pS, all with the same Er as the whole-cell current. Kinetic analysis revealed that there were two open times of about 1 and 5 ms and that the currents displayed bursting kinetics with burst durations of approximately 5 ms and 25 ms. Removal of external Ca2+ ions increased the probability of channel opening (Po) sixfold, which was associated with an increase in the longer burst duration. Bath application of the diacylglycerol analogue 1-oleoyl-2-acetyl-sn-glycerol increased Po, but phorbol 12,13-dibutyrate, which stimulates protein kinase C (PKC), reduced channel activity. In contrast, the PKC inhibitor chelerythrine increased the activity of channel currents. It is concluded that in rabbit ear artery myocytes there is a constitutively active Ca2+-permeable cation channel that is regulated by external Ca2+ ions and suppressed by tonic PKC activity. It is proposed that this mechanism may contribute to the resting membrane conductance and basal Ca2+ influx in this particular arterial preparation.
In smooth muscle the resting membrane potential is commonly between −40 and −65 mV, which is substantially less negative than the K+ equilibrium potential (EK, about −85 mV, see Nelson & Quayle, 1995; Kuriyama et al. 1998). This implies that there is a spontaneous depolarising mechanism(s) driving the membrane potential to more positive values than EK. Since the Cl− equilibrium potential is about −20 to −30 mV, it was proposed that a Cl− conductance might contribute to the resting membrane potential (Large & Wang, 1996; Greenwood & Large, 1999). However, in many smooth muscle preparations that are bathed in low-Cl− external solution, where any resting Cl− conductance would be very low, the resting potentials remain at values of about −60 mV (e.g. Large, 1984; Van Helden, 1988). Consequently, this indicates that there is a resting cationic, probably Na+, mechanism causing the relatively depolarised resting membrane potential.
Using whole-cell and perforated-patch recording, Bae et al. (1999) described a basal non-selective cation current in freshly dispersed rabbit pulmonary artery myocytes. It was concluded that the non-selective cation conductance was a component of the resting membrane potential, but no information was provided on the properties of the underlying single channels. In the present work we used whole-cell recording and isolated outside-out patches to study the characteristics of constitutively active Ca2+-permeable non-selective cation channels in rabbit ear artery smooth muscle cells. These channels have three conductance states of about 15, 25 and 40 pS, and are gated by external Ca2+ ions. Moreover, channel currents can be activated by 1,2-diacyl-sn-glycerol (DAG) by a protein kinase C (PKC)-independent mechanism, and there is a constitutively active PKC pathway that suppresses channel activity.
Methods
Cell isolation
New Zealand White rabbits (2–3 kg) were killed by an i.v. injection of sodium pentobarbitone (120 mg kg−1, in accordance with the UK Animals (Scientific Procedure) Act, 1986) and ear arteries from both ears were removed into normal physiological salt solution (PSS). The tissue was dissected free of connective tissue and placed in 50 μm Ca2+-PSS. The tissue was enzymatically dispersed by incubation in 50 μm Ca2+-PSS with 1 mg ml−1 papain (Sigma), 1.5 mg ml−1 collagenase type IA (Sigma), 5 mg ml−1 bovine serum albumin and 2.5 mm DTT for 30 min and were then washed twice in 50 μm Ca2+-PSS. All enzyme and wash procedures were carried out at 37 °C. After the enzyme treatments, the tissue was incubated in 50 μm Ca2+-PSS at room temperature (20–25 °C) for 10 min before the cells were released into the solution by gentle mechanical agitation of the tissue using a wide-bore Pasteur pipette. The suspension of cells was then centrifuged (1000 r.p.m.) to form a loose pellet that was subsequently resuspended in 0.75 mm Ca2+-PSS. The cells were then plated onto glass coverslips and stored at 4 °C before use (1–6 h).
The normal PSS contained (mm): NaCl (126), KCl (6), CaCl2 (1.5), MgCl2 (1.2), glucose (10) and Hepes (11), and the pH was adjusted to 7.2 with 10 m NaOH. Low Ca2+-PSS (50 μm and 0.75 mm) had the same composition except that 1.5 mm CaCl2 was replaced by 50 μm CaCl2 and 0.75 mm CaCl2, respectively.
Electrophysiology
Whole-cell and single-channel currents were recorded with a List L/M-PC patch-clamp amplifier at room temperature using whole-cell recording and isolated outside-out patch configurations of the patch-clamp technique (Hamill et al. 1981). Patch pipettes were manufactured from borosilicate glass and had pipette resistances of approximately 6–8 MΩ when filled with the patch pipette solution. Series resistance was not compensated. Liquid junction potentials were minimised using an agar bridge and calculated to be < 3 mV, and therefore were not compensated for in the final records. The bath chamber was perfused by solution reservoirs under gravity feed with flow rates of approximately 5 ml min−1 for whole-cell recording and a ‘push-pull’ system was used for isolated patches.
To evaluate the current-voltage (I–V) characteristics of the whole-cell currents, voltage was stepped to −150 mV for 50 ms from a holding potential of −50 mV before a voltage ramp was applied to +100 mV (0.5 V s−1). The voltage ramps were generated and the data captured with a Pentium (P5-100) personal computer (Gateway, Ireland) using a CED 1401plus interface and CED Patch and Voltage Clamp Software (Version 6.0, Cambridge Electronic Design, Cambridge, UK). Data were filtered at 1 kHz and sampled at 5 kHz. At least three ramps were used to create each I–V curve. To obtain mean I–V relationships, the current values of the I–V relationship from each myocyte were measured at 10 or 20 mV intervals and then mean ± s.e.m. values were calculated. Long-term, whole-cell recordings were played back from the analog output of a CDATA digital tape recorder (Cygnus Technology, Delaware, PA, USA) using 1401plus and CED sigavg software. The whole-cell currents were filtered at 10 Hz (-3 db, low-pass, eight-pole Bessel filter, Frequency Devices, model LP02, Scensys, Aylesbury, UK) and acquired at a sampling rate of 25 Hz.
Single-channel currents from whole-cell recording or isolated patches were initially recorded onto a DAT recorder at a bandwidth of 5 kHz and a sample rate of 48 kHz. To resolve single-channel currents from whole-cell recording, data were filtered at 100 Hz (−3 db, low-pass eight-pole Bessel filter, Frequency Devices, model LP02, Scensys) and acquired using a CED 1401plus interface and CED Patch and Voltage Clamp Software (Version 6.0, Cambridge Electronic Design) at a sample rate of 1 kHz. Single-channel currents from isolated patches were filtered at 1 kHz (−3 db) and sampled at 10 kHz, giving a maximum resolution of 0.664 ms (two times the rise time of a 1 kHz filter) and allowing over 90 % of the single channel amplitudes to be resolved (Colquhoun, 1987).
Mean single-channel amplitudes were calculated from idealised traces of at least 10 s duration with a stable baseline, using the threshold-crossing method. One threshold level was used that allowed all channel substates to be measured. For example, at −50 mV the threshold value was set at about −0.6 pA, and therefore any channel current larger than this value represented channel opening. I–V relationships of the single-channel currents were measured by manually changing the membrane potential. The single-channel amplitudes from individual whole-cell recordings or isolated patches were pooled and the unitary conductance and reversal potential (Er) were determined by linear regression (Origin software, OriginLab Corp., Northampton, MA USA). Lifetime distributions were plotted using a 1 ms bin width and, where appropriate, were fitted with one or more exponential functions using the maximum likelihood method. Events that lasted for < 0.664 ms were excluded from analysis. All channel substates were included in the lifetime distributions. The single-channel currents often had low activity and therefore it was difficult to determine accurately the numbers of channels in a patch. As such, we calculated open probability (Po) using the equation:
Burst duration analysis was carried out on channel currents in patches that contained more than one closed time constant, with the value of the fast time constant being at least 20 times smaller than any other time constant (Albert & Large, 2001a). Similar to the method of Magleby & Pallotta (1983), the critical time value (Tcrit), which is used to distinguish closures within a burst from closures between bursts, was calculated as 3–4 times the fast closed time constant.
Solutions and drugs
The myocytes were bathed in a standard K+-free external solution containing (mm): NaCl (126), CaCl2 (1.5), Hepes (10), glucose (11), 100 μm DIDS, 100 μm niflumic acid and 3–5 μm nicardipine, pH 7.2 with NaOH (267 ± 5 mosmol l−1). In the 0 [Ca2+]o solution, 1.5 mm CaCl2 was omitted and 1 mm BAPTA was added to chelate the Ca2+ to give a concentration of < 10 nm (calculated using EQCAL software, 290 ± 5 mosmol l−1). In the 89 mm [Ca2+]o solution, 126 mm NaCl was replaced with 89 mm CaCl2 and the pH was set at 7.2 with Tris (279 ± 5 mosmol l−1). Under these conditions, voltage-gated Ca2+, K+, swell-activated Cl− and Ca2+-activated Cl− currents are abolished, allowing the recording of non-selective cation conductances in isolation. The standard internal patch pipette solution contained (mm): CsCl (18), caesium aspartate (108), MgCl2 (1.2), Hepes (10), glucose (11), BAPTA (10), CaCl2 (1, free [Ca+]i ∼ 14 nm, as calculated using EQCAL software), Na2ATP (1), NaGTP (0.2), pH 7.2 with Tris (300 ± 5 mosmol l−1).
All drugs were from Sigma (UK). The values are the mean ± s.e.m. of n cells, and for any series of experiments, cells from at least three animals were used. Statistical analysis was carried out using Student's t test (paired and unpaired), with the level of significance set at P < 0.05.
Results
Spontaneous non-selective cation conductance in rabbit ear artery myocytes
Whole-cell currents were recorded from freshly dispersed rabbit ear artery myocytes using K+-free external and pipette solutions in which the Cl− equilibrium potential (ECl) was about −46 mV. Figure 1A illustrates a typical spontaneous whole-cell current recorded from a rabbit ear artery myocyte, which had a ‘noisy’ appearance and a holding current of −49 pA at −50 mV. In 80 myocytes, the mean spontaneous whole-cell current at −50 mV was −65 ± 4 pA (range −32 to −85 pA). Figure 1B shows that the mean current-voltage (I–V) relationship of the spontaneous whole-cell current exhibited slight inward rectification and an Er of about 0 mV, which is much more depolarised than ECl (n = 6). Therefore, the large, spontaneous whole-cell currents present in ear artery myocytes combined with their ‘noisy’ appearance suggested that rabbit ear artery myocytes contain a constitutively active cation conductance.
Figure 1. Constitutively active non-selective cation current observed with whole-cell recording in rabbit ear artery myocytes.
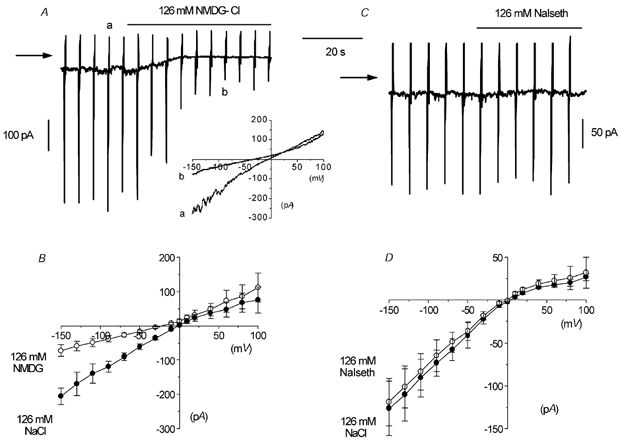
A, whole-cell recording of a ‘noisy’ inward current at a holding current of −50 mV. The vertical current deflections are in response to voltage ramps from −150 to +100 mV. Note that replacing 126 mm NaCl with NMDG-Cl reduced the ‘noisiness’ and the amplitude of the current at −50 mV. In this and subsequent figures, the horizontal arrow indicates zero current. The inset shows original current traces in 126 mm NaCl (a) and 126 mm NMDG-Cl (b). B, mean I–V relationship of spontaneous current in 126 mm NaCl and 126 mm NMDG-Cl in six cells. C, another cell where 126 mm NaCl was replaced by 126 mm sodium isethionate (NaIseth). D, mean I–V relationship of the spontaneous current in 126 mm NaCl and 126 mm sodium isethionate in six cells.
Ionic basis of spontaneous current
To further establish whether the spontaneous whole-cell currents in ear artery myocytes were due to a constitutively active cation conductance, we carried out experiments on the effects of replacing external 126 mm NaCl with equimolar concentrations of the salts of the impermeant cation ion NMDG and the impermeant anion isethionate. Figure 1A shows that changing from an external 126 mm NaCl solution to one containing 126 mm NMDG-Cl reduced the whole-cell current at −50 mV from −49 pA to −12 pA and decreased its ‘noisy’ appearance. In six artery myocytes, changing from 126 mm NaCl to 126 mm NMDG-Cl reduced the mean whole-cell current from −62 ± 8 pA to −17 ± 4 pA at −50 mV (P < 0.05, Fig. 1B) and shifted the Er of the mean I–V relationship from about 0 to −22 mV (Fig. 1B). Figure 1C and D shows that in six myocytes, bath application of 126 mm sodium isethionate had no effect on the holding current at −50 mV or the mean I–V relationship and Er. These results suggest that the spontaneous whole-cell currents are due to a constitutively active non-selective cation conductance with negligible anion permeability.
Single-channel currents resolved with whole-cell recording
In the first instance, to investigate the single-channel currents underlying spontaneous whole-cell currents in ear artery myocytes, we recorded spontaneous whole-cell currents using a higher gain (see Methods). Figure 2A shows a spontaneous whole-cell current that had a typical ‘noisy’ appearance and a holding current of −39 pA at −50 mV. The faster time record in the lower trace of Fig. 2A shows that the ‘noisy’ appearance of the spontaneous whole-cell current was due to rapid transitions between discrete resolvable current levels, i.e. representing opening and closing of ion channels. The records show that the channel currents had at least two different amplitude levels and in five myocytes the mean amplitudes were −1.02 ± 0.03 pA and −1.72 ± 0.08 pA at −50 mV. In addition, a smaller channel current amplitude was observed, but this level could not be accurately resolved using the filtering conditions needed to observe single-channel currents in the whole-cell configuration. Figure 2B shows that both resolvable open levels in spontaneous whole-cell currents had mean pooled I–V relationships from five patches that had slope conductances of 18 pS and 32 pS and, moreover, both had an Er of about +2 mV (close to the Er of the spontaneous whole-cell current).
Figure 2. Single-channel currents resolved with whole-cell recording.
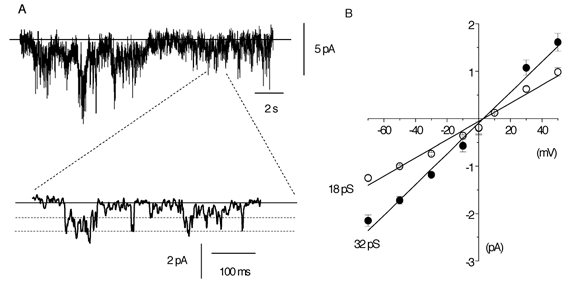
A, an illustration that background ‘noise’ can be resolved into single-channel currents, which, with the degree of filtering used, appear to possess at least two channel levels (see Methods). In this and subsequent single-channel records, the continuous horizontal line is the closed state and the dashed lines represent open levels, with inward currents represented as downward deflections. In this cell the holding current at −50 mV was −39 pA. B, I–V relationship of single-channel current amplitudes recorded with whole-cell recording. Each point is the mean of five cells; with some values the error bars are smaller than the symbols.
These data suggest that opening of cation channels underlies the spontaneous whole-cell cation conductance in ear artery myocytes and that these channel currents have at least two different conductance states.
Spontaneous single cation channel currents in isolated outside-out patches from rabbit ear artery myocytes
To describe accurately the biophysical properties of the single cation channel currents underlying spontaneous whole-cell currents in ear artery myocytes, we recorded spontaneously active cation channel activity in isolated outside-out patches. The isolated outside-out patch configuration has the advantage of improving the signal-to-noise ratio compared to whole-cell recording and therefore we could use less filtering and a higher sample rate during data acquisition to resolve more accurately different conductance states (see Methods).
In 46 outside-out patches, spontaneous cation channel activity could be observed immediately after excision of the patch from the whole-cell configuration and throughout the duration of the recording (up to 1 h) the level of activity did not alter. In 24 patches the spontaneous cation channel currents had an open probability (Po) of 0.09 ± 0.03 at −50 mV (Table 1). The remaining patches did contain channel currents, but these either had very low activity (Po < 0.001, n = 17) or very high activity (Po > 0.5, n = 5) at −50 mV. These differences in channel activity recorded in isolated patches may explain the variations in the amplitudes of the spontaneous whole-cell currents (range −32 to −85 pA at −50 mV), although as the number of channels in whole-cell and isolated patches could not be measured, direct comparison of channel activity cannot be made.
Table 1.
The effect of membrane potential on the kinetic properties of constitutively active single-channel currents from isolated outside-out patches
| Membrane potential (mV) | Po | Oτ1 (ms) | Oτ2 (ms) | Cτ1 (ms) | Cτ2 (ms) | Tcrit (ms) | Bτ1 (ms) | Bτ2 (ms) | n |
|---|---|---|---|---|---|---|---|---|---|
| −90 | 0.18 ± 0.07* | 0.8 ± 0.1 | 5.9 ± 0.5 | 1.3 ± 0.1 | 74 ± 15 | 6.8 ± 0.3 | 5.3 ± 0.7 | 50 ± 13* | 8 |
| −70 | 0.14 ± 0.04 | 0.9 ± 0.1 | 4.8 ± 0.5 | 1.2 ± 0.1 | 65 ± 17 | 5.8 ± 0.1 | 4.9 ± 1.1 | 41 ± 8.0* | 7 |
| −50 | 0.09 ± 0.03 | 0.8 ± 0.1 | 4.5 ± 0.3 | 1.3 ± 0.1 | 89 ± 17 | 6.6 ± 0.4 | 5.0 ± 0.4 | 23 ± 3.0 | 24 |
| −30 | 0.03 ± 0.03 | 0.9 ± 0.2 | 4.6 ± 0.5 | 1.6 ± 0.1 | 127 ± 35 | 8.1 ± 0.3 | 6.3 ± 0.9 | 27 ± 6.5 | 5 |
| −10 | 0.04 ± 0.01 | 0.7 ± 0.1 | 4.3 ± 0.4 | 1.6 ± 0.1 | 117 ± 11 | 7.2 ± 0.8 | 6.1 ± 1.4 | 26 ± 7.5 | 6 |
| +10 | 0.08 ± 0.03 | 0.7 ± 0.2 | 5.5 ± 0.3 | 1.5 ± 0.1 | 71 ± 7.0 | 7.3 ± 0.2 | 4.9 ± 0.4 | 20 ± 2.3 | 5 |
| +30 | 0.40 ± 0.13* | 0.9 ± 0.1 | 5.8 ± 1.2 | 1.1 ± 0.1 | 37 ± 13* | 5.7 ± 0.6 | 6.0 ± 0.4 | 41 ± 4.0* | 6 |
| +50 | 0.65 ±0.18* | 0.9 ±0.1 | 5.6 ± 0.4 | 1.0 ±0.1 | 35 ± 6.0* | 4.8 ± 0.1 | 6.1 ± 1.4 | 58 ±11* | 6 |
Po: open probability, Oτ1, Oτ2: mean open times, Cτ1, Cτ2: mean closed times, Bτ1, Bτ2: mean burst times, Tcrit: critical time value.
P < 0.05 compared to values at −50 mV.
Figure 3A shows spontaneously active cation channel currents with a Po of 0.14 at −50 mV. The faster time records beneath the longer time course show that the cation channel currents opened to three discrete amplitude levels and that there were also transitions between each of these three levels. Figure 3B shows that the amplitude histogram of the channel currents shown in Fig. 3A had three major peaks that were fitted by three Gaussian curves with peaks at −0.76, −1.22 and −2.12 pA. The amplitudes greater than the Gaussian peak at −2.12 pA probably represent multiple openings of the amplitude levels, since this patch contained more than one channel. Figure 3C shows pooled mean I–V relationships from several patches; the three amplitude levels had slope conductances of 15, 25 and 41 pS (n = 5–24) and all had an Er of about −2 mV.
Figure 3. Spontaneous single-channel currents recorded in isolated outside-out patches.
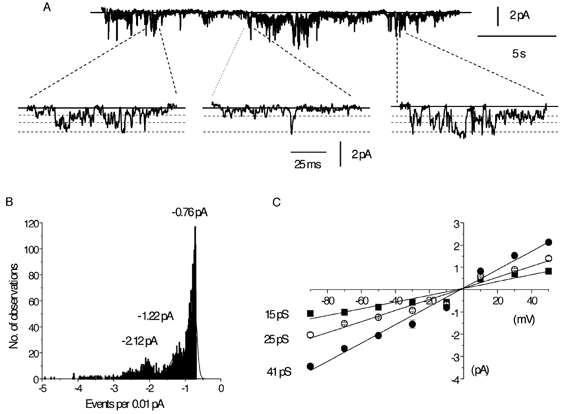
A, spontaneous single-channel activity at −50 mV on different gains and time scales. Amplified traces were selected to illustrate the direct transitions between all three open levels. B, amplitude histogram giving three unitary current amplitudes from the same cell used in A, at −50 mV; note that the smallest is the most commonly observed level. Note also that there are multiple openings, indicating that there is more than one channel in the patch. C, mean I–V relationship of the three current levels and each point is the mean of 5–24 patches.
Kinetic analysis of the spontaneous cation channel currents
Table 1 and Fig. 4 show the kinetic properties of the spontaneous cation channel currents recorded in isolated outside-out patches at −50 mV. The open time distributions of the spontaneous channel currents at −50 mV using all three conductance levels could be described by the sum of two exponentials with open time constants (Oτ) of about 1 ms (Oτ1) and 5 ms (Oτ2, Fig. 4A, Table 1). The closed time distributions of the channel currents at −50 mV could also be described by the sum of at least two exponentials with closed time constants (Cτ) of about 1.5 ms (Cτ1) and 90 ms (Cτ2, Fig. 4B, Table 1). The significant difference between the faster closed time constant (Cτ1) and the slower time constant (Cτ2) suggest that the spontaneous cation channel currents exhibit bursting behaviour, with Cτ1 reflecting channel closures within bursts of activity and Cτ2 relating to channel closures between bursts. Table 1 shows that a Tcrit value was calculated to distinguish between bursts of channel openings (see Methods); the burst lifetime distribution at −50 mV could be described by the sum of two exponentials with burst lifetime time constants (Bτ) of about 5 ms (Bτ1) and 25 ms (Bτ2, Fig. 4C).
Figure 4. Kinetic properties of the constitutively active single-channel currents.
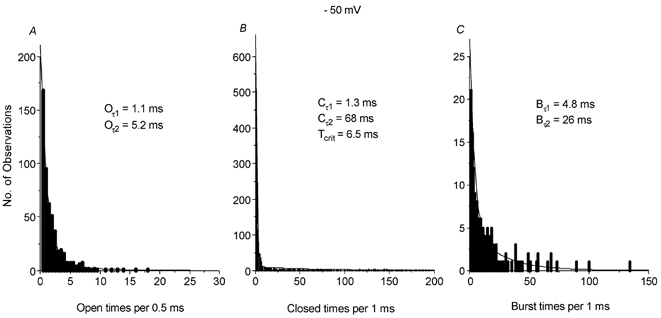
A, B and C show the open (Oτ), closed (Cτ) and burst time (Bτ) distributions of spontaneously active single-channel currents at −50 mV from a typical cell. All three distributions could be fitted by the sum of two exponentials. Tcrit= critical time value (see Methods).
Effect of membrane potential on the properties of spontaneous cation channel currents
Table 1 also shows that membrane potential had significant effects on the properties of spontaneous cation channel currents. Hyperpolarising the membrane from −50 to −90 mV significantly increased the mean Po of the spontaneous channel currents by about twofold, which was associated with a significant increase in the longer burst time (Bτ2, Table 1). Depolarising the membrane from −50 mV to +30 mV and +50 mV also significantly increased mean Po by five- and sevenfold, respectively and, moreover, these increases in Po were associated with significant increases in the longer burst times (Bτ2) and significant decreases in the longer closed times (Cτ2, Table 1). Between −50 mV and +10 mV, the properties of the spontaneous cation channel currents did not change significantly, and interestingly neither of the mean open times (Oτ1, Oτ2) were altered at any membrane potential (Table 1).
Effect of [Ca2+]o on spontaneous cation channel currents in rabbit ear artery myocytes
We have shown previously cation conductances in rabbit portal vein myocytes that have a significant permeability to Ca2+ ions, and which can be modulated by [Ca2+]o (Wang & Large, 1991; Helliwell & Large, 1996; Albert & Large, 2001b; 2002a, b), and therefore we investigated the effect of [Ca2+]o on the spontaneous whole-cell and single cation channel currents in ear artery myocytes.
Figure 5A shows that changing from 1.5 mm [Ca2+]o to 0 [Ca2+]o increased the spontaneous whole-cell current from −34 pA to −76 pA at −50 mV, and increased its ‘noisy’ appearance. In six ear artery myocytes, changing from 1.5 mm to 0 [Ca2+]o increased the mean spontaneous whole-cell current from −35 ± 3 pA to −97 ± 25 pA at −50 mV (Fig. 5B, P < 0.05). Figure 5B shows the mean I–V relationships of six spontaneous whole-cell currents recorded in 1.5 mm and 0 [Ca2+]o, and it can be seen that the level of [Ca2+]o had no effect on Er.
Figure 5. Effect of removing external Ca2+ ions on whole-cell and single-channel activity in an isolated outside-out patch.
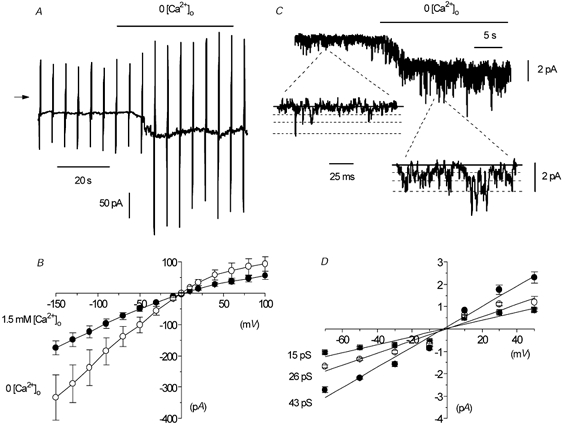
A, spontaneous whole-cell current where external Ca2+ ions were removed (+1 mm BAPTA). B, mean I–V relationship of whole-cell current in 1.5 mm or 0 [Ca2+]o in six cells. C, effect of 0 [Ca2+]o on single-channel currents in an outside-out patch. The shift in baseline is due to reduced seal resistance caused by 0 [Ca2+]o, which also produced multiple openings and accounts for some currents exceeding the level of the highest conductance state. D, mean I–V relationship of the three conductance levels of the single-channel currents shown in B. Each point is the mean of 5–9 patches.
Figure 5C shows that changing from 1.5 mm to 0 [Ca2+]o enhanced markedly the activity of cation channel currents, and in this patch Po was increased from 0.09 to 0.26. In nine patches, changing from 1.5 mm [Ca2+]o to 0 [Ca2+]o significantly increased the mean Po of spontaneous channel activity from 0.06 ± 0.02 to 0.36 ± 0.12 (P < 0.05) and, moreover, the activity of all three amplitude levels was increased (Fig. 5C). Figure 5D shows that in 0 [Ca2+]o the mean pooled I–V relationships of the spontaneous channel currents from several patches had slope conductances states of 15, 26 and 43 pS (n = 5–9), and that all three states had an Er of about −2 mV. Therefore, removal of [Ca2+]o increased the whole-cell current by increasing Po, but did not change the unitary conductance of the channels.
We also investigated the effect of an intermediate [Ca2+]o on spontaneous cation channel currents in isolated outside-out patches. In 10 patches, changing from 1.5 mm [Ca2+]o to 100 μm [Ca2+]o significantly increased the mean Po of spontaneous channel activity from 0.07 ± 0.03 to 0.20 ± 0.05 (P < 0.05), but did not alter the amplitude of the three conductance states or their mean I–V relationships and Er (data not shown).
In 0 and 100 μm [Ca2+]o, the open, closed and burst lifetime distributions of the cation channel currents at −50 mV could all be described by the sum of the same number of time constants as those channel currents recorded in 1.5 mm [Ca2+]o. However, in nine patches the increase in channel activity on changing from 1.5 mm to 0 [Ca2+]o at −50 mV was associated with a significant increase in the longer burst time (Bτ2) from 22 ± 3 ms to 49 ± 7 ms (P < 0.05) and a significant reduction in the longer closed time (Cτ2) from 128 ± 43 ms to 38 ± 3 ms (P < 0.05). In addition, in 10 patches, changing from 1.5 mm to 100 μm [Ca2+]o at −50 mV was also associated with a significant increase in the longer burst time (Bτ2) from 22 ± 2 ms to 38 ± 5 ms (P < 0.05) and a significant reduction of the longer closed time (Cτ2) from 93 ± 12 ms to 53 ± 8 ms (P < 0.05). Changing from 1.5 mm to 0 or 100 μm [Ca2+]o at −50 mV had no effect on the two mean open times.
To investigate whether the spontaneous cation channels were permeable to Ca2+ ions, we carried out experiments using 89 mm [Ca2+]o. Figure 6A illustrates the effect of an external solution containing 89 mm [Ca2+]o on the spontaneous whole-cell current. Changing from 1.5 mm to 89 mm [Ca2+]o reduced the whole-cell current from −74 pA to −8 pA at −50 mV and greatly reduced the ‘noisy’ appearance of the spontaneous current (Fig. 6A). In five myocytes, changing from 1.5 mm [Ca2+]o to 89 mm [Ca2+]o significantly reduced the mean whole-cell current from −54 ± 22 pA to −10 ± 3 pA (P < 0.05) at −50 mV. Figure 6B shows that changing from 1.5 mm [Ca2+]o to 89 mm [Ca2+]o produced a mean I–V relationship with dual rectifying properties, with increases in current amplitude at the extremes of the voltage ramp. Moreover, in five myocytes, on changing from 1.5 mm [Ca2+]o to 89 mm [Ca2+]o the Er of the mean I–V relationship was shifted to about +30 mV (Fig. 6B).
Figure 6. Spontaneous inward current is carried by Ca2+ ions in whole-cell and outside-out patches.
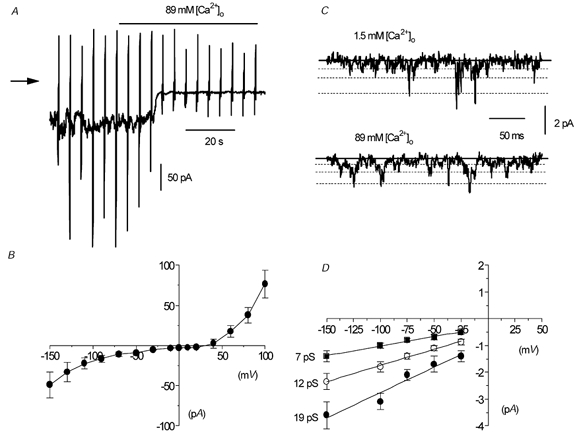
A, effect of replacement of 126 mm NaCl by 89 mm CaCl2 on spontaneous whole-cell current. B, mean I–V relationship of spontaneous whole-cell current in 89 mm CaCl2 in five cells. C, single-channel currents in 1.5 mm and 89 mm CaCl2 in the same outside-out patch. D, mean I–V relationship of unitary current in five outside-out patches in 89 mm CaCl2.
Figure 6C shows the effect of changing from 1.5 mm [Ca2+]o to 89 mm [Ca2+]o on spontaneous cation channel currents in an isolated outside-out patch at –50 mV. On changing from 1.5 mm to 89 mm [Ca2+]o, three channel current amplitudes were observed, although their amplitudes were all smaller than those recorded in 1.5 mm [Ca2+]o (Fig. 6C). Figure 6D shows that in five patches recorded in 89 mm [Ca2+]o the three open levels had conductance states of 7, 12 and 19 pS (i.e. about half the values obtained in 1.5 mm [Ca2+]o) and, moreover, extrapolation of the inward current amplitudes, which represents the influx of Ca2+ ions through the cation channels, gave an Er of about +30 to +40 mV.
These data suggest that removal of [Ca2+]o markedly enhances the activity of spontaneous cation channel currents in rabbit ear artery myocytes and that these channels are also permeable to Ca2+ ions.
The effect of the DAG analogue 1-oleoyl-2-acetyl-sn-glycerol (OAG) on isolated outside-out patches
We have shown previously that the DAG analogue OAG activates cation conductances in rabbit portal vein myocytes via both PKC-dependent and PKC-independent mechanisms (Helliwell & Large, 1997; Albert & Large, 2002b) and therefore we investigated effect of OAG in rabbit ear artery smooth muscle cells.
Figure 7A shows that application of 50 μm OAG evoked a ‘noisy’ whole-cell cation current with peak amplitude of −16 pA at −50 mV, which subsequently declined in the presence of OAG. In seven myocytes, bath application of 50 μm OAG activated cation currents with a mean peak amplitude of −17 ± 3 pA at −50 mV. Figure 7B shows the mean I–V relationship from seven myocytes; it can be seen that the Er was similar to those of the spontaneous whole-cell current.
Figure 7. The effect of the DAG analogue OAG on whole-cell and single-channel activity.
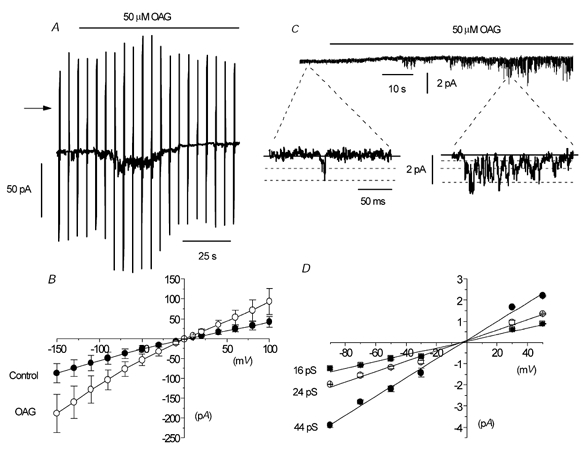
A, bath application of 50 μm OAG activated a whole-cell current that subsequently declined. B, mean I–V relationship of whole-cell current in the absence and presence of 50 μm OAG in seven cells. C, effect of 50 μm OAG on an outside-out patch where the basal activity was relatively low. D, mean I–V relationship of the single-channel currents activated by 50 μm OAG, with each point a mean of 5–7 patches.
To investigate whether the channel currents underlying the OAG-induced whole-cell currents were the same as spontaneous cation channel currents, we examined the effect of OAG on isolated outside-out patches that contained spontaneous cation channel currents with a relatively low Po (< 0.001) in which excitation would be easier to observe. Figure 7C shows that bath application of 50 μm OAG activated inward channel currents with a Po of 0.12 at −50 mV, which had three different amplitude levels. In seven patches, the mean Po of the OAG-evoked channel currents was 0.08 ± 0.03 and the mean amplitude of the three open levels was −0.76 ± 0.05 pA, −1.12 ± 0.05 pA and −2.18 ± 0.13 pA at −50 mV. Figure 7D shows that the mean pooled I–V relationships of OAG-induced channel currents from several patches had slope conductances of 16, 24 and 44 pS (n = 5–7), and all three I–V relationships had Er of about −2 mV. In addition, the kinetic properties of the OAG-evoked channel currents at −50 mV were not significantly different from those of the spontaneous cation channel currents (data not shown).
To investigate further whether the OAG-induced channel currents were similar to the spontaneous cation channel currents, we examined the effect of removing [Ca2+]o. On changing from 1.5 mm to 0 [Ca2+]o the mean Po of the OAG-induced channel currents was significantly increased from 0.07 ± 0.03 to 0.20 ± 0.06 (n = 5, P < 0.05) at −50 mV, and this was associated with an increase in the longer burst time (Bτ2) from 38 ± 10 ms to 66 ± 11 ms (n = 5, P < 0.05), and a reduction in the longer closed time (Cτ2) from 70 ± 12 ms to 45 ± 11 ms (n = 5, P < 0.05).
These data show that OAG increases the activity of the constitutively active cation channels.
The effect of PKC modulation on the spontaneous cation conductance
It is well known that DAG is an activator of PKC and therefore we investigated whether OAG activates the cation channel currents in isolated outside-out patches via a PKC-dependent mechanism by examining the effect of the PKC activator, phorbol 12,13-dibutyrate (PDBu). Figure 8A shows that bath application of 1 μm PDBu reversibly decreased a spontaneous whole-cell current from −35 pA to −17 pA at −50 mV and reduced the ‘noisy’ appearance of the spontaneous current. In five myocytes, bath application of 1 μm PDBu significantly inhibited the mean spontaneous whole-cell current from −62 ± 23 pA to −31 ± 13 pA (P < 0.05, Fig. 8B) at −50 mV. Figure 8B shows the mean I–V data from five myocytes in which 1 μm PDBu did not alter the Er.
Figure 8. The effect of PDBu on whole-cell current and single-channel currents in isolated patches.
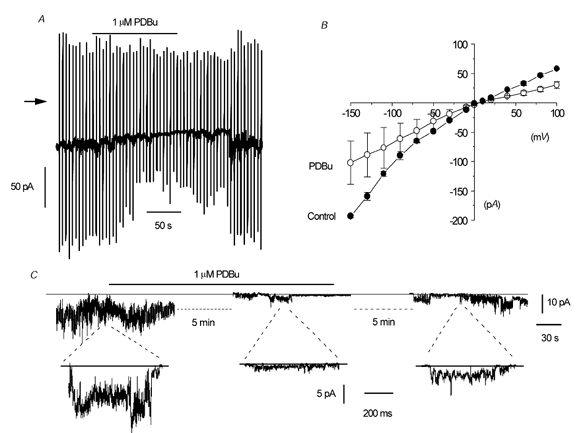
A, reversible suppression of whole-cell current at a holding potential of −50 mV by 1 μm PDBu. B, mean I–V relationship of whole-cell current in the absence and presence of 1 μm PDBu in five cells. C, effect of 1 μm PDBu on single-channel currents in an outside-out patch. In this patch the channel activity was relatively high and it is difficult to resolve discrete single-channel openings; the record simply appears ‘noisy’. Also, in the outside patch the effect of PDBu was partially reversible.
To investigate the effect of activating PKC at the single-channel level we examined the effect of PDBu in outside-out patches that had relatively high spontaneous channel activity (Po > 0.5), in which inhibition could be readily observed. Figure 8C shows in a long-term recording that bath application of 1 μm PDBu reduced the ‘noisy’ appearance of spontaneous cation channel currents at −50 mV. The faster time recordings beneath the long-term trace show that after about 5 min of treatment with 1 μm PDBu the fluctuations are reduced to reveal individual channel openings that represent a reduction in Po from 1.9 to 0.08. In addition, the long-term and faster time recordings show that the effect of 1 μm PDBU was partially reversible. In five patches, bath application of 1 μm PDBu decreased the mean Po of the spontaneous cation channel currents from 1.86 ± 0.76 to 0.36 ± 0.22, representing a 82 ± 11 % reduction in Po.
These results suggest that stimulation of PKC inhibits the spontaneous cation conductance in ear artery myocytes and it is therefore unlikely that OAG activates the cation channel currents via a PKC-dependent mechanism.
The effect of the PKC inhibitor chelerythrine on isolated outside-out patches
The data with PDBu show that activation of PKC inhibits both spontaneous whole-cell currents and spontaneous cation channel currents in isolated outside-out patches. Next we investigated whether there is constitutive PKC activity which suppresses the carbon conductance by studying the effect of the PKC inhibitor chelerythrine on spontaneous whole-cell current and on channel activity in isolated patches. For these experiments we used patches with a relatively low Po (< 0.001) so that excitation could be easily observed.
Figure 9A shows that bath application of 3 μm chelerythrine increased the spontaneous whole-cell current. At first the increase is observed only at the most positive and negative potentials of the ramps, but after about 4 min the spontaneous current at −50 mV was increased from −38 pA to −88 pA (Fig. 9A). In six myocytes, bath application of 3 μm chelerythrine significantly increased the mean spontaneous whole-cell current from −35 ± 4 pA to −77 ± 16 pA at −50 mV (P < 0.05, Fig. 8B). Figure 9B also shows the mean I–V relationship of the spontaneous whole-cell current; note that Er was not altered in chelerythrine (n = 6).
Figure 9. The effect of chelerythrine on whole-cell current and single-channel currents in an outside-out patch.
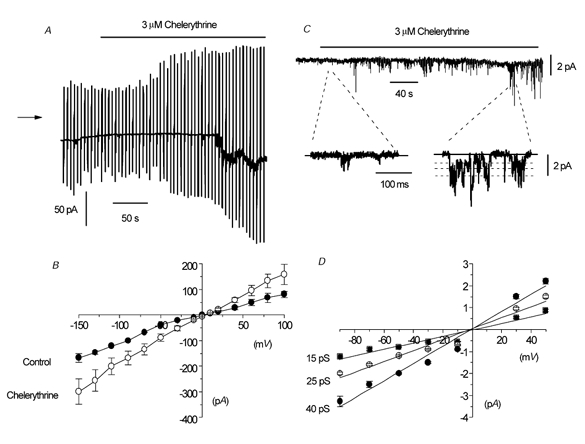
A, effect of chelerythrine on whole-cell current at a holding potential of −50 mV. At first the increase in current was noticeable at extreme potentials of the voltage ramps before an inward current at −50 mV was observed. B, mean I–V relationship of whole-cell current in the absence and presence of 3 μm chelerythrine in six cells. C, effect of 3 μm chelerythrine on single-channel activity in an outside-out patch. Note that there are several multiple openings in this patch, which accounts for some single-channel currents being apparently larger than the indicated conductance levels. D, mean I–V relationship of chelerythrine-induced single-channel currents in isolated outside-out patches. Each point is the mean of 4–10 patches.
Figure 9C illustrates that bath application of 3 μm chelerythrine activated inward channel currents in an isolated outside-out patch held at −50 mV that had a Po of 0.08 at maximum activation. The fast time records also show that chelerythrine-induced channel currents had three different amplitude levels. In 10 patches, bath application of 3 μm chelerythrine activated channel currents with a mean Po of 0.08 ± 0.02 and amplitude levels of −0.88 ± 0.03 pA, −1.28 ± 0.04 pA and −2.25 ± 0.06 pA at −50 mV. Figure 9D shows that the mean pooled I–V relationships of the three amplitude levels from several patches had slope conductances of 15, 25 and 40 pS, respectively (n = 4–10) and they all had an Er of about −2 mV. The chelerythrine-induced channel currents at −50 mV also had kinetic properties that were similar to the data shown in Table 1 (data not shown).
On changing from 1.5 mm [Ca2+]o to 0 [Ca2+]o, the mean Po of the chelerythrine-induced channel currents was significantly increased from 0.05 ± 0.03 to 0.12 ± 0.01 (n = 5, P < 0.05) at −50 mV, and this was associated with an increase in the longer burst time (Bτ2) from 27 ± 4 ms to 45 ± 4 ms (P < 0.05) and a reduction in the longer closed time (Cτ2) from 90 ± 20 ms to 58 ± 9 ms (P < 0.05).
These results indicate that chelerythrine activates the same channel currents as the spontaneous cation channel currents, and therefore suggests that there is constitutive PKC activity in rabbit ear artery myocytes that suppresses cation channel activity.
Discussion
In the present work we have described a constitutively active non-selective cation current with whole-cell recording and the properties of the underlying channel currents in outside-out patches of rabbit ear artery myocytes. The channels described here are different conductances from the non-selective cation channel currents that have been described previously for this preparation. A non-selective cation current gated by ATP was demonstrated by Benham et al. (1987) in ear artery myocytes, but these are ligand-gated channels that require the presence of the agonist to produce significant channel opening. Moreover, the ATP-gated channel has only a single conductance level of about 20 pS (Benham & Tsien, 1987), compared to the three conductance states of the basally active channel described in the present work. Previously we have also described a Ca2+-activated non-selective cation channel in ear artery myocytes that has a single-channel conductance state of about 28 pS, but is impermeable to Ca2+ ions (Wang et al. 1993). This is in contrast to the conductance described here, which is constitutively active when [Ca2+]i is buffered to very low levels, readily allows the permeation of Ca2+ ions and possesses three conductance states.
Comparison of whole-cell currents with single-channel currents in isolated patches
There is considerable evidence to show that the single-channel currents recorded in isolated patches underlie the whole-cell current. With both recording configurations, the conductances were spontaneously active and were permeable to Ca2+ ions. In addition, removal of Ca2+ ions increased the amplitude and ‘noisiness’ of the whole-cell current, which was reflected in the large increase in the Po of single-channel currents in isolated patches. Moreover, the amplitude of the whole-cell currents and channel activity in isolated patches was increased by OAG and chelerythrine, but decreased by PDBu. Although only two single-channel states of about 18 and 32 pS were resolved with whole-cell recording, it seems extremely likely that the degree of filtering that was necessary to observe these events prevented the resolution of the three levels identified in isolated patches where considerably less filtering was used. Overall, therefore, the data indicate that the spontaneous channel currents observed in isolated patches generated the constitutively active conductance recorded with whole-cell recording.
Do the three channel current levels represent substates of the same channel or different conductances?
The following evidence suggests that the different current levels represent different substates of the same channel rather than separate channels. First, all three states were always observed in isolated patches and no patches demonstrated only one or two conductance levels. Moreover, in relatively quiescent patches where the Po was low, application of OAG and chelerythrine increased the activity of all three states. Also, reduction of Po by PDBu was associated with a decrease in openings to the three channel levels. Secondly, it was possible to observe discrete transitions between all states in patches that appeared to contain only one channel. Finally, the Er of the three states was similar and the amplitudes and Er values were altered by similar amounts in 89 mm [Ca2+]o. In summary, it appears that a single channel protein is responsible for the constitutive activity, but that the channel has three conductance states.
Comparison with non-selective cation channels in rabbit portal vein
We have reported previously two Ca2+-permeable non-selective cation conductances in rabbit portal vein, and it is of interest to compare these channels with that described in the present study. It is clear that the channel described in the present work is distinct from the store-operated channel reported in the portal vein, which has markedly different channel properties and modulation by PKC (cf. present work with Albert & Large, 2002a, b). However, although there are some similarities, there are also notable differences between the noradrenaline-evoked current (Icat) in rabbit portal vein and the constitutively active current in ear artery.
In portal vein, Icat displays little basal activity and is activated by noradrenaline (Byrne & Large, 1988), whereas in rabbit ear artery there is a high level of constitutive activity. In both tissues, the DAG analogue OAG stimulates the current via a PKC-independent mechanism (Helliwell & Large, 1997 and present work), but using identical recording conditions different responses to activators and inhibitors of PKC were observed. In portal vein myocytes, neither PDBu nor chelerythrine altered the noradrenaline-induced Icat (Helliwell & Large, 1997). In contrast, in ear artery myocytes, PDBu and chelerythrine decreased and increased, respectively, the spontaneous current. These results indicate that PKC has a modulatory role on the cation current in ear artery but not in portal vein, at least under these recording conditions. Moreover, in ear artery it appears that there is a tonic PKC activity that suppresses channel activity.
Single-channel recording in outside-out patches showed that in portal vein in 1.5 mm [Ca2+]o, the predominant state has a conductance of 23 pS, but that a subconductance level of 13 pS is also present in some patches (Albert & Large, 2001a, b). In ear artery, three conductance states of about 15, 25 and 40 pS were apparent, and the lower conductance state was the most commonly observed level. Also, in portal vein, removal of [Ca2+]o and hyperpolarising the membrane from −50 to −90 mV had no effect on the Po (Albert & Large, 2001a, b). In contrast, in ear artery there was a marked increase in Po on removal of [Ca2+]o (sixfold) and hyperpolarisation (twofold). Therefore, the single-channel studies also reveal marked differences in the properties of the non-selective cation conductance in portal vein and ear artery, which suggests that they are different molecular entities. However, it should be noted that the cation channels in both the portal vein and ear artery have similar kinetic properties. Both conductances have two mean open times of similar value and, moreover, the channels in both preparations display bursting behaviour with two burst durations with values of the same order (cf. present study with Albert & Large, 2001a).
It has been shown that a member of the transient receptor potential (TRP) group of proteins, TRPC6, is an important component of the cation conductance in rabbit portal vein (Inoue et al. 2001). Based on the above discussion, the conductance in ear artery is not simply TRPC6, but is likely to belong to the same family of proteins.
Physiological significance of non-selective cation current in rabbit ear artery smooth muscle cells
The resting membrane potential in intact segments of ear artery is between −60 and −65 mV (Droogmans et al. 1977; Suzuki & Kou, 1983) and therefore the constitutively active cation current described in this paper may drive the membrane potential to values more depolarised than EK (i.e. it may contribute to the resting conductance). It is possible that this, or a similar conductance may be important in non-vascular smooth muscle and other cells. For example, classical experiments of Bülbring & Tomita (1970) demonstrated that removal of [Ca2+]o depolarised the guinea-pig taenia coli, with a concomitant reduction in membrane resistance. Since these effects were not observed if external NaCl was replaced by sucrose, it was concluded that [Ca2+]o controlled the Na+ permeability (Bülbring & Tomita, 1970). These results could be accounted for by the mechanism described in the present work, and might also occur in other electrically excitable cells where a reduction of [Ca2+]o leads to membrane depolarisation and increased excitability. Finally, since the constitutively active conductance is permeable to Ca2+ ions this pathway may be responsible for basal Ca2+ influx.
Acknowledgments
We are grateful to A. Aromolaran, who carried out some of the preliminary experiments. This work was supported by The Wellcome Trust.
References
- Albert AP, Large WA. Comparison of spontaneous and noradrenaline-evoked non-selective cation channels in rabbit portal vein myocytes. J Physiol. 2001a;530:457–468. doi: 10.1111/j.1469-7793.2001.0457k.x. [DOI] [PMC free article] [PubMed] [Google Scholar]
- Albert AP, Large WA. The effect of external divalent cation on spontaneous non-selective cation channel currents in rabbit portal vein myocytes. J Physiol. 2001b;536:409–420. doi: 10.1111/j.1469-7793.2001.0409c.xd. [DOI] [PMC free article] [PubMed] [Google Scholar]
- Albert AP, Large WA. A Ca2+-permeable non-selective cation channel activated by internal Ca2+ stores in single rabbit portal vein myocytes. J Physiol. 2002a;538:717–728. doi: 10.1113/jphysiol.2001.013101. [DOI] [PMC free article] [PubMed] [Google Scholar]
- Albert AP, Large WA. Activation of store-operated channels by noradrenaline via protein kinase C in rabbit portal vein myocytes. J Physiol. 2002b;544:113–125. doi: 10.1113/jphysiol.2002.022574. [DOI] [PMC free article] [PubMed] [Google Scholar]
- Bae YM, Park MK, Lee SH, Ho W-K, Earm YE. Contribution of Ca2+-activated K+ channels and non-selective cation channels to membrane potential of pulmonary arterial smooth muscle cells of the rabbit. J Physiol. 1999;514:747–758. doi: 10.1111/j.1469-7793.1999.747ad.x. [DOI] [PMC free article] [PubMed] [Google Scholar]
- Benham CD, Bolton TB, Byrne NG, Large WA. Action of externally applied adenosine triphosphate on single smooth muscle cells dispersed from rabbit ear artery. J Physiol. 1987;387:473–488. doi: 10.1113/jphysiol.1987.sp016585. [DOI] [PMC free article] [PubMed] [Google Scholar]
- Benham CD, Tsien RW. A novel receptor-operated Ca2+-permeable channel activated by ATP in smooth muscle. Nature. 1987;328:275–278. doi: 10.1038/328275a0. [DOI] [PubMed] [Google Scholar]
- Bülbring E, Tomita T. Effects of Ca removal in the smooth muscle of the guinea-pig taenia coli. J Physiol. 1970;210:217–232. doi: 10.1113/jphysiol.1970.sp009205. [DOI] [PMC free article] [PubMed] [Google Scholar]
- Byrne NG, Large WA. Membrane ionic mechanisms activated by noradrenaline in cells isolated from the rabbit portal vein. J Physiol. 1988;404:557–573. doi: 10.1113/jphysiol.1988.sp017306. [DOI] [PMC free article] [PubMed] [Google Scholar]
- Colquhoun D. Practical analysis of single channel records. In: Standen NB, Gray PTA, Whitaker MJ, editors. Microelectrode Techniques. Cambridge: The Company of Biologists; 1987. pp. 83–104. [Google Scholar]
- Droogmans G, Raeymaekers L, Casteels R. Electro- and pharmacomechanical coupling in the smooth muscle cells of the rabbit ear artery. J Gen Physiol. 1977;70:129–148. doi: 10.1085/jgp.70.2.129. [DOI] [PMC free article] [PubMed] [Google Scholar]
- Greenwood IA, Large WA. Properties and role of chloride channels in smooth muscle. In: Kozlowski R, editor. Chloride Channels. Oxford: Isis Medical Media; 1999. pp. 121–135. [Google Scholar]
- Hamill OP, Marty A, Neher E, Sakmann B, Sigworth FJ. Improved patch-clamp techniques for high-resolution current recording from cells and cell-free membrane patches. Pflugers Arch. 1981;391:85–100. doi: 10.1007/BF00656997. [DOI] [PubMed] [Google Scholar]
- Helliwell RM, Large WA. Dual effect of external Ca2+ on noradrenaline-activated cation current in rabbit portal vein smooth muscle cells. J Physiol. 1996;492:75–88. doi: 10.1113/jphysiol.1996.sp021290. [DOI] [PMC free article] [PubMed] [Google Scholar]
- Helliwell RM, Large WA. α1-Adrenoceptor activation of a non-selective cation current in rabbit portal vein by 1,2-diacyl-sn-glycerol. J Physiol. 1997;499:417–428. doi: 10.1113/jphysiol.1997.sp021938. [DOI] [PMC free article] [PubMed] [Google Scholar]
- Inoue R, Okada T, Onoue H, Hara Y, Shimizu S, Naitoh S, Ito Y, Mori Y. The transient receptor potential protein homologue TRP6 is the essential component of vascular α1-adrenoceptor-activated Ca2+-permeable cation channel. Circ Res. 2001;88:325–337. doi: 10.1161/01.res.88.3.325. [DOI] [PubMed] [Google Scholar]
- Kuriyama H, Kitamura K, Itoh T, Inoue R. Physiological features of visceral smooth muscle cells, with special reference to receptors and ion channels. Physiol Rev. 1998;78:811–920. doi: 10.1152/physrev.1998.78.3.811. [DOI] [PubMed] [Google Scholar]
- Large WA. The effect of chloride removal on the responses of the isolated rat anococcygeus muscle to α1-adenoceptor stimulation. J Physiol. 1984;352:17–29. doi: 10.1113/jphysiol.1984.sp015275. [DOI] [PMC free article] [PubMed] [Google Scholar]
- Large WA, Wang Q. Characteristics and physiological role of the Ca2+-activated Cl− conductance in smooth muscle. Am J Physiol. 1996;271:C435–454. doi: 10.1152/ajpcell.1996.271.2.C435. [DOI] [PubMed] [Google Scholar]
- Magleby KL, Pallotta BS. Burst kinetics of single calcium-activated potassium channels in cultured rat muscle. J Physiol. 1983;344:605–623. doi: 10.1113/jphysiol.1983.sp014958. [DOI] [PMC free article] [PubMed] [Google Scholar]
- Nelson MT, Quayle JM. Physiological roles and properties of potassium channels in arterial smooth muscle. Am J Physiol. 1995;268:C799–822. doi: 10.1152/ajpcell.1995.268.4.C799. [DOI] [PubMed] [Google Scholar]
- Suzuki H, Kou K. Electrical components contributing to the nerve-mediated contractions in the smooth muscles of the rabbit ear artery. Jpn J Physiol. 1983;33:743–756. doi: 10.2170/jjphysiol.33.743. [DOI] [PubMed] [Google Scholar]
- Van Helden DF. Electrophysiology of neuromuscular transmission in guinea-pig mesenteric veins. J Physiol. 1988;401:469–488. doi: 10.1113/jphysiol.1988.sp017173. [DOI] [PMC free article] [PubMed] [Google Scholar]
- Wang Q, Hogg RC, Large WA. A monovalent ion-selective cation current activated by noradrenaline in smooth muscle cells of rabbit ear artery. Pflugers Arch. 1993;423:28–33. doi: 10.1007/BF00374957. [DOI] [PubMed] [Google Scholar]
- Wang Q, Large WA. Noradrenaline-evoked cation conductance recorded with the nystatin whole-cell method in rabbit portal vein cells. J Physiol. 1991;435:21–39. doi: 10.1113/jphysiol.1991.sp018496. [DOI] [PMC free article] [PubMed] [Google Scholar]


