

Abstract
We aimed to estimate the number of AMPA receptors (AMPARs) bound by the quantal transmitter packet, their single-channel conductance and their density in the postsynaptic membrane at cerebellar Purkinje cell synapses. The synaptic and extrasynaptic AMPARs were examined in Purkinje cells in 2- to 4-day-old rats, when they receive synaptic inputs solely from climbing fibres (CFs). Evoked CF EPSCs and whole-cell AMPA currents displayed roughly linear current-voltage relationships, consistent with the presence of GluR2 subunits in synaptic and extrasynaptic AMPARs. The mean quantal size, estimated from the miniature EPSCs (MEPSCs), was ∼300 pS. Peak-scaled non-stationary fluctuation analysis of spontaneous EPSCs and MEPSCs gave a weighted-mean synaptic channel conductance of ∼5 pS (∼7 pS when corrected for filtering). By applying non-stationary fluctuation analysis to extrasynaptic currents activated by brief glutamate pulses (5 mm), we also obtained a small single-channel conductance estimate for extrasynaptic AMPARs (∼11 pS). This approach allowed us to obtain a maximum open probability (Po,max) value for the extrasynaptic receptors (Po,max = 0.72). Directly resolved extrasynaptic channel openings in the continued presence of glutamate exhibited clear multiple-conductance levels. The mean area of the postsynaptic density (PSD) of these synapses was 0.074 μm2, measured by reconstructing electron-microscopic (EM) serial sections. Postembedding immunogold labelling by anti-GluR2/3 antibody revealed that AMPARs are localised in PSDs. From these data and by simulating error factors, we estimate that at least 66 AMPARs are bound by a quantal transmitter packet at CF-Purkinje cell synapses, and the receptors are packed at a minimum density of ∼900 μm−2 in the postsynaptic membrane.
At chemically mediated synapses, the postsynaptic response generated by a single neurotransmitter packet represents the basic event underlying fast transmission (Katz, 1996). Determining the number of receptors bound by a quantal packet of transmitter and the magnitude of the unitary response provides fundamental information about central synaptic transmission. These functional parameters are tightly linked to the molecular identity of the receptor channels, being critically dependent on the receptor subunit composition (Dingledine et al. 1999; Hollmann, 1999). To understand the behaviour of postsynaptic receptors that determines the basic features of synaptic currents, it is essential to characterise receptors at the single-channel level. Because the postsynaptic membrane is inaccessible to patch-clamp electrodes, single-channel analysis has generally been applied to extrasynaptic receptors in isolated patches from the soma or dendrites.
At synapses where the receptor channels display slow kinetics and a relatively large conductance, it has been possible to measure discrete single-channel steps in the synaptic current decay. This method has successfully provided conductance estimates for synaptic channels associated with NMDARs in cerebellar granule cells (Silver et al. 1992; Clark et al. 1997), glycine receptors in spinal cord neurons (Takahashi & Momiyama, 1991) and GABAA receptors in melanotrophs and cerebellar granule cells (Borst et al. 1994; Brickley et al. 1999). The approach is not feasible for non-NMDARs because of their small channel conductance and fast gating properties. At synapses where channel openings cannot be resolved, the unitary conductances have been estimated from peak-scaled non-stationary fluctuation analysis (PS-NSFA) of synaptic currents (Robinson et al. 1991; Traynelis et al. 1993; De Koninck & Mody, 1994; Otis et al. 1994; Benke et al. 1998). However, unlike conventional non-stationary fluctuation analysis (Sigworth, 1980) applied to single-site synapses (Silver et al. 1996; Auger & Marty, 1997; Forti et al. 1997), PS-NSFA cannot yield an estimate of the open probability of receptor channels.
In the present study we have combined complementary strategies to determine functional properties of synaptic and extrasynaptic AMPA receptors (AMPARs) that allowed us to estimate the number of receptors bound by a quantal packet of transmitter. We have chosen climbing fibre (CF)-cerebellar Purkinje cell synapses at an early stage of development (postnatal days 2–4). The presence of a single type of excitatory input at this stage (climbing fibres; Altman, 1972; Crépel et al. 1981) and the proximal location of the synaptic contacts (Robain et al. 1981; Chedotal & Sotelo, 1993) was advantageous, fulfilling the technical requirement for high-resolution recording of quantal events. Furthermore, these electrophysiological measurements of functional parameters were combined with ultrastructural measurements of the postsynaptic membrane area (PSD in serial EM sections) and postembedding labelling for GluR2/3. Based on these results, we have estimated a lower limit for the packing density of AMPARs at this central glutamate synapse.
Methods
Slice preparation
All experiments were performed in accordance with the UK Animals (Scientific Procedures) Act 1986 and the Guiding Principles for the Care and Use of Animals in the Field of Physiological Sciences of the Physiological Society of Japan (1998).
Parasagittal cerebellar slices (200–300 μm) were prepared from 2- to 4-day-old Sprague-Dawley rats, as described previously (Momiyama et al. 1996a). Briefly, animals were decapitated and the brain removed rapidly and placed in cold slicing solution. Slices were cut from dissected cerebella by means of a vibrating microslicer (DTK-1000; Dosaka EM Company, Kyoto, Japan) in cold (4 °C) oxygenated Krebs solution. Slices were incubated for 1 h at 30–32 °C then maintained at room temperature (21–24 °C) for up to 6 h.
Solutions and drugs
The composition of the slicing solution was as follows (mm): NaCl, 125; KCl, 2.5; CaCl2, 1; MgCl2, 5; NaHCO3, 26; NaH2PO4, 1.25; glucose 25. For electrophysiological experiments, CaCl2 was raised to 2 (or 5) mm, as indicated in the text. Drugs were added to the perfusate. Bicuculline methobromide, 2,3-dioxo-6-nitro-1,2,3,4-tetrahydrobenzo[f]-quinoxaline-7-sulphonamide (NBQX), d-2-amino-5-phosphonopentanoic acid (d-AP5), 7-chlorokynurenate, α-amino-3-hydroxy-5-methyl-4-isoxazolepropionic acid (AMPA), domoate and CPCCOEt were obtained from Tocris Cookson (Bristol, UK) and l-glutamate, strychnine, picrotoxin, spermine and tetrodotoxin (TTX) from Sigma. GYKI 52466 (Sigma) was a generous gift from Tomoyuki Takahashi (Tokyo University). All experiments were carried out in the presence of 10–20 μm bicuculline, 0–25 μm picrotoxin, 0.5–1 μm strychnine, 0–25 μm 7-chlorokynurenate and 50–100 μm d-AP5. In addition, TTX was added during the recording of miniature EPSCs (MEPSCs, 0.3 μm) and whole-cell AMPA currents (0.5 μm). Cyclothiazide (30 μm) and CPCCOEt (100 μm) were present during recording of whole-cell AMPA currents to inhibit desensitisation of non-NMDARs and to avoid activation of mGluR1. The pipette (intracellular) solution contained (mm): CsF, 110; CsCl, 30 (or CsCl, 140 without CsF); NaCl, 2; Hepes, 10; EGTA, 10; Mg-ATP, 2; GTP 0 or 0.5 (adjusted to pH 7.3 with CsOH, ∼290 mosmol l−1). When spermine (50 μm) was included in the pipette solution, Mg-ATP was omitted. Occasionally sucrose was added to the pipette solution to adjust the osmolarity with that of external solution (∼330 mosmol l−1 with 5 mm CaCl2).
Recording procedures
Slices were transferred into a recording chamber fixed to the stage of an upright microscope (Axioskop, Zeiss, Germany, or BX50WI, Olympus, Japan) and viewed under Nomarski differential interference contrast optics (× 40 or × 60 water immersion objective lens; total magnification, × 320–1000). As shown in Fig. 1, Purkinje cells were identified from their location, morphology (Altman, 1972; Misra et al. 2000) and electrophysiological properties (Momiyama et al. 1996a). Patch pipettes were pulled from thick-walled borosilicate glass tubing (GC150F-7.5; Clark Electromedical), coated with Sylgard resin (Dow Corning 184) and fire-polished to a final resistance of 4–5 MΩ (for whole-cell recording) or 10–12 MΩ (for single-channel recording). Electrophysiological recordings were made using an Axopatch 200A or 200B patch-clamp amplifier (Axon Instruments) and stored on digital audio-tape (BioLogic DTR-1204; DC to 20 kHz) for later analysis. To take images of dye-filled Purkinje cells (Fig. 1B), calcein (500 μm, Molecular Probes) was added to the intracellular solution, and after maintaining the whole-cell configuration for 8–10 min, the slice was transferred into a chamber mounted on a confocal laser-scanning microscope (FV300, Olympus, Japan), and images were taken every 0.5 μm of Z-axis over 17–25 μm thickness. No correction was made for the liquid junction potential. Most of the recordings were made at room temperature, except recordings of MEPSCs at 33–34 °C (experiments in Fig. 10C).
Figure 1. Identification and morphology of immature Purkinje cells in thin slices.
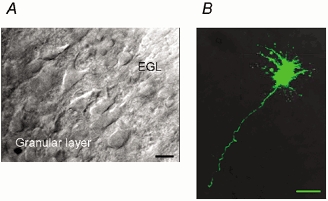
A, IR-DIC view of Purkinje cells in a cerebellar slice (300 μm thick) of a P4 rat. EGL, external germinal layer. B, confocal image of another P4 Purkinje cell loaded with the fluorescent dye calcein (500 μm) through a whole-cell patch pipette. Overlay of 35 images (taken for every 0.5 μm Z-axis). Calibration bars, 10 μm.
Figure 10. Density of AMPARs at CF-Purkinje cell synapse.

A, an example of complete serial ultrathin sections (70 nm thickness) of a P3 CF-Purkinje cell synapse. Arrows indicate edges of the PSD. B, immunogold labelling by anti-GluR2/3 antibody was localised within PSDs of CF-Purkinje cell synapses. C, histograms of the PSD area (top) and of the quantal size (bottom). Pooled data of 1112 MEPSCs recorded at 33–34 °C from four cells, and of 122 randomly sampled PSDs, are shown.
I–V relationship
Whole-cell AMPA currents were filtered at 1–2 kHz and digitised at 1 or 5 kHz. To obtain I–V relationships, the holding potential was first stepped from −60 mV to +50 mV and held at +50 mV for 100 ms, then ramped down to −100 mV over 400 ms and stepped back to −60 mV. The protocol was repeated 10 times and averaged responses in the absence of AMPA were subtracted from that in the presence of AMPA (10 μm). Evoked CF EPSCs were recorded by extracellular stimulation at 0.1–0.2 Hz. These were filtered at 2 kHz and digitised at 50 kHz. The peak amplitude (mean value in 0.4–0.5 ms window) of averaged EPSCs and their reversal potential were measured for estimation of the rectification index (RI).
| (1) |
where I+40 and I–40 are the currents at +40 and −40 mV, respectively, and Vrev is the reversal potential. When multiple inputs were stimulated simultaneously, data were adopted on the basis of the stability of EPSC amplitude that was measured in the same time window as for the average.
Peak-scaled non-stationary fluctuation analysis (PS-NSFA)
To obtain the conductance of synaptic channels, spontaneous or miniature EPSCs were filtered with an 8-pole Bessel filter to a final cut-off frequency of 2 kHz and digitised at 50 kHz. EPSCs were then analysed to yield their peak amplitude, 10–90 % rise time and weighted decay time, with a digital Gaussian filter (1 kHz) applied by the analysis program NPM (kindly provided by Stephen Traynelis, Emory University). The decay phase of individual EPSCs was fitted with a double-exponential function, Af exp(t/τf) + As exp(t/τs), to obtain the weighted decay time (Af τf + As τs), where Af and As are the relative proportions of the fast and slow components, and τf and τs are the fast and slow time constants. Measured parameters were numbered according to the event (EPSC) number, then tested by Spearman's rank order correlation test (Statistica, StatSoft, Inc., USA) for (i) the time stability of the peak amplitude, (ii) time stability of decay times, (iii) correlation between rise time and amplitude, (iv) correlation between amplitude and decay time, and (v) correlation between rise time and decay time. From the entire record of an individual cell, we obtained an epoch that contained a maximum number of consecutive EPSCs whose parameters (i-v) did not exhibit any significant correlations (P > 0.05). This was achieved by sliding the sample window (and changing its size), for the above parameters. EPSCs in this epoch were used again without the digital filter for PS-NSFA (Traynelis et al. 1993). The actual recording time of spontaneous or miniature EPSCs used to collect events varied from 8 to 40 min, and on average 62 % of the total recorded events passed all these criteria and were finally adopted for analysis. For all cells, EPSCs were binned into 30 segments, and the initial 10 or 15 points of the current-variance plot were fitted to the equation:
| (2) |
where i represents the single-channel current, NP is the average number of channels open at the peak of the EPSC, and σ2b is the background noise variance. The conductance value for each cell was calculated from fitted values for i and the measured EPSC reversal potential.
To evaluate statistical errors in the best-fit value for single-channel conductances in NSFA, bootstrap analysis (Efron & Tibshirani, 1993) was performed on both recorded EPSCs and on simulated events. Balanced re-sampling of the recorded EPSCs (or simulated EPSCs) was carried out by creating 100 lists of event numbers using the Mathematica (Wolfram Research Inc., USA)-based routine made by Roth & Häusser (2001). NSFA (PS- and Sigworth-type) and the bootstrap analysis were done using macros in Igor Pro (Wavemetrics Inc., USA). Characterisation of recorded EPSCs and the preliminary part of PS-NSFA were carried out by the software NPM (S. Traynelis, Emory University, Atlanta).
Simulations
Events were created by software ChanneLab (Synaptsoft Inc., USA), using the implemented Häusser-Roth AMPAR model. The original single-channel conductance of this model (8 pS) was changed to 5 pS in the present simulations. All simulated events contained data points at 50 kHz. The glutamate waveform could be manipulated either as a step pulse (0.3 ms) or an instantaneously rising, double-exponentially decaying waveform (Clements, 1996). Imposing a RC filter on currents was done using the set of actually recorded series resistance (Rs) and cell capacitance (Cm) values for the corresponding corner frequency (fc), obtained by the double-exponential fitting of whole-cell capacity transients (Rs = 7.7 MΩ, Cm = 45.6 pF for the worst fc = 0.46 kHz; Rs = 14.4 MΩ, Cm = 15.4 pF for the mean fc = 0.72 kHz; Rs = 7.8 MΩ, Cm = 16.2 pF for the best fc = 1.26 kHz). Out of 16 cells, the capacitative transient was fitted to a mono-exponential function in four cells (time constant, 200 μs). Of those 12 cells fitted with a double-exponential function, the contribution of the fast component (280 μs) was 86 % on average (>95 % in five cells). The mean value for the slow time constant was 1.6 ms. Based on these figures, we felt it reasonable to approximate the electrical cell circuit to a single-compartment model at this immature developmental stage, and the fast time constant was used to calculate the capacitance.
Rapid application of glutamate
The rapid application of 1 or 100 ms pulses of glutamate to outside-out patches was carried out as previously described (Häusser & Roth; 1997; Misra et al. 2000). Double-barrelled application tools were fabricated from theta-glass tubing (Hilgenberg, Germany, 2 mm o.d., 0.3 mm wall thickness, 0.1167). Solutions were perfused through control and agonist (glutamate, 1 or 5 mm) barrels of the application pipette, which was mounted on a piezoelectric device (PZ-150M, Burleigh, USA). The tip of the patch pipette was positioned close to the sharp interface between the solutions. A step-pulse function (1 or 100 ms) was applied to the device using Clampex software (Axon Instruments, USA). The speed of application was measured after each successful recording by perfusing the two barrels with 50 and 100 % external solution, and by measuring the time course of the liquid-junction current. Currents were filtered at 2 kHz (-3 dB) and digitised at 50 kHz (Digidata 2000 interface; Axon Instruments) for ‘Sigworth-type’ fluctuation analysis (see Sigworth, 1980).
‘Sigworth-type’ non-stationary fluctuation analysis (Sigworth-type NSFA)
To estimate the single-channel conductance and the maximum open probability (Po,max) of extrasynaptic non-NMDARs, currents were activated by rapid application of glutamate at a saturating concentration, and Sigworth-type non-stationary fluctuation analysis (NSFA) was performed on the decaying phase (deactivating or desensitising component) of these currents, as described previously (Sigworth, 1980; Häusser & Roth, 1997). Variance associated with the decaying phase of current responses was plotted against mean current magnitude, and the current- variance relationship was fitted to the equation that is based on binomial statistics:
| (3) |
where i represents the single-channel current, N is the total number of channels present in the patch, and σ2b is background noise variance. The conductance value (γ) for each patch was calculated from the fitted value for i and the measured reversal potential. Po,max was estimated by dividing the average peak current by iN. For the estimate of Po,max, we used data obtained from 100 ms glutamate pulses to ensure the full occupancy of receptors at the peak.
Single-channel analysis
Single non-NMDAR channel currents were filtered to a final cut-off frequency of 1 kHz and digitised at 20 kHz. All-point amplitude histograms were constructed using pCLAMP 6 software (Axon Instruments). The baseline noise was fitted to a Gaussian distribution and the fitted curve was subtracted from the histogram. From channel currents larger than −0.1 pA (corresponding to >1 pS), we constructed noise-subtracted cumulative histograms to identify the conductance ranges for 90 % of data intervals.
Measurement of postsynaptic density (PSD) area with electron microscopy
Three-day-old rats were anaesthetised by intraperitoneal injection of sodium pentobarbital (50 mg (kg body weight)−1), and then perfused transcardially with 0.01 m sodium phosphate-buffered 0.85 % saline (PBS; pH 7.4), followed by 0.1 m sodium phosphate buffer (PB; pH 7.4) containing 0.8 % paraformaldehyde, 1.5 % glutaraldehyde and a trace amount (5 mg l−1) of EGTA (Dojin, Japan). After the perfusion, the cerebellum was immediately removed and placed in 0.2 m PB containing 1.6 % paraformaldehyde (PFA), 3 % glutaraldehyde (GA) and a trace amount of EGTA at 4 °C for 12 h. Subsequently, parasagittal cerebellar sections (40 μm thick) were cut with a vibrating microslicer. Following fixation with 1 % osmium, and staining with 1 % uranyl acetate, sections were dehydrated sequentially with ethanol and propylene oxide, and then embedded in Durcupan (Fluka, Germany). Serial ultrathin sections (70 nm thick) were further stained with 1 % uranyl acetate, then with lead citrate (0.3 % in 0.1 m NaOH). After drying, sections were carbon coated and examined with a JEOL 1200EX electron microscope (Nihon-denshi, Japan). Synaptic inputs to Purkinje cells were identified and the complete sequence of PSDs was photographed. In order to identify unambiguously the structure of PSDs, only those found in more than three consecutive sections were included in the analysis. To calculate the PSD area, the polygonal length of PSD in each section was measured using analySIS software (SIS, Germany). The neighbouring PSD lengths were taken as sides of a trapezoid with a height of section thickness (70 nm), and areas of consecutive trapezoid were summed to give the total area of the PSD. We did not try to correct the measured PSD size for a shrinkage factor because of our frequent observations of inter-cellular space at this developmental stage, and of the unknown variability of shrinkage factors inside and outside PSDs.
Postembedding labelling procedure
After the anaesthesia, 3-day-old rats were transcardially perfused with PBS, followed by 4 % PFA, 0.05 % GA, 15 % saturated picric acid and a trace amount of EGTA in 0.1 m PB. Afterwards, the brain was left in the skull at 4 °C for 24 h, then parasagittal cerebellar slices (200 μm thick) were cut. The cerebellar slices were trimmed, freeze-substituted and embedded into Lowicryl HM20 (Polysciences Inc., USA). Ultrathin sections (80 nm) were picked up on nickel mesh grids, and etched with saturated NaOH in 100 % ethanol for 2 s and then washed with distilled water. After incubating in blocking solution (2 % human albumin serum in TBS with 0.1 % Triton X-100) for 30 min, sections were reacted with an anti-GluR2/3 antibody (at 5 μg ml−1, Chemicon International Inc., USA) overnight at room temperature. After washing with TBS for 30 min, the sections were incubated in the secondary antibody (diluted 1:100, anti-rabbit IgG tagged with 5 nm colloidal gold) in blocking solution containing polyethyleneglycol (5 mg ml−1) for 3 h. The sections were counter-stained by sequential treatment with saturated aqueous uranyl acetate followed by lead citrate. After washing and drying, sections were examined with a JEOL 1200EX electron microscope.
Unless otherwise stated, average data are expressed as means ± s.e.m. (n = number of cells or patches), and statistical significance between groups was tested using Student's two-tailed t test, with a confidence level of 0.05. Correlations were examined using Spearman's rank-order test, and normality of distributions was examined using the Kolmogorov-Smirnov test (K–S test).
Results
Properties of AMPARs in immature Purkinje cells
Our primary aim was to estimate the number of AMPA receptors (AMPARs) bound by the quantal transmitter packet, and their density in the postsynaptic membrane. We therefore chose experimental conditions that would provide sufficiently high resolution of miniature and spontaneous EPSCs to allow us to apply peak-scaled non-stationary fluctuation analysis (PS-NSFA, Traynelis et al. 1993; Silver et al. 1996). Furthermore, it was essential to examine cells in which a single type of excitatory input was present. Immature Purkinje cells fulfil these requirements for the following reasons. During the first postnatal week, excitatory synaptic inputs onto Purkinje cells arise solely from climbing fibres (Altman, 1972; Crépel et al. 1981). Synaptic transmission at these sites is mediated entirely by non-NMDA receptors (Konnerth et al. 1990; Farrant & Cull-Candy, 1991) although young Purkinje cells do also possess a population of extrasynaptic NMDA receptors (Momiyama et al. 1996a). In 2- to 4-day-old rats, most of the climbing fibre (CF) contacts occur on the soma, or on the primary dendrite within 10 μm of the Purkinje cell apex (Robain et al. 1981; Chedotal & Sotelo, 1993), allowing high-resolution whole-cell recording of synaptic currents in the visually identified cells in thin cerebellar slices. When Purkinje cells in slices (Fig. 1A) were filled with fluorescent dye via the patch pipette, the highly restricted arborisation of dendrites was confirmed in these immature cells (Fig. 1B).
As channel open probability cannot be obtained directly from PS-NSFA of synaptic currents, we have examined the extrasynaptic channels to provide an estimate of this parameter. It was therefore necessary, in the initial experiments, to determine whether synaptic and extrasynaptic receptors exhibited similar functional properties.
As shown in Fig. 2A and B, we compared the pharmacological properties of synaptic AMPA receptors with whole-cell AMPA responses. In P2–4 Purkinje cells, CF EPSCs were evoked in the presence of blockers for GABAA, glycine and NMDA receptors. In these conditions, CF EPSCs could be blocked by the selective non-NMDAR antagonist, NBQX (5 μm; n = 4 cells). The AMPAR-selective blocker GYKI 52466 also exhibited blocking effects on CF EPSCs (94 ± 3 % block at 50 μm, n = 4; 99 ± 1 % block at 100 μm, n = 3), suggesting that virtually all non-NMDARs at CF synapses are AMPARs at this stage.
Figure 2. Pharmacological identification and similarity in Ca2+ permeability of synaptic and extrasynaptic AMPARs in immature Purkinje cells.

A, CF-evoked EPSCs recorded from a P3 Purkinje cell. Averaged traces at stimulation frequency of 0.1 Hz, before and 1 min after NBQX (5 μm) application are superimposed. B, whole-cell current response to bath-applied glutamate (1 mm) in another P3 Purkinje cell. NBQX blocked 88 % of the glutamate-induced steady-state current. C, averaged CF EPSCs in the same cell as in A at Vh=+40 and −40 mV. Stimulus artifact was subtracted using records obtained at Vrev= 0 mV. Stimulation frequency, 0.1 Hz. Intracellular solution contained 50 μm spermine. D, current-voltage relationship of AMPA (10 μm)-induced steady-state current obtained by applying voltage-ramp pulses. P4 Purkinje cell. Bathing solution contained TTX (1 μm), bicuculline (10 μm), strychnine (1 μm), AP-5 (100 μm), cyclothiazide (30 μm) and CPCCOEt (100 μm). Averaged currents of 10 trials in the absence of AMPA were subtracted from that in the presence of AMPA. Vrev, +2.6 mV. Calibration for the inset, 1 nA and 0.1 s.
Since the peak concentration of glutamate at synapses is estimated to be in the millimolar range (Clements, 1996; Diamond & Jahr, 1997), we used a high concentration (1 or 5 mm glutamate) to activate receptors both in whole-cell recordings and in our later experiments where brief pulses of glutamate were applied to isolated patches (see below). We therefore examined the effect of NBQX on whole-cell currents evoked by bath-application of 1 mm glutamate (Fig. 2B). These currents, which presumably reflect the activation of both extrasynaptic and synaptic populations of receptors, rose slowly and desensitised to a plateau level (Fig. 2B, Vh = −70 mV). The currents could be largely suppressed by 50 μm NBQX (90 ± 3 %; n = 5), confirming they were mediated by non-NMDARs. We will refer to these as AMPARs, as our experiments in outside-out patches suggested that functional kainate receptors did not contribute to the extrasynaptic response (see later section). The small residual whole-cell current, remaining in the presence of 50 μm NBQX (apparent in Fig. 2B), disappeared on removal of glutamate (Fig. 2B) indicating that it was glutamate mediated. It may therefore reflect a small fraction of incompletely blocked non-NMDARs under these conditions, or the activation of mGluR1 receptors in these cells (Shigemoto et al. 1992). We did not examine the residual current further in the present study. However, to avoid possible activation of mGluRs, we used AMPA as the agonist to examine the rectification index (see below and Fig. 2D).
It has previously been shown that non-NMDARs that lack edited subunits display a high Ca2+ permeability and pronounced inward rectification (see review by Dingledine et al. 1999). Studies from our laboratory and others (reviewed by Bowie et al. 1999) have found that spermine is the intracellular factor that confers inward rectification on non-NMDARs that lacked edited subunits. Further, it has recently been shown that, in cerebellar stellate cells, synaptic and extrasynaptic AMPA receptors can differ in their rectification properties, and hence in their subunit composition (Liu & Cull-Candy, 2000). We therefore compared the I–V relationship of CF EPSCs with that generated by the whole-cell AMPA current (arising from a mixture of synaptic and extrasynaptic receptors); 50 μm spermine was included in the patch pipette solution. To allow an estimation of the rectification index (RI, see Methods) CF EPSCs were evoked at +40 and −40 mV, and average peak amplitude and reversal potential (0.6 ± 0.3 mV, n = 6) was measured. We obtained an RI value of 0.93 ± 0.04 (n = 6, Fig. 2C) for AMPAR-mediated synaptic currents. This was not significantly different from the value of 0.90 ± 0.20 (P = 0.52; n = 6) obtained for whole-cell responses to 10 μm AMPA (Fig. 2D). These results suggest that at this stage both synaptic and extrasynaptic AMPAR channels include the GluR2 subunit, as described for these cells in older animals (Tempia et al. 1996; Zhao et al. 1998).
Climbing fibre miniature EPSCs
We next compared the channel conductance of synaptic and extrasynaptic AMPARs. To estimate the synaptic channel conductance, we applied peak-scaled non-stationary fluctuation analysis (PS-NSFA: Traynelis et al. 1993; Silver et al. 1996), to miniature and spontaneous EPSCs arising from CF terminals. Figure 3A illustrates typical examples of MEPSCs recorded from a P3 Purkinje cell. In many of the cells examined in 2 mm extracellular Ca2+, the frequency of MEPSCs was too low to allow an accurate quantitative analysis. We therefore increased extracellular Ca2+ to 5 mm, which gave an average MEPSC frequency of 1.5 ± 0.6 Hz (range 0.4–3.3 Hz, n = 5). The 10–90 % rise time of miniature or spontaneous EPSCs was fast (0.38 ± 0.02 ms; n = 7) and the mean amplitude of MEPSCs was −21.2 ± 2.1 pA (n = 5) at −70 mV, giving a quantal size of 294 ± 28 pS (calculated from the measured reversal potential). Furthermore, the coefficient of variation (CV) of quantal size was 0.32 ± 0.05 (n = 5, room temperature, Fig. 3B). This latter value was not significantly different (P = 0.39) from that obtained for CF-derived quantal events recorded in Sr2+ from P12–14 Purkinje cells (see Silver et al. 1998).
Figure 3. Climbing fibre MEPSCs in an immature Purkinje cell.
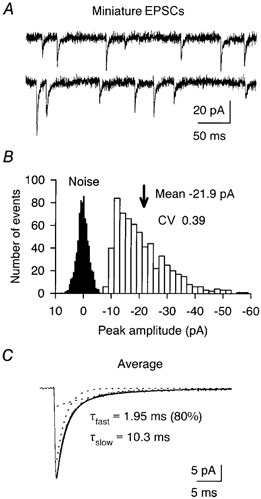
A, examples of MEPSCs recorded from a P3 Purkinje cell in the presence of 5 mm Ca2+ and 0.3 μm TTX. Vh, −70 mV. B, amplitude histogram of 636 MEPSCs recorded from the cell in A. Noise histogram is scaled for clarity. CV of MEPSC amplitude was calculated after subtracting the noise variance. C, averaged waveform of MEPSCs fitted with a double-exponential function (superimposed continuous line). Dotted lines indicate fast and slow components.
These CF MEPSCs are likely to be originating from multiple sites, and their amplitude distribution was skewed in common with that at other central synapses (Fig. 3B; Silver et al. 1992; Jonas et al. 1993; see Silver et al. 1996; Auger & Marty, 1997; Forti et al. 1997 for events from single sites). The decay times of MEPSCs and spontaneous EPSCs were well fitted by a double-exponential function with time constants of: τf = 1.59 ± 0.15 ms and τs = 7.29 ± 1.35 ms (proportion of τf = 73.7 ± 6.4 %; n = 7). The decay time of the fast component, which accounted for a majority of the current, approached the deactivation time obtained with brief 5 mm glutamate pulses applied to isolated patches (see below).
Estimating synaptic channel conductance from peak-scaled non-stationary fluctuation analysis of CF EPSCs
Several precautions were taken to guard against potential errors in estimating channel conductance using PS-NFSA of synaptic currents. First, we ensured time stability by testing for time-dependent changes in the amplitude and the weighted decay time (Fig. 4A; Spearman's R range: amplitude, −0.22 to 0.06; decay, −0.15 to 0.20; amplitude, P = 0.35 ± 0.10; decay, P = 0.36 ± 0.11, n = 7). Second, we tested whether there were correlations between amplitude and rise time (Fig. 4A, Spearman's R range −0.21 to 0.10, P = 0.29 ± 0.10, n = 7) and between amplitude and weighted decay time (Fig. 4B, Spearman's R range −0.21 to 0.15, P = 0.38 ± 0.11, n = 7), to test the assumption that all currents from a particular cell have a mean current waveform that differed only in scaling (see Traynelis et al. 1993; Silver et al. 1996). This is illustrated in Fig. 4C, which shows that when averages generated from the smallest, middle and largest amplitude MEPSCs were scaled, their waveforms were similar. The lack of correlation between rise and decay times was also confirmed (figure not shown, Spearman's R range: −0.08 to 0.15, P = 0.33 ± 0.10, n = 7).
Figure 4. Stability analysis of CF EPSCs.
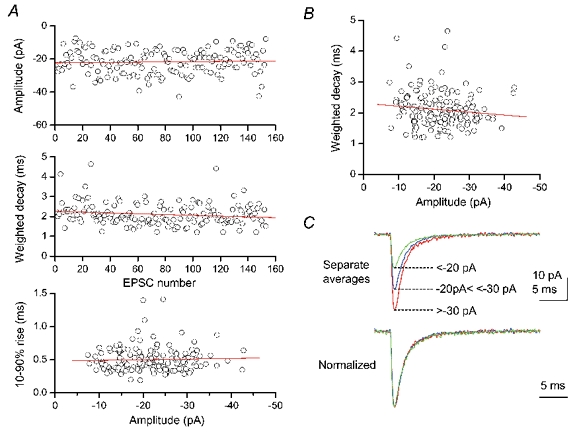
Analysis of spontaneous EPSCs recorded from a P3 Purkinje cell. Vh, −70 mV. External Ca2+, 5 mm. A, stability plots of amplitude (top) and weighted decay time (middle), and plot of 10–90 % rise time against the amplitude (bottom) of 153 consecutive EPSCs. Straight lines indicate linear regression. The lack of correlation between plotted parameters was confirmed by Spearman's rank test. B, the amplitudes and decay times of EPSCs were not correlated. C, EPSCs were averaged separately according to peak amplitude grouped into three ranges (top). The three separate averages were normalized and superimposed, to illustrate the lack of correlation between decay time course and amplitude (bottom).
Like conventional non-stationary fluctuation analysis (Sigworth, 1980), PS-NSFA assumes that gating is stochastic and that channels are independent – a condition necessary for binomial statistics to apply. In the case of synaptic currents arising at different release sites, the peak amplitude of EPSCs is expected to vary from event to event, since the number of receptor channels bound by the transmitter packet is likely to vary. The procedure of PS-NSFA therefore involved scaling the mean current waveform to the peak of each individual EPSC (Fig. 5A); the scaled average waveform was then subtracted from the individual EPSC (Fig. 5B), and finally the difference was squared. In this way the fluctuations of amplitude during the EPSC decay are expressed as the binomial variance, arising from random channel gating (closings and re-openings) of channels, all of which were once open at the peak.
Figure 5. Peak-scaled non-stationary fluctuation analysis of CF EPSCs.
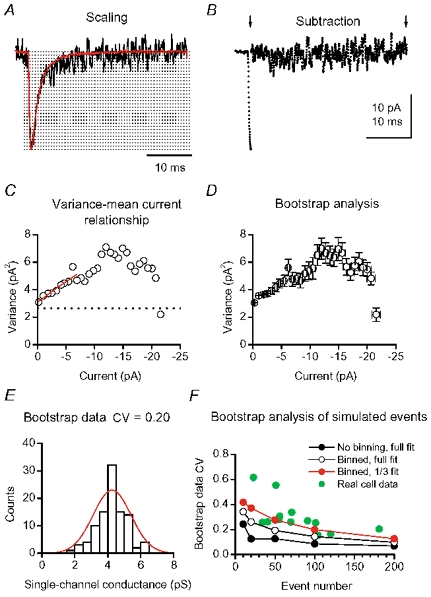
Procedures of PS-NSFA, applied to 153 spontaneous EPSCs analysed in Fig. 3. A, averaged waveform (red trace) scaled at the peak of an individual EPSC (black trace). Dotted lines indicate binning to 30 fractions. B, subtraction of the peak-scaled average from the individual EPSC shown in A. Arrows indicate the range in which the subtraction was applied. For clarity, data are represented as points. The sum-squared difference was calculated for each bin. The procedure was repeated for each EPSC and cumulated averages are plotted in C. C, the straight red line indicates the fit of the initial one-third of the plot to the theoretical equation (see Methods). The dotted line indicates the baseline variance (2.6 pA2). The weighted mean synaptic channel conductance was 4.6 pS. D, PS-NSFA on randomly re-sampled events was repeated 100 times. Means and s.d.s of the 100 current-variance plots are shown. The individual plot was fitted as in C. E, estimates of the channel conductance obtained by fitting bootstrapped data displayed a normal distribution (red curve). F, relationship of the bootstrap data CV versus the number of events, on simulated current (line-connected symbols) and the real EPSCs (green, pooled data in 5 and 2 mm Ca2+). The bootstrap data CV were also affected by the binning and fitting conditions.
The relationship between variance and mean current (Fig. 5C) was fitted to the theoretical equation (Methods). When channels open to multiple conductance levels, NSFA gives an estimate of the mean channel conductance weighted towards larger conductance levels (Sigworth, 1980; Cull-Candy et al. 1988), provided that the probability of a channel being in any of the conductance states is small. To meet this condition we obtained our estimates from the initial slope of variance-mean plots, where the channel open probability is low. This gave a weighted mean synaptic channel conductance of 5.4 ± 0.4 pS (n = 7).
Some of the variability in our estimate of the single-channel conductance will arise from a sampling bias, since the number of events available for the PS-NSFA was limited (23–153). To quantify this, we next performed bootstrap analysis (Efron & Tibshirani, 1993; Methods). Balanced re-sampling of events was carried out on the originally analysed event set, and the PS-NSFA was repeated for 100 such event sets (Fig. 5D). When the individual fitted value of the initial slope was collected, the distribution was normal, as expected from the central limit theorem (Fig. 5E). On average, 84 ± 2 % (n = 7) of this distribution represented values within ± 2 pS of the single-channel conductance estimated from the original dataset. The CV of the bootstrap sample data was 0.27 ± 0.06 (n = 7). The validity of the bootstrap analysis was further confirmed by applying it to simulated events, using the kinetic scheme of Purkinje cell AMPARs (Häusser & Roth, 1997). Simulated noise-free EPSCs were generated (Methods), and 100 bootstrap re-samplings were carried out, for varying numbers of events (10, 20, 50, 100 and 200). The relationship between the event number and the variability of bootstrapped data (expressed as bootstrap CV) was thus examined, and the bootstrap CV declined as the event number increased (Fig. 5F). During construction of the current-variance plot from real EPSCs, it was necessary to bin the data (as in Fig. 5C and D), to avoid the fit becoming unevenly weighted by the larger number of data points that resulted from the baseline noise. In noise-free simulated EPSCs, we observed that binning itself increased the bootstrap CV of the fit (Fig. 5F). Similarly, fitted ranges affected the bootstrap CV (Fig. 5F). When simulated data were binned and the fitted range set to be the initial one-third of the current-variance plot, the bootstrap CV of simulated events and of real EPSCs exhibited similar distributions when plotted as a function of the number of events (Fig. 5F). To confirm this similarity, we also repeated bootstrap analysis on 13 sets of simulated EPSCs, using the same number of events as real EPSCs in 13 cells, and the bootstrap CVs were not significantly different (P = 0.61, paired t test). This indicates that, once the current-variance plot is binned, the presence or absence of background noise does not markedly affect the bootstrap CV, nor the error contaminating the fit. This was further supported by our observation that the size of baseline noise and the bootstrap CV were not correlated in our real cell data (P = 0.39, Spearman's test).
In order to determine whether the presence of 5 mm Ca2+ affected our estimate of synaptic channel conductance, we also applied the PS-NSFA to spontaneous EPSCs recorded from cells bathed in 2 mm Ca2+. To enhance the frequency of spontaneous synaptic events in these cells, the climbing fibres were stimulated at a low rate (0.1–1 Hz) during the recording period. Under these conditions we obtained a weighted mean single-channel conductance of 5.8 ± 0.4 pS (n = 6), which was not significantly different (P = 0.52) from the value obtained in 5 mm Ca2+. The background noise levels were not different (P = 0.59) between the two recording conditions (5 mm Ca2+, 3.6 ± 0.6 pA2, n = 7; 2 mm Ca2+, 3.1 ± 0.6 pA2, n = 6). The bootstrap CV in 2 mm Ca2+ was 0.33 ± 0.06 (n = 6), not statistically different from that in 5 mm Ca2+ (P = 0.45).
The PS-NSFA method yields a peak-scaled mean current vs. variance relationship that is parabolic only when no channels open for the first time after the peak of the current (Traynelis et al. 1993). If new channels open after the peak, the relationship is skewed by the presence of additional variance (see Fig. 7 of Traynelis et al. 1993; Traynelis & Jaramillo, 1998). Opening of channels for the first time after the peak is expected either if the transmitter transient within the cleft is slow, or if the latency to first channel opening is long. It was apparent that for AMPAR-EPSCs in Purkinje cells, the peak scaled current-variance plots consistently exhibited some skew in all cells examined. Because the skew was still observed in data derived from MEPSCs, it is unlikely that this is due to asynchronous release of multiple transmitter packets. We next estimated the possible errors associated with fitting the skewed current-variance plots to the parabolic equation of binomial variance, by carrying out simulations.
Figure 6 illustrates examples of current-variance plots of simulated EPSCs analysed by PS-NSFA. Even for a homogeneous set of simulated EPSCs, where a fixed number of receptors were exposed to a fixed concentration of glutamate, the current-variance plots exhibited skew with this kinetic scheme (Fig. 6B). The skew was also present when PS-NSFA was applied to the heterogeneous group of events (Fig. 6C). Therefore, if native AMPARs in P2–4 Purkinje cells possess the intrinsic kinetic properties predicted by this model, skew in the current-variance plot is to be expected. Nevertheless, in common with previous studies using simulations (Traynelis et al. 1993), we found that fitting such skewed plots to eqn (2) gave estimated single-channel conductances that exhibited only minor (± 2 %) differences from the expected value, regardless of the peak Po. Furthermore, the conductance value obtained from the slope of the current-variance relationship appeared only marginally affected when estimates were derived by fitting different portions of the plot (33, 50 or 75 %). Thus a comparison of the conductance estimates obtained by fitting either the initial 33 % or 50 % of the current- variance relationship of recorded EPSCs indicated that the values obtained were not significantly different (P = 0.59). Our analysis of simulated currents therefore suggested that the current-variance plots obtained during the tail of the EPSC provided a reasonably accurate estimate of the unitary current.
Figure 6. Skew in the current-variance plot by PS-NSFA is expected from the activation kinetics of the Purkinje cell AMPAR model.
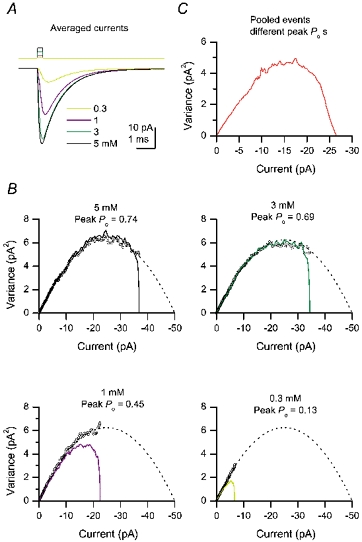
Using the kinetic scheme of AMPARs in Purkinje cells (Häusser & Roth, 1997), EPSCs were simulated using four different concentrations of glutamate (0.3 ms, step pulse), as indicated. The single-channel conductance was set at 5 pS, the number of channels was set at 100, and the driving force was −100 mV. A, averages of simulated currents. Upper trace indicates the glutamate pulses. B, current-variance relationships by PS-NSFA (continuous lines) were obtained for an individual set of simulated EPSCs (1000 events each) at indicated peak Po values. Open circles represent current-variance plots obtained by Sigworth-type NSFA, imposed on the Sigworth-type theoretical relationships (dotted curves). C, current-variance relationships of 4000 pooled events by PS-NSFA.
Estimating possible errors introduced by filtering
Because AMPAR channels display fast kinetics, filtering imposed by whole-cell recording may distort the time course of the EPSC and therefore affect the estimated underlying channel conductance. To minimise this, we used Purkinje cells at a stage when their electrotonic structure is compact. For several reasons the level of filtering imposed by the Purkinje cell-patch pipette circuit would not have been expected to greatly distort our estimate of synaptic channel conductance, or of the number of channels activated by a quantal packet of transmitter at this stage of development. First, there was no significant correlation between the rise and decay time of EPSCs, suggesting that event-to-event variability by dendritic filtering was minimal. Second, there was no statistically significant correlation between the cut-off frequency of RC filtering (fc) in individual cells and the respective estimate of the single-channel conductance (Spearman's R = 0.29, P = 0.54). Third, during examination of the EM structure of immature Purkinje cells, most of the CF synapses were found to be located in the proximity of the soma (J. Tanaka & R. Shigemoto, unpublished observations), in accordance with previous reports (Robain et al. 1981; Chedotal & Sotelo, 1993).
To quantify further the effect of filtering on the single-channel conductance estimated from PS-NSFA, we undertook simulations using the Purkinje cell AMPAR kinetic scheme (Häusser & Roth, 1997). As exemplified in Fig. 7A, filtering attenuation of the current amplitude is dependent on the distribution of open and shut times of channels during the EPSCs. Because these distributions would be influenced by the transmitter waveform, we used a biexponentially decaying pulse for the glutamate waveform at synapses (Clements, 1996) in our EPSC simulations. Representative RC filtering values were taken from our experimental data, and the digital Gaussian filter was further cascaded as a substitute for the Bessel filter used during digitisation of EPSCs. From the fit to the initial one-third of the current-variance plot, attenuation of the single-channel conductance caused by filtering ranged from 22 to 32 % (Fig. 7C). The filtering also attenuated the peak amplitude of EPSCs by 10.9 % (in the best case), 12.2 % (mean) and 17.5 % (in the worst case). Therefore, the level of filtering we encountered during recordings could have been expected to introduce an overestimation of the number of channels activated at the peak of quantal events, by 14.2 % (best case), 15.5 % (mean) or 21.3 % (worst case). Taking this into account, and using the estimate of synaptic channel conductance (5.4 pS, measured in 5 mm Ca2+) together with the measured quantal size (294 pS, measured in 5 mm Ca2+), we calculated that on average ∼ 47 AMPARs were opened by a single quantum of transmitter at these CF terminals.
Figure 7. Effects of filtering on the quantal size and single-channel conductance estimated from PS-NSFA.
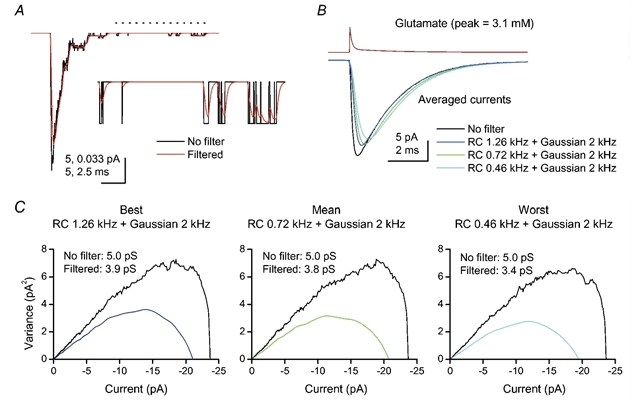
A, example of a simulated EPSC, in the absence (black) and presence (red) of an RC filter (0.72 kHz) cascaded with a Gaussian filter (2 kHz). The single-channel conductance was 5 pS, the number of channels was 100, and the driving force was −100 mV. The glutamate pulse was set to rise instantaneously to the peak concentration (3.1 mm) and decay as a double-exponential waveform (Clements, 1996), as shown in B. Inset, expansion of the indicated part (dotted line) of currents. B, averaged currents of simulated EPSCs (1000 events averaged in each condition). C, current-variance plots of simulated EPSCs obtained by PS-NSFA. Each plot is derived from 1000 events simulated as in A and B. The initial one-third of the plot was fitted to the theoretical equation (Methods).
In order to examine the dependency of filtering on channel open/shut time distributions, we also carried out simulations using other glutamate waveforms (0.3 or 10 ms step pulses, or monoexponential functions with time constants of 0.36 or 2 ms) for the mean level of RC filtering. Despite the wide range in the decay time of such simulated EPSCs (-43 % to +80 % change in time constant, when compared with the biexponential glutamate pulse), the degree of overestimation of the number of activated channels was similar (by 0.4 % to 14.7 %). However, in the absence of detailed data for single-channel currents at the synapse, we cannot rule out that differences in open/shut time distributions may exist between real EPSCs and our simulated examples.
Single-channel conductance and maximum open probability, estimated from non-stationary fluctuation analysis of extrasynaptic receptors
In order to estimate the number of receptors bound by transmitter, rather than the number opened, it was necessary to determine the open probability of the agonist-bound channels (the maximum open probability, Po,max). Examining this property directly for synaptic receptors was not practical, so we next investigated the properties of extrasynaptic receptors under conditions that mimic the activation of synaptic channels in Purkinje cells (Häusser & Roth, 1997; Misra et al. 2000). Brief (1 ms) pulses of 1 or 5 mm glutamate were applied to outside-out membrane patches from the cell soma. The averaged macroscopic current deactivated rapidly with a decay time course that was well described by a double-exponential function. Its mean weighted time constant (1.33 ± 0.42 ms, n = 4, glutamate 5 mm) was comparable to the fast component of MEPSCs and spontaneous EPSCs described above (P = 0.58). The time course of desensitisation (decay in the presence of 5 mm glutamate, 100 ms pulse) could also be fitted to a double-exponential function, but had a markedly slower time course (mean weighted time constant 4.58 ± 1.47 ms, n = 3).
By applying ‘Sigworth-type’ NSFA to the rapidly deactivating currents (see Methods), we obtained an estimate of the weighted mean conductance for extrasynaptic receptors. The mean value of 10.8 ± 3.0 pS (n = 6; pooled from 1 and 5 mm glutamate short-pulse data; Fig. 8A–C) was not statistically different from those obtained for synaptic receptors examined in the presence of 2 mm Ca2+ (t test, P = 0.09). From datasets of weighted single-channel conductances, we calculated the minimum detectable difference, with a statistical power of 0.9 and a confidence limit of 0.05 (one-sample t test). This was 1.5 pS for synaptic channels, while that of extrasynaptic channels was 11 pS, possibly influenced by the presence of one ‘outlier’ patch of 22 pS. However, the bootstrap CV of PS-NSFA data was not significantly different (P = 0.51) from that of Sigworth-type NSFA on short-pulse jump data (0.28 ± 0.06, n = 6). Furthermore, we found no significant difference in estimates of the single-channel conductance between short and long pulse jump data (P = 0.58). Since the attenuation of single-channel conductance by filtering differed between the whole-cell (where attenuation was 24 % with cascaded mean RC and Gaussian filters) and excised patches (12 % with Gaussian filter only), these estimates may become closer once the attenuation due to filtering is removed. Yet, in contrast with the other properties of the synaptic and extrasynaptic AMPARs, the high variability of extrasynaptic channel conductances made it difficult to draw a statistically strong conclusion about the similarity in this feature of synaptic and extrasynaptic AMPARs.
Figure 8. Non-stationary fluctuation analysis of AMPAR-mediated currents in outside-out patches activated by rapid application of glutamate.
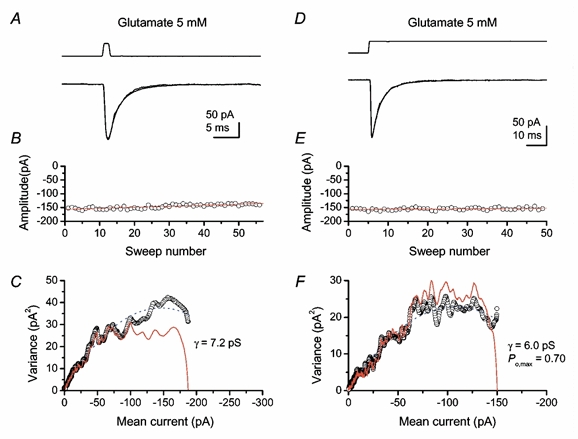
Data derived from the same patch excised from P4 Purkinje cell. A and D, current-response activated by short (1 ms) or long (100 ms) pulses of glutamate (5 mm). Averaged response and an individual response are superimposed. Top traces indicate the timing of solution exchange measured as changes in liquid junction currents. B and E, stability of peak amplitude of glutamate-activated currents was confirmed by Spearman's rank test. Red lines, linear regression. C and F, open circles are current-variance plots by Sigworth-type NSFA applied to the glutamate-activated currents of extrasynaptic non-NMDARs. The blue dotted lines indicate the fit to the theoretical Sigworth equation (Methods). The red lines in C and F show the current-variance relationship by PS-NSFA. Channel open probability at the peak of the current was 0.57 for the short pulse.
As is apparent in Fig. 8 (C and F), the current-variance plot obtained by PS-NSFA of AMPAR currents produced by fast application of glutamate also exhibited skew, suggesting that some glutamate-bound receptors open for the first time after the peak. The single-channel conductance values estimated from fitting current-variance plots obtained by Sigworth-type-NSFA and PS-NSFA were not significantly different (P = 0.22).
Provided that the applied glutamate saturates receptors in excised patches, the ‘Sigworth-type’ analysis will yield an estimate of Po,max for these channels. To ensure complete receptor occupancy, we used long pulses (100 ms) of a high concentration of glutamate (5 mm) and estimated Po,max to be 0.72 ± 0.04 (n = 3, Fig. 8D–F). This Po,max value was similar to estimates obtained for AMPARs in more mature (P12–14) Purkinje cells (Häusser & Roth, 1997). Since our data suggest that the synaptic and extrasynaptic AMPARs in these cells show similarities in functional properties, including their I–V relationships and deactivation kinetics, it seemed reasonable to assume that synaptic sites may exhibit a Po,max value similar to that measured for extrasynaptic receptors (0.72). By dividing the number of open channels (47) by Po,max, the average number of transmitter-bound receptors was estimated to be 66. In cases where postsynaptic AMPARs are saturated by transmitter (receptor occupancy = 1), this number of transmitter-bound receptors is equivalent to the number of receptors present in the postsynaptic membrane. If receptors are not saturated by a quantum of transmitter (Silver et al. 1996), this will represent a lower limit for the number of AMPARs present.
Multiple conductance extrasynaptic AMPAR channels
Many native and recombinant AMPA receptors have been shown to open to multiple conductance levels (Cull-Candy & Usowicz, 1987; Jahr & Stevens, 1987; Cull-Candy et al. 1988; Wyllie et al. 1993; Swanson et al. 1997; Derkach et al. 1999; Smith & Howe, 2000; Banke et al. 2000). If AMPAR channels in Purkinje cells display multiple conductances, the single-channel estimate obtained from non-stationary fluctuation analysis will represent a mean of the individual levels present, weighted towards the larger conductance levels (Appendix: Cull-Candy et al. 1988). We therefore next examined whether the extrasynaptic receptors exhibited multiple conductances, by recording single-channel currents in isolated patches.
As the conductance level AMPARs enter may be influenced by the concentration of glutamate present (Rosenmund et al. 1998; Smith & Howe, 2000), we tested two different agonist concentrations: a high concentration (1 mm) of glutamate, to approximate that encountered in the synaptic cleft during transmission, or a low concentration (1 μm, with 30 μm cyclothiazide). As illustrated in Fig. 9, bath-application of glutamate to outside-out patches excised from the Purkinje cell soma gave directly resolved channel openings with clear multiple levels in these conditions.
Figure 9. Multiple single-channel conductances of somatic AMPARs in Purkinje cell patches.
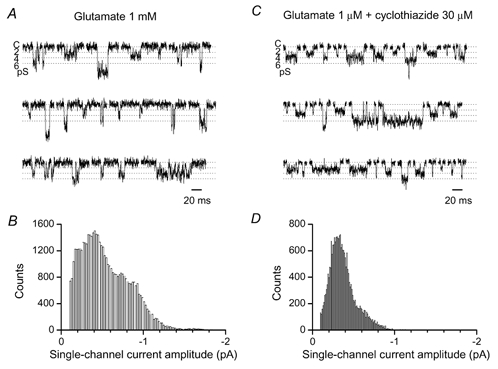
A and C, examples of single-channel openings in the continued presence of agonist, recorded from outside-out patches of P3 Purkinje cells. Vh, −100 mV. External Ca2+, 5 mm. Baseline (closed) level is indicated as C. B and D, all-point amplitude histograms of single AMPA channel currents. The baseline noise has been subtracted from histograms after fitting Gaussian distributions to the noise components.
In addition to mRNA for the AMPAR subunits, Purkinje cells at P0 express message for the kainate receptor subunit GluR5, the level of which increases postnatally (Bahn et al. 1994). We obtained no detectable response to the kainate receptor agonist domoate (2 nm) at this age, although patches responded to 5–10 μm AMPA (n = 2, P4, data not shown) and exhibited multiple conductance levels (Momiyama et al. 1996b). It therefore seems likely that the density of functional kainate receptors is low in P4 Purkinje, and the multiple conductance levels activated by glutamate can be ascribed solely to AMPARs.
Estimated receptor density at CF-Purkinje cell synapses
To estimate the minimum packing density of synaptic AMPARs, we next measured the size of the postsynaptic density (PSD) in Purkinje cells from P3 rats. From electron-microscopic examination of ultrathin serial sections of the cerebellum, we collected complete sequences of the PSDs at synaptic inputs onto Purkinje cells (see Fig. 10A). Asymmetrical synapses on these Purkinje cells are generally considered to originate from climbing fibres at this stage (see Altman, 1972).
The size of the PSD exhibited a skewed distribution (skewness = 0.98), with a mean area of 0.074 μm2 (Fig. 10C). The CV of PSD size was 0.63, being 1.3- to 1.6-fold larger than that of the quantal size (0.40 at room temperature, 2135 events pooled from five cells; 0.47 at 33–34 °C, 1112 events pooled from four cells, Fig. 10C). The distribution of quantal size at 33–34 °C was also skewed (skewness = 1.28; skewness = 1.0 at room temperature). At this temperature, even the smallest detected quantal event magnitude was 2.2-fold of the background noise bandwidth (n = 4).
Furthermore, immunogold labelling by an anti-GluR2/3 antibody was observed to be concentrated within PSDs, in contrast with the low level of labelling outside PSDs (Fig. 10B), as reported at the mossy fibre-granule cell synapse (DiGregorio et al. 2002). Thus AMPARs eliciting quantal responses are likely to be localised only at PSDs. Based on this, we calculate the lower limit for the average receptor packing density, from our estimates of the PSD size and the number of channels occupied by the transmitter packet, to be ∼900 receptors μm−2 (after correction for filtering).
Discussion
In this study we have examined three factors that are critical in determining properties of the EPSC at CF- Purkinje synapses: the number of receptors activated by a quantum of transmitter, the single-channel conductance and the density of the underlying AMPA receptor channels. We have taken advantage of the fact that P2–4 Purkinje cells are electrically compact, and possess a single type of excitatory input, to obtain a quantitative estimate of these parameters by combining electrophysiological and ultrastructural analyses. Our results indicate that in these cells both synaptic and extrasynaptic AMPARs exhibit a relatively low single-channel conductance. Our measurements of the quantal size, weighted mean synaptic channel conductance and Po,max of extrasynaptic receptors, indicate that the transmitter packet is likely to bind at least 66 postsynaptic receptors. Combined with our ultrastructural data, this would suggest a mean packing density of at least 900 AMPARs μm−2 at these synapses. Our experiments also allow a direct comparison of quantal variability with PSD size, and suggest that structural variability may be contributing to quantal variability at this excitatory synapse.
Molecular identity of AMPARs in Purkinje cells
In situ hybridisation and RT-PCR studies in early postnatal Purkinje cells have suggested a weak expression of GluR1, and the absence of GluR4 (Monyer et al. 1991; Lambolez et al. 1992; Tempia et al. 1996). On the other hand, strong immunoreactivity has been reported for GluR2/3 and GluR2 antibodies in the Purkinje cell soma and dendrites, and at CF synapses in 2- to 5-day-old animals (Zhao et al. 1998; Ripellino et al. 1998), consistent with the corresponding mRNA expression (Monyer et al. 1991; Lambolez et al. 1992; Tempia et al. 1996). The fact that AMPARs at this stage display linear I–V relations is consistent with the idea that both synaptic and extrasynaptic AMPARs contain edited subunits. Further clues regarding the constituent subunits can be obtained by comparing their single-channel conductances with that of recombinant AMPARs expressed in HEK cells. Homomeric GluR2 (edited) AMPARs exhibit an exceptionally low channel conductance. On the other hand, recombinant homomeric AMPARs composed of unedited subunits display multiple conductances with a relatively large maximum conductance level (∼25 pS: for GluR4, GluR3 and GluR1; see Swanson et al. 1997; Rosenmund et al. 1998; Derkach et al. 1999; Banke et al. 2000). Of the directly resolved extrasynaptic channel openings that we observed here, 90 % of data gave conductances between 2.9 ± 0.3 and 12.6 ± 1.2 pS (n = 5, in 1 mm glutamate), suggesting that these events arise from heteromeric assemblies of GluR2 and at least one other type of AMPAR subunit (presumably GluR3 or GluR1).
It is worth noting that the MEPSC decay time in these cells also provides clues about the subunits present. The predominant component of the decay time constants (τf = 1.59 ms) is similar to that described for cerebellar interneurones thought to express GluR2/3 receptor assemblies (see Barbour et al. 1994; Clark & Cull-Candy, 2002). Furthermore, the desensitisation time constant reported for GluR2/3 subunit assemblies (4.9 ms, when composed of recombinant GluR2flip/GluR3flip subunits; Mosbacher et al. 1994) is similar to the value we observed in Purkinje cell patches (∼4.6 ms). On the other hand, the deactivation and desensitisation time constants we obtained would not be consistent with a significant contribution either from homomeric GluR2flip or GluR2flop receptors (see Koike et al. 2000).
Postsynaptic receptor packing density
We estimate the minimum packing density of synaptic AMPARs to be 900 receptors μm−2. Because our ultrastructural data showed that the labelling by anti-GluR2/3 antibody is highly localised at PSDs, it seems reasonable to use the area of PSDs for this estimation. Our postsynaptic AMPAR density estimate has been corrected for filtering (∼15 %), and would represent a lower limit if postsynaptic receptors were not saturated by the transmitter packet at these synapses. Further, since it seems possible that synaptically activated AMPARs will open to multiple levels, NSFA will provide a mean conductance value that is weighted towards higher levels. This will probably result in a slight underestimate in the number of channels present.
NSFA is likely to be compromised if the conductance of underlying channels changes during the decay phase of the EPSC, for example, as a result of the concentration-dependence of channel conductance. Such dependence has been described for recombinant chimeric kainate-AMPA (GluR6/GluR3) receptor channels (Rosenmund et al. 1998) and for certain native extrasynaptic AMPARs (Smith & Howe, 2000). However, in the present experiments we found no significant difference between the single-channel conductance values estimated during long or brief pulses of glutamate. Furthermore, previous experiments comparing channel conductances estimated (from PS-NSFA) from different portions of the EPSC decay have not detected significant differences (Traynelis et al. 1993).
Although receptor density has so far been estimated for very few central synapses, it is of note that our value is similar to that described for synaptic AMPARs at mossy fibre inputs to cerebellar granule cells (∼1000 receptors μm−2, Silver et al. 1996) and for the GABAA receptor density in cerebellar stellate cells (∼1250 receptors μm−2, Nusser et al. 1997). A lower density has been derived for non-NMDARs at mossy fibre synapses in the hippocampus (∼500 receptors μm−2; Nusser, 1999), although it is worth noting that in this latter case the calculation was based on single-channel conductance estimates obtained from extrasynaptic receptors (Jonas et al. 1993) combined with the anatomical data (Nusser et al. 1998). Although it remains to be seen whether postsynaptic AMPAR density varies between different CF synapse sites, this should not affect our estimate of the average receptor density.
A critical requirement in the application of NSFA is that the expected waveform is the same for all currents. Given the practical difficulties associated with obtaining sufficient numbers of quantal events arising from a single release site, we have examined synaptic events arising from multiple independent sites on the same cell. After statistical tests confirmed that these events displayed no detectable differences in waveform, we performed PS-NSFA, using the average of EPSCs as the expected waveform. However, if variations in transmitter waveforms (Nusser et al. 2001), or receptor heterogeneity between postsynaptic sites exist, these would generate non-uniform populations of events (thus non-uniform expected waveforms) and would therefore be likely to give an erroneous estimate. In such situations, it is expected that upon randomisation test such as the bootstrap, the best-fit results to current-variance plots would exhibit greater variability than that obtained from simulated currents, which accounts only for sampling bias. The fact that our real EPSCs exhibited a bootstrap CV similar to that derived from simulations suggests errors from non-uniform populations of events were minimal.
Variability of quantal size
Our experiments have identified the presence of considerable variability in quantal size at P2–4 CF-Purkinje synapses (CV 0.47, at 33–34 °C), as previously described at more mature CF-Purkinje connections (CV 0.37; Silver et al. 1998), and at some other types of synaptic inputs (Frerking & Wilson, 1996). This variability in quantal size could arise from a number of pre- and postsynaptic factors. We have directly investigated the postsynaptic contribution to this variability by measuring the variance of PSD size. Our results demonstrate that PSD size also shows considerable variability at these CF-Purkinje cell synapses (CV 0.63). This is comparable to the situation described for hippocampal glutamatergic synapses (Schikorski & Stevens, 1997; Trommald & Hulleberg, 1997). It is notable that the distribution both of quantal size and of PSD size are significantly different from Gaussian (K–S test). When each dataset was normalised to the respective mean, there was a statistically significant difference between the distributions (K–S test), suggesting that unlike the situation described at GABAergic synapses in stellate cells (Nusser et al. 1997), a simply linear relationship cannot link the variability of the functional and structural parameters at immature CF synapses. In contrast with GABAergic synapses in stellate cells, the CV of PSD size is larger than that of quantal events, even for quantal EPSCs recorded at near-physiological temperatures. These results are consistent with the idea that quantal size variability at immature CF synapses arises predominantly from intersite variance (type II variance; see also Silver et al. 1998, for CF synapses at P12–14), as concluded for GABAergic synapses in cerebellar stellate cells (Nusser et al. 1997) and for glycinergic synapses in the brainstem (Lim et al. 1999).
Can quantal size variability be attributed to PSD size variability, if the CV of the quantal size is less than that of PSD? First, as discussed above, the density of AMPARs may not be uniform across different CF-Purkinje cell synapses on the same cell, in which case the number of receptors present at each site would not be directly proportional to the size of PSD. Such a situation has been reported for hippocampal synapses, where very small PSDs appear to lack AMPARs (Nusser et al. 1998; Takumi et al. 1999). This would in fact mean that two populations of PSDs exist, leading to a mismatch of the CVs of pooled populations. This would result in a smaller variation in quantal size when compared with that of the PSD size. Second, the CV of quantal size could reflect limited resolution of small quantal events, while the thickness of ultrathin sections would limit the detection of small PSDs. With our recorded baseline noise level, quantal events < 43 pS would not have been detected, and PSDs < 140 nm in diameter would have been missed from sampling. If the fraction of ‘missed small quantal events’ greatly exceeds that of ‘missed small PSDs’, then the CV of quantal size would be disproportionately reduced. Third, the occupancy of AMPARs may differ between synapses in these cells. For example, if a packet of glutamate saturates the postsynaptic receptors at synapses with small PSDs but not at larger synapses, this would result in a reduced CV of quantal size. Fourth, if release probability is correlated with the size of the synapse, such that quantal events occur more frequently at synapses with large PSDs (Schikorski & Stevens, 1997; Xu-Fiedman et al. 2001), this would affect the quantal size distribution, tending to reduce its CV.
In order to elucidate the mechanism that account for the corrrelation of functional and structural properties, it would clearly be of interest to examine these parameters specifically at a single postsynaptic site in response to a known concentration of agonist (for example, by means of two-photon laser uncaging of 4-methoxy-7-nitroindolinyl-caged l-glutamate; Matsuzaki et al. 2001). The possible correlation that our data suggest between anatomical and functional properties underlines the role of postsynaptic geometry and receptor number in determining the size and variability of synaptic currents, and indicates that modulation of these factors during development and synaptic plasticity provides an important mechanism for the regulation of synaptic efficacy.
Acknowledgments
This work was supported by a Wellcome Trust Programme Grant to S.G.C.-C., and a Wellcome Trust Biomedical Sciences Collaborative award (to S.G.C.-C. and A.M.). A.M. was supported by Wellcome Trust Travelling Research Fellowship, PRESTO21, from the Japan Science and Technology Corporation, and Grants-in-Aid for Scientific Research from the Ministry of Education, Culture, Sports, Science and Technology. R.A.S. and M.H. are in receipt of Wellcome Trust Senior Fellowships and funded by the European Community. R.S. was funded by CREST from the Japan Science and Technology Corporation, and S.G.C.-C. is in receipt of a Royal Society-Wolfson Research Merit Award. We are grateful to Beverley Clark, Stephen Brickley and Mark Farrant for discussion and helpful comments on the manuscript, Martin Wilson, Tomoyuki Takahashi, Takeshi Sakaba, Keiji Imoto, Tadashi Ogawa and Arnd Roth for discussion of preliminary data, and Stephen Traynelis for generous use of software and discussion of simulations.
References
- Altman J. Postnatal development of the cerebellar cortex in the rat II. Phases in the maturation of Purkinje cells and of the molecular layer. J Comp Neurol. 1972;145:399–463. doi: 10.1002/cne.901450402. [DOI] [PubMed] [Google Scholar]
- Auger C, Marty A. Heterogeneity of functional synaptic parameters among single release sites. Neuron. 1997;19:139–150. doi: 10.1016/s0896-6273(00)80354-2. [DOI] [PubMed] [Google Scholar]
- Bahn S, Volk B, Wisden W. Kainate receptor gene expression in the developing rat brain. J Neurosci. 1994;14:5525–5547. doi: 10.1523/JNEUROSCI.14-09-05525.1994. [DOI] [PMC free article] [PubMed] [Google Scholar]
- Banke TG, Bowie D, Lee H–K, Huganir RL, Schousboe A, Traynelis SF. Control of GluR1 AMPA receptor function by cAMP-dependent protein kinase. J Neurosci. 2000;20:89–102. doi: 10.1523/JNEUROSCI.20-01-00089.2000. [DOI] [PMC free article] [PubMed] [Google Scholar]
- Barbour B, Keller BU, Llano I, Marty A. Prolonged presence of glutamate during excitatory synaptic transmission to cerebellar Purkinje cells. Neuron. 1994;12:1331–1343. doi: 10.1016/0896-6273(94)90448-0. [DOI] [PubMed] [Google Scholar]
- Benke TA, Lüthi A, Isaac JT, Collingridge GL. Modulation of AMPA receptor unitary conductance by synaptic activity. Nature. 1998;393:793–797. doi: 10.1038/31709. [DOI] [PubMed] [Google Scholar]
- Borst JGG, Kits KS, Bier M. Variance analysis of gamma-aminobutyric acid (GABA)-ergic inhibitory postsynaptic currents from melanotropes of Xenopus laevis. Biophys J. 1994;67:183–189. doi: 10.1016/S0006-3495(94)80468-0. [DOI] [PMC free article] [PubMed] [Google Scholar]
- Bowie D, Bähring R, Mayer ML. Block of kainate and AMPA receptors by polyamines and insect toxins. In: Jonas P, Monyer H, editors. Handbook of Experimental Pharmacology: Iono-tropic Glutamate Receptors in the CNS. Vol. 141. Berlin: Springer-Verlag; 1999. pp. 251–273. [Google Scholar]
- Brickley SG, Cull-Candy SG, Farrant M. Single-channel properties of synaptic and extrasynaptic GABAA receptors suggest differential targeting of receptor subtypes. J Neurosci. 1999;19:2960–2973. doi: 10.1523/JNEUROSCI.19-08-02960.1999. [DOI] [PMC free article] [PubMed] [Google Scholar]
- Chedotal A, Sotelo C. The ‘creeper stage’ in cerebellar climbing fiber synaptogenesis precedes the ‘pericellular nest’– ultrastructural evidence with parvalbumin immunocytochemistry. Dev Brain Res. 1993;76:207–220. doi: 10.1016/0165-3806(93)90209-s. [DOI] [PubMed] [Google Scholar]
- Clark BA, Cull-Candy SG. Activity-dependent recruitment of extrasynaptic NMDA receptor activation at an AMPA receptor-only synapse. J Neurosci. 2002;22:4428–4436. doi: 10.1523/JNEUROSCI.22-11-04428.2002. [DOI] [PMC free article] [PubMed] [Google Scholar]
- Clark BA, Farrant M, Cull-Candy SG. A direct comparison of the single-channel properties of synaptic and extrasynaptic NMDA receptors. J Neurosci. 1997;17:107–116. doi: 10.1523/JNEUROSCI.17-01-00107.1997. [DOI] [PMC free article] [PubMed] [Google Scholar]
- Clements JD. Transmitter timecourse in the synaptic cleft: its role in central synaptic function. Trends Neurosci. 1996;19:163–171. doi: 10.1016/s0166-2236(96)10024-2. [DOI] [PubMed] [Google Scholar]
- Crépel F, Delhaye-Bouchaud N, Dupond JL. Fate of the multiple innervation of cerebellar Purkinje cells by climbing fibers in immature control, x-irradiated and hypothyroid rats. Dev Brain Res. 1981;1:59–71. doi: 10.1016/0165-3806(81)90094-8. [DOI] [PubMed] [Google Scholar]
- Cull-Candy SG, Howe JR, Ogden DC. Noise and single channels activated by excitatory amino acids in rat cerebellar granule neurones. J Physiol. 1988;400:189–222. doi: 10.1113/jphysiol.1988.sp017117. [DOI] [PMC free article] [PubMed] [Google Scholar]
- Cull-Candy SG, Usowicz MM. Multiple-conductance channels activated by excitatory amino acids in cerebellar neurons. Nature. 1987;325:525–528. doi: 10.1038/325525a0. [DOI] [PubMed] [Google Scholar]
- De Koninck Y, Mody I. Noise analysis of miniature IPSCs in adult rat brain slices: properties and modulation of synaptic GABAA receptor channels. J Neurophysiol. 1994;71:1318–1335. doi: 10.1152/jn.1994.71.4.1318. [DOI] [PubMed] [Google Scholar]
- Derkach V, Barria A, Soderling TR. Ca2+/calmodulin-kinase II enhances channel conductance of α-amino-3-hydroxy-5-methyl-4-isoxazolepropionate type glutamate receptors. Proc Natl Acad Sci U S A. 1999;96:3269–3274. doi: 10.1073/pnas.96.6.3269. [DOI] [PMC free article] [PubMed] [Google Scholar]
- Diamond JS, Jahr CE. Transporters buffer synaptically released glutamate on a submillisecond time scale. J Neurosci. 1997;17:4672–4687. doi: 10.1523/JNEUROSCI.17-12-04672.1997. [DOI] [PMC free article] [PubMed] [Google Scholar]
- DiGregorio DA, Nusser Z, Silver RA. Spillover of glutamate onto synaptic AMPA receptors enhances fast transmission at a cerebellar synapse. Neuron. 2002;35:521–533. doi: 10.1016/s0896-6273(02)00787-0. [DOI] [PubMed] [Google Scholar]
- Dingledine R, Borges K, Bowie D, Traynelis SF. The glutamate receptor ion channels. Pharmacol Rev. 1999;51:7–61. [PubMed] [Google Scholar]
- Efron B, Tibshirani R. An Introduction to the Bootstrap. New York: Chapmann & Hall; 1993. [Google Scholar]
- Farrant M, Cull-Candy SG. Excitatory amino acid receptor-channels in Purkinje cells in thin cerebellar slices. Proc R Soc Lond B Biol Sci. 1991;244:179–184. doi: 10.1098/rspb.1991.0067. [DOI] [PubMed] [Google Scholar]
- Forti L, Bossi M, Bergamaschi A, Villa A, Malgaroli A. Loose-patch recordings of single quanta at individual hippocampal synapses. Nature. 1997;388:874–878. doi: 10.1038/42251. [DOI] [PubMed] [Google Scholar]
- Frerking M, Wilson M. Saturation of postsynaptic receptors at central synapses? Curr Opin Neurobiol. 1996;6:395–403. doi: 10.1016/s0959-4388(96)80125-5. [DOI] [PubMed] [Google Scholar]
- Hollmann M. Structure of ionotropic glutamate receptors. In: Jonas P, Monyer H, editors. Handbook of Experimental Pharmacology: Ionotropic Glutamate Receptors in the CNS. Berlin: Springer-Verlag; 1999. pp. 3–98. [Google Scholar]
- Jahr CE, Stevens CF. Glutamate activates multiple single channel conductances in hippocampal neurons. Nature. 1987;325:522–525. doi: 10.1038/325522a0. [DOI] [PubMed] [Google Scholar]
- Jonas P, Major G, Sakmann B. Quantal components of unitary EPSCs at the mossy fibre synapse on CA3 pyramidal cells of rat hippocampus. J Physiol. 1993;472:615–663. doi: 10.1113/jphysiol.1993.sp019965. [DOI] [PMC free article] [PubMed] [Google Scholar]
- Katz B. The Fenn lecture – Neural transmitter release: from quantal secretion to exocytosis and beyond. J Neurocytol. 1996;25:677–686. doi: 10.1007/BF02284834. [DOI] [PubMed] [Google Scholar]
- Koike M, Tsukada S, Tsuzuki K, Kijima H, Ozawa S. Regulation of kinetic properties of GluR2 AMPA receptor channels by alternative splicing. J Neurosci. 2000;20:2166–2174. doi: 10.1523/JNEUROSCI.20-06-02166.2000. [DOI] [PMC free article] [PubMed] [Google Scholar]
- Konnerth A, Llano I, Armstrong CM. Synaptic currents in cerebellar Purkinje cells. Proc Natl Acad Sci U S A. 1990;87:2662–2665. doi: 10.1073/pnas.87.7.2662. [DOI] [PMC free article] [PubMed] [Google Scholar]
- Lambolez B, Audinat E, Bochet P, Crépel F, Rossier J. AMPA receptor subunits expressed by single Purkinje cells. Neuron. 1992;9:247–258. doi: 10.1016/0896-6273(92)90164-9. [DOI] [PubMed] [Google Scholar]
- Lim R, Alvarez FJ, Walmsley B. Quantal size is correlated with receptor cluster area at glycinergic synapses in the rat brainstem. J Physiol. 1999;516:505–512. doi: 10.1111/j.1469-7793.1999.0505v.x. [DOI] [PMC free article] [PubMed] [Google Scholar]
- Liu S-Q J, Cull-Candy S G. Synaptic activity at calcium-permeable AMPA receptors induces a switch in receptor subtype. Nature. 2000;405:454–458. doi: 10.1038/35013064. [DOI] [PubMed] [Google Scholar]
- Matsuzaki M, Ellis-Davies GCR, Nemoto T, Miyashita Y, Iino M, Kasai H. Dendritic spine geometry is critical for AMPA receptor expression in hippocampal CA1 pyramidal neurones. Nat Neurosci. 2001;4:1086–1092. doi: 10.1038/nn736. [DOI] [PMC free article] [PubMed] [Google Scholar]
- Misra C, Brickley SG, Wyllie DJA, Cull-Candy SG. Slow deactivation kinetics of NMDA receptors containing NR1 and NR2D subunits in rat cerebellar Purkinje cells. J Physiol. 2000;525:299–305. doi: 10.1111/j.1469-7793.2000.t01-1-00299.x. [DOI] [PMC free article] [PubMed] [Google Scholar]
- Momiyama A, Feldmeyer D, Cull-Candy SG. Identification of a native low-conductance NMDA channel with reduced sensitivity to Mg2+ in rat central neurones. J Physiol. 1996a;494:479–492. doi: 10.1113/jphysiol.1996.sp021507. [DOI] [PMC free article] [PubMed] [Google Scholar]
- Momiyama A, Silver RA, Cull-Candy SG. Conductance of glutamate receptor channels at climbing fibre synapses in rat Purkinje cells in thin slices. J Physiol. 1996b;494:86P. [Google Scholar]
- Monyer H, Seeburg PH, Wisden W. Glutamate-operated channels: developmentally early and mature forms arise by alternative splicing. Neuron. 1991;6:799–810. doi: 10.1016/0896-6273(91)90176-z. [DOI] [PubMed] [Google Scholar]
- Mosbacher J, Schoepfer R, Monyer H, Burnashev N, Seeburg PH, Ruppersberg JP. A molecular determinant for submillisecond desensitisation in glutamate receptors. Science. 1994;266:1059–1062. doi: 10.1126/science.7973663. [DOI] [PubMed] [Google Scholar]
- Nusser Z. A new approach to estimate the number, density and variability of receptors at central synapses. Eur J Neurosci. 1999;11:745–752. doi: 10.1046/j.1460-9568.1999.00535.x. [DOI] [PubMed] [Google Scholar]
- Nusser Z, Cull-Candy SG, Farrant M. Differences in synaptic GABAA receptor number underlie variation in GABA mini amplitude. Neuron. 1997;19:697–709. doi: 10.1016/s0896-6273(00)80382-7. [DOI] [PubMed] [Google Scholar]
- Nusser Z, Lujan R, Laube G, Roberts JDB, Molnar E, Somogyi P. Cell type and pathway dependence of synaptic AMPA receptor number and variability in the hippocampus. Neuron. 1998;21:545–559. doi: 10.1016/s0896-6273(00)80565-6. [DOI] [PubMed] [Google Scholar]
- Nusser Z, Naylor D, Mody I. Synapse-specific contribution of the variation of transmitter concentration to the decay of inhibitory postsynaptic currents. Biophys J. 2001;80:1251–1261. doi: 10.1016/S0006-3495(01)76101-2. [DOI] [PMC free article] [PubMed] [Google Scholar]
- Otis TS, De Koninck Y, Mody I. Lasting potentiation of inhibition is associated with an increased number of γ-aminobutyric acid type A receptors activated during miniature inhibitory postsynaptic currents. Proc Natl Acad Sci U S A. 1994;91:7698–7702. doi: 10.1073/pnas.91.16.7698. [DOI] [PMC free article] [PubMed] [Google Scholar]
- Ripellino JA, Neve RL, Howe JR. Expression and heteromeric interactions of non-N-methyl-d-aspartate glutamate receptor subunits in the developing and adult cerebellum. Neuroscience. 1998;82:485–497. doi: 10.1016/s0306-4522(97)00296-0. [DOI] [PubMed] [Google Scholar]
- Robain O, Bideau I, Farkas E. Developmental changes of synapses in the cerebellar cortex of the rat. A quantitative analysis. Brain Res. 1981;206:1–8. doi: 10.1016/0006-8993(81)90095-0. [DOI] [PubMed] [Google Scholar]
- Robinson HPC, Sahara Y, Kawai N. Nonstationary fluctuation analysis and direct resolution of single-channel currents at postsynaptic sites. Biophys J. 1991;59:295–304. doi: 10.1016/S0006-3495(91)82223-8. [DOI] [PMC free article] [PubMed] [Google Scholar]
- Rosenmund C, Stern-Bach Y, Stevens CF. The tetrameric structure of a glutamate receptor channel. Science. 1998;280:1596–1599. doi: 10.1126/science.280.5369.1596. [DOI] [PubMed] [Google Scholar]
- Roth A, Häusser M. Compartmental models of rat cerebellar Purkinje cells based on simultaneous somatic and dendritic patch-clamp recordings. J Physiol. 2001;535:445–472. doi: 10.1111/j.1469-7793.2001.00445.x. [DOI] [PMC free article] [PubMed] [Google Scholar]
- Schikorski T, Stevens CF. Quantitative ultrastructural analysis of hippocampal excitatory synapses. J Neurosci. 1997;17:5858–5867. doi: 10.1523/JNEUROSCI.17-15-05858.1997. [DOI] [PMC free article] [PubMed] [Google Scholar]
- Shigemoto R, Nakanishi S, Mizuno N. Distribution of the mRNA for a metabotropic glutamate receptor (mGluR1) in the central nervous system: an in situ hybridization study in adult and developing rat. J Comp Neurol. 1992;322:121–135. doi: 10.1002/cne.903220110. [DOI] [PubMed] [Google Scholar]
- Sigworth FJ. The variance of sodium current fluctuations at the node of Ranvier. J Physiol. 1980;307:97–129. doi: 10.1113/jphysiol.1980.sp013426. [DOI] [PMC free article] [PubMed] [Google Scholar]
- Silver RA, Cull-Candy SG, Takahashi T. Non-NMDA glutamate receptor occupancy and open probability at a rat cerebellar synapse with single and multiple release sites. J Physiol. 1996;494:231–250. doi: 10.1113/jphysiol.1996.sp021487. [DOI] [PMC free article] [PubMed] [Google Scholar]
- Silver RA, Momiyama A, Cull-Candy SG. Locus of frequency-dependent depression identified with multiple-probability fluctuation analysis at rat climbing fibre-Purkinje cell synapses. J Physiol. 1998;510:881–902. doi: 10.1111/j.1469-7793.1998.881bj.x. [DOI] [PMC free article] [PubMed] [Google Scholar]
- Silver RA, Traynelis SF, Cull-Candy SG. Rapid-time-course miniature and evoked excitatory currents at cerebellar synapses in situ. Nature. 1992;355:163–167. doi: 10.1038/355163a0. [DOI] [PubMed] [Google Scholar]
- Smith TC, Howe JR. Concentration-dependent substate behavior of native AMPA receptors. Nat Neurosci. 2000;3:992–997. doi: 10.1038/79931. [DOI] [PubMed] [Google Scholar]
- Swanson GT, Kamboj SK, Cull-Candy SG. Single-channel properties of recombinant AMPA receptors depend on RNA editing, splice variation and subunit composition. J Neurosci. 1997;17:58–69. doi: 10.1523/JNEUROSCI.17-01-00058.1997. [DOI] [PMC free article] [PubMed] [Google Scholar]
- Takahashi T, Momiyama A. Single-channel currents underlying glycinergic inhibitory postsynaptic responses in spinal neurons. Neuron. 1991;7:965–969. doi: 10.1016/0896-6273(91)90341-v. [DOI] [PubMed] [Google Scholar]
- Takumi Y, Ramirez-Leon V, Laake P, Rinvik E, Ottersen OP. Different modes of expression of AMPA and NMDA receptors in hippocampal synapses. Nat Neurosci. 1999;2:618–624. doi: 10.1038/10172. [DOI] [PubMed] [Google Scholar]
- Tempia F, Kano M, Schneggenburger R, Schirra C, Garaschuk O, Plant T, Konnerth A. Fractional calcium current through neuronal AMPA-receptor channels with a low calcium permeability. J Neurosci. 1996;16:456–466. doi: 10.1523/JNEUROSCI.16-02-00456.1996. [DOI] [PMC free article] [PubMed] [Google Scholar]
- Traynelis SF, Jaramillo F. Getting the most out of noise in the central nervous system. Trends Neurosci. 1998;21:137–145. doi: 10.1016/s0166-2236(98)01238-7. [DOI] [PubMed] [Google Scholar]
- Traynelis SF, Silver RA, Cull-Candy SG. Estimated conductance of glutamate receptor channels activated during EPSCs at the cerebellar mossy fiber-granule cell synapse. Neuron. 1993;11:279–289. doi: 10.1016/0896-6273(93)90184-s. [DOI] [PubMed] [Google Scholar]
- Trommald M, Hulleberg G. Dimensions and density of dendritic spines from rat dentate granule cells based on reconstructions from serial electron micrographs. J Comp Neurol. 1997;377:15–28. doi: 10.1002/(sici)1096-9861(19970106)377:1<15::aid-cne3>3.0.co;2-m. [DOI] [PubMed] [Google Scholar]
- Wyllie DJA, Traynelis SF, Cull-Candy SG. Evidence for more than one type of non-NMDA receptor in outside-out patches from cerebellar granule cells of the rat. J Physiol. 1993;463:193–226. doi: 10.1113/jphysiol.1993.sp019591. [DOI] [PMC free article] [PubMed] [Google Scholar]
- Xu-Friedman MA, Harris KM, Regehr W. Three-dimensional comparison of ultrastructural characteristics at depressing and facilitating synapses onto cerebellar Purkinje cells. J Neurosci. 2001;21:6666–6672. doi: 10.1523/JNEUROSCI.21-17-06666.2001. [DOI] [PMC free article] [PubMed] [Google Scholar]
- Zhao H–M, Wenthold RJ, Petralia RS. Glutamate receptor targeting to synaptic populations on Purkinje cells is developmentally regulated. J Neurosci. 1998;18:5517–5528. doi: 10.1523/JNEUROSCI.18-14-05517.1998. [DOI] [PMC free article] [PubMed] [Google Scholar]