

Abstract
The aim of the present study was to simultaneously examine skeletal muscle heat production and ATP turnover in humans during dynamic exercise with marked differences in aerobic metabolism. This was done to test the hypothesis that efficiency is higher in anaerobic than aerobic ATP resynthesis. Six healthy male subjects performed 90 s of low intensity knee-extensor exercise with (OCC) and without thigh occlusion (CON-LI) as well as 90 s of high intensity exercise (CON-HI) that continued from the CON-LI bout. Muscle heat production was determined by continuous measurements of muscle heat accumulation and heat release to the blood. Muscle ATP production was quantified by repeated measurements of thigh oxygen uptake as well as blood and muscle metabolite changes. All temperatures of the thigh were equalized to ≈37 °C prior to exercise by a water-perfused heating cuff. Oxygen uptake accounted for 80 ± 2 and 59 ± 4 %, respectively, of the total ATP resynthesis in CON-LI and CON-HI, whereas it was negligible in OCC. The rise in muscle temperature was lower (P < 0.05) in OCC than CON-LI (0.32 ± 0.04 vs. 0.37 ± 0.03 °C). The mean rate of heat production was also lower (P < 0.05) in OCC than CON-LI (36 ± 4 vs. 57 ± 4 J s−1). Mechanical efficiency was 52 ± 4 % after 15 s of OCC and remained constant, whereas it decreased (P < 0.05) from 56 ± 5 to 32 ± 3 % during CON-LI. During CON-HI, mechanical efficiency transiently increased (P < 0.05) to 47 ± 4 %, after which it decreased (P < 0.05) to 36 ± 3 % at the end of CON-HI. Assuming a fully coupled mitochondrial respiration, the ATP turnover per unit of work was calculated to be unaltered during OCC (≈20 mmol ATP kJ−1), whereas it increased (P < 0.05) from 21 ± 4 to 29 ± 3 mmol ATP kJ−1 during CON-LI and further (P < 0.05) to 37 ± 3 mmol ATP kJ−1 during CON-HI. The present data confirm the hypothesis that heat loss is lower in anaerobic ATP resynthesis than in oxidative phosphorylation and can in part explain the finding that efficiency declines markedly during dynamic exercise. In addition, the rate of ATP turnover apparently increases during constant load low intensity exercise. Alternatively, mitochondrial efficiency is lowered as exercise progresses, since ATP turnover was unaltered during the ischaemic exercise bout.
Recent studies have revealed that muscular efficiency is high at the onset of intense dynamic exercise and rapidly decreases as exercise progresses (González-Alonso et al. 2000; Bangsbo et al. 2001; Krustrup et al. 2001). However, it is unclear what causes such a reduction in efficiency, determined as a rise in energy turnover per unit of work performed. Based on in vitro studies, it has been suggested to be related to the progressive increase in oxygen uptake at onset of exercise, since these studies have shown that the heat production in ATP resynthesis from oxidative phosphorylation is higher than for anaerobic metabolism (Hill & Woledge, 1962; Walsh & Woledge, 1970; Curtin & Woledge, 1978; Hinkle & Yu, 1979). Thus, a number of studies have determined the molar enthalpy of individual metabolic pathways and although the absolute values differ markedly in relation to ambient temperatures and experimental set up, it is consistently reported that net creatine phosphate (CP) breakdown has a higher efficiency than aerobic ATP resynthesis, with glycolysis being in between (see review by Curtin & Woledge, 1978). However, whether this relationship is similar in humans during dynamic exercise at physiological temperatures has yet to be examined.
To address this issue, it is necessary to measure muscle heat production and metabolic energy turnover simultaneously during bouts of exercise that have different contributions from the various energetic pathways. The muscle ATP turnover and the contribution of aerobic and anaerobic metabolism can be quantified from frequent measurements of muscle blood flow as well as blood and muscle metabolites (Bangsbo et al. 1992, 2001). At the same time, muscle heat production can be quantified by measurements of heat stored in the contracting muscle and heat dissipated from the muscle via the bloodstream (González-Alonso et al. 2000; Krustrup et al. 2001). To create a large difference in the aerobic contribution to energy metabolism, a low intensity exercise bout can be performed with and without thigh occlusion. As the exercise progresses in the free flow condition almost all energy will be derived from oxidative phosphorylation, whereas during the situation in which blood flow is occluded, aerobic metabolism will be minor, as the local oxygen stores are rapidly emptied (Richardson et al. 1995). In addition, high intensity exercise can be performed immediately after a low intensity exercise bout, which will markedly increase the anaerobic energy turnover during the transition phase between the two intensities. Thus, if the heat loss is higher in aerobic than anaerobic ATP resynthesis, a lower heat production would be observed when ATP resynthesis is driven by anaerobic mechanisms i.e. during exercise with circulatory occlusion. Similarly, the rate of heat production will increase as the low intensity exercise bout progresses and it should also be expected that the heat production per unit of power output will decrease in the transition from low to high intensity exercise.
An additional explanation for the decline in efficiency at the onset of intense exercise is that the ATP cost per unit of power output increases as exercise progresses (Bangsbo et al. 2001). Although factors such as lowered muscle pH, increased muscle temperature and recruitment of additional fibres have been suggested to elevate ATP turnover (Curtin et al. 1988; Cooke et al. 1988; Barclay et al. 1993; Willis & Jackman, 1994), it is not yet clear what causes the observed decrease in efficiency and whether it is restricted to high intensity exercise. Thus, another important question is whether the rate of ATP production is altered during constant load low intensity exercise when there would be little or no change in muscle pH and metabolite levels.
Thus, the aim of the present study was to examine muscle heat and ATP production simultaneously during dynamic exercise with different contributions of oxidative phosphorylation, to test the hypothesis that the heat loss in ATP resynthesis is larger in aerobic than anaerobic energy turnover. In addition, the question of whether ATP turnover changes during constant load low intensity exercise was studied.
Methods
Subjects
Six, healthy, male subjects ranging in age from 22 to 26 years, with an average height of 182 cm (range: 173–188 cm) and an average body mass of 74.4 kg (range: 63.6–84.1 kg), participated in the study. The mean knee-extensor mass of the experimental leg was 2.37 kg, with a range of 2.01–2.72 kg. The fibre type distribution of the quadriceps femoris muscle was 57 % (41–75 %), 23 % (8–35 %) and 20 % (3–33 %) type I, IIa and IIb fibres, respectively. All subjects were habitually physically active, but none trained for competition. The subjects were fully informed of any risks and discomforts associated with the experiments before giving their written informed consent to participate. The study was carried out in accordance with the guidelines contained in the Declaration of Helsinki and was approved by the Ethics Committee of Copenhagen and Frederiksberg communities.
Exercise model
Subjects performed dynamic one-legged knee-extensor exercise in the supine position on an ergometer that permitted the exercise to be confined to the quadriceps muscle (Andersen et al. 1985). Before the experiment the subjects practiced the exercise on more than three separate occasions.
Experimental protocol
Subject preparation. On the morning of the experiment, subjects had a light breakfast and arrived at the laboratory about 2 h prior to the experiment. After a period of rest in the supine position, one femoral venous and two femoral arterial catheters were placed under local anaesthesia using the Seldinger technique. A femoral arterial and venous catheter was placed in the experimental leg, 1–2 cm distal to the inguinal ligament. In the other leg, a femoral arterial catheter, for blood sampling, was positioned 1–2 cm proximal to the inguinal ligament. To measure femoral arterial and venous blood temperatures, thermistors with a samling-frequency of 100 Hz (Edslab 94–0.30–2.5F, Baxter A/S, Allerød, Denmark) were inserted through the two catheters in the experimental leg and placed beyond the tip of the catheters. The femoral venous catheter was also used for blood sampling and flow measurements.
Thereafter, six thermistors of the same type were inserted into the quadriceps femoris muscle through a venflon cannula (18 g, 32 mm) and advanced ≈0.5 cm beyond the venflon tip into the muscle. Two thermistors were inserted into the proximal and distal portion of the vastus lateralis muscle, two in the medial and distal portion of the rectus femoris muscle and two into the distal portion of the vastus medialis muscle. The thermistors were inserted in the length direction of the muscle fibres at inclinations of 30, 45 and 60 deg corresponding to a muscle depth of 1.5–3.0 cm. In addition, one thermistor was inserted into the medial portion of the biceps femoris muscle. The temperature response of the vastus intermedius muscle was estimated as a mean value of the three other quadriceps muscle portions (González-Alonso et al. 2000). The tip of the thermistor probe was positioned in direct contact with the muscle by advancing it ≈0.5 cm beyond the venflon tip. To support the thermistors the venflon cannulas were left in place and fastened to the skin with tape. Adjacent to each of the seven muscle thermistor probes, a skin thermocouple (MHC-40050-A, Ellab, Copenhagen, Denmark) was placed and secured to the skin with tape.
To minimize heat loss from the exercising leg to the surrounding environment, thigh muscle, skin and blood temperatures were equalized to the core temperature (≈37 °C). This was done with a water perfused thigh cuff, connected to a 70 l thermostat-regulated water-bath. Firstly, the cuff was perfused with water at 41 °C for 45–60 min until the muscle temperature was increased from resting temperatures of 34–35 to ≈37 °C. Then, the temperature of the perfusing water was reduced to 37 °C for the rest of the experiment, which maintained the skin temperature at a level of 36.9–37.1 °C.
Exercise protocol. The exercise protocol included three bouts of dynamic exercise, consisting of 90 s of low intensity exercise with (CON-LI) and without (OCC) thigh occlusion as well as a 90 s high intensity exercise bout (CON-HI) performed immediately after a low intensity free flow exercise.
Firstly, the subjects performed the 90 s low intensity exercise bout (CON-LI) at a target frequency of 60 kicks min−1 and an external power output equivalent to ≈50 % peak thigh V̇O2. For 30 s prior to the onset of exercise, the leg was passively moved in order to accelerate the ergometer flywheel and ensure a constant power output. Blood samples were drawn from the femoral artery and vein during the passive exercise and after 5, 15, 25, 40, 55 and 80 s of exercise. Immediately after exercise a muscle biopsy was taken. After 45 min rest, during which muscle, skin and blood temperatures were re-equilibrated to control levels, another resting biopsy was taken and a thigh occlusion cuff, placed at the level of the inguinal ligament was inflated to 300 mmHg 30 s prior to exercise in order to occlude the femoral artery. The subjects then performed an ischaemic bout of exercise (OCC) at the same kicking frequency and power output as in CON-LI. Again the leg was passively moved for 30 s prior to the onset of exercise. Immediately after exercise, with occlusion maintained, a muscle biopsy was obtained. After 60 min of rest, with temperatures re-equilibrated, a third exercise bout was performed. This consisted of a 90 s exercise bout at the same intensity as in CON-LI, immediately followed by 90 s of high intensity exercise (CON-HI) performed at a target frequency of 60 kicks min−1 and a power output equivalent to ≈110 % peak thigh V̇O2. Femoral arterial and venous blood samples were drawn 5 s prior to and after 5, 15, 25, 40, 55 and 80 s of the high intensity portion of exercise. A biopsy was obtained immediately after CON-HI. After another 60 min rest, ensuring muscle skin and blood temperatures were re-equilibrated, the latter exercise was performed again in order to allow measurements of thigh blood flow. This was to avoid the effect of infusing cold saline on venous and arterial blood temperatures during the previous exercises (CON-LI and CON-HI). Before these measurements, the femoral venous thermistor was advanced 8–10 cm proximal to the inguinal ligament. Kicking frequency, force tracings and power output were continuously recorded during each of the exercise bouts.
Femoral venous blood flow was measured by the thermodilution technique originally described by Andersen & Saltin (1985) and modified by González-Alonso et al. (2000). Briefly, ice-cold saline was infused at a constant rate of 30 ml min−1 for 45 s at rest and at 120 ml min−1 for 15 s during exercise to achieve a change in blood temperature of 0.8–1.5 °C. As during the previous exercise bouts, a cuff just below the knee was inflated to 240 mmHg 30 s prior to and during exercise, to avoid contribution of blood from the lower leg. Blood flow was measured at rest, during the passive movement immediately prior to the onset of exercise and during the time intervals of 0–10, 15–25, 40–55 and 80–90 s of both CON-LI and CON-HI. Previous studies have shown no difference in the kinetics and magnitude of femoral venous blood flow when knee-extensor exercise is repeated after 1 h of recovery (Bangsbo et al. 2001).
In order to be able to quantify muscle metabolite changes in different phases of exercise, the subjects returned to the laboratory on a separate occasion within 14 days of the main experiment. Three thermistors were positioned in the quadriceps muscles using the technique described earlier. Adjacent to these, skin thermocouples were also placed and secured. The water-perfused cuff was again used to ensure temperature equilibration to 37 °C prior to exercise. First, subjects performed 20 s of low intensity knee-extensor exercise (CON-LI). After 60 min of rest the subjects exercised for 20 s with thigh occlusion (OCC) at the same intensity. After another 75 min of rest, the subject performed 90 s of low intensity exercise immediately followed by a 20 s high intensity exercise bout (CON-HI). All exercises were performed at the same frequency and power output as in the main experiment. A muscle biopsy was obtained at rest and immediately after each of the exercise bouts.
Blood analyses. All blood samples were collected in 2 ml syringes and immediately placed in ice-cold water until analysed. Haemoglobin concentration and oxygen saturation of the blood were determined spectrophotometrically (OSM-3 Hemoximeter, Radiometer, Copenhagen, Denmark). The hemoximeter was calibrated spectrophotometrically by the cyanomethaemoglobin method (Drabkin & Austin, 1935). PO2, PCO2 and pH were measured with the Astrup technique (ABL 30, Radiometer). Another part of the blood sample (100 μl) was haemolysed within 10 s of sampling using a 1:1 dilution with a buffer solution (Yellow Spring Instruments, Yellow Springs, OH, USA) to which 20 g l−1 Triton X-100 was added (Foxdal et al. 1992) for analysis of lactate (model 23, Yellow Spring Instruments).
Muscle biopsy sampling and analyses. Muscle biopsies, taken from the vastus lateralis muscle using the needle biopsy technique with suction (Bergström 1962), were immediately frozen in liquid N2 and stored at −80 °C. The frozen muscle samples were weighed before and after freeze drying to determine water content. The freeze-dried sample was dissected free from blood and connective tissue. A part of the muscle tissue (1–2 mg dry weight) was extracted in a solution of 0.6 m perchloric acid (PCA) and 1 mm EDTA, neutralised to pH 7.0 with 2.2 m KHCO3 and stored at −80 °C until analysed for creatine phosphate (CP) and lactate by flurometric assays (Lowry & Passonneau, 1972). Another part of the muscle tissue (2 mg dry weight) was extracted in 1 m PCA, neutralised to pH 8.0 with 2 m KOH and stored at −80 °C until analysed for adenine nucleotides (ATP, ADP and AMP) using reverse phase high performance liquid chromatography (HPLC) as described by Tullson et al. (1990). In addition, muscle pH was measured by a small glass electrode (Radiometer GK2801, Copenhagen, Denmark) after homogenizing a freeze-dried muscle sample of 2 mg dry weight in a non-buffering solution containing 145 mm KCl, 10 mm NaCl and 5 mm iodoacetic acid (Parkhouse et al. 1985). The remaining portion of the muscle sample was used for histochemical analysis of the fibre type distribution. About 20 mg wet weight muscle tissue was mounted in an embedding medium (OCT Compound Tissue-Tek, Sakura Finetek, Zoeterwoude, The Netherlands), after which it was frozen in isopentane that was cooled to the freezing point in liquid nitrogen. After storage at −80 °C, five serial 10 μm-thick sections were cut at −20 °C and incubated for myofibrillar adenosine triphosphate (ATPase) reactions at pH 9.4, after preincubation at pH 4.3, 4.6 and 10.3.
Muscle mass. The mass of the quadriceps femoris muscle group was estimated anthropometrically, using measurements of thigh length, multiple circumferences of the thigh and skin fold thickness (Jones & Pearson, 1969), and corrected based on a comparison between MR scan and anthropometric determinations (Hellsten et al. 1999).
Calculations
Muscle heat production. Muscle heat production (Hp) was estimated in 5 s periods during each of the exercises as the sum of heat accumulation in thigh muscles (HAm), heat release to the blood (HRb) and heat loss to the skin and through lymph drainage (HRs + ld, see Gonzaléz-Alonso et al. 2000; Krustrup et al. 2001):
The rate of heat accumulation in the active thigh muscles (quadriceps femoris and tensor fascia latae) and inactive thigh muscles (biceps femoris and adductor muscles) was calculated by multiplying the mean increase in temperature in each muscle portion (ΔTm; °C) by the muscle mass of each muscle portion (m; kg) and the specific heat of the muscle at 37.5 °C and 23 % solid content (cm; 3.59 kJ kg−1 °C−1):
The active muscle mass was corrected by the water content changes determined from the muscle biopsies (see Table 1). The rate of heat removal by the blood was calculated by multiplying the venous-arterial temperature difference (Tv-a; °C) by thigh blood flow (TBF; l s−1) and the specific heat of the blood at 37.5 °C (cb; 3.61 kJ l−1° C−1; haematocrit ≈45 %):
Table 1.
Muscle metabolites and electrolytes
| 0 s | 20 s | 90 s | Δ 0–20 s | Δ 20–90 s | Δ 0–90 s | ||
|---|---|---|---|---|---|---|---|
| ATP | CON-LI | 24.7 ± 0.8 | 21.4 ± 1.7* | 24.8 ± 0.7 | −3.3 ± 1.2‡ | 3.4 ± 1.7‡ | 0.1 ± 0.8 |
| OCC | 24.0 ± 0.9 | 22.7 ± 1.3 | 21.2 ± 1.4*† | −1.2 ± 0.8 | −1.6 ± 1.4 | −2.8 ± 1.5‡ | |
| CON-HI | 24.8 ± 0.7 | 22.5 ± 1.4 | 19.9 ± 1.1*† | −2.2 ± 0.7 | −2.6 ± 0.5‡ | −4.9 ± 1.2‡ | |
| CP | CON-LI | 82.2 ± 4.3 | 75.8 ± 2.8* | 70.6 ± 2.2* | −6.4 ± 1.8‡ | −5.2 ± 4.3 | −11.6 ± 4.2‡ |
| OCC | 79.5 ± 3.2 | 68.7 ± 6.4* | 35.9± 6.2*† | −10.9 ± 3.5‡ | −32.8 ± 4.4‡ | −43.7 ± 6.5‡ | |
| CON-HI | 70.6 ± 2.2 | 46.7 ± 5.0* | 24.9 ± 4.1*† | −23.9 ± 4.0‡ | −21.8 ± 6.3‡ | −45.6 ± 3.5‡ | |
| Lactate | CON-LI | 5.0 ± 1.3 | 7.4 ± 2.4 | 12.3 ± 2.6* | 2.5 ± 2.1 | 4.8 ± 3.0 | 7.3 ± 2.7‡ |
| OCC | 4.8 ± 1.1 | 10.5 ± 2.9* | 52.0 ± 6.7*† | 5.7 ± 2.5‡ | 41.5 ± 7.2‡ | 47.2 ± 7.5‡ | |
| CON-HI | 12.3 ± 2.6 | 20.5 ± 5.3*† | 69.5 ± 11.6*† | 8.2 ± 4.7‡ | 49.1 ± 13.5‡ | 57.2 ± 12.9‡ | |
| Water | CON-LI | 77.0 ± 0.5 | 77.3 ± 1.0 | 76.5 ± 0.5 | 0.3 ± 0.9 | −0.8 ± 1.3 | −0.5 ± 0.8 |
| OCC | 77.2 ± 0.4 | 77.1 ± 0.5 | 77.8 ± 0.7 | −0.1 ± 0.7 | 0.7 ± 1.0 | −0.5 ± 0.8 | |
| CON-HI | 76.5 ± 0.5 | 78.3 ± 0.5* | 78.9 ± 0.4*† | 1.8 ± 0.6‡ | 0.4 ± 0.3 | 2.2 ± 0.4‡ | |
| pH | CON-LI | 7.03 ± 0.02 | 7.01 ± 0.05 | 7.02 ± 0.01 | −0.02 ± 0.05 | 0.01 ± 0.04 | −0.01 ± 0.03 |
| OCC | 7.01 ± 0.04 | 7.02 ± 0.04 | 6.79 ± 0.05*† | 0.02 ± 0.02 | −0.24 ± 0.03‡ | −0.23 ± 0.02‡ | |
| CON-HI | 7.02 ± 0.01 | 7.05 ± 0.02 | 6.66 ± 0.06*† | 0.03 ± 0.03 | −0.37 ± 0.06‡ | −0.35 ± 0.03‡ |
Absolute values of and changes in muscle adenosine triphosphate (ATP), creatine phosphate (CP) and lactate (in mmol (kg dry weight)−1), water content (%) and pH before and after 20 and 90 s of low intensity dynamic exercise with (OCC) and without occlusion (CON-LI) as well as high-intensity (CON-HI) exercise preceded by low intensity exercise. Means ±s.e.m. are given (n = 6, except for ATP where n = 5).
Significantly different from pre-exercise value
significantly different from CON-LI
significantly different from zero.
The heat loss to the surrounding skin and heat transfer by the lymph drainage was estimated to be less than 5 % of the total heat production in the three exercise bouts corresponding to 2, 2 and 6 J s−1, respectively, during the first 10 s of CON-LI, OCC and CON-HI, and 4, 3 and 12 J s−1 during the last 10 s of CON-LI, OCC and CON-HI, respectively.
Energy turnover and mechanical efficiency. The rate of total energy turnover (Et) was estimated by summing the rate of heat production (Hp) and mechanical power output (W):
Mechanical power output was calculated as the sum of external work and internal work. A value of 17 W was used for internal work throughout CON-LI, OCC and CON-HI, since internal work has been shown to be constant during non-exhaustive exercise and independent of external load at a kicking frequency of 60 r.p.m. (Ferguson et al. 2000). By the use of force tracings, the negative power during the flexion phase caused in part by gravitational energy from the falling leg, was calculated to be 2–5 W or less than 10 % of the total power output. Mechanical efficiency (ME, %) was defined as the ratio between mechanical power output (W, J s−1) and total energy turnover (Et, J s−1):
Thigh oxygen uptake and lactate release. Thigh oxygen uptake (V̇O2) was calculated by multiplying the blood flow with femoral arterial-venous oxygen difference (Fick principle). A continuous blood flow curve was constructed for each subject by linear connection of the consecutive data points to obtain time-matched values of blood flow with the blood variables. Oxygen utilization from myoglobin was assumed to be 4 and 2 ml kg−1 during 0–20 and 20–90 s of CON-LI and OCC (Harris et al. 1975; Richardson et al. 1995). Net lactate release was calculated by multiplying the blood flow with femoral venous-arterial lactate difference.
Aerobic and anaerobic ATP production. Thigh oxygen uptake was converted to aerobic ATP production using a mole-volume of 22.4 l (mol O2)−1 and a phosphorus/oxygen (P/O) ratio of 2.5 mmol ATP (mmol O2)−1 (Hinkle & Yu, 1979). Thigh oxygen uptake was converted into kJ by multiplying with 20.7 and 21.2 kJ (l O2)−1 during exercise in CON-LI and CON-HI, respectively, assuming a V̇CO2/V̇O2 ratio of 0.9 and 1.0, respectively (Bangsbo et al. 1992, 2001; Kiens et al. 1993). Muscle anaerobic ATP production was calculated as: Δ(muscle ATP and CP) + 3/2Δ(muscle lactate) + 3/2(lactate and pyruvate release) + others.
Others represents ATP production related to accumulation of pyruvate assumed to be 1/30 of accumulated muscle lactate (Spriet et al. 1987), lactate uptake by inactive tissues in the exercising leg (Bangsbo et al. 1998), accumulation of glycolytic intermediates (Spriet et al. 1987) and accumulation and release of alanine (Katz et al. 1986). These correspond to less than 10 % of the total anaerobic ATP production in CON-LI, OCC and CON-HI and can be estimated to be 0.10, 0.15 and 0.33 mmol ATP s−1 during 0–20 s of CON-LI, OCC and CON-HI, respectively, and 0.03, 0.06 and 0.06 mmol ATP s−1 during 20–90 s of CON-LI, OCC and CON-HI, respectively.
Metabolic efficiency. Metabolic efficiency (MetE) was calculated as the ATP production (ATPp, mmol ATP) per unit of work performed (W, kJ):
Mean transit time correction. In order to obtain measurements of oxygen uptake and release of lactate at the capillary level and relate changes in blood temperatures to the time of accumulation of heat in the muscle, corrections were made for the blood transit time from the capillaries to the collection points in the femoral artery and vein. This correction has significant importance during the initial phase of exercise, where blood flow, oxygen extraction and blood temperatures increase progressively. Arterio-venous mean transit times of 11, 6 and 5 s after 5, 25 and 65 s were used for CON-LI and 5 s was used throughout CON-HI, with 1/3 of the time representing the time from artery to capillary (Bangsbo et al. 2000, 2001).
Statistics
Two way analysis of variance (ANOVA) with repeated measures was used for evaluation of changes during the exercises as well as between OCC, CON-LI and CON-HI. If a significant F value was observed then the Newman-Keuls post hoc tests were used to locate the differences. A significance level of 0.05 was chosen. Standard error of the mean (± s.e.m.) is only given in the text where this value cannot be obtained from a figure.
Results
External power output
The mean kicking frequency was 58.6 ± 0.7 (± s.e.m.), 59.4 ± 1.0 and 59.0 ± 1.2 kicks min−1, during CON-LI, OCC and CON-HI, respectively. No significant differences were recorded in kicking frequency either between CON-LI, OCC and CON-HI or during any of the exercise bouts. The mean external power output was 29.0 ± 1.2 W (range: 26.9–34.4 W) during CON-LI, which was not different from OCC (29.9 ± 1.3 W (25.9–34.4 W) (Fig. 1). No significant changes were observed in external power output between the first and last 10 s of CON-LI (29.4 ± 1.2 and 28.1 ± 1.6 W, respectively) or OCC (29.6 ± 1.1 and 28.7 ± 1.8 W, respectively; Fig. 1). During CON-HI, the mean external power was 66.8 ± 4.8 and 62.9 ± 5.5 W during the first and last 10 s, respectively, with an average value of 65.4 ± 4.6 W (43.8–77.0 W; Fig. 1).
Figure 1. External power output.
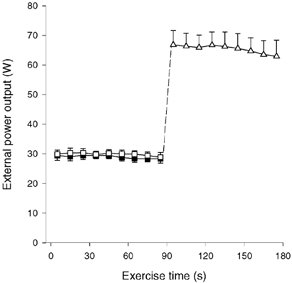
Values are shown during 90 s of low intensity knee-extensor exercise with (OCC, □) and without thigh occlusion (CON-LI, ▪) as well as 90 s of high intensity exercise preceded by low intensity exercise (CON-HI, ▵). Means ±s.e.m. are given.
Heat production
Muscle heat accumulation. The mean quadriceps temperature increased 0.32 ± 0.04 °C during OCC, which was less (P < 0.05) than during CON-LI and CON-HI (0.37 ± 0.03 and 0.48 ± 0.07 °C, respectively; Fig. 2A). The rate of heat accumulation in quadriceps was 32 and 33 J s−1 after 15 s of OCC and CON-LI, respectively, after which it remained unaltered during OCC, but increased (P < 0.05) to 44 J s−1 after 35 s of CON-LI (Fig. 2B). Thus, the quadriceps heat accumulation was lower (P < 0.05) in OCC than in CON-LI from 20–60 s of exercise (Fig. 2B). During CON-HI, quadriceps heat accumulation was 59 J s−1 after 15 s, after which it gradually declined (P < 0.05) to 38 J s−1 at the end of CON-HI (Fig. 2B).
Figure 2. Increase in quadriceps muscle temperature (A) and rate of quadriceps muscle heat accumulation (B).
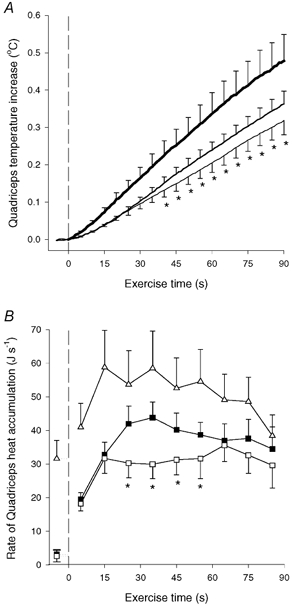
Results are shown for before and during 90 s of low intensity knee-extensor exercise with (OCC, thin line and □) and without thigh occlusion (CON-LI, normal line and ▪) as well as 90 s of high intensity exercise preceded by low intensity exercise (CON-HI, thick line and ▵). The quadriceps muscle temperature increase was determined by six intramuscular thermistors placed in the vastus lateralis (2 sites), rectus femoris (2 sites) and vastus medialis (2 sites) muscles. Means ±s.e.m. are given. *Significantly (P < 0.05) different from CON-LI.
Muscle heat release to the blood. The venous-arterial temperature difference increased (P < 0.05) from 0.00 to 0.20 °C during CON-LI and increased (P < 0.05) further to 0.32 °C at the end of CON-HI (Fig. 3A). Thigh blood flow was 1.39 l min−1 immediately prior to CON-LI and increased (P < 0.05) to 2.97 l min−1 at the end of CON-LI, increasing further (P < 0.05) to 3.94 l min−1 at the end of CON-HI (Fig. 3B). The heat release was negligible prior to CON-LI, but increased (P < 0.05) to 5 J s−1 after 20 s and reached 32 J s−1 at the end of CON-LI. During CON-HI, heat release increased to (P < 0.05) 45 J s−1 after 15 s and reached 71 J s−1 at the end of CON-HI (Fig. 3C).
Figure 3. Venous-arterial temperature difference (A), thigh blood flow (B) and rate of heat release from the thigh muscles to the blood (C).
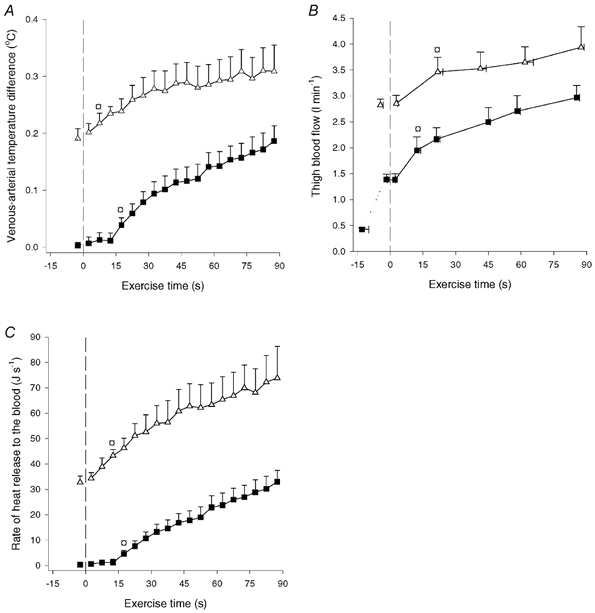
Results are shown for before and during 90 s of low intensity knee-extensor exercise (CON-LI, ▪) as well as 90 s of high intensity exercise preceded by low intensity exercise (CON-HI, ▵). Means ±s.e.m. are given. □ Significantly (P < 0.05) different from pre-exercise value.
Total muscle heat production. The rate of heat production was 46 and 51 J s−1 after 15 s of OCC and CON-LI, respectively, after which it remained unaltered during OCC, but increased (P < 0.05) to 105 J s−1 at the end of CON-LI (Fig. 4A). Thus, the rate of heat production was lower (P < 0.05) in OCC than in CON-LI from 30–90 s of exercise (Fig. 4A). During CON-HI the rate of heat production increased (P < 0.05) further to 146 J s−1 after 15 s, after which it remained constant (Fig. 4A). The total heat production was 4.3 ± 0.5 kJ in OCC, which was lower (P < 0.05) than during CON-LI and CON-HI (6.8 ± 0.7 and 13.1 ± 2.0 kJ). Thus, for the same work the heat production was 60 ± 9 % higher (P < 0.05) in CON-LI than in OCC.
Figure 4. Rate of muscle heat production (A) and mechanical efficiency (B).
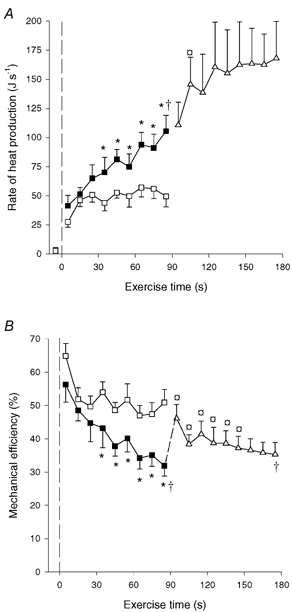
Results are shown for 90 s of low intensity knee-extensor exercise with (OCC, □) and without thigh occlusion (CON-LI, ▪) as well as 90 s of high intensity exercise preceded by low intensity exercise (CON-HI, ▵). Mechanical efficiency was estimated as work performed divided by total energy turnover. Means ±s.e.m. are given. *Significant (P < 0.05) difference between CON-LI and OCC. † Significantly different from the first 20 s of exercise. *Significantly (P < 0.05) different from pre-exercise value.
Energy turnover and mechanical efficiency
The rate of energy turnover followed the pattern of changes in heat production, since the power output was constant during OCC, CON-LI and CON-HI. Thus, the energy turnover was 94 ± 6 J s−1 after 15 s of OCC and remained unaltered, whereas it was 98 ± 5 J s−1 after 15 s of CON-LI and increased (P < 0.05) progressively to 117 ± 12 J s−1 after 35 s and 151 ± 14 J s−1 at the end of CON-LI. During CON-HI, the rate of energy turnover increased (P < 0.05) to 194 ± 23 and 228 ± 26 J s−1 after 5 and 15 s, respectively, whereupon it remained constant.
The estimated mechanical efficiency was 52 % after 15 s of OCC, after which it remained unaltered (Fig. 4B). During CON-LI, mechanical efficiency declined (P < 0.05) from 56 % during the first 10 s of exercise to 45 % after 25 s and further (P < 0.05) to 32 % at the end of CON-LI (Fig. 4B). The mechanical efficiency was higher (P < 0.05) in OCC than CON-LI from 30–90 s of exercise. In the transition from CON-LI to CON-HI, mechanical efficiency increased (P < 0.05) to 47 % after 5 s, after which it decreased (P < 0.05) to 38 % after 15 s and remained constant. The mean mechanical efficiency was higher (P < 0.05) in OCC than in CON-LI and CON-HI (50.2 ± 2.7 vs. 38.9 ± 2.9 and 37.6 ± 3.4 %, respectively).
Aerobic energy turnover
Thigh oxygen uptake. Femoral oxygen extraction (a-vdiff O2) was 19 ± 2 ml l−1 prior to CON-LI, increased (P < 0.05) to 64 ± 8 ml l−1 after 15 s and reached 131 ± 7 ml l−1 at the end of CON-LI. During CON-HI, a-vdiff O2 increased (P < 0.05) to 138 ± 5 ml l−1 after 26 s and further (P < 0.05) to 153 ± 2 ml l−1 at the end of CON-HI. Immediately prior to CON-LI, thigh oxygen uptake was 0.03 l min−1 and it increased (P < 0.05) to 0.12 l min−1 after 15 s reaching 0.37 l min−1 at the end of CON-LI (Fig. 5A). During CON-HI, thigh oxygen uptake increased (P < 0.05) to 0.43 l min−1 after 15 s and reached 0.54 l min−1 at the end of CON-HI (Fig. 5A). The total thigh oxygen uptake was 0.39 ± 0.03 and 0.71 ± 0.04 l during CON-LI and CON-HI, respectively.
Figure 5. Thigh oxygen uptake (A) and thigh lactate release (B).
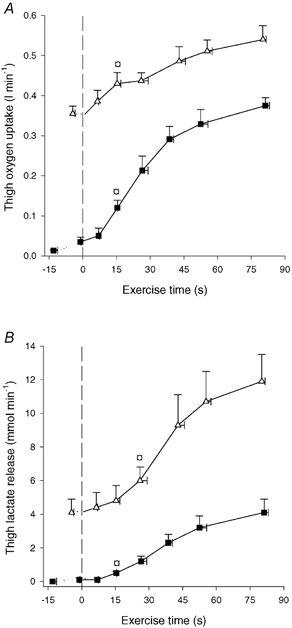
Results are shown for before and during 90 s of low intensity knee-extensor exercise (CON-LI, ▪) as well as 90 s of high intensity exercise preceded by low intensity exercise (CON-HI, ▵). Means ±s.e.m. are given. □ Significantly (P < 0.05) different from pre-exercise value.
Aerobic ATP production. The estimated aerobic ATP turnover was 88 ± 7 and 159 ± 8 mmol ATP in CON-LI and CON-HI, respectively, whereas it was 8 mmol ATP in OCC (see Methods). The rate of aerobic ATP turnover increased (P < 0.05) from 0.43 ± 0.06 to 1.14 ± 0.09 mmol s−1 in the first 20 to the next 70 s of CON-LI, after which it increased (P < 0.05) to 1.50 ± 0.26 and 1.85 ± 0.10 mmol s−1, respectively, during CON-HI (Fig. 6A). The fraction of aerobic ATP production was estimated to be 9 % in OCC, whereas it accounted for 80 ± 2 and 59 ± 4 % in CON-LI and CON-HI, respectively (Fig. 6B). The relative fraction of aerobic energy yield increased (P < 0.05) from 51 ± 9 % in the first 20 s to 87 ± 2 % in the next 70 s of CON-LI, after which it decreased (P < 0.05) to 53 ± 6 and 64 ± 5 %, respectively, during CON-HI (Fig. 6B).
Figure 6. Rate of ATP production (A), relative contribution of the various energetic pathways (B) and ATP production per unit of work (C).
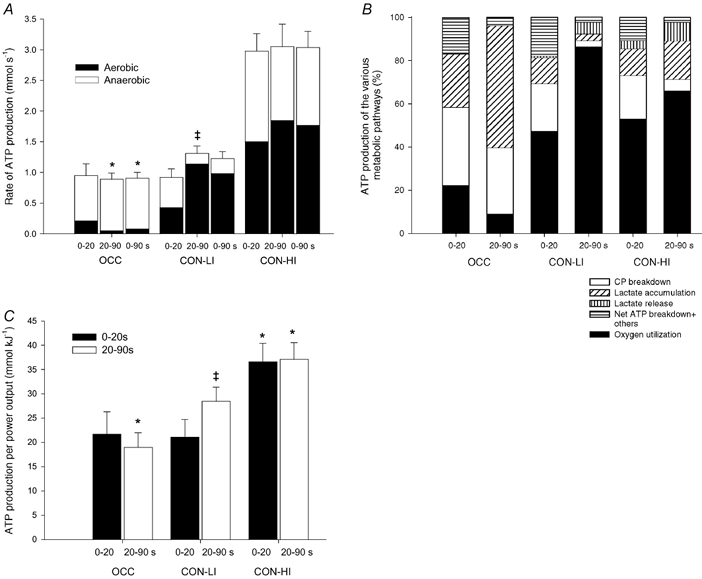
Results are shown from 0–20, 20–90 s and during the entire period of 90 s of low intensity knee-extensor exercise with (OCC) and without thigh occlusion (CON-LI) as well as 90 s of high intensity exercise preceded by low intensity exercise (CON-HI). Means ±s.e.m. are given. *Significantly (P < 0.05) different from CON-LI. †Significant difference between the first 20 and next 70 s of exercise.
Anaerobic energy turnover
Lactate release. No net lactate release from the thigh was observed before CON-LI, but it increased (P < 0.05) to 0.5 mmol min−1 after 15 s and reached 4.1 mmol min−1 at the end of CON-LI (Fig. 5B). During CON-HI, net lactate release increased (P < 0.05) to 6.0 mmol min−1 after 26 s and further (P < 0.05) to 11.9 mmol min−1 at the end of CON-HI (Fig. 5B).
Metabolite changes. Muscle metabolite concentrations and changes during OCC, CON-LI and CON-HI are presented in Table 1. Briefly, muscle ATP decreased (P < 0.05) by 5 and 12 % after 20 and 90 s of OCC, respectively, and 9 and 20 %, respectively, during CON-HI, whereas it was unaltered after CON-LI (Table 1). The rate of net ATP degradation was higher (P < 0.05) during the last 70 s of OCC and CON-HI than CON-LI.
Muscle creatine phosphate (CP) decreased (P < 0.05) by 14 and 55 % after 20 and 90 s of OCC, respectively, and 8 and 14 % during CON-LI. During CON-HI, muscle CP decreased further (P < 0.05) to 30 % of resting value (Table 1). The rate of CP degradation was similar during the first 20 and next 70 s of OCC (0.31 ± 0.09 and 0.26 ± 0.03 mmol s−1), whereas it decreased (P < 0.05) during CON-LI and CON-HI (0.19 ± 0.05 vs. 0.04 ± 0.03 and 0.67 ± 0.11 vs. 0.19 ± 0.07 mmol s−1, respectively). Thus, the rate of CP degradation was higher (P < 0.05) in the last 70 s of OCC than CON-LI and throughout CON-HI compared to CON-LI.
Muscle lactate increased (P < 0.05) 2.5-fold during CON-LI, whereas it increased (P < 0.05) 2- and 11-fold after 20 and 90 s of OCC. During CON-HI, muscle lactate increased further (P < 0.05) to a value 14-fold higher than at rest. The rate of muscle lactate accumulation was higher (P < 0.05) in OCC than CON-LI during the last 70 s of exercise and throughout CON-HI compared to CON-LI (Table 1). Total lactate production, calculated as the sum of muscle lactate accumulation and thigh lactate release, was 7.6 ± 2.2 mmol in CON-LI, which was lower than in OCC (25.8 ± 3.4 mmol) and CON-HI (47.1 ± 10.2 mmol). The rate of lactate production, was not significantly different in the first 20 and next 70 s of CON-LI (0.09 ± 0.02 vs. 0.08 ± 0.06 mmol s−1), OCC (0.16 ± 0.07 vs. 0.32 ± 0.05 mmol s−1) or CON-HI (0.30 ± 0.13 vs. 0.59 ± 0.15 mmol s−1), but it was higher (P < 0.05) in the last 70 s of OCC and throughout CON-HI compared to CON-LI.
Anaerobic ATP production. The total anaerobic ATP production, including others (see Methods), was 23 ± 3 mmol ATP during CON-LI, which was lower than during OCC and CON-HI (75 ± 8 and 115 ± 19 mmol ATP, respectively). The rate of anaerobic ATP production was unaltered in the first 20 and next 70 s of OCC (0.73 ± 0.19 and 0.84 ± 0.10 mmol s−1) and CON-HI (1.48 ± 0.31 and 1.20 ± 0.32 mmol s−1), whereas it decreased (P < 0.05) during CON-LI (0.49 ± 0.13 vs. 0.18 ± 0.04 mmol s−1) (Fig. 6A). Thus, the rate of anaerobic ATP production was higher (P < 0.05) in the last 70 s of OCC than CON-LI as well as throughout CON-HI compared to CON-LI (Fig. 6A).
Total ATP turnover
The total ATP production, the sum of aerobic and anaerobic energy production, was 82 ± 8 mmol ATP in OCC, which was lower (P < 0.05) than during CON-LI (111 ± 10 mmol ATP). During CON-HI, the total ATP production was 274 ± 24 mmol ATP. When comparing the first 20 and last 70 s of exercise, the rate of ATP turnover increased (P < 0.05) from 0.92 ± 0.14 to 1.31 ± 0.12 mmol s−1 during CON-LI, whereas it was unaltered during OCC (0.95 ± 0.19 and 0.89 ± 0.10 mmol s−1) and CON-HI (2.98 ± 0.28 and 3.05 ± 0.37 mmol s−1, Fig. 6A). Thus, the rate of ATP production was lower (P < 0.05) in the last 70 s of OCC and during CON-HI compared to CON-LI (Fig. 6A).
ATP turnover per unit of work performed
The ATP turnover (mmol) per total work performed (kJ) was unaltered during OCC (≈20 mmol kJ−1), whereas it increased (P < 0.05) from 21 ± 4 to 29 ± 3 mmol kJ−1 from the first 20 s to the next during 70 s of CON-LI (Fig. 6C). Thus, the ATP turnover per unit of work performed was higher (P < 0.05) during the last 70 s of CON-LI compared to OCC. During CON-HI, the ATP turnover per unit of work increased (P < 0.05) further to 36 ± 4 and 37 ± 3 mmol kJ−1 in the first 20 and next 70 s, respectively (Fig. 6C). When comparing the entire work bouts, the ATP turnover per work unit was 27 ± 3 mmol kJ−1 during CON-LI, which was higher (P < 0.05) than during OCC (19 ± 2 mmol kJ−1), but lower than during CON-HI (37 ± 3 mmol kJ−1).
Discussion
The present data support the hypothesis that mechanical efficiency is higher when the majority of energy is provided from anaerobic sources than when predominantly provided from aerobic sources. This finding is in accordance with in vitro findings of lower heat loss in anaerobic ATP resynthesis than in oxidative phosphorylation. It was also demonstrated that the ATP cost per work unit increases during low intensity exercise with free flow conditions and even further when followed by high intensity exercise.
Muscle heat production in relation to aerobic metabolism
In the present study, muscle heat production was examined during dynamic exercise with large differences in the aerobic contribution to the total energy turnover. This was done by performing two identical work bouts with and without thigh occlusion. In the free flow condition with most of the energy derived from aerobic ATP resynthesis, muscle heat production was ≈60 % higher than with occlusion, the heat production increased more than two-fold during constant load low intensity exercise in association with an increased oxidative phosphorylation, whereas it was unaltered during exercise with occlusion. Furthermore, it was shown that when low intensity exercise was followed by high intensity exercise, the heat production per unit of power output was transiently lowered in relation to an increased anaerobic metabolism. These findings are all in agreement with the hypothesis that anaerobic ATP resynthesis has a lower heat loss than oxidative phosphorylation in humans during dynamic exercise.
An additional piece of information supporting the hypothesis was obtained in the present study, since in five subjects muscle and blood temperatures were also measured during a high intensity exercise bout performed without previous low intensity exercise. The kicking frequency and exercise intensity were similar to the above-mentioned high intensity exercise. When comparing the exercise with and without previous low intensity exercise, the increases in quadriceps temperature as well as venous-arterial temperature differences were significantly lower during the first 40 and 30 s, respectively, of the high intensity exercise performed without previous low intensity exercise (Fig. 7). Thigh blood flow was not measured during this exercise but, based on findings in similar studies, it can be estimated that it takes 30–45 s before the blood flow values are equal in the two situations (Krustrup et al. 2001). Thus, it appears that muscle heat production is low in the transition from rest to high intensity exercise, after which it gradually approaches values from high intensity exercise with pre-elevated oxygen uptake. This is an observation that provides further evidence that the heat loss is lower in anaerobic than aerobic ATP resynthesis.
Figure 7. Quadriceps muscle temperature increase (A) and venous-arterial temperature difference (B).
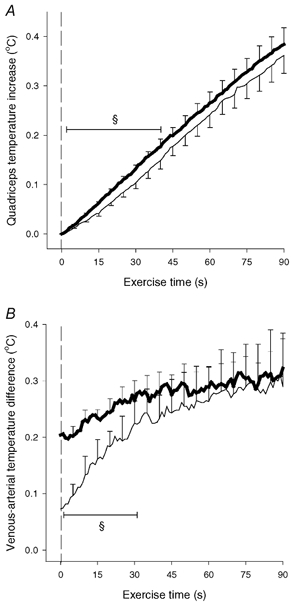
Results are shown during 90 s of high intensity exercise performed either directly from resting condition (CON-HI-D; thin line) or preceded by low intensity exercise (CON-HI, thick line). Means ±s.e.m. are given (n = 5). § Significant (P < 0.05) difference between CON-HI-D and CON-HI.
In vivo calculations of molar enthalpy
The molar enthalpy of the various metabolic pathways has been studied extensively in vitro by measurements on controlled chemical reactions in muscle extracts as well as determination of heat production in relation to metabolite changes of electrically stimulated animal muscles (see review, Curtin & Woledge, 1978). These studies have revealed that the heat liberation per mole of ATP resynthesized is low for net creatine breakdown (31–55 kJ mol−1), high for oxidative phosphorylation (73–95 kJ mol−1) and intermediate for glycolysis (65–78 kJ mol−1; Hill & Woledge, 1962, Walsh & Woledge, 1970, Curtin & Woledge, 1978; Hinkle & Yu, 1979). However, only a few studies have compared in vivo heat and ATP production in exercising humans. In the classic study by Edwards et al. (1975), simultaneous measurement of muscle metabolite changes and heat production was performed in humans during sustained isometric contractions. From those measurements it was concluded that the observed heat production per mole of ATP produced matched well with the in vitro-derived molar enthalpies for the individual anaerobic energy pathways. Since blood flow was obstructed during the isometric contractions in the latter study, no comparison could be made between heat release from aerobic and anaerobic energy sources.
In the present study, measurements of ATP and heat production were performed repeatedly during dynamic exercise both with high and obstructed blood flows. From the energy balance calculations presented in Table 2, it can be seen that the observed energy output from measurements of heat and power output matches well with the energy turnover estimated from the observed chemical reactions. This observation provides a basis for the direct comparison between in vivo enthalpies of ATP resynthesis for work bouts and various phases of exercise with large differences in anaerobic and aerobic metabolism. In the last phase of the occluded exercise the oxidation was negligible, which allows a calculation of the heat loss in anaerobic ATP resynthesis. In this exercise period, where net CP breakdown provided one-third and glycolysis two-thirds of the ATP resynthesis, the total energy production was 66 kJ (mol ATP)−1 produced. Thus, if assuming a ΔG value of ATP splitting of around 52 kJ (mol ATP)−1 (Woledge et al. 1985), it can be roughly calculated that heat loss in the process of ATP resynthesis only accounts for around 20 % of the energy turnover. Although it is not possible to separate between molar enthalpy values from CP breakdown and glycolysis is seems as if the total heat losses during this dynamic exercise match well with the above-mentioned in vitro values. An estimation of the heat loss in ATP resynthesis can also be made for the high intensity exercise bout. Thus, the energy turnover related to anaerobic metabolism can be calculated as the difference between the total energy turnover and the aerobic energy turnover (Fig. 8). The anaerobic energy production was estimated to be about 6 kJ during the 90 s high intensity exercise bout, corresponding to a molar enthalpy of the anaerobic ATP resynthesis of ≈55 kJ (mol ATP)−1. The observation that heat loss is small in anaerobic metabolism is also supported by the fact that the heat production was low both at the onset of low intensity exercise with and without occlusion as well as in the transition from rest to high intensity exercise. Thus, in the initial phase of these exercises, mechanical efficiency was as high as 50–60 %, which is only slightly lower than the highest possible efficiency of contraction (Wilkie, 1968).
Table 2.
Energy balance calculation
| CON-LI | OCC | CON-HI | |
|---|---|---|---|
| Energy turnover - observed enthalpy output | |||
| Heat accumulation in quadriceps muscle (kj) | 3.1 ± 0.3 | 2.7 ± 0.4 | 4.6 ± 0.7 |
| Heat accumulation in hamstrings (kj) | 1.9 ± 0.3 | 1.4 ± 0.3 | 2.6 ± 1.0 |
| Heat release to the blood (kj) | 1.5 ± 0.3 | — | 5.2 ± 0.6 |
| Additional heat transfer (kj) | 0.3 | 0.2 | 0.7 |
| Total observed heat production (kj) | 6.8 ± 0.7 | 4.3 ± 0.5 | 13.1 ± 2.6 |
| External power output (kj) | 2.6 ± 0.1 | 2.7 ± 0.1 | 5.8 ± 0.5 |
| Internal power output (kj) | 1.5 | 1.5 | 1.5 |
| Total (kj) | 10.9 ± 0.7 | 8.5 ± 0.5 | 20.3 ± 2.9 |
| Energy turnover - observed chemical processes | |||
| Aerobic energy production in the thigh (kj) | 8.7 ± 0.7 | 0.7 ± 0.1 | 15.8 ± 0.8 |
| CP breakdown in quadriceps muscle (kj) | 0.4 ± 0.1 | 1.3 ± 0.2 | 1.5 ± 0.2 |
| Lactate accumulation in quadriceps muscle (kj) | 0.4 ± 0.2 | 2.6 ± 0.4 | 3.5 ± 1.1 |
| Lactate release in quadriceps muscle (kj) | 0.3 ± 0.1 | — | 1.3 ± 0.2 |
| Net ATP breakdown and others in quadriceps muscle (kj) | 0.2 | 0.7 | 0.7 |
| Anaerobic energy output in hamstrings (kj)* | — | 2.4 ± 0.4 | — |
| Total (kj) | 10.1 ± 0.8 | 7.8 ± 0.9 | 22.8 ± 2.3 |
| Ratio between chemical and thermal energy turnover | 0.93 | 0.92 | 1.12 |
Observed energy turnover (calculated as the sum of heat accumulation in active muscles and inactive muscles, heat release to the blood, heat transfer to other inactive tissue, external power output and internal power output; see Methods) and energy turnover in observed chemical processes (calculated as the sum of aerobic energy production and CP breakdown, lactate production as well as net ATP utilization and others, see Methods) during 90 s of low intensity knee-extensor exercise with (OCC) and without thigh occlusion (CON-LI) as well as 90 s of high intensity exercise preceded by low intensity exercise (CON-HI). Enthalpy values of 55 and 67 kj (mol ATP synthesized)−1 were used for CP breakdown and lactate production, respectively. An anaerobic energy component from active hamstring involvement has been added in OCC
estimated from the ratio between heat accumulation in quadriceps and hamstrings. In CON-LI and CON-HI no such value was added, since the majority of heat accumulation in hamstrings was caused by heat transfer from the blood. In addition, an energy component from active hamstrings involvement, if any, is accounted for by determination of oxygen uptake from the whole thigh. A value of 20.7 and 21.2 kj (1 O2)−1 was used to convert oxygen utilization to aerobic energy turnover in CON-LI and CON-HI, respectively, assuming a V̇co2/V̇o2 ratio of 0.9 and 1.0, respectively. Means ±s.e.m. are given.
Figure 8. Rate of total, aerobic and estimated anaerobic energy turnover.
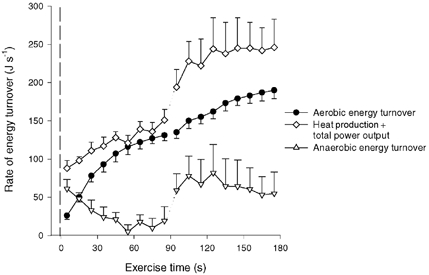
Rates are shown during 90 s of low intensity exercise (CON-LI) immediately followed by 90 s of high intensity exercise (CON-HI). Anaerobic energy turnover was estimated as the difference between observed total and observed aerobic energy turnover.
The present study also showed that the heat loss in aerobic metabolism is high. Thus, in the first 20 s of low intensity exercise where oxidation could account for about 50 % of the ATP production, the total energy turnover was estimated to be 93 kJ mol−1. This means that almost half of the energy turnover was related to heat loss in ATP resynthesis. In the following 70 s of low intensity exercise, if assuming that the ATP turnover was equal for the same amount of work performed with and without thigh occlusion, the total energy turnover was estimated to be as high as 140 kJ mol−1. Thus, in this last phase of exercise in which oxidation accounted for almost 90 % of the ATP resynthesis, the heat loss was further elevated to be ≈65 % of the total energy turnover. This indicates that the heat loss of oxidative phosphorylation is as high or even higher in dynamically contracting human skeletal muscles compared to in vitro values.
Metabolic energy turnover and muscle ATP resynthesis
Although certainly an important component, the difference in heat loss from aerobic and anaerobic ATP production might not entirely explain the changes in energy production during low intensity exercise and the difference in efficiency between occluded and free flow exercise. In a recent study from our laboratory similar metabolic measurements were performed during constant load high intensity exercise (Bangsbo et al. 2001), showing that estimated ATP turnover per unit of power output increased by about 55 % from the first 15 s to the remaining 165 s of exercise. Thus, an additional explanation of a lowered efficiency also during low intensity exercise could be a change in the metabolic energy cost of muscular contractions. When converting values of oxygen uptake in the present study to ATP produced using a well-established mitochondrial P/O ratio of 2.5 mol ATP (mol O2)−1 (Hinkle & Yu, 1979), the total ATP turnover per power output was shown to increase by 35 % from the first 20 to the next 70 s of low intensity exercise (21 to 29 mmol ATP kJ−1). This was even more in the transition to high intensity exercise (36 mmol ATP kJ−1). Thus, as low intensity exercise progresses the oxygen uptake and the related ATP resynthesis rises more than the decrease in anaerobic ATP turnover. These findings may be explained by an increased ATP cost in both muscle activation and contraction as exercise progresses (Barclay et al. 1993; Barclay, 1996). However, the metabolic energy turnover and calculated ATP resynthesis was 40 % higher during low intensity exercise without occlusion compared with an occluded state (27 vs. 19 mmol ATP kJ−1) suggesting that mitochondrial efficiency (i.e. mitochondrial P/O ratio) is lowered during exercise. Another possibility is that the P/O ratio is much lower than expected even from the onset of exercise, but this seems unlikely as the observed efficiency determined by measurements of heat production was very high at the onset of exercise.
Possible causes of an increased metabolic energy cost
A number of factors have been suggested to affect the mitochondrial function as well as the ATP turnover per power output during dynamic exercise, such as lowered pH, elevated temperature and free phosphate as well as Ca2+ handling and changes in fibre type recruitment. In several human studies an observed slow component drift in oxygen uptake at high, but not low, intensities has been proposed to be related to accumulated muscle lactate and the associated acidosis (Whipp & Wasserman, 1972; Gaesser & Poole, 1996). In the present study, muscle pH decreased from resting levels of ≈7.0 to 6.66 at the end of the high intensity exercise in relation to an increased metabolic energy turnover per unit of power output. On the other hand, metabolic energy turnover also increased during the low intensity exercise bout without a decrease in muscle pH. Furthermore, energy metabolism was unaltered during the ischaemic exercise although muscle pH decreased markedly (7.01 to 6.79). Thus, as a number of in vitro studies have shown that pH does not have a direct effect on mitochondrial coupling and function (Mitchelson & Hird, 1973; Hinkle & Yu, 1979), these data suggest that muscle pH plays a minor role in alterations of energy turnover during exercise. This is in agreement with the observation that efficiency was unaltered during knee-extensor exercise when muscle pH was lowered by prior arm exercise (Bangsbo et al. 1996). Also an increased muscle temperature has been suggested to influence the energy cost of contractions (Brooks et al. 1971; Willis & Jackman, 1994). Thus, by increasing the ambient temperature from 37 to 40 °C, Willis & Jackman (1994) observed a 10 % decrease in mitochondrial P/O ratio. Recent human studies have also shown an increased metabolic energy turnover during intense cycle exercise when the muscle temperature was passively elevated by 3–4 °C (Ferguson et al. 2002), however the effects were rather small (≈5 %). In the present study, in which muscle temperature increased by less than 0.5 °C during each of the exercise bouts, the effect of muscle temperature was probably minor.
Another factor that may alter the energy turnover during exercise is the calcium handling of the mitochondria, which may itself increase the oxygen utilization in the muscle cell (Halestrap et al. 1993). As the Ca2+ concentration increases in the muscle cell during exercise, Ca2+ is taken up by the mitochondria and, among other effects, this has been suggested to cause an opening of the permeability transition pore (PTP), which uncouples respiration (Petronilli et al. 1999). However, it is still unknown to what extent the respiration is uncoupled at physiological Ca2+ concentrations and how exercise intensity affects the mitochondrial Ca2+ flux.
Additional fibre recruitment and change in the active fibre types have also been suggested to alter energy turnover during muscle contraction. In vitro studies have shown that the energy cost of contractions at low speed is higher in type II than type I fibres and that this relationship is opposite at high contraction velocity (Crow & Kushmerick, 1982; Di Prampero et al. 1988; He et al. 2000). In the present study the contraction speed could be calculated to be 135 deg s−1 or ≈20 % of the maximal unloaded contraction velocity (Aagaard et al. 1994), which means that this type of exercise could potentially be more energy demanding for type II fibres. The exercise intensities chosen in the present study were about 20 W (kg active muscle)−1 in the low intensity exercise bout with and without occlusion and 35 W (kg active muscle)−1 in the high intensity bout, which corresponds to about 12 and 21 %, respectively, of peak power at this specific contraction velocity (Aagaard et al. 1994). The present study and a comparison with data from Bangsbo et al. (2001), reveals that the ATP cost per unit of power output is higher during high intensity exercise than low intensity knee-extensor exercise. This observation of differences in energy turnover between exercise intensities could be due to a difference in recruitment pattern, as glycogen depletion measurements have revealed that type II recruitment increases with increasing exercise intensity (Gollnick et al. 1974). In accordance with this, a recent study from our laboratory has shown that a much larger fraction of type II fibres were active at exercise intensities of 40 W kg−1 compared to 20 W kg−1, when using CP content as an indicator of recruitment of individual type I and type II muscle fibres (P. Krustrup, K. Söderlund, M. Mohr & J. Bangsbo, unpublished observations). From the present study it seems that if such a difference exists between fibre types, it has to be related to the mitochondrial efficiency. Thus, no change in the ATP cost of contraction was observed during the occluded exercise bout, although additional type II fibres must have been recruited, since this exercise continued almost to exhaustion. The notion that differences between fibre types are attributed to differences in mitochondrial efficiency is supported by the observation that the overall ADP/O-coupling is 18 % lower for type IIb than type I muscles from rats, due to the fact that type IIb fibres possess a 10-fold higher activity of the FAD-linked α-glycerophosphate oxidase (Willis & Jackman, 1994). Furthermore, a recent human study has found a positive relationship between the fraction of type II fibres and the amount of uncoupling protein 3 (UCP-3) in human skeletal muscle (Hesselink et al. 2001), which has been suggested to lower P/O ratio during exercise by proton leakage across the inner mitochondrial membrane. Altogether, it may be suggested that a change in fibre type recruitment towards more type II fibres, could increase the metabolic energy cost of contractions in free flow conditions. However, further studies are needed to clarify if such a relationship exists.
Summary
The present study has demonstrated that heat loss is higher for aerobic compared to anaerobic ATP resynthesis during dynamic exercise in humans. This is in accordance with in vitro measurements and may partly explain the observation of an increase in heat production during constant load exercise at both low and high intensities. The present data also reveal that the metabolic energy requirements are elevated during low intensity exercise.
Acknowledgments
We thank Merete Vannby, Ingelise Kring and Winnie Tagerup for excellent technical assistance. The study was supported by a grant from The Danish National Research Foundation (504–14). In addition, support was obtained from Team Danmark and The Sports Research Council (Idrættens Forskningsråd).
References
- Aagaard P, Simonsen EB, Trolle M, Bangsbo J, Klausen K. Moment and power generation during maximal knee extension performed at low and high speeds. Eur J Appl Physiol Occup Physiol. 1994;69:376–381. doi: 10.1007/BF00865398. [DOI] [PubMed] [Google Scholar]
- Andersen P, Adams RP, Sjøgaard G, Thorboe A, Saltin B. Dynamic knee extension as a model for the study of an isolated exercising muscle in man. J Appl Physiol. 1985;59:1647–1653. doi: 10.1152/jappl.1985.59.5.1647. [DOI] [PubMed] [Google Scholar]
- Andersen P, Saltin B. Maximal perfusion of skeletal muscle in man. J Physiol. 1985;366:233–249. doi: 10.1113/jphysiol.1985.sp015794. [DOI] [PMC free article] [PubMed] [Google Scholar]
- Bangsbo J. Quantification of anaerobic energy production during intense exercise. Med Sci Sports Exerc. 1998;30:47–52. doi: 10.1097/00005768-199801000-00007. [DOI] [PubMed] [Google Scholar]
- Bangsbo J, Graham TE, Kiens B, Saltin B. Elevated muscle glycogen and anaerobic energy production during exhaustive exercise in man. J Physiol. 1992;451:205–227. doi: 10.1113/jphysiol.1992.sp019161. [DOI] [PMC free article] [PubMed] [Google Scholar]
- Bangsbo J, Krustrup P, González-Alonso J, Saltin B. Muscle oxygen kinetics at onset of intense dynamic exercise in humans. Am J Physiol Regul Integr Comp Physiol. 2000;279:R899–906. doi: 10.1152/ajpregu.2000.279.3.R899. [DOI] [PubMed] [Google Scholar]
- Bangsbo J, Krustrup P, González-Alonso J, Saltin B. ATP production and efficiency of human skeletal muscle during intense exercise; effect of previous exercise. Am J Physiol Endocrinol Metab. 2001;280:E956–964. doi: 10.1152/ajpendo.2001.280.6.E956. [DOI] [PubMed] [Google Scholar]
- Bangsbo J, Madsen K, Kiens B, Richter EA. Effect of muscle acidity on muscle metabolism and fatigue during intense exercise in man. J Physiol. 1996;495:587–596. doi: 10.1113/jphysiol.1996.sp021618. [DOI] [PMC free article] [PubMed] [Google Scholar]
- Barclay CJ. Mechanical efficiency and fatigue of fast and slow muscles of mouse. J Physiol. 1996;497:781–794. doi: 10.1113/jphysiol.1996.sp021809. [DOI] [PMC free article] [PubMed] [Google Scholar]
- Barclay CJ, Curtin NA, Woledge RC. Changes in crossbridge and non-crossbridge energetics during moderate fatigue of frog muscle fibres. J Physiol. 1993;468:543–555. doi: 10.1113/jphysiol.1993.sp019787. [DOI] [PMC free article] [PubMed] [Google Scholar]
- Bergström J. Muscle electrolytes in man. Scand J Clin Lab Invest. 1962;68(suppl.):1–101. [Google Scholar]
- Brooks GA, Hittelman KJ, Faulkner JA, Beyer RE. Temperature, skeletal muscle mitochondrial function, and oxygen debt. Am J Physiol. 1971;220:1053–1059. doi: 10.1152/ajplegacy.1971.220.4.1053. [DOI] [PubMed] [Google Scholar]
- Cooke R, Franks K, Luciani GB, Pate E. The inhibition of rabbit skeletal muscle contraction by hydrogen ions and phosphate. J Physiol. 1988;395:77–97. doi: 10.1113/jphysiol.1988.sp016909. [DOI] [PMC free article] [PubMed] [Google Scholar]
- Crow MT, Kushmerick MJ. Chemical energetics of slow- and fast-twitch muscles of the mouse. J Gen Physiol. 1982;79:147–166. doi: 10.1085/jgp.79.1.147. [DOI] [PMC free article] [PubMed] [Google Scholar]
- Curtin NA, Kometani K, Woledge RC. Effect of intracellular pH on force and heat production in isometric contraction of frog muscle fibres. J Physiol. 1988;396:93–104. doi: 10.1113/jphysiol.1988.sp016952. [DOI] [PMC free article] [PubMed] [Google Scholar]
- Curtin NA, Woledge RC. Energy changes and muscular contraction. Physiol Rev. 1978;58:690–761. doi: 10.1152/physrev.1978.58.3.690. [DOI] [PubMed] [Google Scholar]
- Di Prampero PE, Boutellier U, Marguerat A. Efficiency of work performance and contraction velocity in isotonic tetani of frog sartorius. Pflugers Arch. 1988;412:455–461. doi: 10.1007/BF00582533. [DOI] [PubMed] [Google Scholar]
- Drabkin DL, Austin JH. Spectrophometric studies II. Preparations from washed blood cells, nitric oxide hemoglobin and sulhemoglobin. J Biol Chem. 1935;122:51–56. [Google Scholar]
- Edwards RH, Hill DK, Jones DA. Heat production and chemical changes during isometric contractions of the human quadriceps muscle. J Physiol. 1975;251:303–315. doi: 10.1113/jphysiol.1975.sp011094. [DOI] [PMC free article] [PubMed] [Google Scholar]
- Ferguson RA, Ball D, Sargeant AJ. Effect of muscle temperature on rate of oxygen uptake during exercise in humans at different contraction frequencies. J Exp Biol. 2002;205:981–987. doi: 10.1242/jeb.205.7.981. [DOI] [PubMed] [Google Scholar]
- Ferguson RA, Aagaard P, Ball D, Sargeant AJ, Bangsbo J. Total power output generated during dynamic knee extensor exercise at different contraction frequencies. J Appl Physiol. 2000;89:1912–1918. doi: 10.1152/jappl.2000.89.5.1912. [DOI] [PubMed] [Google Scholar]
- Foxdal P, Bergqvist Y, Eckerbom S, Sandhagen B. Improving lactate analysis with the YSI 2300 GL: hemolyzing blood samples makes results comparable with those for deproteinized whole blood. Clin Chem. 1992;38:2110–2114. [PubMed] [Google Scholar]
- Gaesser GA, Poole DC. The slow component of oxygen uptake kinetics in humans. Exerc Sport Sci Rev. 1996;24:35–71. [PubMed] [Google Scholar]
- Gollnick PD, Piehl K, Saltin B. Selective glycogen depletion pattern in human muscle fibres after exercise at varying intensity and at varying pedalling rates. J Physiol. 1974;241:45–57. doi: 10.1113/jphysiol.1974.sp010639. [DOI] [PMC free article] [PubMed] [Google Scholar]
- González-Alonso J, Quistorff B, Krustrup P, Bangsbo J, Saltin B. Heat production in human skeletal muscle at the onset of intense dynamic exercise. J Physiol. 2000;524:603–615. doi: 10.1111/j.1469-7793.2000.00603.x. [DOI] [PMC free article] [PubMed] [Google Scholar]
- Halestrap AP, Griffiths EJ, Connern CP. Mitochondrial calcium handling and oxidative stress. Biochem Soc Trans. 1993;21:353–358. doi: 10.1042/bst0210353. [DOI] [PubMed] [Google Scholar]
- Harris RC, Hultman E, Kaijser L, Nordesjö L-O. The effect of circulatory occlusion on isometric exercise capacity and energy metabolism of the quadriceps muscle in man. Scand Journal Clin Lab Invest. 1975;35:87–95. [PubMed] [Google Scholar]
- He Z-H, Bottinelli R, Pellegrino MA, Ferenczi MA, Reggiani C. ATP consumption and efficiency of human single muscle fibers with different myosin isoform composition. Biophys J. 2000;79:945–961. doi: 10.1016/S0006-3495(00)76349-1. [DOI] [PMC free article] [PubMed] [Google Scholar]
- Hellsten Y, Richter EA, Kiens B, Bangsbo J. AMP deamination and purine exchange in human skeletal muscle during and after intense exercise. J Physiol. 1999;529:909–920. doi: 10.1111/j.1469-7793.1999.00909.x. [DOI] [PMC free article] [PubMed] [Google Scholar]
- Hesselink MK, Keizer HA, Borghouts LB, Schaart G, Kornips CF, Slieker LJ, Sloop KW, Saris WH, Schrauwen P. Protein expression of UCP3 differs between human type 1, type 2a, and type 2b fibers. FASEB J. 2001;15:1071–1073. [PubMed] [Google Scholar]
- Hill AV, Woledge RC. An examination of absolute values in myothermic measurements. J Physiol. 1962;162:311–333. doi: 10.1113/jphysiol.1962.sp006935. [DOI] [PMC free article] [PubMed] [Google Scholar]
- Hinkle PC, Kumar MA, Resetar A, Harris DL. Mechanistic stoichiometry of mitochondrial oxidative phosphorylation. Biochemistry. 1991;30:3576–3582. doi: 10.1021/bi00228a031. [DOI] [PubMed] [Google Scholar]
- Hinkle PC, Yu ML. The phosphorous/oxygen ratio of mitochondrial oxidative phosphorylation. J Biol Chem. 1979;254:2450–2455. [PubMed] [Google Scholar]
- Jones PRM, Pearson J. Anthropometric determination of leg fat and muscle plus bone volumes in young male and female adults. J Physiol. 1969;204:36. P. [PubMed] [Google Scholar]
- Katz A, Broberg S, Sahlin K, Wahren J. Muscle ammonia and amino acid metabolism. Clin Physiol. 1986;6:365–379. doi: 10.1111/j.1475-097x.1986.tb00242.x. [DOI] [PubMed] [Google Scholar]
- Kiens B, Essén-Gustavsson B, Christensen NJ, Saltin B. Skeletal muscle substrate utilization during submaximal exercise in man: effect of endurance training. J Physiol. 1993;469:459–478. doi: 10.1113/jphysiol.1993.sp019823. [DOI] [PMC free article] [PubMed] [Google Scholar]
- Krustrup P, González-Alonso J, Quistorff B, Bangsbo J. Muscle heat production and anaerobic energy production during repeated intense dynamic exercise in man. J Physiol. 2001;536:947–956. doi: 10.1111/j.1469-7793.2001.00947.x. [DOI] [PMC free article] [PubMed] [Google Scholar]
- Lowry OH, Passonneau JV. A Flexible System of Enzymatic Analysis. New York: Academic Press; 1972. [Google Scholar]
- Mitchelson KR, Hird FJ. Effect of pH and halothane on muscle and liver mitochondria. Am J Physiol. 1973;225:1393–1398. doi: 10.1152/ajplegacy.1973.225.6.1393. [DOI] [PubMed] [Google Scholar]
- Parkhouse WS, McKenzie DC, Hochachka PW, Owalle WK. Buffering capacity of deproteinized human vastus lateralis muscle. J Appl Physiol. 1985;58:14–17. doi: 10.1152/jappl.1985.58.1.14. [DOI] [PubMed] [Google Scholar]
- Petronilli V, Miotto G, Canton M, Brini M, Colonna R, Bernardi P, Di Lisa F. Transient and long-lasting openings of the mitochondrial permeability transition pore can be monitored directly in intact cells by changes in mitochondrial calcein fluorescence. Biophys J. 1999;76:725–734. doi: 10.1016/S0006-3495(99)77239-5. [DOI] [PMC free article] [PubMed] [Google Scholar]
- Richardson RS, Noyszewski EA, Kendrick KF, Leigh JS, Wagner PD. Myoglobin O2 desaturation during exercise. J Clin Invest. 1995;96:1916–1926. doi: 10.1172/JCI118237. [DOI] [PMC free article] [PubMed] [Google Scholar]
- Spriet LL, Söderlund K, Bergström M, Hultman E. Anaerobic energy release in skeletal muscle during electrical stimulation in men. J Appl Physiol. 1987;62:611–615. doi: 10.1152/jappl.1987.62.2.611. [DOI] [PubMed] [Google Scholar]
- Tullson PC, Whitlock DM, Terjung RL. Adenine nucleotide degradation in slow-twitch red muscle. Am J Physiol. 1990;258:C258–265. doi: 10.1152/ajpcell.1990.258.2.C258. [DOI] [PubMed] [Google Scholar]
- Walsh TH, Woledge RC. Heat production and chemical change in tortoise muscle. J Physiol. 1970;206:457–469. doi: 10.1113/jphysiol.1970.sp009024. [DOI] [PMC free article] [PubMed] [Google Scholar]
- Whipp BJ, Wasserman K. Oxygen uptake kinetics for various intensities of constant-load work. J Appl Physiol. 1972;33:351–356. doi: 10.1152/jappl.1972.33.3.351. [DOI] [PubMed] [Google Scholar]
- Wilkie DR. Heat work and phosphorylcreatine breakdown in muscle. J Physiol. 1968;195:157–183. doi: 10.1113/jphysiol.1968.sp008453. [DOI] [PMC free article] [PubMed] [Google Scholar]
- Willis WT, Jackman MR. Mitochondrial function during heavy exercise. Med Sci Sports Exerc. 1994;26:1347–1354. [PubMed] [Google Scholar]
- Woledge RC, Curtin NA, Homsher E. Energetic Aspects of Muscle Contraction. London: Academic Press; 1985. [PubMed] [Google Scholar]