

Abstract
To determine whether fibre type affects the O2 exchange characteristics of skeletal muscle at the microcirculatory level we tested the hypothesis that, following the onset of contractions, muscle comprising predominately type I fibres (soleus, Sol, 86 % type I) would, based on demonstrated blood flow responses, exhibit a blunted microvascular PO2 (PO2,m, which is determined by the O2 delivery ( ) to O2 uptake (
 ) ratio) profile (assessed via phosphorescence quenching) compared to muscle of primarily type II fibres (peroneal, Per, 84 % type II). PO2,m was measured at rest, and following the rest-contractions (twitch, 1 Hz, 2–4 V for 120 s) transition in Sol (n = 6) and Per (n = 6) muscles of Sprague-Dawley rats. Both muscles exhibited a delay followed by a mono-exponential decrease in PO2,m to the steady state. However, compared with Sol, Per demonstrated (1) a larger change in baseline minus steady state contracting PO2,m (ΔPO2,m) (Per, 13.4 ± 1.7 mmHg; Sol, 8.6 ± 0.9 mmHg, P < 0.05); (2) a faster mean response time (i.e. time delay (TD) plus time constant (τ); Per, 23.8 ± 1.5 s; Sol, 39.6 ± 4.3 s, P < 0.05); and therefore (3) a greater rate of PO2,m decline (ΔPO2,m/τ; Per, 0.92 ± 0.08 mmHg s−1; Sol, 0.42 ± 0.05 mmHg s−1, P < 0.05). These data demonstrate an increased microvascular pressure head of O2 at any given point after the initial time delay for Sol versus Per following the onset of contractions that is probably due to faster dynamics relative to those of .
Within the majority of skeletal muscle groups there exists a stratification of fibre types (e.g. slow-twitch, type I fibres and fast-twitch, type IIa, IIb and IId/x fibres, depending upon the species studied), oxidative capacities (Gollnick et al. 1972, 1973; Essen et al. 1975; Elder et al. 1982) and myoglobin concentrations (Nemeth & Lowry, 1984). In addition, isolated mitochondria from different fibre types vary substantially in composition and regulation of oxygen consumption (Crow & Kushmerick, 1983; Jackman & Willis, 1996; Saks et al. 1998). However, there remain a number of uncertainties regarding the differences between type I and II muscle fibres, particularly with respect to oxygen uptake () dynamics.
Specifically, there is evidence in humans that the speed of the primary component of the pulmonary (,p) response correlates positively to the percentage of type I fibres within the exercising musculature (Bartsow et al. 1996). In contrast, the equine athlete exhibits rapid ,p kinetics (Langsetmo et al. 1997) whilst the majority of skeletal muscle mass in this species is composed of type II fibres (80–90 %; Roneus & Lindholm, 1991). The putative physiological mechanisms responsible for the variation in dynamics between fibre types include increased oxidative capacity, augmented O2 delivery (), decreased inertia within the mitochondria and/or improved temporal matching of to .
Recently, it has been demonstrated that isolated first-order arterioles from slow-twitch fibres (soleus; mainly type I) exhibit a greater expression of endothelial nitric oxide synthase (eNOS) mRNA (Woodman et al. 2001) as well as a greater sensitivity and maximal responsiveness to endothelium-dependent (i.e. acetylcholine; Wunsch et al. 2000; Woodman et al. 2001), but not independent (i.e. sodium nitroprusside; Wunsch et al. 2000), agents when compared with their fast-twitch counterparts (gastrocnemius; type IIa & IIb fibres). This suggests that, in response to a stimulus such as increased shear stress (e.g. due to an elevated blood flow () via the muscle pump; Radegran & Saltin, 1998), arterioles from muscles composed of type I fibres have an augmented ability to vasodilate (resulting in rapidly increased ) compared to arterioles from muscle composed of type II fibres.
Microvascular PO2 (PO2,m) as assessed via phosphorescence quenching provides information regarding the real-time matching of muscle oxygen delivery (,musc) to muscle O2 consumption (,musc; Behnke et al. 2001). The purpose of the present investigation was to examine the O2 exchange characteristics (via measurements of PO2,m and bulk blood flow) in two muscles with contrasting fibre types (soleus (Sol), which contains 84 % type I and peroneal (Per), which contains 86 % type II fibres; Delp & Duan, 1996). These muscles were selected, in part, because of their very similar oxidative capacities (citrate synthase activities for both Sol and Per are ∼21 μm min−1 g−1; Delp & Duan, 1996). It has been demonstrated that the PO2,m profile at the onset of contractions is much faster in highly oxidative muscle (i.e. in diaphragm vs. spinotrapezius; Geer et al. 2002) and judicious selection of the Sol and Per muscles in the present investigation removed this potentially confounding variable. To test the general hypothesis that muscle composed of primarily type I fibres would have an augmented ability to match to during a given metabolic challenge (e.g. electrical stimulation), the following specific hypotheses were tested: across the transition to electrically induced muscular contractions Sol would exhibit (1) a longer mean response time (MRT (time delay plus time constant)) in the decline of PO2,m; (2) a slower rate of PO2,m decline (baseline PO2,m minus steady state contracting PO2,m (ΔPO2,m)/time constant for PO2,m (τ(PO2,m)); and (3) a smaller ΔPO2,m (and thus a higher contracting PO2,m value) compared to that observed for Per. A higher end-stimulation PO2,m value and reduced rate of fall would act to preserve a higher pressure head for O2 diffusion from blood to tissue across the rest-exercise transition and possibly attenuate perturbations of the intracellular milieu in accordance with Fick's law.
METHODS
Female Sprague-Dawley rats (240 ± 14 g, n = 6) were anaesthetized with pentobarbital sodium (40 mg kg−1i.p.). The carotid artery was cannulated using PE-50 tubing (Intra-Medic polyethylene tubing; Clay Adams, Sparks, MD, USA). This provided a route of access for infusion of the phosphorescent probe, monitoring of arterial blood pressure (Digi-Med BPA model 200, Louisville, KY, USA) and blood sampling. Blood withdrawal for blood gas analysis, pH measurement, lactate determination (Nova Stat Profile M, Waltham, MA, USA), and haematocrit (Adams Micro-Haematocrit reader, Clay Adams, Parsipanny, NJ, USA) was performed immediately after the stimulation periods. Upon completion of the study, animals were killed with an overdose of pentobarbital sodium (> 80 mg kg−1, i.a.). All procedures were approved by the Kansas State University Institutional Animal Care and Use Committee (IACUC).
Surgical preparation
A lateral incision (in the frontal plane) of the skin and overlying fascia was made to expose the tibialis anterior and biceps femoris of the left hindlimb. Subsequently, the distal portion of the biceps femoris was reflected using a 3/0 silk suture to expose the soleus and peroneal muscles. Platinum wire electrodes were attached via 6/0 sutures to the proximal (cathode) and distal (anode) regions of each muscle in order to elicit bipolar muscle contractions. The foot was stabilized using adhesive tape to minimize leg movement during electrical stimulation. The exposed tissues, which were not contracted, were protected with Saran Wrap (Dow, Indianapolis, IN, USA). The Sol and Per were superfused with a Krebs-Henseleit bicarbonate-buffered solution (4.7 mm KCl, 2.0 mm CaCl2, 2.4 mm MgSO4, 131 mm NaCl, and 22 mm NaHCO3) equilibrated with 5 %CO2:95 %N2 at 38 °C. Body temperature was maintained at 38 °C using a heating pad.
Protocol
The phosphorescent probe palladium meso-tetra(4-carboxyphenyl)porphyrin dendrimer (R2) was infused at 15 mg kg−1 via the arterial cannula approximately 15 min before the first stimulation period. Following a 10–15 min post-surgery stabilization period, twitch muscle contractions (2–4 V, 2 ms pulse duration) were elicited in either the Sol or Per muscle (in random order) at 1 Hz frequency for 2 min using a Grass S88 stimulator (Quincy, MA, USA). After the 2 min stimulation period there was a stimulation-free recovery period for both muscles of 20 min. Subsequently, the muscle not stimulated during the first period was contracted, with the stimulation parameters held constant. To alleviate the effects of fatigue the stimulation parameters (i.e. 2–4 V, 2 ms pulse duration) were chosen to elicit blood flow responses ∼30 % of maximum achievable values (Armstrong & Laughlin, 1983) in the Sol and Per, which, concurrent with no change in blood lactate or muscle temperature, indicate a stimulation strength commensurate with moderate-intensity exercise. Care was taken to position the probe over the same section of the muscle in each animal and PO2,m was determined at 2 s intervals across the rest-contractions transition for both muscles. Mean arterial pressure was monitored continuously throughout the protocol and blood samples were taken immediately upon completion of the final stimulation period.
Microvascular PO2 measurement
The oxygen dependence of the probe phosphorescence can be described quantitatively through the Stern-Volmer relationship (Rumsey et al. 1988). For the R2 probe bound to albumin at 38 °C and pH 7.4, kQ (the phosphorescence quenching constant) is 409 mmHg s−1 and T° (the lifetime of phosphorescence decay in the absence of oxygen) is 601 μs (Lo et al. 1997). PO2,m was determined using a PMOD 1000 Frequency Domain Phosphorometer (Oxygen Enterprises, Ltd., Philadelphia, PA, USA) with the common end of the bifurcated light guide placed ∼2–3 mm above the medial region of the Per or Sol. The PMOD 1000 uses a sinusoidal modulation of the excitation light (524 nm) at frequencies between 100 Hz and 20 kHz, which allows phosphorescence lifetime measurements from 10 μs to ∼2.5 ms. In the PMOD 1000 single frequency mode, 10 scans (100 ms) were used to acquire the resultant lifetime of the phosphorescence (700 nm) and thus PO2,m (reviewed by Vinogradov et al. 2001). This measurement was repeated every 2 s across the rest-contractions transition. The phosphorescence lifetime, which is independent of probe concentration (Lo et al. 1997), was obtained by taking the logarithm of the intensity values at each time point and fitting the linearized decay to a straight line by the least-squares method (Bevington, 1969).
A concentration of 0.5 % albumin is required for 100 % binding of the R2 phosphorescent probe in vitro (Lo et al. 1997). The concentration of albumin in rat serum (i.e. > 3 g dl−1; Altman & Dittmer, 1974) is several fold higher and the R2 probe in vivo is therefore considered to be 100 % bound to albumin. R2 possesses a negative charge, which, when coupled with the high albumin reflection coefficient of skeletal muscle (∼0.99; Renkin et al. 1989), will act to restrict it to the vascular compartment (i.e. principally the capillary bed). The probe was assumed to be uniformly distributed in the blood plasma and to provide a signal corresponding to the volume average O2 pressure within the capillary blood, which, across the rest-contractions transition, will track that of PO2,v (venous blood PO2; McDonough et al. 2001). PO2,m values were fitted to a mono-exponential plus delay model (Behnke et al. 2001) using an iterative least-squares technique by means of a commercial graphing and analysis package (KaleidaGraph 3.5). For the KaleidaGraph analysis program a user-defined function was fitted to the data using the following equation:
where PO2,m(t) is the change in PO2,m at time t, PO2,m(b) is baseline PO2, ΔPO2,m is the change in PO2,m from baseline to the steady state contracting value, TD is the time delay, and τ is the time constant of the response. The same model was applied to PO2,m responses from stimulation periods in both muscles. In addition, the overall time taken to reach 63 % of the final response (T63) was measured directly from the response to provide an indication of the time course of PO2,m change independent of any modelling procedure. The mean response time (MRT = TD +τ) and rate of PO2,m fall (kr(PO2,m) =ΔPO2,m/τ(PO2,m)) were calculated from the mathematical modelling results.
Blood flow measurements
Blood flow was determined in a subset of seven animals (female Sprague-Dawley rats, 229 ± 6 g) using the radionuclide-tagged microsphere technique (Musch & Terrell, 1992). Initially, rats were anaesthetized with sodium pentobarbital (40 mg kg−1i.p.). Polyethlene catheters (PE-10 tubing connected to PE-50 tubing) were placed in the right carotid and caudal (tail) arteries. The carotid artery catheter was advanced 2–3 mm rostral to the aortic valve and secured. The tail artery catheter was advanced toward the bifurcation of the descending aorta and secured. The carotid artery catheter was connected to a pressure transducer for measurement of arterial blood pressure (Digi-Med BPA model 200). The tail artery catheter was connected to a 1 ml plastic syringe, which was attached to a Harvard Withdrawal Pump (model 907, Cambridge, MA, USA).
Blood flow measurements were taken at rest and after 2 min of the electrical stimulation period in the Sol and Per muscle (stimulated in random order with a 20 min rest period prior to subsequent muscle stimulation). Three different radiolabelled (46Sc, 85Sr and 141Ce) 15-μm-diameter microsphere preparations (New England Nuclear, Boston, MA, USA) were injected in random order. Prior to infusion, the microspheres were agitated by sonication to suspend the beads and prevent clumping. Thirty seconds prior to initiating infusion, blood withdrawal was begun from the caudal artery at 0.25 ml min−1. The right carotid artery catheter was disconnected from the pressure transducer and a specified microsphere (∼2.5 × 10⁵ in number) was injected into the ascending aorta and flushed with saline to assure clearance of the beads. Blood withdrawal from the caudal artery continued for 45 s after microsphere infusion.
After verifying the correct placement of the carotid catheter in the aortic arch, the following muscles and organs were removed: left and right peroneals, solei, and kidneys. The radioactivity levels of the tissues were determined by a gamma scintillation counter (Packard Auto Gamma Spectrometer, Cobra model 5003) set to record the peak energy activity of each isotope for 5 min. Total muscle blood flows and conductances to each tissue were calculated by the reference sample method (Ishise et al. 1980; Musch & Terrell, 1992) and expressed mass specifically in ml min−1 (100 g tissue)−1 and ml min−1 (100 g tissue)−1 mmHg−1, respectively. Adequate mixing of the microspheres was verified by demonstrating a < 15 % difference in blood flows to the right and left kidneys.
Muscle morphometry
A subset of five animals (female Sprague-Dawley; 279 ± 8 g) were killed with an overdose of sodium pentobarbital (> 80 mg kg−1i.p.). The left soleus and peroneal muscles were rapidly excised, mounted on cork blocks in tissue-freezing medium (Tissue-Tec O.C.T.) and frozen in isopentane cooled to −140 °C. Five to eight 10 μm-thick sections were cut (in a −24 °C cryostat; Leitz 1720 Digital; Leica, Germany) transversely from each muscle and stored at −80 °C until histochemistry was performed according to the methods of Rosenblatt et al. (1987). Capillary-to-fibre ratio and capillary density were estimated according to the methods described by Mathieu et al. (1983) using a 100-point square grid test system projected on a Sony Trinitron monitor using a Nikon microscope (Eclipse E600-FN; with a × 20 objective, at a final magnification of × 575). For each muscle, at least 200 fibres and their associated capillaries were measured using the maximum number of non-overlapping screens. According to the principles developed by Eisenberg et al. (1974) fibre and capillary measurements were referenced to total fibre area within the test grid to obviate errors arising from differences between samples in the preservation of the extracellular space.
Muscle oxygen consumption (,musc)
Muscle oxygen consumption (,musc) was calculated using the Fick equation assuming that PO2,m is an appropriate analogue for venous PO2 (McDonough et al. 2001), and by extension from the O2 dissociation curve, venous blood O2 content (Roca et al. 1992). ,musc was estimated using arterial blood gases, PO2,m and muscle blood flow ( ). Using the methods of Barstow & Molé (1987), profiles of ,musc and were computer-generated for both Sol and Per from the observed PO2,m profiles and the measured resting and steady state values for ,musc and expressed per 100 g of tissue, i.e. mass specific (Behnke et al. 2002). The assumption was made that both and increase in a close to exponential fashion (i.e. with no overshoot) from rest to steady state contractions, according to the measurements of Kindig et al. (2002) and the calculations of Behnke et al. (2002).
Statistical analysis
PO2,m and the resultant model parameters as well as blood flow from rest to electrical stimulation within and between individual muscles were analysed by means of a one-way analysis of variance. Individual significant differences were examined post hoc using Tukey's test. Muscle morphological data from Sol and Per muscle sections were analysed using an unpaired t test. Data are presented as means ±s.e.m. Significance was accepted at P≤ 0.05.
RESULTS
Prior to contractions, no differences in resting blood flow were observed between the right and left solei or the right and left peroneals, indicating that surgical intervention had no significant impact on resting blood flows or, presumably, on PO2,m values. The arterial partial pressures of O2 (Pa,O2) and CO2 (Pa,CO2) averaged 93 ± 5 and 42 ± 3 mmHg, respectively, with an O2 saturation of 88 ± 1 % corresponding to an O2 content of 17.8 ± 0.3 ml (100 ml arterial blood)−1 at a haematocrit of 36 ± 2 %. Arterial blood pH was 7.38 ± 0.02 with a lactate concentration of 1.0 ± 0.1 mm. These values are consistent with resting values for the rat. The mono-exponential plus delay model fitted the data from both muscles qualitatively and quantitatively well, as confirmed by visual inspection and low χ2 values (Per, 21 ± 17; Sol, 7.5 ± 0.8, P > 0.1 between Sol and Per) with high correlation coefficients (Per, r = 0.993± 0.003; Sol, r = 0.992± 0.001), therefore a more complex model was not considered for either muscle. Average muscle weights were 116.8 ± 5.5 mg for Sol and 262.8 ± 12.6 mg for Per.
Microvascular PO2 (PO2,m) dynamics
Figure 1 shows a representative comparison of the PO2,m profile of the two muscles in response to electrical stimulation. No differences were found in baseline (non-contracting) PO2,m values between Per and Sol muscle (Table 1). Per muscle demonstrated significantly greater ΔPO2,m values than Sol muscle (Table 1). The different kinetic responses (i.e. time delay (TD) and time constant (τ)) derived from the mathematical modelling of individual Sol and Per muscles are demonstrated in Fig. 2. Sol muscle PO2,m remained unchanged or increased slightly (observed in 50 % of responses) from non-contracting values for approximately 17 s (i.e. TD), whereas in Per muscle PO2,m decreased below resting values after only 9 s (Fig. 2, P < 0.05). The τ(PO2,m) was significantly longer in Sol muscles (Sol, 22.6 ± 1.7 s; Per, 14.5 ± 0.8 s, P < 0.05, Fig. 2). Within either muscle, no differences were observed between the time taken to reach 63 % of the final response (T63, model independent) and the mean response time (MRT, Table 1). However, both T63 and MRT were significantly shorter in Per muscle (Table 1) compared to Sol. The rate of fall in PO2,m (kr(PO2,m), given by ΔPO2,m/τ(PO2,m)) was significantly accelerated in Per muscle compared to Sol (Table 1).
Figure 1. PO2,m profiles for Sol and Per.
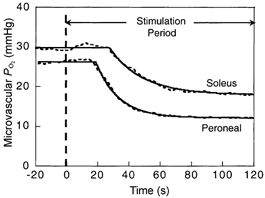
PO2,m responses (dashed lines) and model fits (continuous lines) to 1 Hz electrical stimulation in representative soleus and peroneal muscles. Period before stimulation is resting PO2,m.
Table 1.
Blood pressure and Po2,m data at rest and following the onset of stimulation in Sol and Per muscle
| Soleus | Peroneal | |
|---|---|---|
| MAP (mmHg) | 108 ± 16 | 116 ± 22 |
| Baseline Po2,m (mmHg) | 28.1±1.1 | 26.8 ± 3.3 |
| ΔPo2,m (mmHg) | 8.6 ± 0.9 | 13.4 ± 1.7* |
| MRT (s) | 39.6 ± 4.3 | 23.8 ± 1.5* |
| T63 (s) | 40.2 ± 4.4 | 23.4 ± 1.4* |
| krPo2,m (mmHg s−) | 0.42 ± 0.05 | 0.92 ± 0.08* |
MAP, mean arterial pressure; ΔPo2,m, baseline Po2,m minus steady state contracting Po2,m; krPo2,m, rate of Po2,m decline of exponential component (for further clarification see Methods).
Significantly different from soleus.
Figure 2. Model parameter differences in PO2,m dynamics.
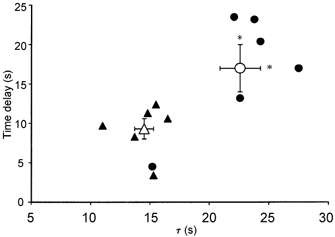
Individual (filled symbols) and mean (±s.e.m.) (open symbols) PO2,m values for soleus (circles) and peroneal (triangles) muscles. *Significantly different from peroneal response, P < 0.05.
Muscle blood flow (musc) in sol and per
The criterion established for adequate mixing of microspheres (i.e. < 15 % difference in blood flows between left and right kidneys) was met in six of the seven animals, therefore data are presented from those six animals (see Methods). Blood pressure was not different between rest and stimulation periods for Sol or Per (105 ± 4, 105 ± 5 and 113 ± 6 mmHg, respectively, P > 0.1). Electrical stimulation elicited an increase of several fold in blood flow in both Sol and Per, although Sol muscle had a greater mass-specific blood flow at rest (20 ± 4 and 8 ± 1 ml (100 g tissue)−1 min−1 for Sol and Per, respectively; P < 0.05) and during stimulation (99 ± 30 and 46 ± 10 ml (100 g tissue)−1 min−1 for Sol and Per, respectively; P < 0.05) than Per muscle. Vascular conductance increased from rest to contractions in both Sol (0.20 ± 0.04 to 0.99 ± 0.37 ml (100 g tissue)−1 min−1 mmHg−1) and Per (0.08 ± 0.01 to 0.42 ± 0.10 ml (100 g)−1 min−1 mmHg−1, P < 0.05). There was also a significantly higher vascular conductance in Sol than in Per muscle at rest and during stimulation (P < 0.05).
Muscle morphometry
Sol muscle demonstrated a significantly greater capillary density (Sol, 830 ± 28 capillaries mm−2; Per, 688 ± 36 capillaries mm−2; P < 0.05), higher capillary-to-fibre ratio (Sol, 2.85 ± 0.16; Per, 1.46 ± 0.12; P < 0.05) and fibre cross-sectional area (Sol, 3468 ± 151 μm2; Per, 2138 ± 149 μm2, P < 0.05) than Per muscle.
Muscle oxygen consumption (,musc)
Sol muscle demonstrated a significantly higher mass specific oxygen consumption (,musc) at rest (2.2 ± 0.8 vs. 1.0 ± 0.1 (ml O2) (100 g tissue)−1 min−1 for Sol vs. Per, respectively; P < 0.05) and during stimulation (14.1 ± 0.3 vs. 7.2 ± 0.3 (ml O2) (100 g)−1 min−1 for Sol vs. Per, respectively; P < 0.05) compared to Per muscle.
Discussion
This is the first investigation, to our knowledge, to demonstrate that muscles of contrasting fibre type, yet similar oxidative capacities, can exhibit markedly different PO2,m responses to electrical stimulation. Muscle composed mainly of slow-twitch, type I fibres (i.e. Sol) demonstrated a blunted PO2,m response (i.e. longer MRT and smaller ΔPO2,m) compared to its fast-twitch, type II fibre counterpart (i.e. Per). The ‘blunted’PO2,m response is advantageous to blood-tissue transfer in that the slower PO2,m dynamics in Sol would preserve a greater capillary O2 pressure head across the majority of the rest-stimulation transition. Therefore, these results suggest that, under the experimental conditions utilized here, Sol muscle exhibits a more precise matching of to (i.e. a higher : ratio) across the rest-exercise transition than Per muscle.
Potential mechanisms
There exist multiple mechanisms that act to elevate blood flow to skeletal muscle () in response to muscle contractions (reviewed by Duling, 1991) and these differentiate between muscles mainly composed of slow- or fast-twitch fibres (reviewed by Laughlin, 1991) and specialized muscle (e.g. diaphragm, Aaker & Laughlin, 2002). For example, compared with their fast-twitch counterparts, isolated first-order arterioles from slow-twitch muscle demonstrate higher IC50 values (concentration which elicits a half maximal response) for noradrenaline (norepinephrine) (Delp, 1999), and a greater vasodilatory sensitivities and maximal responsivenesses to endothelium-dependent compounds (e.g. acetylcholine; Delp et al. 2000; Wunsch et al. 2000; Woodman et al. 2001). Conversely, compounds which act directly on smooth muscle (i.e. which are endothelium independent) tend to elicit a greater vasodilatory response in arterioles isolated from fast-twitch versus slow-twitch muscle (McCurdy et al. 2000; Delp et al. 2000). However, evidence suggests that many of the substances that act directly upon smooth muscle do not contribute directly to the immediate exercise hyperaemic response, as neither autonomic (Buckwalter & Clifford, 1999) nor muscarinic receptor (Buckwalter et al. 1998) blockades affected the initial rise in iliac blood flow at the onset of exercise. Unfortunately, these investigators did not measure blood flow to individual muscles.
Laughlin and colleagues (1989) demonstrated in skeletal muscle of miniature swine that, in response to sub-maximal exercise, muscle composed of slow-twitch fibres releases greater amounts of adenosine (an endothelium-independent dilator) compared to fast-twitch muscle. Moreover, with administration of adenosine deaminase the exercise hyperaemic response is diminished in cat soleus but not gracilis (fast-twitch) muscles (Schwartz & McKenzie, 1990), suggesting a role for adenosine in the vasodilatory response in slow-twitch muscle.
As mentioned above, there is evidence that active vascular control may differ between Sol and Per muscles due to their contrasting fibre-type compositions. The evidence from the current investigation supporting fibre type dependency of vascular control can be summarized as follows: (1) the Per demonstrates a faster MRT(PO2,m) (and thus probably an altered τ() to τ() relationship), and (2) the kr(PO2,m) (ΔPO2,m/τ(PO2,m)) of the exponential PO2,m component is accelerated significantly in the Per (by ∼0.9 mmHg s−1) versus the Sol (by ∼0.4 mmHg s−1), and hence the speed of the response (relative to that of ) must differ appreciably between the two muscles. Figure 3 demonstrates the more rapid dynamics in Sol versus Per blood flow (; Kindig et al. 2002) needed to produce the PO2,m profiles observed in Fig. 1 and Fig. 2 for these muscles, assuming both (Behnke et al. 2002) and (Kindig et al. 2002) increase immediately (in less than 2 s) at the onset of contractions. To generate these figures and in keeping with their similar oxidative capacities, kinetics are assumed to be the same in both muscles. If both muscles demonstrate the same dynamics, the ,musc time constant would have to be lengthened by ∼30 % in the Sol to reproduce the observed PO2,m profile, which seems unlikely given the demonstrated relationships between oxidative capacity, kinetics and ,max (Bloomstrand et al. 1997; reviewed by Poole, 1997). However, if both muscles did demonstrate the same and ,musc dynamics, the result would be a rapid decline in PO2,m (and thus altered PO2,m profile) in the Sol muscle (Fig. 3, dashed lines), which is not the case.
Figure 3. Mean time courses for PO2,m, ,musc and .
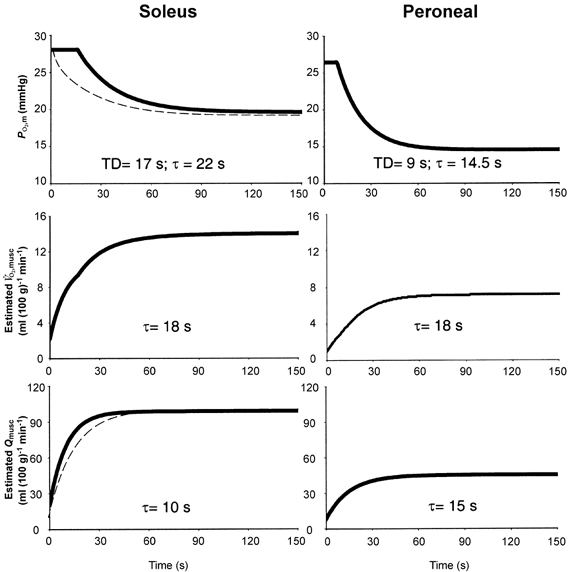
Schematic showing mean fit of the measured mean PO2,m responses (top panels), estimated ,musc responses (middle panels) and resultant response (bottom panels). Note substantially faster response in soleus required to produce the observed PO2,m profile. Dashed lines represent the theoretical effect of slowing the Sol response to match that of the Per (i.e. changing τ() from 10 to 15 s). The resultant PO2,m profile is substantially different from that actually observed.
Consequences for oxidative (and glycolytic) function
From the present results, it could be hypothesized that slower PO2,m dynamics would be expected in a more oxidative muscle such as the diaphragm (citrate synthase activity 39 μm min−1 g−1; Delp & Duan, 1996). However, even with its prodigious capacity for red blood cell (RBC) flow (Kindig & Poole, 1998; Poole et al. 2000), the diaphragm demonstrates extremely rapid PO2,m dynamics (MRT ∼18 s; Geer et al. 2002) in response to the same type of electrical stimulation used here. Moreover, the rat spinotrapezius (Spino) demonstrates PO2,m kinetics that are very similar to those of the soleus (Spino, MRT ∼40 s; Behnke et al. 2001; Sol, MRT ∼40 s, present results), although its oxidative capacity is only 2/3 that of the soleus. Thus, it would appear that oxidative capacity per se cannot define the microvascular PO2 response to exercise; rather the PO2,m dynamics are determined by the ability of the muscle to match O2 delivery () to O2 demand () (Fig. 3). This consideration becomes evident in diseased tissues where oxidative capacity may be unchanged compared to healthy muscle (for example the Spino in moderate heart failure), but dynamics (relative to those of ) are blunted across the rest-contractions transition, resulting in a precipitous drop and undershoot of the steady state PO2,m response (Diederich et al. 2002).
Graphical and structural analysis of muscle O2 diffusing capacity
The principal resistance to blood-mitochondrial O2 transfer is situated in close proximity (within 1–2 μm) to the RBC in the capillary (Gayeski & Honig, 1986; Richardson et al. 1999) and thus capillary-to-fibre structural relationships (Mathieu-Costello et al. 1991) and capillary haemodynamics (Federspiel & Popel, 1986) are important determinants of muscle O2 diffusion properties and O2 flux. Despite the similarity in oxidative capacity of the Sol and Per muscles (Delp & Duan, 1996), we found a significantly higher capillary density and capillary-to-fibre ratio in the Sol than the Per muscle. Accordingly, at the same capillary haematocrit the greater capillary volume and capillary-to-fibre ratio in Sol would mean that, at a given time, more RBCs would lie adjacent to a given muscle fibre and thereby provide an enhanced potential for O2 transfer (i.e. DO2,musc). Moreover, the elevated microvascular PO2 (indicative of a higher mean capillary PO2) demonstrated here across the rest-contractions transition and in the steady state would further serve to improve O2 exchange according to Fick' s law:
where ,musc is muscle O2 uptake, DO2,musc is the diffusing capacity for O2 of the muscle, PO2,cap and PO2,mito are the mean pressures of O2 in the capillary and mitochondria, respectively and * indicates those variables that are increased in Sol vs. Per.
Whilst maximal is strongly dependent upon O2 delivery (), during maximal and submaximal exercise a given muscle will be achieved by the interaction between and muscle O2 diffusion properties (DO2,musc; Roca et al. 1989, 1992; Wagner, 1991). Thus, in Fig. 4 it can be seen that both (Sol 54 % greater than Per) and DO2,musc (Sol 25 % greater than Per) are lower during the stimulation period in Per. This resulted in a 48 % reduction in ,musc for Per vs. Sol. One important point here is that, given the low for Per, a given is achieved by lowering PO2,m substantially below that found in Sol. If this is accompanied by a reduced intracellular PO2, it may have important consequences for metabolic control (Wilson et al. 1977) and muscular fatigue.
Figure 4. Relationship between PO2,m and ,musc.
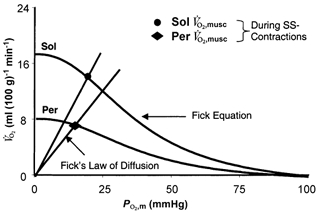
Graphical representation of the interaction between convective O2 delivery and diffusive conductance of O2. Fick equation lines (=(Ca,O2 - Cv,O2)), where represents blood flow and Ca,O2 and Cv,O2 represent arterial and venous O2 contents, respectively. Curvilinear lines drawn from oxyhaemoglobin dissociation curve (P50= 38.5 mmHg, ‘n’= 2.4; Altman & Dittmer, 1974). Fick's Law lines, =DO2,musc×PO2,m, where DO2,musc (diffusional coefficient) is the slope of the line from origin to calculated and PO2,m represents the microvascular O2 pressure within the capillary bed. Note the reduced (ordinate) and DO2,musc (slope of lines projecting from origin) in Per compared to Sol. SS-Contractions, steady state contracting values.
Model considerations
The present model differs in several respects from voluntary exercise. Specifically, there are differences in motor unit recruitment patterns with electrical stimulation compared to voluntary exercise (Gollnick et al. 1974) as well as possible differences in motor unit activation between the Sol and Per muscles stimulated here. In an attempt to obviate gross differences in muscle recruitment we opted to preserve the electrical stimulation parameters between muscles. Unfortunately, it is currently technically infeasible to measure power output or work without damaging or excising the muscles in this preparation. However, there is a higher O2 cost of tension production in fast-twitch fibres (Crow & Kushmerick, 1983), therefore, for a given level of activation a greater ATP requirement in Per than Sol would be expected. Notwithstanding this energetic difference between fibre types, as is clear from Fig. 4, the of Sol was considerably higher than that of Per.
It is possible that, based on the different regulators of blood flow (see ‘Potential mechanisms’), Per would have a different (i.e. more rapid) blood flow response in the conscious animal, as the vasculature of fast-twitch muscle seems to be influenced more by sympathetic activity (Laughlin & Armstrong, 1987), which is attenuated in the anaesthetized animal. Thus, as with any animal model, direct interpretation of the present results with respect to human muscle microvascular function should be made with caution.
Conclusions
This investigation has demonstrated that, in response to electrical stimulation, a muscle composed mainly of slow-twitch, type I fibres demonstrates a blunted PO2,m response (i.e. a longer MRT and a smaller change from baseline to steady state) compared to its fast-twitch, type II fibre counterpart. The Sol PO2,m dynamics probably reflect an augmented ability to match O2 delivery to the metabolic demand () of the muscle. At any given transmembrane O2 flux, the slower PO2,m dynamics and maintenance of a higher PO2,m following the onset of contractions, in conjunction with the greater capillary-to-fibre ratio demonstrated in the Sol, are expected to elevate intracellular PO2 and attenuate perturbations to the intracellular milieu compared with Per (Wilson et al. 1977).
Acknowledgments
We would like to acknowledge the excellent technical support of Sue Hageman, Holly Brown-Feltner and Michael Zbreski. We would also like to thank Drs Casey A. Kindig and Thomas J. Barstow for insightful discussions. This research was supported, in part, by grants from the National Institutes of Health (HLBI-50306 and AG-19228).
References
- Aaker A, Laughlin MH. Diaphragm arterioles are less responsive to alpha(1)-adrenergic constriction than gastrocnemius arterioles. J Appl Physiol. 2002;92:1808–1816. doi: 10.1152/japplphysiol.01152.2001. [DOI] [PubMed] [Google Scholar]
- Altman PL, Dittmer DS. The Biology Data Book. 2. III. Bethesda, MD: FASEB; 1974. [Google Scholar]
- Armstrong RB, Laughlin MH. Blood flows within and among rat muscles as a function of time during high speed treadmill exercise. J Physiol. 1983;344:189–208. doi: 10.1113/jphysiol.1983.sp014933. [DOI] [PMC free article] [PubMed] [Google Scholar]
- Barstow TJ, Jones AM, Nguyen PH, Casaburi R. Influence of muscle fibre type and pedal frequency on oxygen uptake kinetics of heavy exercise. J Appl Physiol. 1996;81:1642–1650. doi: 10.1152/jappl.1996.81.4.1642. [DOI] [PubMed] [Google Scholar]
- Barstow TJ, Molé PA. Simulation of pulmonary O2 uptake during exercise transients in humans. J Appl Physiol. 1987;63:2253–2261. doi: 10.1152/jappl.1987.63.6.2253. [DOI] [PubMed] [Google Scholar]
- Behnke BJ, Barstow TJ, Kindig CA, McDonough P, Musch TI, Poole DC. Dynamics of oxygen uptake following exercise onset in rat skeletal muscle. Respir Physiol. 2002;133:229–239. doi: 10.1016/s1569-9048(02)00183-0. [DOI] [PubMed] [Google Scholar]
- Behnke BJ, Kindig CA, Musch TI, Koga S, Poole DC. Dynamics of microvascular oxygen pressure across the rest-exercise transition in rat skeletal muscle. Respir Physiol. 2001;126:53–63. doi: 10.1016/s0034-5687(01)00195-5. [DOI] [PubMed] [Google Scholar]
- Bevington PR. Data Reduction and Error Analysis for Physical Sciences. New York: McGraw-Hill; 1969. pp. 1–118. chap. 1 4. [Google Scholar]
- Blomstrand E, Radegran G, Saltin B. Maximum rate of oxygen uptake by human skeletal muscle in relation to maximal activities of enzymes in the Krebs cycle. J Physiol. 1997;501:455–460. doi: 10.1111/j.1469-7793.1997.455bn.x. [DOI] [PMC free article] [PubMed] [Google Scholar]
- Buckwalter JB, Clifford PS. Autonomic control of skeletal muscle blood flow at the onset of exercise. Am J Physiol. 1999;277:H1872–1877. doi: 10.1152/ajpheart.1999.277.5.H1872. [DOI] [PubMed] [Google Scholar]
- Buckwalter JB, Ruble SB, Mueller PJ, Clifford PS. Skeletal muscle vasodilation at the onset of exercise. J Appl Physiol. 1998;85:1649–1654. doi: 10.1152/jappl.1998.85.5.1649. [DOI] [PubMed] [Google Scholar]
- Crow MT, Kushmerick MJ. Correlated reduction of velocity of shortening and the rate of energy utilization in mouse fast-twitch muscle during a continuous tetanus. J Gen Physiol. 1983;82:703–720. doi: 10.1085/jgp.82.5.703. [DOI] [PMC free article] [PubMed] [Google Scholar]
- Delp MD. Myogenic and vasoconstrictor responsiveness of skeletal muscle arterioles is diminished by hindlimb unloading. J Appl Physiol. 1999;86:1178–1184. doi: 10.1152/jappl.1999.86.4.1178. [DOI] [PubMed] [Google Scholar]
- Delp MD, Colleran PN, Wilkerson MK, McCurdy MR, Muller-Delp J. Structural and functional remodeling of skeletal muscle microvasculature is induced by simulated microgravity. Am J Physiol Heart Circ Physiol. 2000;278:H1866–1873. doi: 10.1152/ajpheart.2000.278.6.H1866. [DOI] [PubMed] [Google Scholar]
- Delp MD, Duan C. Composition and size of type I, IIA, IID/X, and IIB fibres and citrate synthase activity of rat muscle. J Appl Physiol. 1996;80:261–270. doi: 10.1152/jappl.1996.80.1.261. [DOI] [PubMed] [Google Scholar]
- Diederich ER, Behnke BJ, McDonough P, Kindig CA, Barstow TJ, Poole DC, Musch TI. Dynamics of microvascular oxygen partial pressure in contracting muscle of rats with chronic heart failure. Cardiovas Res. 2002;56:479–486. doi: 10.1016/s0008-6363(02)00545-x. [DOI] [PubMed] [Google Scholar]
- Duling BR. Control of striated muscle blood flow. In: Crystal RG, West JB, editors. The Lung. New York: Raven Press; 1991. [Google Scholar]
- Eisenberg BR, Kuda AM, Peter JB. Stereological analysis of mammalian skeletal muscle. I. Soleus muscle of the adult guinea pig. J Cell Biol. 1974;60:732–754. doi: 10.1083/jcb.60.3.732. [DOI] [PMC free article] [PubMed] [Google Scholar]
- Elder GC, Bradbury K, Roberts R. Variability of fibre type distributions within human muscles. J Appl Physiol. 1982;53:1473–1480. doi: 10.1152/jappl.1982.53.6.1473. [DOI] [PubMed] [Google Scholar]
- Essen B, Jansson E, Henriksson J, Taylor AW, Saltin B. Metabolic characteristics of fibre types in human skeletal muscle. Acta Physiol Scand. 1975;95:153–165. doi: 10.1111/j.1748-1716.1975.tb10038.x. [DOI] [PubMed] [Google Scholar]
- Federspiel WJ, Popel AS. A theoretical analysis of the effect of the particulate nature of blood on oxygen release in capillaries. Microvasc Res. 1986;32:164–189. doi: 10.1016/0026-2862(86)90052-x. [DOI] [PMC free article] [PubMed] [Google Scholar]
- Gayeski TE, Honig CR. O2 gradients from sarcolemma to cell interior in red muscle at maximal VO2. Am J Physiol. 1986;251:H789–799. doi: 10.1152/ajpheart.1986.251.4.H789. [DOI] [PubMed] [Google Scholar]
- Geer CM, Behnke BJ, McDonough P, Poole DC. Dynamics of microvascular pressure in the rat diaphragm. J Appl Physiol. 2002;93:227–232. doi: 10.1152/japplphysiol.00735.2001. [DOI] [PubMed] [Google Scholar]
- Gollnick PD, Armstrong RB, Saltin B, Saubert CWT, Sembrowich WL, Shepherd RE. Effect of training on enzyme activity and fibre composition of human skeletal muscle. J Appl Physiol. 1973;34:107–111. doi: 10.1152/jappl.1973.34.1.107. [DOI] [PubMed] [Google Scholar]
- Gollnick PD, Armstrong RB, Saubert CWT, Piehl K, Saltin B. Enzyme activity and fibre composition in skeletal muscle of untrained and trained men. J Appl Physiol. 1972;33:312–319. doi: 10.1152/jappl.1972.33.3.312. [DOI] [PubMed] [Google Scholar]
- Gollnick PD, Piehl K, Saltin B. Selective glycogen depletion pattern in human muscle fibres after exercise of varying intensity and at varying pedalling rates. J Physiol. 1974;241:45–57. doi: 10.1113/jphysiol.1974.sp010639. [DOI] [PMC free article] [PubMed] [Google Scholar]
- Ishise S, Pegram BL, Yamamoto J, Kitamura Y, Frohlich ED. Reference sample microsphere method: cardiac output and blood flows in conscious rat. Am J Physiol. 1980;239:H443–449. doi: 10.1152/ajpheart.1980.239.4.H443. [DOI] [PubMed] [Google Scholar]
- Jackman MR, Willis WT. Characteristics of mitochondria isolated from type I and type IIb skeletal muscle. Am J Physiol. 1996;270:C673–678. doi: 10.1152/ajpcell.1996.270.2.C673. [DOI] [PubMed] [Google Scholar]
- Kindig CA, Poole DC. A comparison of the microcirculation in the rat spinotrapezius and diaphragm muscles. Microvasc Res. 1998;55:249–259. doi: 10.1006/mvre.1998.2075. [DOI] [PubMed] [Google Scholar]
- Kindig CA, Richardson TE, Poole DC. Skeletal muscle capillary hemodynamics from rest to contractions: implications for oxygen transfer. J Appl Physiol. 2002;92:2513–2520. doi: 10.1152/japplphysiol.01222.2001. [DOI] [PubMed] [Google Scholar]
- Langsetmo I, Weigle GE, Fedde MR, Erickson HH, Barstow TJ, Poole DC. VO2 kinetics in the horse during moderate and heavy exercise. J Appl Physiol. 1997;83:1235–1241. doi: 10.1152/jappl.1997.83.4.1235. [DOI] [PubMed] [Google Scholar]
- Laughlin MH. Heterogeneity of blood flow in striated muscle. In: Crystal RG, West JB, editors. The Lung. New York: Raven Press; 1991. [Google Scholar]
- Laughlin MH, Armstrong RB. Adrenoreceptor effects on rat muscle blood flow during treadmill exercise. J Appl Physiol. 1987;62:1465–1472. doi: 10.1152/jappl.1987.62.4.1465. [DOI] [PubMed] [Google Scholar]
- Laughlin MH, Klabunde RE, Delp MD, Armstrong RB. Effects of dipyridamole on muscle blood flow in exercising miniature swine. Am J Physiol. 1989;257:H1507–1515. doi: 10.1152/ajpheart.1989.257.5.H1507. [DOI] [PubMed] [Google Scholar]
- Lo LW, Vinogradov SA, Koch CJ, Wilson DF. A new, water soluble, phosphor for oxygen measurements in vivo. Adv Exp Med Biol. 1997;428:651–656. doi: 10.1007/978-1-4615-5399-1_91. [DOI] [PubMed] [Google Scholar]
- McCurdy MR, Colleran PN, Muller-Delp J, Delp MD. Effects of fibre composition and hindlimb unloading on the vasodilator properties of skeletal muscle arterioles. J Appl Physiol. 2000;89:398–405. doi: 10.1152/jappl.2000.89.1.398. [DOI] [PubMed] [Google Scholar]
- McDonough P, Behnke BJ, Kindig CA, Poole DC. Rat microvascular PO2 kinetics during the exercise off-transient. Exp Physiol. 2001;86:349–356. doi: 10.1113/eph8602192. [DOI] [PubMed] [Google Scholar]
- Mathieu-Costello O, Ellis CG, Potter RF, MacDonald IC, Groom AC. Muscle capillary-to-fibre perimeter ratio: morphometry. Am J Physiol. 1991;261:H1617–1625. doi: 10.1152/ajpheart.1991.261.5.H1617. [DOI] [PubMed] [Google Scholar]
- Mathieu O, Cruz-Orive LM, Hoppeler H, Weibel ER. Estimating length density and quantifying anisotropy in skeletal muscle capillaries. J Microsc. 1983;131:131–146. doi: 10.1111/j.1365-2818.1983.tb04240.x. [DOI] [PubMed] [Google Scholar]
- Musch TI, Terrell JA. Skeletal muscle blood flow abnormalities in rats with a chronic myocardial infarction: rest and exercise. Am J Physiol. 1992;262:H411–419. doi: 10.1152/ajpheart.1992.262.2.H411. [DOI] [PubMed] [Google Scholar]
- Nemeth PM, Lowry OH. Myoglobin levels in individual human skeletal muscle fibres of different types. J Histochem Cytochem. 1984;32:1211–1216. doi: 10.1177/32.11.6491255. [DOI] [PubMed] [Google Scholar]
- Poole DC. Influence of exercise training on skeletal muscle oxygen delivery and utilization. In: Crystal RG, West JB, Barnes PJ, Weibel ER, editors. The Lung. New York: Raven Press; 1997. pp. 1957–1967. [Google Scholar]
- Poole DC, Sexton WL, Behnke BJ, Ferguson CS, Hageman KS, Musch TI. Respiratory muscle blood flows during physiological and chemical hyperpnea in the rat. J Appl Physiol. 2000;88:186–194. doi: 10.1152/jappl.2000.88.1.186. [DOI] [PubMed] [Google Scholar]
- Radegran G, Saltin B. Muscle blood flow at onset of dynamic exercise in humans. Am J Physiol. 1988;274:H314–322. doi: 10.1152/ajpheart.1998.274.1.H314. [DOI] [PubMed] [Google Scholar]
- Renkin EM, Rew K, Wong M, O'Loughlin D, Sibley L. Influence of saline infusion on blood-tissue albumin transport. Am J Physiol. 1989;257:H525–533. doi: 10.1152/ajpheart.1989.257.2.H525. [DOI] [PubMed] [Google Scholar]
- Richardson RS, Leigh JS, Wagner PD, Noyszewski EA. Cellular PO2 as a determinant of maximal mitochondrial O2 consumption in trained human skeletal muscle. J Appl Physiol. 1999;87:325–331. doi: 10.1152/jappl.1999.87.1.325. [DOI] [PubMed] [Google Scholar]
- Roca J, Agusti AG, Alonso A, Poole DC, Viegas C, Barbera JA, Rodriguez-Roisin R, Ferrer A, Wagner PD. Effects of training on muscle O2 transport at VO2,max. J Appl Physiol. 1992;73:1067–1076. doi: 10.1152/jappl.1992.73.3.1067. [DOI] [PubMed] [Google Scholar]
- Roca J, Hogan MC, Story D, Bebout DE, Haab P, Gonzalez R, Ueno O, Wagner PD. Evidence for tissue diffusion limitation of VO2,max in normal humans. J Appl Physiol. 1989;67:291–299. doi: 10.1152/jappl.1989.67.1.291. [DOI] [PubMed] [Google Scholar]
- Roneus M, Lindholm A. Muscle characteristics in thoroughbreds of different ages and sexes. Equine Vet J. 1991;23:207–210. doi: 10.1111/j.2042-3306.1991.tb02757.x. [DOI] [PubMed] [Google Scholar]
- Rosenblatt JD, Kuzon WM, Plyley MJ, Pynn BR, McKee NH. A histochemical method for the simultaneous demonstration of capillaries and fibre types in skeletal muscle. Stain Technol. 1987;62:85–92. doi: 10.3109/10520298709107973. [DOI] [PubMed] [Google Scholar]
- Rumsey WL, Vanderkooi JM, Wilson DF. Imaging of phosphorescence: a novel method for measuring oxygen distribution in perfused tissue. Science. 1988;241:1649–1651. doi: 10.1126/science.241.4873.1649. [DOI] [PubMed] [Google Scholar]
- Saks VA, Veksler VI, Kuznetsov AV, Kay L, Sikk P, Tiivel T, Tranqui L, Olivares J, Winkler K, Wiedemann F, Kunz WS. Permeabilized cell and skinned fibre techniques in studies of mitochondrial function in vivo. Mol Cell Biochem. 1998;184:81–100. [PubMed] [Google Scholar]
- Schwartz LM, McKenzie JE. Adenosine and active hyperemia in soleus and gracilis muscle of cats. Am J Physiol. 1990;259:H1295–1304. doi: 10.1152/ajpheart.1990.259.4.H1295. [DOI] [PubMed] [Google Scholar]
- Vinogradov SA, Fernandez-Searra MA, Dugan BW, Wilson DF. Frequency domain instrument for measuring phosphorescence lifetime distributions in heterogeneous samples. Rev Sci Instrum. 2001;72:3396–3406. [Google Scholar]
- Wagner PD. Central and peripheral aspects of oxygen transport and adaptations with exercise. Sports Med. 1991;11:133–142. doi: 10.2165/00007256-199111030-00001. [DOI] [PubMed] [Google Scholar]
- Wilson DF, Erecinska M, Drown C, Silver IA. Effect of oxygen tension on cellular energetics. Am J Physiol. 1977;233:C135–140. doi: 10.1152/ajpcell.1977.233.5.C135. [DOI] [PubMed] [Google Scholar]
- Woodman CR, Schrage WG, Rush JW, Ray CA, Price EM, Hasser EM, Laughlin MH. Hindlimb unweighting decreases endothelium-dependent dilation and eNOS expression in soleus not gastrocnemius. J Appl Physiol. 2001;91:1091–1098. doi: 10.1152/jappl.2001.91.3.1091. [DOI] [PubMed] [Google Scholar]
- Wunsch SA, Muller-Delp J, Delp MD. Time course of vasodilatory responses in skeletal muscle arterioles: role in hyperemia at onset of exercise. Am J Physiol Heart Circ Physiol. 2000;279:H1715–1723. doi: 10.1152/ajpheart.2000.279.4.H1715. [DOI] [PubMed] [Google Scholar]