

Abstract
The amino acids glycine, β-alanine and taurine are all endogenous agonists of the glycine receptor. In this study, a combination of rapid agonist application onto macropatches and steady-state single-channel recordings was used to compare the actions of glycine, β-alanine and taurine upon homomeric α1 human glycine receptors transiently expressed in human embryonic kidney (HEK 293) cells. The 10–90 % rise times determined from rapid application of 100 μm of each agonist were indistinguishable, indicating each agonist has a similar association rate. At saturating concentrations (30 mm) the rise time for glycine (0.26 ms) was 1.8-fold faster than that for β-alanine (0.47 ms) and 3.9-fold faster than that for taurine (1.01 ms), indicating clear differences in the maximum opening rate between agonists. The relaxation following rapid removal of agonist was fitted with a single exponential for β-alanine (3.0 ms) and taurine (2.2 ms), and two exponential components for glycine with a weighted mean time constant of 27.1 ms. This was consistent with differences in dissociation rates estimated from analysis of bursts, with taurine > β-alanine > glycine. Exponential fits to the open period distributions gave time constants that did not differ between agonists and the geometric distribution for the number of openings per burst indicated that all three agonists had a significant component of single-opening bursts. Based upon these data, we propose a kinetic scheme with three independent open states, where the opening rates are dependent upon the activating agonist, while the closing rates are an intrinsic characteristic of the receptor.
Glycine is a major inhibitory neurotransmitter that acts upon postsynaptic glycine receptors (GlyRs) located mainly in the spinal cord and brainstem (Kuhse et al. 1995; Racca et al. 1997; Donato & Nistri, 2000). The GlyR subunits share the transmembrane topology and pentameric arrangement around a central ion channel pore that is characteristic of the nicotinic-like family of ligand-gated ion channels (for reviews see Rajendra et al. 1997; Legendre, 2001). There are presently four known isoforms of the α subunit (α1, α2, α3 and α4) that are essential to bind ligands, and a single β subunit. The adult form of the GlyR is the heteromeric α1β receptor, which is believed to have a stoichiometry of three α1 subunits and two β subunits (Langosch et al. 1988). The α subunits are also able to form functional homo-pentameric receptors in heterologous expression systems and the α1 homomeric receptor provides an ideal model system for investigation.
While the neurotransmitter glycine is released from vesicles to activate synaptic GlyRs, there is also evidence that the endogenous amino acids β-alanine and taurine are able to activate extrasynaptic GlyRs (Mori et al. 2002). Microdialysis measurements in the hippocampus have shown that the extracellular concentrations of both β-alanine and taurine are in the micromolar range (Shibanoki et al. 1993), which is sufficient to tonically activate GlyRs (Mori et al. 2002). Glutamate and other glutamate receptor agonists have been shown to evoke the release of taurine and β-alanine from hippocampal slices from developing mice (Saransaari & Oja, 1997, 1999). In adult mice and rats, taurine is released from a number of brain regions in response to glutamate receptor agonists and cell-damaging conditions (such as hypoxia, ischaemia, etc.), which has led to the suggestion that it may play an important protective role against excitotoxicity (Oja & Saransaari, 2000). Taurine is also released as an osmo-regulator (Hussy et al. 1997). Control of the extracellular concentration of β-alanine and taurine is through specific membrane transporters (Liu et al. 1992; Smith et al. 1992b) that are quite distinct from the glycine transporters (Smith et al. 1992a; Liu et al. 1993).
The three agonists glycine, β-alanine and taurine have quite different apparent affinities for the homomeric α1 GlyR, as determined by whole-cell concentration- response curves. Typical values of the EC50 for each agonist are 18 μm for glycine, 52 μm for β-alanine and 153 μm for taurine (Lynch et al. 1997). Additionally, binding studies have demonstrated that glycine is better able to competitively displace strychnine from α1 GlyR binding sites, compared with β-alanine or taurine (Vandenberg et al. 1992; Rajendra et al. 1995). While informative, these results are unable to provide details of receptor kinetics. The relative ability of the agonists to activate the α1 GlyR could be due to differences in agonist binding or unbinding (affinity), channel opening and closing (open probability), or receptor desensitisation.
Glycine, β-alanine and taurine have previously been used to distinguish between the α1 and α2 GlyR isoforms (Grenningloh et al. 1990; Schmieden et al. 1992), although there is recent evidence to suggest that some of these differences may be due to expression levels rather than intrinsic properties of the different subunits (De Saint Jan et al. 2001). These three agonists have also been used as a tool to characterise different startle disease mutations (Lynch et al. 1995) located within a signal transduction domain between transmembrane domains M2 and M3 (Lynch et al. 1997) of the GlyR α1 subunit. This signal transduction domain is largely defined by the altered activity of β-alanine and taurine (becoming partial agonists or antagonists) as a result of mutations in this region. A kinetic understanding of the differences between these GlyR agonists for the homomeric wild-type receptor would be invaluable in contributing to the structure-function relationship of the glycine receptor.
The kinetic basis for the differences between glycine, β-alanine and taurine in activating the GlyR was investigated in the present study. We expressed homomeric α1 subunits in HEK 293 cells and used both rapid agonist application and single-channel recording techniques to characterise the kinetics of glycine, β-alanine and taurine. We propose a kinetic mechanism with five binding sites and three open states to account for the GlyR behaviour. Differences in both the dissociation rate and channel opening rate were found to be important determinants of glycine, β-alanine and taurine action, and we propose that the channel closing rates are an intrinsic property of the receptor.
METHODS
Cell line transfection
The cDNA encoding the α1 subunit of the human glycine receptor (hGlyR; Grenningloh et al. 1990) was subcloned into the pCIS expression vector (Gorman et al. 1990). Plasmid DNA was transiently transfected into exponentially growing HEK 293 cells (ATCC CRL 1573) along with cDNA for the CD4 protein (2:1, α1 GlyR:CD4) or GFP (3:1, α1:GFP; gift of A. Thorburn) using the modified calcium phosphate precipitation method of Chen & Okayama (1987). Transfected cells were identified by CD4 Dynabead labelling (Dynal) or GFP fluorescence.
Patch-clamp electrophysiology
Patch-clamp recordings were made 24–48 h post-transfection. The culture media was exchanged for an external salt solution, consisting of the following (mm): 140 NaCl, 5 KCl, 2 CaCl2, 1 MgCl2, 10 glucose and 10 Hepes adjusted to pH 7.4 (with NaOH) and to 320 mosmol l−1 (with sucrose). Micropipette recording electrodes were pulled from borosilicate glass (1.5 mm o.d., 1.0 mm i.d.) on a horizontal puller (Sutter Instrument Co.). Whole-cell and single-channel recording electrodes were coated with Sylgard (Dow Corning 184) and fire polished before use to a final resistance of 2–4 MΩ. Macropatch recording electrodes were pulled to a resistance of 4–6 MΩ and were not coated. Electrodes were filled with internal salt solution consisting of the following (mm): 120 (140) CsCl, 20 (0) TEA-Cl, 2 MgCl2, 11 EGTA and 10 Hepes adjusted to pH 7.2 with CsOH (differing macropatch concentrations in parentheses). All recordings were performed at room temperature (20–23 °C). Glycine, β-alanine and taurine (Sigma) were made up fresh daily in standard external bathing solution.
Single-channel recording
Single channels were recorded from outside-out patches pulled from HEK 293 cells expressing the homomeric α1 GlyR. Patches were voltage clamped at −100 mV and currents were recorded using an Axopatch 1D (Axon Instruments) amplifier with a DB-1 electrode holder (G23 Instruments, University College London) at a bandwidth of 10 kHz and stored on a modified digital audio tape recorder (DAT200, Vetter Instruments). Upon playback, the single-channel data were low-pass filtered at 2.58 kHz (−3 dB, 8-pole Bessel filter) to give a summed filter frequency of 2.5 kHz, and digitised at 25 kHz (DigiData 1200 ADC interface, Axon Instruments). Single-channel events were analysed by the method of time-course fitting with the program SCAN (Colquhoun & Sigworth, 1995, http://www.ucl.ac.uk/Pharmacology/dcpr95.html). In some recordings, simultaneous openings of multiple channels occurred and these sections were excised from the analysis. To prevent length-biased sampling from affecting the distribution of dwell times, analysis was performed only on those recordings in which less than 10 % of the openings were excised.
From the list of fitted events produced by SCAN, dwell time and amplitude distributions were assembled and analysed using the program EKDist (D. Colquhoun, http://www.ucl.ac.uk/Pharmacology/dcpr95.html). A fixed resolution of 40 μs was imposed upon all dwell times before analysis. This resolution was arrived at using a false-event criterion of less than 10−12, which takes into account the pre-filtering, amplitude of the full opening and baseline root mean square (r.m.s.) noise (Colquhoun & Hawkes, 1994). Amplitude histograms were assembled from events longer than 2.5 times the filter rise time and fitted with Gaussian distributions by the method of maximum likelihood. Histograms of the open period and shut time distributions were displayed using logarithmic bin widths and the square root of the event frequency (Sigworth & Sine, 1987), and fitted with a mixture of exponential densities by the method of maximum likelihood (Colquhoun & Sigworth, 1995). From the fits, the overall mean duration was calculated as Σaiτi, for areas ai and time constants τi of each exponential component. Open periods are defined as durations between two adjacent shut times (each > 40 μs) where the channel appeared to be continuously open, regardless of any transitions between different open levels. Only those changes in amplitude greater than 0.9 pA were considered as transitions to a different level and contributed a value to the amplitude distribution. Changes in amplitude less than 0.9 pA were concatenated into a single open period where the amplitude was calculated as the mean of the individual open event amplitudes weighted by their duration.
Bursts were defined as groups of openings containing short gaps less than a critical duration, tcrit, which was calculated by the method of equal percentage of misclassified gaps (Colquhoun & Sigworth, 1995) between τ2 and τ3 of the fitted shut time distributions. Values of tcrit were for glycine 1.235 ± 0.079 ms (mean ±s.e.m.; range 0.945–1.549 ms), for β-alanine 0.933 ± 0.071 ms (range 0.697–1.135 ms), and for taurine 1.516 ± 0.698 ms (range 0.492–4.282 ms). For estimation of microscopic rates involved in the opening of the channel (β) and dissociation rate (k−1) for each agonist, a simple modified del Castillo & Katz (1957) linear model was assumed, with three equivalent ligand binding reactions leading to a single open state (see also Twyman & Macdonald, 1991; Lewis et al. 1998). An approximate correction for missed events was done in the manner of Colquhoun & Sakmann (1985), with the mean length of gaps within bursts, tg, being the total shut time < tcrit divided by the total number of shut events < tcrit, obtained from the fitted shut time distributions. The mean number of shut periods per burst, ng, is the total number of shut events < tcrit (from the fitted shut time distribution) divided by the number of long bursts (composed of τ2 and τ3) from the fitted burst distributions. Therefore:
| (1) |
and
| (2) |
Macropatch recordings
Excised outside-out macropatches (containing 20–200 channels) were voltage clamped at −75 mV and currents were recorded using an Axopatch 200A amplifier and a DigiData 1200 AD converter (both Axon Instruments). Data were digitised at 100 kHz (pClamp software, Axon Instruments) and filtered at 10 kHz with an interposed 8-pole Bessel filter (Frequency Devices). Rapid ligand exchange techniques, as described previously (Lavoie et al. 1997), were used to provide discrete applications of various concentrations of agonist to outside-out patches excised from HEK 293 cell membranes. Briefly, a double-lumen glass tube (thin septum theta glass tube pulled to a tip diameter of 50–100 μm; R and D Scientific Glass Co.) was used to provide adjacent streams of solutions with a small (4–6 μm) interface between them. Solution exchange at excised patches was achieved by activation of a piezoelectric transducer (Burleigh Instruments) that translated the solution interface ∼40 μm laterally to expose the patch to the experimental solution. Reproducible and complete exchange was achieved within 100–150 μs. Open-electrode tip potentials were measured at the conclusion of each patch experiment to confirm adequacy of exchange rates. Application durations were programmed (pClamp 6.0, Axon Instruments) for multiple pulse (< 1 ms) or step (50 or 500 ms) application protocols, which were then averaged to improve signal-to-noise ratios. Ensemble averages of sequential current responses of the same patch were obtained using locally written software (A. McClellan; Matlab, Mathworks). Rise time was calculated as the time elapsed between 10 % and 90 % of the peak current amplitude and reported as mean ±s.e.m. Least squares multi-exponential curve fitting of the current decay phase was performed using SigmaPlot 4.0 (SPSS, Inc.).
Statistics
All comparisons of fitted parameters or observed parameters for each of the agonists were done using a randomisation test (RANTEST, D. Colquhoun, http://www.ucl.ac.uk/Pharmacology/dc.html).
RESULTS
Rapid applications of agonist to macropatches
The time course of activation and relaxation following rapid application of agonist to patches containing a population of GlyRs (20–200 receptors) was investigated over a range of concentrations for each agonist. Typical responses evoked by prolonged (50 ms) applications of low (100 μm) and high (30 mm) concentrations of glycine, β-alanine and taurine are shown in Fig. 1A, where responses have been normalised to identify concentration-dependent differences in activation. The activation rate was measured as the 10–90 % rise time. Plotting the 10–90 % rise time as a function of agonist concentration (Fig. 1B) illustrates no significant differences in activation rate between the agonists at low concentrations. For example, activation times for 100 μm glycine, β-alanine and taurine were 9.35 ± 1.07 ms (n = 8), 10.34 ± 0.61 ms (n = 9) and 11.50 ± 2.04 ms (n = 7), respectively. However, the relationship between the 10–90 % rise time and concentration is not linear. At concentrations of 10 mm and greater, the rise times appear to reach a minimum. At the highest agonist concentrations used (30 mm) the 10–90 % rise times were well separated, with the rise time in the presence of glycine being faster (0.26 ± 0.06 ms) than that for β-alanine (0.47 ± 0.07 ms) and taurine (1.01 ± 0.18 ms). In this case, it is reasonable to assume that the agonist binding rates in any underlying kinetic scheme are in rapid pre-equilibrium upon application of 30 mm of agonist. The observed rate of activation (kobs) may then be approximated as a first-order reaction rate between two states (an open state and a closed state) such that:
| (3) |
where kop is the rate of channel opening and kcl is the rate of channel closing. Estimates for kobs can be derived from the 10–90 % rise time at 30 mm agonist concentration by multiplying the reciprocal of the rise times by a factor of 2.2, representing 80 % of the total time required for activation (i.e. 10–90 % rise time). The estimates of kobs obtained in this manner are 8500 s−1, 4700 s−1 and 2200 s−1, for glycine, β-alanine and taurine, respectively. This suggests that there are differences in the channel opening and/or closing rates for each agonist that warrant further investigation with single-channel analysis. At low agonist concentrations, the activation is relatively slow and would be largely influenced by the agonist association rate, n[A]k+1, where [A] is the agonist concentration, n is the number of ligand binding sites, and assuming [A]k+1 << kop. The similarity of the 10–90 % rise times for glycine, β-alanine and taurine at low concentrations suggests that there is very little difference in the association rate for each of the agonists. Using the rate of rise at 10 μm glycine (90 ms), an estimate of 0.5 × 10⁶m−1 s−1 was obtained for the association rate (assuming five equivalent ligand binding sites; see Discussion), although this is expected to be an underestimation.
Figure 1. Rise time of current onset.
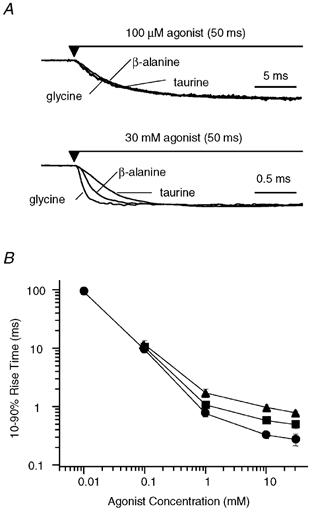
A, examples of macropatch currents recorded in response to the rapid application of 100 μm or 30 mm of each of the agonists glycine, β-alanine and taurine. The currents were normalised in each case to allow comparison of the time course of current onset. All three agonists showed an almost identical onset at 100 μm, while application of 30 mm of each agonist revealed distinct differences in onset, with the rate of rise for glycine > β-alanine > taurine. B, the mean 10–90 % rise time was determined for glycine (•), β-alanine (▪) and taurine (▴) over a range of concentrations. At concentrations greater than 10 mm, the rise time appears to reach a minimum for each agonist. This highlights the differences in rise time observed for each agonist at high concentrations (30 mm).
Relaxation differs between agonists
We compared the time course of current relaxation resulting from a brief (< 1 ms) application of 1 mm glycine, β-alanine or taurine onto macropatches. As shown in Fig. 2A, the application of each of these agonists resulted in a different relaxation time course, with the current responses to both β-alanine and taurine returning to baseline in a much shorter time than glycine. The relaxation from the peak response was found to be bi-exponential for glycine (τshort= 8.9 ± 0.6 ms, amplitude 51 ± 3.4 %; τlong= 48.5 ± 4.2 ms, amplitude 49 ± 3.3 %, n = 18), but mono-exponential for β-alanine and taurine. The weighted average relaxation time constant for glycine was 27.1 ± 2.4 ms, which was approximately 9- and 12-fold slower than the mean time constants for β-alanine (3.0 ± 0.3 ms, n = 5) and taurine (2.2 ± 0.2 ms, n = 8), respectively (Fig. 2B).
Figure 2. Current relaxation following brief applications of agonists.
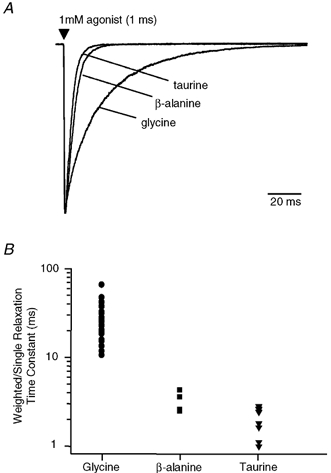
A, examples of currents obtained in response to brief (1 ms) applications of glycine, β-alanine and taurine, from the same patch. The current relaxation has a double-exponential time course for glycine and a very much faster single-exponential time course for β-alanine and taurine. The currents were normalised to the peak of the glycine current to allow comparison of the relaxation time course. B, a scatter plot of the time constants obtained from the exponential fits of the relaxation currents for each agonist (1 ms pulse of 1 mm agonist). The mean of the time constants obtained for glycine (•) is 27.1 ± 2.2 ms (n = 18), for β-alanine (▪) is 3.0 ± 0.3 ms (n = 5) and for taurine (▾) is 2.2 ± 0.2 ms (n = 8). In the case of glycine, the mean weighted time constant is shown.
Step applications of each agonist (1 mm) onto macropatches produced current responses that showed very little decay in the current over the 50 ms duration of the step (Fig. 3A). When the current relaxations from 1 ms applications of agonist (1 mm) were normalised and aligned with those from 50 ms step applications, little difference was observed in the time course of relaxation (Fig. 3A). Sequential applications of a saturating concentration of glycine (30 mm) for 1 ms, 50 ms and 2 s also showed an identical time course of relaxation when overlaid (Fig. 3B), even though there was an approximately 50 % decay from the peak current during the 2 s application. These results suggest that differences in the current relaxation observed for glycine, β-alanine and taurine are unlikely to be due to differences in desensitisation between the three agonists.
Figure 3. Influence of desensitisation on current relaxation.
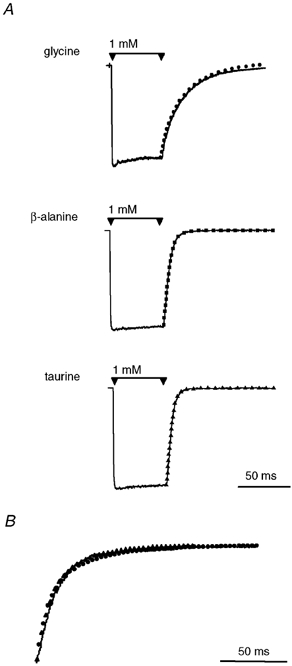
A, examples of currents recorded in response to rapid application of 1 mm of each agonist for 50 ms (continuous traces). Superimposed on these traces are the normalised responses recorded from a 1 ms pulse of the agonist (symbols) from the same patch. For each agonist, there is little difference in the time course of relaxation between a 50 ms step and a 1 ms pulse. B, the time course of relaxation is identical for increasingly longer applications of 30 mm glycine. Shown here are normalised relaxation currents from sequential applications of glycine for 1 ms (continuous line), 50 ms (•) and 2 s (▴), which overlay almost exactly.
Single-channel properties of the α1 GlyR
Single-channel recordings were made from outside-out patches in the presence of approximately equipotent concentrations of glycine (1 μm), β-alanine (3 μm) or taurine (10 μm), as determined from whole-cell concentration-response curves (Lynch et al. 1997). Each data set was obtained from separate patches, at a holding potential of −100 mV. Examples of the single-channel recordings obtained are shown in Fig. 4. It was apparent from visual inspection of the records that the amplitude of events was very similar in the presence of each of the agonists. The distribution of amplitudes and dwell times were examined in more detail.
Figure 4. Examples of single-channel recordings.
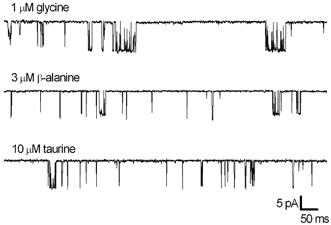
Openings are downward deflections in the traces shown. Recordings were made from outside-out patches with approximately equipotent concentrations of glycine (1 μm), β-alanine (3 μm) and taurine (10 μm), at a holding potential of −100 mV, filtered at 2.5 kHz. The examples shown here were obtained from three separate patches.
Single-channel amplitude distributions
As has been previously described, the α1 homomeric GlyR displays a number of sub-levels in the amplitude distributions (Takahashi et al. 1992; Bormann et al. 1993). We investigated whether the distribution of fitted amplitudes was affected by the choice of agonist. From the recordings presented here, each patch recording typically had one or two main amplitude levels that accounted for approximately 80 % of the fitted amplitudes (Fig. 5A). The main amplitudes were well defined with means of 9.3 ± 0.3 and 9.9 ± 0.3 pA for glycine, 9.5 ± 0.1 and 10.4 ± 0.2 pA for β-alanine, and 9.4 ± 0.2 and 10.3 ± 0.1 pA for taurine. The remaining amplitude levels were less well defined, often with larger standard deviations of the Gaussian component fitted to the peak. Usually there were only two or three sub-levels observed in a recording, though in some cases there were as many as six. These characteristics were consistent with all three of the agonists used. The distribution of the fitted amplitudes was not influenced by the concentration glycine applied to the patches. At 1 μm glycine, 76.7 ± 8.3 % of the fitted amplitudes were between 6 and 10 pA and upon changing to 10 μm glycine, 79.5 ± 6.2 % (n = 5) of the fitted amplitudes were within this range. A summary of the fitted amplitude distributions is shown in Fig. 5B, indicating each of the sub-levels and highlighting the main components that could be fitted to each individual record. It is clear that no distinction can be made between glycine, β-alanine or taurine on the basis of the amplitude distributions for each agonist. Thus, in our efforts to identify the kinetic differences between each agonist, we decided to perform the analysis of dwell times without distinguishing between the conductance levels.
Figure 5. Fitted amplitude distributions.
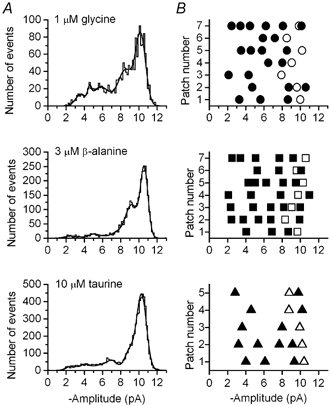
A, the distribution of fitted amplitudes was similar for glycine, β-alanine and taurine. The majority of events were at the larger amplitudes, which tended to be more defined distributions, and the smaller amplitudes were less well-defined peaks. All recordings were made at a holding potential of −100 mV. B, a summary of the amplitudes identified from all single-channel recordings is shown in the right-hand column for glycine (circles), β-alanine (squares) and taurine (triangles). In each case the open symbols represent the fitted component with the largest relative area and the filled symbols the minor components that could be reasonably fitted. There were no obvious differences seen in the amplitudes between the three agonists. The fitted parameters in A are: for glycine, 3.5 pA (5.7 %), 4.6 pA (2.6 %), 5.8 pA (19.4 %), 8.5 pA (31.2 %), 10.2 pA (41.1 %); for β-alanine, 2.5 pA (2.2 %), 3.4 pA (0.1 %), 5.1 pA (5.1 %), 7.7 pA (7.7 %), 9.2 pA (36.1 %), 10.6 pA (48.8 %); for taurine, 2.6 pA (3.5 %), 4.1 pA (5.1 %), 5.5 pA (3.4 %), 6.5 pA (3.1 %), 7.1 pA (6.8 %), 9.0 pA (15.8 %), 10.3 pA (62.2 %).
Distribution of open periods
For each of the three agonists, the open period distributions were fitted with a mixture of three exponential densities (Fig. 6A). The fitted exponential time constants obtained were remarkably similar for all three of the agonists, with mean time constants of approximately 0.12 ms, 0.65 ms and 3 ms (Table 1). These mean time constants were not associated with a particular conductance level, as open period distributions compiled for just the largest amplitudes (> 8 pA) could also be fitted with a mixture of three exponentials with the same mean time constants (data not shown). The overall mean open time was calculated for each fitted distribution, and the mean of these values was 1.093 ± 0.155 ms (n = 7) for glycine, 0.911 ± 0.307 ms (n = 6) for β-alanine and 0.904 ± 0.148 ms (n = 5) for taurine (no significant difference; P > 0.05). The similarity of the overall mean open times for each agonist confirms that the agonist concentrations chosen (1 μm glycine, 3 μmβ-alanine and 10 μm taurine) are indeed equipotent. The three exponential densities required to describe the open period distributions indicate that there must be at least three distinct open states in any underlying kinetic scheme.
Figure 6. Dwell time distributions.
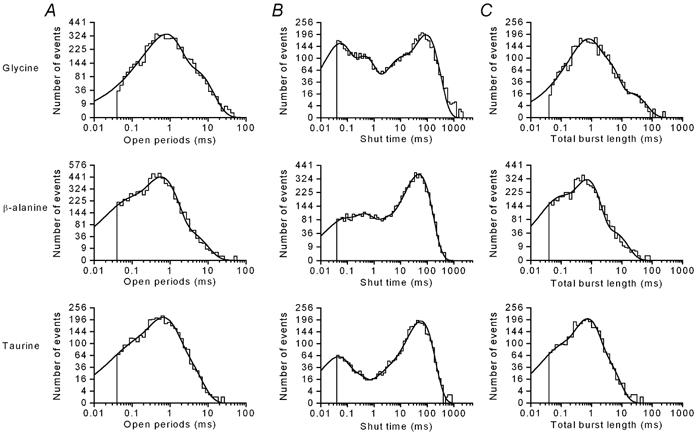
Histograms of open periods (A), shut times (B) and total burst lengths (C) were constructed from 5489 events in the presence of 1 μm glycine, 6960 events in the presence of 3 μmβ-alanine, and 3328 events in the presence of 10 μm taurine. All shut time distributions were fitted with a mixture of four exponentials, and both the distribution of open periods and total burst lengths were fitted with a mixture of three exponentials (continuous curves). The fitted parameters, listed as exponential time constants with the relative areas in parentheses, are as follows. Open periods: glycine, 0.134 ms (1.7 %), 0.712 ms (71.6 %), 3.94 ms (26.8 %); β-alanine, 0.050 ms (19.5 %), 0.554 ms (71.7 %), 2.66 ms (8.8 %); taurine, 0.060 ms (13.4 %), 0.565 ms (62.6 %), 1.82 ms (24.0 %). Shut times: glycine, 0.044 ms (26.8 %), 0.391 ms (20.2 %), 6.615 ms (12.0 %), 89.36 ms (41.0 %); β-alanine, 0.047 ms (9.0 %), 0.324 ms (14.7 %), 1.64 ms (8.1 %), 47.4 ms (68.2 %); taurine, 0.039 ms (18.2 %), 0.171 ms (7.7 %), 2.45 ms (3.6 %), 57.38 ms (70.5 %). Total burst length: glycine, 0.138 ms (1.1 %), 0.605 ms (54.0 %), 2.56 ms (37.9 %), 18.4 ms (7.0 %); β-alanine, 0.058 ms (24.7 %), 0.671 ms (66.5 %), 4.39 ms (8.8 %); taurine, 0.054 ms (15.2 %), 0.649 ms (64.2 %), 2.36 ms (20.6 %).
Table 1.
Mean fitted exponential densities
| Glycine (n=7) | β-Alanine (n=6) | Taurine (n=5) | |
|---|---|---|---|
| Shut times | |||
| τ1 (ms) | 0.074 ± 0.011 | 0.052 ± 0.005 | 0.054 ± 0.008 |
| (%) | 24 ± 4 | 10 ± 3 | 19 ± 4 |
| τ2 (ms) | 0.461 ± 0.043 | 0.372 ± 0.023 | 0.695 ± 0.376 |
| (%) | 30 ± 6 | 17 ± 3 | 11 ± 2 |
| τ3 (ms) | 19.6 ± 10.9 | 3.5 ± 0.7 | 18.5 ± 8.0 |
| (%) | 18 ± 4 | 9± 1 | 29 ± 13 |
| τ4 (ms) | 192.1 ± 65.6 | 51.9 ± 12.1 | 75.9 ± 24.2 |
| (%) | 21 ± 5 | 58 ± 10 | 41 ± 15 |
| τ5 (ms)* | 763 ± 625 | 497 | n.d. |
| (%) | 22 ± 14 | 38 | |
| Open times | |||
| τ1 (ms) | 0.157 ± 0.046 | 0.120 ± 0.030 | 0.114 ± 0.045 |
| (%) | 21 ± 6 | 27 ± 5 | 21 ± 6 |
| τ2 (ms) | 0.845 ± 0.149 | 0.537 ± 0.015 | 0.658 ± 0.084 |
| (%) | 64 ± 4 | 62 ± 4 | 62 ± 5 |
| τ3 (ms) | 3.41 ± 0.57 | 2.58 ± 0.18 | 2.97 ± 0.51 |
| (%) | 14 ± 3 | 10 ± 4 | 17 ± 5 |
| Burst durations | |||
| τ1 (ms) | 0.085 ± 0.021 | 0.139 ± 0.050 | 0.139 ± 0.066 |
| (%) | 15 ± 7 | 35 ± 7 | 27 ± 8 |
| τ2 (ms) | 0.550 ± 0.077 | 0.724 ± 0.108 | 1.12 ± 0.39 |
| (%) | 43 ± 4 | 54 ± 5 | 59 ± 6 |
| τ3 (ms) | 3.18 ± 0.51 | 4.11 ± 0.64 | 4.36 ± 0.82 |
| (%) | 36 ± 6 | 11 ± 3 | 14 ± 3 |
| τ4 (ms)** | 18.34 ± 3.89 | 11.2 | — |
| (%) | 6 ± 2 | 0.9 | |
The numbers shown are the means ±s.e.m. for each parameter, n.d., not determined.
This time constant was only seen in two patches out of eight for glycine, and in only one patch out of seven for β-alanine.
This time constant was only seen in one patch out of six for β-alanine.
Distributions of shut times
For each of the agonists, the shut time distributions were generally fitted with a mixture of four exponential densities. In three cases the distributions were fitted with five exponential densities: two recordings in the presence of glycine and one in the presence of β-alanine. In these cases, the additional exponential density described very long shut times. Examples of shut time distributions from individual recordings for each agonist are shown in Fig. 6B. In all cases, the two exponential densities with the shortest time constants (τ1 and τ2) showed the least variability between recordings with the same agonist (Table 1). The first of these time constants (τ1) was 74 μs for glycine, 52 μs for β-alanine and 54 μs for taurine, and while they are close to the imposed resolution (40 μs), they are still well defined. The second shortest time constant (τ2) was of the order of 20–30 times longer. With glycine, where a number of recordings were made over a limited range of different concentrations (0.5, 1, 5 and 10 μm), there was little concentration dependence in the shortest time constants. Although there were some differences in the relative areas of these exponential densities, this is probably a reflection of differences in the number of channels in the patch between recordings as much as the differences in agonist concentration. Together with visual inspection of the recordings, it was taken that the two shortest time constants were gaps within bursts of openings. Further interpretation of the shut time distribution was thought not to be informative because of the difficulties in knowing the number of receptors contributing to the activity in each recording.
Burst durations
Bursts were defined using a critical time, tcrit, that separated the two shortest time constants in the shut time distribution from the rest of the shut times (see Methods and description of shut times above). Using this criterion, the distribution of the total burst length was determined for each of the three agonists. Examples of the distribution of burst durations are illustrated in Fig. 6C. The total burst length distributions for glycine were able to be consistently fitted with a mixture of four exponential densities, while the distributions for β-alanine and taurine were fitted with three exponential densities. A summary of the fitted parameters is presented in Table 1. The glycine burst length distributions contained an additional exponential density with a mean time constant of 18.34 ± 3.89 ms (n = 7) and an area of 6.0 % of events. This long time constant was apparently absent from the β-alanine and taurine distributions except for a single β-alanine recording where there was a component with a time constant of 11.2 ms, but which represented less than 1 % of events. The additional exponential component for glycine distributions is reflected in the overall mean burst lengths, where that for glycine (2.28 ± 0.45 ms) was significantly longer than for β-alanine (0.846 ± 0.099 ms) or taurine (1.24 ± 0.28 ms; P = 0.02).
At the low concentrations of agonist used for single-channel recordings, a large proportion of the openings occurred as isolated openings. When the geometric distributions of the number of openings per burst were constructed for each recording, in all cases they were fitted with two components (Fig. 7A). There was a very dominant component close to unity for all three agonists, which accounted for between 56 and 94 % of bursts. This indicates that these are really single openings without any missed short gaps (Colquhoun & Sakmann, 1985). The mean number of openings per burst obtained from the fitted geometric distributions for glycine (n = 7) were 1.23 ± 0.03 (78 ± 5 %) and 4.37 ± 0.5 (22 ± 5 %); for β-alanine (n = 6) 1.09 ± 0.01 (88 ± 3 %) and 2.82 ± 0.32 (12 ± 3 %); for taurine (n = 5) 1.16 ± 0.04 (90 ± 3 %) and 2.28 ± 0.07 (10 ±3 %). The distributions of open times in bursts composed of only one opening (Fig. 7B) were constructed. All of these distributions were fitted with a mixture of three exponential densities with time constants that were very similar for each of the agonists (τ1∼ 0.1 ms, τ2∼ 0.5 ms and τ3∼ 2 ms; see Table 2). The relative areas of each exponential component were also very similar for each agonist, except for the exponential with the fastest time constant (τ1), where the relative area was slightly larger for β-alanine than for glycine and taurine (40 ± 9 % versus 25 ± 7 % and 24 ± 7 %, respectively). The overall mean burst length with a single apparent opening was 616 ± 119 μs for glycine, 462 ± 38 μs for β-alanine and 707 ± 120 μs for taurine (not significantly different, P = 0.27). These data provide additional support for at least three open states in any underlying kinetic scheme.
Figure 7. Distributions of bursts with a single opening.
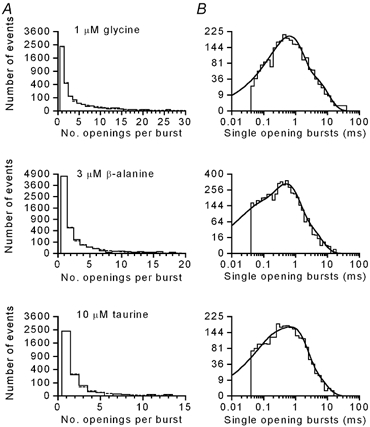
A, it was apparent from the distribution of the number of openings per burst that there was a major component of bursts composed of a single opening. For glycine, β-alanine and taurine, the number of openings per burst was fitted with a mixture of two geometric distributions (shown as a dashed curve, except where it coincides with the histogram). The fitted parameters are: glycine, 1.09 (87.7 %), 2.37 (12.2 %); β-alanine, 1.20 (87 %), 3.97 (13 %); taurine, 1.11 (93.6 %), 2.13 (6.3 %). B, the distribution of open times from bursts composed of a single opening could be fitted with a mixture of three exponentials (continuous curves) for glycine, β-alanine and taurine. The fitted parameters are: glycine, 0.33 ms (2.9 %), 0.61 ms (78.3 %), 2.85 ms (18.9 %); β-alanine, 0.04 ms (14.6 %), 0.46 ms (56.3 %), 1.40 ms (29.1 %); taurine, 0.04 ms (21 %), 0.47 ms (69.8 %), 1.84 ms (9.2 %).
Table 2.
Distribution of bursts with a single apparent opening
| Glycine (n =7) | β-Alanine (n =6) | Taurine (n =5) | |
|---|---|---|---|
| τ1 (ms) | 0.120 ± 0.043 | 0.133 ± 0.048 | 0.102 ± 0.047 |
| Area (%) | 25 ± 7 | 40 ± 9 | 24 ± 7 |
| τ2 (ms) | 0.591 ± 0.060 | 0.565 ± 0.087 | 0.587 ± 0.079 |
| Area(%) | 54 ± 8 | 54 ± 7 | 61 ± 6 |
| τ3 (ms) | 1.82 ± 0.34 | 2.56 ± 0.52 | 2.33 ± 0.30 |
| Area(%) | 21 ± 8 | 7±3 | 15 ± 5 |
| Overall mean (ms) | 0.616 ± 0.119 | 0.462 ± 0.380 | 0.707 ± 0.120 |
The numbers shown are the means ± S.e.m. for each parameter.
An estimate of the true number of bursts with a single opening was obtained from the area under the scaled probability density function fitted to the distribution of single-opening bursts, and this was expressed as a percentage of the true number of bursts estimated in a similar manner from the distribution of all bursts. This analysis showed that at approximately equipotent concentrations of agonist there was little difference between agonists in the percentage of bursts composed of a single opening (glycine 83.6 ± 3.9 %, n = 3; β-alanine 87.3 ± 0.7 %, n = 5; taurine 86.2 ± 4.5 %, n = 4). As would be expected, these data are consistent with those obtained from the geometric distribution of the number of openings in a burst. From data collected at 10 μm glycine, the percentage of bursts with single openings decreased to 65.5 ± 9.7 % (n = 3). This indicates that, at least for glycine, more complex burst structures occur at higher agonist concentrations. However, the distribution of single-opening bursts obtained here at low agonist concentrations provides important insights as to the independence of the open states (see Discussion).
DISCUSSION
In this study we describe the response of homomeric α1 GlyRs to the agonists glycine, β-alanine and taurine, using a combination of rapid applications to macropatches and steady-state single-channel recordings. This provides the means for estimating some of the key rate constants that distinguish between the action of glycine, β-alanine and taurine. As the α1 GlyR is a homo-pentameric complex and each subunit is able to contribute an agonist binding site, it is assumed here that there are five equivalent agonist binding sites on the receptor complex. However, it is not expected that all five binding sites need to be occupied prior to channel opening. There is good evidence from laser pulse photolysis of caged agonists released onto homomeric α1 GlyRs that three agonist binding sites need to be occupied before the receptor is activated (Grewer, 1999). In contrast, for native GlyRs recorded from Mauthner cells of zebra fish, only two of the three likely binding sites are required to be occupied to activate the receptor (Legendre, 1998), which is consistent with the native receptor being heteromeric, and composed of three α1 and two β subunits (Langosch et al. 1988).
Interpretation in terms of a kinetic scheme
Previous interpretations of GlyR kinetics have, for simplicity, used a minimal linear kinetic scheme that takes account of the required number of binding steps but compresses the channel opening behaviour into a single open state (Walstrom & Hess, 1994; Grewer, 1999; Laube et al. 2000). Legendre (1998) has proposed a linear scheme incorporating two open states and a reluctant gating step to account for the desensitisation seen during long applications of agonist, particularly glycine. However, as was initially illustrated by Twyman & Macdonald (1991), any realistic kinetic scheme for the GlyR should have at least three open states, as indicated by the open time distribution. A more recent study by Beato et al. (2002), with better time resolution, identified four exponential components in the open period distributions and proposed a scheme with five open states, such that openings can occur from receptor complexes with between one and five agonist molecules bound. Another feature that any scheme needs to account for is that the exponential time constants of the open period distributions are independent of the agonist concentration, with only the relative areas of each exponential component changing with increases in agonist concentration. This has been demonstrated for native GlyRs from cultured mouse spinal neurones (Twyman & Macdonald, 1991) and recombinant homomeric α1 GlyRs from zebra fish (Fucile et al. 1999), and confirmed across a greater concentration range with recombinant rat homomeric α1 GlyRs (Beato et al. 2002). Concentration-independent time constants are a prediction of kinetic schemes where the open states are not directly connected by agonist binding steps but occur independently from differently liganded states of the receptor complex (Beato et al. 2002). A minimal scheme that addresses these characteristics is shown below (Scheme 1):
Scheme 1.
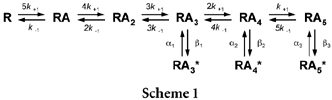
In this scheme, R is the receptor, A is the agonist molecule, the number of agonist molecules bound is indicated by the subscript, and open states are indicated by an asterisk. The homomeric α1 GlyR is also characterised by the number of different conductance levels that have been described (Bormann et al. 1993; Moorhouse et al. 1999). As we found that the choice of activating agonist did not influence the distribution of the conductance levels, they were not explored further in this study. In determining the kinetic differences between glycine, β-alanine and taurine in the activation of the GlyR, comparisons were made of those rates that would influence the efficacy and the affinity of each agonist. Here, these terms have their usual meaning, with efficacy (E) defined as the ratio of the channel opening rate and the closing rate (E =β/α), and affinity as a measure of the equilibrium dissociation constant (K =k−1/k+1).
Agonist efficacy
To compare the efficacy of the three agonists, an estimate of the opening and closing rates needed to be obtained. The single-channel analysis presented here supports a kinetic scheme such as that shown in Scheme 1, with three independent open states. In particular, the distribution of the number of openings per burst and the distribution of open times from bursts composed of single openings supports the presence of three independent open states. Thus, the mean time constants from the exponential distribution of bursts composed of single openings represent the mean open times for each of these three independent open states. Taking the reciprocal of each of the mean open times gives an estimate of the closing rates (α1, α2 and α3). In this manner, the estimates obtained in the presence of glycine are 8300 s−1, 1700 s−1 and 550 s−1 for each of the rates leaving the open states (α1, α2 and α3, respectively). Similarly, for β-alanine the estimates are 7500 s−1, 1800 s−1 and 390 s−1, and for taurine 9800 s−1, 1700 s−1 and 430 s−1 (α1, α2 and α3, respectively). These estimates of the closing rates do not differ significantly with the choice of applied agonist. We therefore propose that the channel closing rate constants for each of the open states (α1, α2 and α3; see Table 3) represent an intrinsic property of the receptor.
Table 3.
Estimates of kinetic parameters of activation of the α1 GlyR
| Glycine | β-Alanine | Taurine | |
|---|---|---|---|
| Results from macropatches | |||
| kop (s−1) | 8000 | 4200 | 1700 |
| k+l (M−1 s−1) | 0.5 × 10⁶ | 0.5 × 10⁶ | 0.5 × 10⁶ |
| Results from single channels | |||
| α1 (s1) | 8300 | 7500 | 9787 |
| α2 (s1) | 1700 | 1800 | 1700 |
| α3 (s1) | 550 | 390 | 430 |
| β (s1) | 3100 ± 340 | 1400 ± 300 | 1900 ± 500 |
| k−1 (s−1) | 1100 ± 180 | 2600 ± 250 | 4200 ± 1500 |
It is a more difficult task to estimate the opening rate (β) for each of the three proposed open states, as they cannot be uniquely identified from either macroscopic data or single-channel data. Simplifications need to be made if an estimate of the channel opening rate is to be made that is useful in comparing the action of glycine, β-alanine and taurine. The rate of channel activation following rapid application of agonist to macropatches can be approximated as a first-order reaction rate (eqn (3)) at saturating agonist concentrations, assuming that desensitisation is insignificant during the current rise. An estimate of the channel opening rate can be obtained from the 10–90 % rise times if there were a suitable estimate of the channel closing rate (kcl). It is well established that the open period distribution of the GlyR shows concentration dependence such that there is a decrease in the number of short openings and an increase in the number of longer openings with an increase in agonist concentration (Twyman & Macdonald, 1991; Fucile et al. 1999; Beato et al. 2002). Thus, it is likely that the open state associated with α3 (the longest openings observed here) will be the predominant open state occupied in the presence of saturating agonist concentrations. If we accept this assumption, then the reciprocal of α3 provides an estimate of kcl∼ 500 s−1 for all three agonists. This gives values for kop of 8000 s−1 for glycine, 4200 s−1 for β-alanine and 2200 s−1 for taurine. A ‘high concentration’ estimate of channel efficacy, E, is therefore obtained from the ratio of kop and kcl, which predicts relative efficacy ratios of 16, 8.4 and 3.4 for glycine, β-alanine and taurine, respectively. This suggests that glycine is a highly efficacious agonist, while β-alanine and taurine would be expected to show characteristics of partial agonists. The maximum open probability of the receptor activated by each of these agonists can be approximated as Po,max=E/(E+ 1), assuming a simple del Castillo-Katz mechanism (Colquhoun, 1998), giving values of 0.94 for glycine, 0.89 for β-alanine and 0.77 for taurine. The peak current at saturating concentrations of taurine is therefore expected to be 82 % of that elicited by glycine in the same patch or cell. From whole-cell concentration-response curves in HEK 293 cells, we have found the peak taurine current to be 86 ± 2 % (n = 6) of the peak glycine current (data not shown). Similar results have also been reported for outside-out patches containing α1 GlyRs, where fast applications of taurine at saturating concentrations give peak currents that are 86.8 ± 4 % of those for glycine (De Saint Jan et al. 2001).
An estimate of the channel opening rate can also be obtained using the approach of Colquhoun & Sakmann (1985) to analyse bursts of openings. Such an approach is not entirely satisfactory because in the present case there is no simple distinction between short and long bursts, but it is able to provide a rough estimate of the channel opening rate at low agonist concentrations, independent of the macropatch recordings. Assuming a simple linear scheme with three binding steps leading to a single open state, long bursts are defined as all bursts other then those within the fastest component of the burst length distribution. Estimates for β obtained in this manner (see Methods, eqn (2)) are 3100 ± 340 s−1 for glycine, 1400 ± 300 s−1 for β-alanine and 1900 ± 500 s−1 for taurine. The estimate of β for glycine is clearly faster than those obtained from β-alanine and taurine and is qualitatively similar to estimates of kop obtained from macropatches. The absolute differences in the estimated opening rates obtained from macropatches (kop) and single-channel analysis (β) reflect the fact that they were obtained at different agonist concentrations and that these single-value estimates are describing a process that is composed of three independent open states. Just as the overall mean open time is concentration dependent (Beato et al. 2002), these estimates can be considered ‘overall mean opening rates’, which are also expected to be concentration dependent in Scheme (1). This is because in Scheme (1), the relative contribution of the three opening rates to the ‘overall mean opening rate’ is determined by the concentration-dependent rates linking RA3, RA4 and RA5 in the scheme. That the estimates obtained here at high and low agonist concentration are different indicates that the individual opening rates (β1, β2 and β3) are not the same, and that a fast opening rate dominates at high agonist concentrations while a slower opening rate dominates at low concentrations.
Grewer (1999) determined the opening rate (kop) from the concentration dependence of the observed rate of rise (kobs) and found no difference between glycine and β-alanine. This is contrary to the differences obtained in the present study from rise times, although the opening rate for glycine is of a similar order of magnitude to that found by Grewer (1999). The closing rates (kcl) estimated by Grewer (1999) seem very slow and they would predict mean open times of 26 ms and 15 ms (for glycine and β-alanine, respectively). These are much longer open times than the estimates obtained here from single-channel recordings, where we have good time resolution to 40 μs. In other studies with much lower time resolution, such long openings represent a small fraction (less than 8 %) of all open events (Twyman & Macdonald, 1991; Takahashi et al. 1992; Laube et al. 2000). It is likely that the longer open times are a result of missed short shut times, which produces longer open times and fewer short open times.
Laube et al. (2000), investigating the mechanism of action of zinc upon the glycine receptor, also made comparisons between glycine and taurine, as zinc significantly potentiates responses evoked by taurine. A simple linear kinetic scheme with three binding sites leading to a single-opening state was used by Laube et al. (2000) to estimate the opening and closing rates for glycine from the burst durations. The estimate of the closing rate for glycine (α, 250–400 s−1) is, by the nature of the analysis, a mixture of the two longest open times observed in their recordings and comparable to the slowest closing rate estimated here from single-channel analysis (390–550 s−1, Table 3). The estimate for the channel opening rate in the presence of glycine (β, 3000–4000 s−1) was significantly reduced in the presence of taurine (900 s−1), which is qualitatively similar to what is described here.
Agonist affinity
Rapid application of low agonist concentrations to macropatches can be used to identify differences in agonist association and/or dissociation rates. At a concentration of 100 μm, the 10–90 % rise time for glycine, β-alanine and taurine converge. This indicates similar agonist association rates, since at sub-saturating agonist concentrations the 10–90 % rise time is primarily determined by rates of agonist binding and the rise time vs. concentration curves are expected to be parallel if there were differences in association rates. Grewer (1999) investigated the activation of homomeric α1 GlyRs using photolysis of caged glycine or β-alanine, and the values obtained with this technique show very little difference in the association rates for glycine (k+1, 0.9 ± 0.1 × 10⁷m−1 s−1) and β-alanine (k+1, 0.8 ± 0.1 × 10⁷m−1 s−1). As our results indicate little difference in association rate between agonists, we would predict that the association rate for taurine would be of the same order of magnitude (∼107m−1 s−1). Grewer (1999) also determined the equilibrium dissociation constant for glycine (160 μm) and β-alanine (360 μm), which would indicate that the microscopic dissociation rate for β-alanine (∼2880 s−1) is 2-fold greater than that for glycine (∼1440 s−1). From our single-channel data, an estimate of the dissociation rate constant for agonist molecules was obtained by analysis of bursts (see Methods, eqn (1); Colquhoun & Sakmann, 1985), with a value of 1100 ± 180 s−1 for glycine, 2600 ± 250 s−1 for β-alanine and 4200 ± 1500 s−1 for taurine, suggesting β-alanine and taurine dissociate 2.5-fold and 4-fold faster, respectively, than glycine. These results are similar to those obtained by Grewer (1999). Other estimates of dissociation rates for glycine (∼200 s−1) and taurine (∼400 s−1) obtained by Laube et al. (2000) reflect these differences between agonists, although the values are an order of magnitude less than those estimated here. This is most likely to be due to differences in the analysis of bursts. Using the microscopic dissociation rate estimated here for taurine, we would predict an equilibrium dissociation constant of ∼460 μm. Thus, combining the data from Grewer (1999) and the present study, there is an ∼2.3-fold increase in the equilibrium dissociation constant for β-alanine (∼360 μm) compared with glycine (∼160 μm), and an ∼2.8-fold increase in that for taurine (∼460 μm), with these differences being entirely due to differences in the microscopic dissociation rate. These differences are consistent with the rightward shift in the concentration- response curves for β-alanine and taurine.
Contribution of desensitisation
We have shown that the current relaxations following rapid application of agonist for 1 ms are different for the three agonists investigated. Several factors are able to influence the time course of current relaxation, including the relative rates of channel opening and agonist dissociation (and thus mean burst length), and the contribution of any desensitisation. For example, recovery from fast desensitisation has been shown to slow the relaxation of GABAA currents following a brief pulse of agonist (Jones & Westbrook, 1995). Thus, the slower relaxation following glycine application may have been due to fast desensitisation that is not present when β-alanine or taurine are applied. We compared the relaxations following 1 and 50 ms applications for each agonist and found that there were no differences in the time course. Longer applications of glycine that would be expected to increase the occupancy of desensitised states had no effect upon the relaxation time course. In all our recordings from macropatches, fast desensitisation was not observed following application of any of the three agonists. Only a slow component of desensitisation was seen which resulted in less than a 10 % decrease in current during the 50 ms application. Fast desensitisation of the homomeric α1 GlyR has been shown by others to be more prominent with increased receptor density (Legendre et al. 2002) and with phosphorylation of the receptor (Gentet & Clements, 2002). In both of these studies, fast desensitisation was reported to prolong the current relaxation. The mean exponential time constants we obtained from fitting the relaxations following application of 1 mm glycine (8.9 ± 0.6 and 48.5 ± 4.2 ms) are comparable to those obtained by Legendre et al. (2002) following application of 3 mm glycine to macropatches that showed no fast desensitisation (6.2 ± 1.1 and 36.4 ± 15.5 ms). This suggests that under our experimental conditions, fast desensitisation was not a contributing factor and that the differences in the current relaxations observed for the three agonists are due to the differences in affinity and efficacy described above.
Comparisons with other receptors
Comparisons of agonist potency with other receptor complexes have described various mechanisms underlying the agonist action. At the muscle end-plate acetylcholine receptor (AChR; Colquhoun & Sakmann, 1985), ACh and its analogues displayed distinctly different exponential time constants for the burst distributions, and consequently distinct estimates of the closing rate, α, for each agonist. A comparison of ACh and DMPP (1,1-dimethyl-4-phenylpiperazinium) at the homomeric α7 nAChR (Anand et al. 1998) showed no differences in channel open times, but a distinct slowing of the activation rate for DMPP compared with ACh. Native α7 nAChRs show no differences in open time distributions between ACh and choline, but choline appears to dissociate faster from the receptor complex (Mike et al. 2000). As both the α7 nAChR and the α1 GlyR are homo-pentamers, it is interesting to note the parallels in the behaviour, particularly how the open time distributions are indifferent to the activating agonist. It is tempting to speculate that this is a characteristic of homomeric receptors where there are presumably five equivalent binding sites, in comparison to heteromeric receptors like the muscle end-plate AChR where there are two non-equivalent binding sites (Sine et al. 1990; Ohno et al. 1996).
Conclusion
The results of this study suggest that an appropriate kinetic scheme for the GlyR (Scheme 1) should contain at least three independent open states that have closing rates (α1, α2 and α3) that are intrinsic properties of the GlyR and opening rates (β) that are determined by the activating agonist (glycine, β-alanine or taurine). While the association rates of the three agonists are similar, their dissociation rates are different, which predicts equilibrium dissociation constants that are of the rank order glycine < β-alanine < taurine. By comparison, the estimates of efficacy give a rank order of glycine > β-alanine > taurine. As we begin to understand the tertiary structure of the GlyR and ligand-gated ion channels in general, these results are of fundamental importance to interpreting structure-function studies investigating effects at receptor binding and transduction sites within the receptor complex.
Acknowledgments
We thank Roy Twyman and Pascal Legendre for helpful discussions, and Neil Harrison for his technical advice. This work was supported by the NHMRC (Block Grant 993050 and Fellowship 157209) and the NIH (NINDS grant NS31519).
REFERENCES
- Anand R, Nelson ME, Gerzanich V, Wells GB, Lindstrom J. Determinants of channel gating located in the N-terminal extracellular domain of nicotinic alpha7 receptor. J Pharmacol Exp Ther. 1998;287:469–479. [PubMed] [Google Scholar]
- Beato M, Groot-Kormelink PJ, Colquhoun D, Sivilotti LG. Openings of the rat recombinant α1 homomeric glycine receptor as a function of the number of agonist molecules bound. J Gen Physiol. 2002;119:443–466. doi: 10.1085/jgp.20028530. [DOI] [PMC free article] [PubMed] [Google Scholar]
- Bormann J, Ründstrom N, Betz H, Langosch D. Residues within transmembrane segment M2 determine chloride conductance of glycine receptor homo- and hetero-oligomers. EMBO J. 1993;12:3729–3737. doi: 10.1002/j.1460-2075.1993.tb06050.x. [DOI] [PMC free article] [PubMed] [Google Scholar]
- Chen C, Okayama H. High-efficiency transformation of mammalian cells by plasmid DNA. Mol Cell Biol. 1987;7:2745–2752. doi: 10.1128/mcb.7.8.2745. [DOI] [PMC free article] [PubMed] [Google Scholar]
- Colquhoun D. Binding, gating, affinity and efficacy: The interpretation of structure-activity relationships for agonists and of the effects of mutating receptors. Brit J Pharmacol. 1998;125:924–947. doi: 10.1038/sj.bjp.0702164. [DOI] [PMC free article] [PubMed] [Google Scholar]
- Colquhoun D, Hawkes AG. The interpretation of single channel recordings. In: Ogden DC, editor. Microelectrode Techniques. The Plymouth Workshop Handbook. 2. Cambridge UK: The Company of Biologists; 1994. pp. 141–188. [Google Scholar]
- Colquhoun D, Sakmann B. Fast events in single-channel currents activated by acetylcholine and its analogues at the frog muscle end-plate. J Physiol. 1985;369:501–557. doi: 10.1113/jphysiol.1985.sp015912. [DOI] [PMC free article] [PubMed] [Google Scholar]
- Colquhoun D, Sigworth FJ. Fitting and statistical analysis of single-channel records. In: Sakmann B, Neher E, editors. Single-Channel Recording. 2. New York: Plenum Press; 1995. pp. 483–587. [Google Scholar]
- De Saint Jan D, David-Watine B, Korn H, Bregestovski P. Activation of human α1 and α2 homomeric glycine receptors by taurine and GABA. J Physiol. 2001;535:741–755. doi: 10.1111/j.1469-7793.2001.t01-1-00741.x. [DOI] [PMC free article] [PubMed] [Google Scholar]
- del Castillo J, Katz B. Interaction at endplate receptors between different choline derivatives. Proc Roy Soc B. 1957;146:339–356. doi: 10.1098/rspb.1957.0018. [DOI] [PubMed] [Google Scholar]
- Donato R, Nistri A. Relative contribution by GABA or glycine to Cl−-mediated synaptic transmission on rat hypoglossal motoneurons in vitro. J Neurophysiol. 2000;84:2715–2724. doi: 10.1152/jn.2000.84.6.2715. [DOI] [PubMed] [Google Scholar]
- Fucile S, De Saint Jan D, David-Watine B, Korn H, Bregestovski P. Comparison of glycine and GABA actions on the zebrafish homomeric glycine receptor. J Physiol. 1999;517:369–383. doi: 10.1111/j.1469-7793.1999.0369t.x. [DOI] [PMC free article] [PubMed] [Google Scholar]
- Gentet LJ, Clements JD. Binding site stoichiometry and the effects of phosphorylation on human α1 homomeric glycine receptors. J Physiol. 2002;544:97–106. doi: 10.1113/jphysiol.2001.015321. [DOI] [PMC free article] [PubMed] [Google Scholar]
- Gorman CM, Gies DR, McRay G. Transient production of proteins using an adenovirus tranformed cell line. DNA Prot Eng Tech. 1990;2:3–10. [Google Scholar]
- Grenningloh G, Schmieden V, Schofield PR, Seeburg PH, Siddique T, Mohandas TK, Becker C-M, Betz H. Alpha subunit variants of the human glycine receptor: primary structures, functional expression and chromosomal localisation of the corresponding genes. EMBO J. 1990;9:771–776. doi: 10.1002/j.1460-2075.1990.tb08172.x. [DOI] [PMC free article] [PubMed] [Google Scholar]
- Grewer C. Investigation of the α1-glycine receptor channel-opening kinetics in the submillisecond time domain. Biophys J. 1999;77:727–738. doi: 10.1016/S0006-3495(99)76927-4. [DOI] [PMC free article] [PubMed] [Google Scholar]
- Hussy N, Deleuze C, Pantaloni A, Desarménien MG, Moos F. Agonist action of taurine on glycine receptors in rat supraoptic magnocellular neurones: possible role in osmoregulation. J Physiol. 1997;502:609–621. doi: 10.1111/j.1469-7793.1997.609bj.x. [DOI] [PMC free article] [PubMed] [Google Scholar]
- Jones MV, Westbrook GL. Desensitized states prolong GABAA channel responses to brief agonist pulses. Neuron. 1995;15:181–191. doi: 10.1016/0896-6273(95)90075-6. [DOI] [PubMed] [Google Scholar]
- Kuhse J, Betz H, Kirsch J. The inhibitory glycine receptor: architecture, synaptic localization and molecular pathology of a postsynaptic ion-channel complex. Curr Opin Neurobiol. 1995;5:318–323. doi: 10.1016/0959-4388(95)80044-1. [DOI] [PubMed] [Google Scholar]
- Langosch D, Thomas L, Betz H. Conserved quaternary structure of ligand-gated ion channels: the postsynaptic glycine receptor is a pentamer. Proc Natl Acad Sci U S A. 1988;85:7394–7398. doi: 10.1073/pnas.85.19.7394. [DOI] [PMC free article] [PubMed] [Google Scholar]
- Laube B, Kuhse J, Betz H. Kinetic and mutational analysis of Zn2+ modulation of recombinant human inhibitory glycine receptors. J Physiol. 2000;522:215–230. doi: 10.1111/j.1469-7793.2000.t01-1-00215.x. [DOI] [PMC free article] [PubMed] [Google Scholar]
- Lavoie AM, Tingey JJ, Harrison NL, Pritchett DB, Twyman RE. Activation and deactivation rates of recombinant GABAA receptor channels are dependent on α-subunit isoform. Biophys J. 1997;73:2518–2526. doi: 10.1016/S0006-3495(97)78280-8. [DOI] [PMC free article] [PubMed] [Google Scholar]
- Legendre P. A reluctant gating mode of glycine receptor channels determines the time course of inhibitory miniature synaptic events in zebrafish hindbrain neurons. J Neurosci. 1998;18:2856–2870. doi: 10.1523/JNEUROSCI.18-08-02856.1998. [DOI] [PMC free article] [PubMed] [Google Scholar]
- Legendre P. The glycinergic inhibitory synapse. Cell Mol Life Sci. 2001;58:760–793. doi: 10.1007/PL00000899. [DOI] [PMC free article] [PubMed] [Google Scholar]
- Legendre P, Muller E, Badiu CI, Meier J, Vannier C, Triller A. Desensitization of homomeric α1 glycine receptor increases with receptor density. Mol Pharmacol. 2002;62:817–827. doi: 10.1124/mol.62.4.817. [DOI] [PubMed] [Google Scholar]
- Lewis TM, Sivilotti LG, Colquhoun D, Gardiner RM, Schoepfer R, Rees M. Properties of human glycine receptors containing the hyperekplexia mutation α1(K276E), expressed in Xenopus oocytes. J Physiol. 1998;507:25–40. doi: 10.1111/j.1469-7793.1998.025bu.x. [DOI] [PMC free article] [PubMed] [Google Scholar]
- Liu QR, López-Corcuera B, Mandiyan S, Nelson H, Nelson N. Cloning and expression of a spinal cord- and brain-specific glycine transporter with novel structural features. J Biol Chem. 1993;268:22 802–22 808. [PubMed] [Google Scholar]
- Liu QR, López-Corcuera B, Nelson H, Mandiyan S, Nelson N. Cloning and expression of a cDNA encoding the transporter of taurine and β-alanine in mouse brain. Proc Natl Acad Sci U S A. 1992;89:12 145–12 149. doi: 10.1073/pnas.89.24.12145. [DOI] [PMC free article] [PubMed] [Google Scholar]
- Lynch JW, Rajendra S, Barry PH, Schofield PR. Mutations affecting the glycine receptor agonist transduction mechanism convert the competitive antagonist, picrotoxin, into an allosteric potentiator. J Biol Chem. 1995;270:13 799–13 806. doi: 10.1074/jbc.270.23.13799. [DOI] [PubMed] [Google Scholar]
- Lynch JW, Rajendra S, Pierce KD, Handford CA, Barry PH, Schofield PR. Identification of intracellular and extracellular domains mediating signal transduction in the inhibitory glycine receptor chloride channel. EMBO J. 1997;16:110–120. doi: 10.1093/emboj/16.1.110. [DOI] [PMC free article] [PubMed] [Google Scholar]
- Mike A, Castro NG, Albuquerque EX. Choline and acetylcholine have similar kinetic properties of activation and desensitization on the α7 nicotinic receptors in rat hippocampal neurons. Brain Res. 2000;882:155–168. doi: 10.1016/s0006-8993(00)02863-8. [DOI] [PubMed] [Google Scholar]
- Moorhouse AJ, Jacques P, Barry PH, Schofield PR. The startle disease mutation Q266H, in the second transmembrane domain of the human glycine receptor, impairs channel gating. Mol Pharmacol. 1999;55:386–395. doi: 10.1124/mol.55.2.386. [DOI] [PubMed] [Google Scholar]
- Mori M, Gahwiler BH, Gerber U. β-Alanine and taurine as endogenous agonists at glycine receptors in rat hippocampus in vitro. J Physiol. 2002;539:191–200. doi: 10.1113/jphysiol.2001.013147. [DOI] [PMC free article] [PubMed] [Google Scholar]
- Ohno K, Wang HL, Milone M, Bren N, Brengman JM, Nakano S, Quiram P, Pruitt JN, Sine SM, Engel AG. Congenital myasthenic syndrome caused by decreased agonist binding affinity due to a mutation in the acetylcholine receptor epsilon subunit. Neuron. 1996;17:157–170. doi: 10.1016/s0896-6273(00)80289-5. [DOI] [PubMed] [Google Scholar]
- Oja SS, Saransaari P. Modulation of taurine release by glutamate receptors and nitric oxide. Prog Neurobiol. 2000;62:407–425. doi: 10.1016/s0301-0082(00)00005-8. [DOI] [PubMed] [Google Scholar]
- Racca C, Gardiol A, Triller A. Dendritic and postsynaptic localizations of glycine receptor α subunit mRNAs. J Neurosci. 1997;17:1691–1700. doi: 10.1523/JNEUROSCI.17-05-01691.1997. [DOI] [PMC free article] [PubMed] [Google Scholar]
- Rajendra S, Lynch JW, Schofield PR. The glycine receptor. Pharmacol Ther. 1997;73:121–146. doi: 10.1016/s0163-7258(96)00163-5. [DOI] [PubMed] [Google Scholar]
- Rajendra S, Vandenberg R, Pierce K, Cunningham A, French P, Barry P, Schofield P. The unique extracellular disulphide loop of the glycine receptor is a principal ligand binding element. EMBO J. 1995;14:2987–2998. doi: 10.1002/j.1460-2075.1995.tb07301.x. [DOI] [PMC free article] [PubMed] [Google Scholar]
- Saransaari P, Oja SS. Enhanced taurine release in cell-damaging conditions in the developing and ageing mouse hippocampus. Neurosci. 1997;79:847–854. doi: 10.1016/s0306-4522(97)00038-9. [DOI] [PubMed] [Google Scholar]
- Saransaari P, Oja SS. Characteristics of ischemia-induced taurine release in the developing mouse hippocampus. Neurosci. 1999;94:949–954. doi: 10.1016/s0306-4522(99)00384-x. [DOI] [PubMed] [Google Scholar]
- Schmieden V, Kuhse J, Betz H. Agonist pharmacology of neonatal and adult glycine receptor α subunits: identification of amino acid residues involved in taurine activation. EMBO J. 1992;11:2025–2032. doi: 10.1002/j.1460-2075.1992.tb05259.x. [DOI] [PMC free article] [PubMed] [Google Scholar]
- Shibanoki S, Kogure M, Sugahara M, Ishikawa K. Effect of systemic administration of N-methyl-d-aspartic acid on extracellular taurine level measured by microdialysis in the hippocampal CA1 field and striatum of rats. J Neurochem. 1993;61:1698–1704. doi: 10.1111/j.1471-4159.1993.tb09806.x. [DOI] [PubMed] [Google Scholar]
- Sigworth FJ, Sine SM. Data transformations for improved display and fitting of single-channel dwell time histograms. Biophys J. 1987;52:1047–1054. doi: 10.1016/S0006-3495(87)83298-8. [DOI] [PMC free article] [PubMed] [Google Scholar]
- Sine S, Claudio T, Sigworth F. Activation of Torpedo acetylcholine receptors expressed in mouse fibroblasts. Single channel current kinetics reveal distinct agonist binding affinities. J Gen Physiol. 1990;96:395–437. doi: 10.1085/jgp.96.2.395. [DOI] [PMC free article] [PubMed] [Google Scholar]
- Smith KE, Borden LA, Hartig PR, Branchek T, Weinshank RL. Cloning and expression of a glycine transporter reveal colocalization with NMDA receptors. Neuron. 1992a;8:927–935. doi: 10.1016/0896-6273(92)90207-t. [DOI] [PubMed] [Google Scholar]
- Smith KE, Borden LA, Wang CH, Hartig PR, Branchek TA, Weinshank RL. Cloning and expression of a high affinity taurine transporter from rat brain. Mol Pharmacol. 1992b;42:563–569. [PubMed] [Google Scholar]
- Takahashi T, Momiyama A, Hirai K, Hishinuma, Akagi H. Functional correlation of fetal and adult forms of glycine receptors with developmental changes in inhibitory synaptic receptor channels. Neuron. 1992;9:1155–1161. doi: 10.1016/0896-6273(92)90073-m. [DOI] [PubMed] [Google Scholar]
- Twyman RE, Macdonald RE. Kinetic properties of the glycine receptor main and sub-conductance states of mouse spinal cord neurones in culture. J Physiol. 1991;435:303–331. doi: 10.1113/jphysiol.1991.sp018512. [DOI] [PMC free article] [PubMed] [Google Scholar]
- Vandenberg RJ, Handford CA, Schofield PR. Distinct agonist and antagonist-binding sites on the glycine receptor. Neuron. 1992;9:491–496. doi: 10.1016/0896-6273(92)90186-h. [DOI] [PubMed] [Google Scholar]
- Walstrom KM, Hess GP. Mechanism for the channel-opening reaction of strychnine-sensitive glycine receptors on cultured embryonic mouse spinal cord cells. Biochem. 1994;33:7718–7730. doi: 10.1021/bi00190a027. [DOI] [PubMed] [Google Scholar]