Abstract
We used autofluorescence of mitochondrial flavoproteins to image cortical neural activity in the rat. Green autofluorescence in blue light was examined in slices obtained from rat cerebral cortex. About half of the basal autofluorescence was modulated by the presence or absence of O2 or glucose in the medium. Repetitive electrical stimulation at 20 Hz for 1 s produced a localized fluorescence increase in the slices. The amplitude of the increase was 27 ± 2 % (mean ± s.d., n = 35). Tetrodotoxin or diphenyleneiodonium, an inhibitor of flavoproteins, blocked the autofluorescence responses. The autofluorescence responses were not observed in slices perfused with calcium-, glucose- or O2-free medium. In the primary somatosensory cortex of rats anaesthetized with urethane (1.5 g kg−1, i.p.), an activity-dependent increase in autofluorescence of 20 ± 4 % (n = 6) was observed after electrical cortical stimulation at 100 Hz for 1 s, and an increase of 2.6 ± 0.5 % (n = 33) after vibratory skin stimulation at 50 Hz for 1 s applied to the plantar hindpaw. These responses were large enough to allow visualization of the neural activity without having to average a number of trials. The distribution of the fluorescence responses after electrical or vibratory skin stimulation was comparable to that of the cortical field potentials in the same rats. The fluorescence responses were followed by an increase in arterial blood flow. The former were resistant to an inhibitor of nitric oxide synthase, while the latter was inhibited. Thus, activity-dependent changes in the autofluorescence of flavoproteins are useful for functional brain imaging in vivo.
Functional brain imaging is a powerful tool for neuroscience. Among various techniques, optical recording of brain activity has the advantages that it can be performed with relatively simple instruments and that the spatial resolution achieved is excellent (Ebner & Chen, 1995). The optical recording is divided into the technique in which exogenous indicators are used, and so-called intrinsic signal recording (Ebner & Chen, 1995). Neural activity is intimately coupled with aerobic energy metabolism and O2 consumption (Fein & Tsacopoulos, 1988; Shibuki, 1989, 1990; Malonek & Grinvald, 1996). One of the underlying mechanisms detected by intrinsic signal recording is the deoxygenation of haemoglobin and the resulting reduction in red light reflection (Grinvald et al. 1986; Frostig et al. 1990; Malonek & Grinvald, 1996). This method does not require staining with a dye and is applicable to the clinical setting (Haglund et al. 1992; Cannestra et al. 1998; Sato et al. 2002). However, potential inaccuracies can arise from interference between the intrinsic signal and activity-dependent changes in cerebral blood flow (Vanzetta & Grinvald, 1999). Furthermore, the signal is of low amplitude and so response mapping and neural plasticity have often been difficult to demonstrate, especially beyond the primary cortical areas.
Local aerobic energy metabolism in the brain is also reflected as changes in the autofluorescence of endogenous compounds, such as NAD(P)H or flavoproteins. These properties of autofluorescence have been used to monitor the metabolic state of the brain during anoxia (Chance et al. 1962; Tomlinson et al. 1993), spreading depression (Mayevsky & Chance, 1974; Lothman et al. 1975; Haselgrove et al. 1990) or direct cortical stimulation (Rosenthal & Jöbsis, 1971; Lothman et al. 1975; Lewis & Schuette, 1976). Surprisingly, however, this classical knowledge has not been applied to the visualization of the dynamic metabolic changes that parallel stimulus-specific neural activity in vivo. Recent advances in the use of highly sensitive cooled CCD cameras and epifluorescence microscopes with a wide field of view enable us to capture very easily images of faint autofluorescence in the brain. Therefore, we realized that activity-dependent changes in the autofluorescence of flavoproteins, which are the major components of green autofluorescence in blue light (Benson et al. 1979) and can be observed without using harmful ultraviolet light, could potentially be useful for functional brain imaging. We tested this possibility in cerebral slices and in the somatosensory cortex of anaesthetized rats. Preliminary results from the present study have been published in an abstract form (Shibuki et al. 2001).
METHODS
Experiments in slices
The experiments in this study were approved by the ethics committee of Niigata University. Male Wistar rats (5–7 weeks old) were anaesthetized with ether. After the rats were deeply anaesthetized, brain temperature was reduced by immersing them for 3 min in ice-cold water, except for the nose. Immediately after decapitation, a block of brain tissue including the auditory cortex was dissected out. The location of the auditory cortex was determined to be that of area 41 of the temporal cortex (Krieg, 1946). Frontal slices (400 μm thick) of the auditory cortex were prepared from the block in an ice-cold medium using a microslicer (DTK-2000, Dosaka, Osaka, Japan). The composition of the medium was (mm): NaCl 124, KCl 5, NaH2PO4 1.24, MgSO4 1.3, CaCl2 2.4, NaHCO3 26 and glucose 10. This medium was continuously bubbled with 95 % O2 and 5 % CO2 for at least 1 h before use. Slices were incubated for more than 1 h in oxygenated medium maintained at room temperature (24 ± 1 °C). After the incubation, a slice was placed in a recording chamber perfused with the same medium at a flow rate of 1 ml min−1. The surface of the chamber was covered with 95 % O2 and 5 % CO2 to prevent the escape of O2 (Fig. 1A). In the chamber, the slice was placed on a membrane filter (H100A, Advantec, Tokyo, Japan). This hydrophilic polytetrafluoroethylene filter was permeable to the oxygenated perfusing medium, and became transparent in the medium (Seki et al. 1999, 2001). Green autofluorescence (λ= 520–560 nm) of the slices in blue light (472–488 nm) was observed with the aid of an inverted epifluorescence microscope (TE300, Nikon) with an objective lens (magnification: 4.0, numerical aperture: 0.2). Images of the autofluorescence (60 pixels × 64 pixels after binning) were recorded using a cooled CCD camera system (ARGUS/HiSCA, Hamamatsu Photonics, Hamamatsu, Japan). No averaging of trials was used in the experiments using slices.
Figure 1. Green autofluorescence of cerebral slices in blue light.
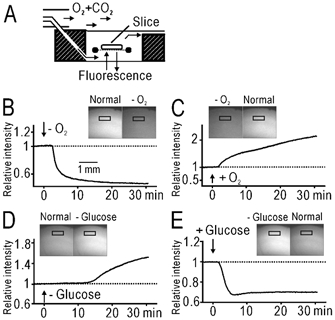
A, the recording chamber. B, basal autofluorescence before and during application of O2-free (–O2) medium. Insets are fluorescence images of the slice in arbitrary grey units. The time course of relative fluorescence intensity in the window placed in layer II/III is shown. The intensity was normalized by the value before the application of the O2-free medium. C, recovery of the autofluorescence after application of normal medium in the same slice shown in B. D, E, autofluorescence before and during application of glucose-free (–glucose) medium (D) and the recovery in the same slice (E).
Ca2+ imaging was also performed in the slices. Rhod-2 was used as a Ca2+ indicator (Minta et al. 1989), since the Ca2+-dependent red fluorescence of rhod-2 was not affected by the green autofluorescence. For loading with rhod-2, slices were incubated in medium containing 10 μm of the tetraacetoxymethyl ester of rhod-2 (rhod-2/AM, Dojindo Laboratories, Kumamoto, Japan) for 1 h at room temperature (Seki et al. 1999, 2001). The Ca2+ image was recorded with an excitation wavelength of 546 ± 5 nm and an emission wavelength of > 590 nm. Images (60 pixels × 64 pixels) were recorded sequentially at intervals of 21 ms. Consecutive images were divided by the first image, pixel by pixel, for normalization, and changes in fluorescence intensity (ΔF/F) were estimated.
Field potentials were recorded via an electrolytically polished tungsten wire, which was insulated with polyvinyl chloride except for the part within 60–90 μm of the tip (< 30 kΩ). We used pieces of Teflon-coated platinum wire (metal diameter: 125 μm) as stimulating electrodes. The cut end of the wire was placed on the surface of the slices and biphasic current pulses (intensity: ± 300 μA, duration of each phase: 200 μs) were used for stimulation. Signals were amplified 10 times with a hand-made electronic circuit using an operational amplifier (OPA128LM, Burr-Brown, Tucson, USA), and passed through a band-pass filter between 0.2 Hz and 10 kHz. The output was stored in a computer (PC-9801BA2, NEC, Tokyo, Japan) via an analog-digital converter board (ADXM-98A, Canopus, Kobe, Japan) for later analysis. The BASIC programs used for the recording and analysis were developed by us using the software library supplied by Canopus.
Experiments in anaesthetized rats
Rats were anaesthetized with urethane (1.5 g kg−1, i.p.). Mannitol (2 g kg−1, i.p.) was administered to prevent brain oedema. Spontaneous respiration of O2 gas was maintained throughout the recording. After subcutaneous injection of lidocaine (lignocaine), the disinfected skin covering the skull was incised. The right somatosensory cortex was exposed and covered by 3 % agar dissolved in saline.
Cortical images (128 pixels × 128 pixels after binning) of green autofluorescence (500–550 nm) in blue light (450–490 nm) were recorded at 9 Hz by a cooled CCD camera system (AQUACOSMOS/Ratio with ORCA-ER, Hamamatsu Photonics) using a binocular epifluorescence microscope (MZ FL III, Leica) with an objective lens (magnification: 1.0, numerical aperture: 0.125). When green or blue light reflection was measured, the surface of the brain was illuminated by a halogen lamp through a light guide and a blue (450–490 nm) or green (500–550 nm) filter, and the cortical images were recorded by the camera that was attached to the microscope. Unless otherwise specified, 5–8 trials were averaged, and a 5 × 5 matrix filter and averaging of three consecutive frames were used to improve the quality of the images. To elicit the autofluorescence responses in the somatosensory cortex, repetitive electrical stimulation (300 μA, 100 μs at 5–100 Hz for 1 s) was delivered via a tungsten electrode at a depth of 0.5 mm from the cortical surface. Mechanical skin stimulation was also used to elicit autofluorescence responses in the somatosensory cortex. Vibration (displacement: ± 1 mm, 50 Hz for 1 s) produced by a mechanical stimulator (DPS-290, Dia Medical, Tokyo, Japan) was applied on the surface of the left plantar forepaw or hindpaw via a plastic rod of 1 cm diameter. Field potentials in the somatosensory cortex were recorded via a tungsten microelectrode. After the experiments, the rats were killed with an overdose of pentobarbital (i.p.).
In some experiments, the response centre during vibratory stimulation of the hindpaw was confirmed histologically. The response centre was marked electrically by passing a DC current (500 μA for 10 s). The brain was removed and fixed in 4 % paraformaldehyde in 0.1 m sodium phosphate buffer (pH 7.6). Parasagittal sections (50 μm thick) of the cortex were prepared using a freezing microtome, and stained with cresyl violet.
RESULTS
Responses in slices
To estimate the contribution of mitochondrial flavoproteins to the green autofluorescence, slices were perfused with O2-free or glucose-free medium. The basal level of green autofluorescence in blue light decreased by 43–50 % in the medium bubbled with 95 % N2 and 5 % CO2 (n = 3, Fig. 1B). The decrease was observed equally over the slices. This change was reversed in normal oxygenated medium (Fig. 1C). In the medium in which glucose (10 mm) was replaced with NaCl (5 mm), the intensity of green autofluorescence was increased by 52–54 % (n = 3, Fig. 1D), and this change was also reversible (Fig. 1E). The slow onset of the change in Fig. 1D can probably be explained by the time required for the diffusion of extracellular glucose. From these results, it was estimated that about half of the green autofluorescence in blue light was modulated in the presence or absence of O2 or glucose, and this much was likely to be attributed to the mitochondrial flavoproteins in the slices.
We investigated activity-dependent changes in the green autofluorescence in the slices. Repetitive stimulation at 20 Hz for 1 s with biphasic pulses (± 300 μA) applied in layer V produced a localized increase in green autofluorescence at the stimulated site and in layer II/III (Fig. 2A, C). The peak increase was observed about 1 s after the cessation of the stimulation. The peak amplitude normalized by the pre-stimulus fluorescence intensity (ΔF/F) was 27 ± 2 % (mean ± s.d., n = 35). Red autofluorescence (> 590 nm) in green light (541–551 nm) showed no apparent change (Fig. 2B, C). Therefore, we compared the Ca2+ signal and green autofluorescence in the same slices (n = 3) loaded with rhod-2, a Ca2+ indicator that emits red fluorescence in green light. The Ca2+ signal increased rapidly during repetitive stimulation at 20 Hz (Fig. 2E, F). The Ca2+ signal was observed at the stimulated site and in layer II/III, and this pattern was similar to that of the autofluorescence responses in the same slice (Fig. 2D), suggesting the importance of the Ca2+ signal in energy metabolism (Shibuki, 1989, 1990). The amplitude of the autofluorescence responses was stable for at least 4 h, while the rhod-2 signal was markedly reduced during the same 4 h (Fig. 2G), probably due to bleaching or leakage of the rhod-2.
Figure 2. Activity-dependent changes in green autofluorescence in slices.
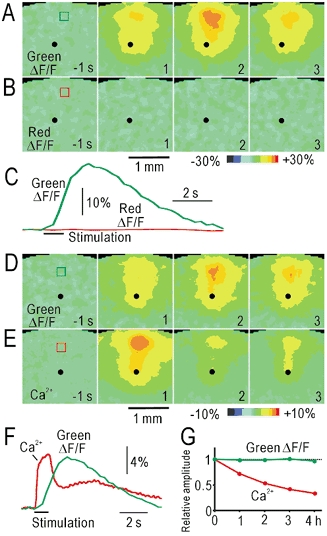
A, pseudocolour images of the changes in green autofluorescence (ΔF/F) after electrical stimulation applied at layer V (black spots). The time before (negative value) and after the stimulus onset is shown. B, red autofluorescence in the same slice. C, time course of changes in ΔF/F in the windows placed in A and B. The colours of the traces correspond to those in the windows. D, green autofluorescence responses in the slice loaded with rhod-2. E, Ca2+ signal in the same slice. F, time course of changes in ΔF/F in the windows placed in D and E. G, stability of the autofluorescence responses and Ca2+ signal in the slices. The changes in the relative response amplitudes are superimposed.
The mechanisms underlying the autofluorescence responses were investigated by pharmacological manipulations. Application of 2 μm tetrodotoxin (TTX) blocked both the autofluorescence responses (Fig. 3A, n = 3) and the field potentials recorded in layer II/III of the same slice (Fig. 3B). The perfusing medium in which Ca2+ was replaced with Mg2+, suppressed the second negativity or postsynaptic population spikes (Kudoh & Shibuki, 1996, 1997) in the field potentials (Fig. 3D, n = 3). However, the autofluorescence responses were almost completely inhibited (Fig. 3C). The postsynaptic potentials were also blocked by 10 μm 6-cyano-7-nitroquinoxaline-2,3-dione (CNQX), an inhibitor of non-NMDA glutamate receptors. However, the autofluorescence responses were only partially inhibited by CNQX to 54 ± 2 % (n = 4, data not shown), indicating that antidromic/presynaptic activity and postsynaptic activity contribute almost equally to the autofluorescence responses. Removal of glucose partially suppressed the postsynaptic field potentials (Fig. 3F), while the autofluorescence responses were absent in the same slices (Fig. 3E, n = 3). Although the field potentials were maintained in O2-free medium (Fig. 3H), no autofluorescence responses were observed (Fig. 3G, n = 3). Diphenyleneiodonium (DPI, 10 μm), an inhibitor of flavoproteins (Arnould et al. 1997; Ratz et al. 2000), produced a profound suppression of the autofluorescence responses (Fig. 3I, n = 3), but had almost no effect on the recorded field potentials (Fig. 3J). Except for the suppression by DPI, all of these effects were reversible (data not shown). In the diagram shown in Fig. 3K, inhibition of any of the four steps resulted in suppression of the autofluorescence responses, while neural activity was not necessarily affected by the procedure. These findings can be explained by assuming that the Ca2+-dependent activation of aerobic metabolism and the resulting oxidation of flavoproteins underlie the recorded autofluorescence responses.
Figure 3. Mechanisms underlying autofluorescence responses in slices.
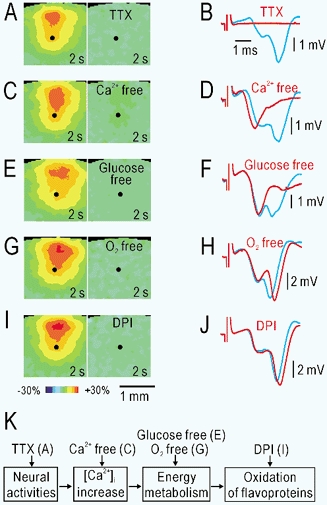
A, autofluorescence responses following repetitive electrical stimulation at 20 Hz for 1 s applied in layer V (black spots) before (left) and during (right) application of 2 μm TTX. B, field potentials before (blue) and during (red) application of TTX recorded in layer II/III in the same slice. C, D, autofluorescence responses and field potentials before and during application of Ca2+-free (Ca2+ was replaced with Mg2+) medium. E, F, autofluorescence responses and field potentials before and during application of glucose-free (glucose was replaced with NaCl) medium. G, H, autofluorescence responses and field potentials before and during application of O2-free medium, which was bubbled with 95 % N2 and 5 % CO2. I, J, autofluorescence responses and field potentials before and during application of 10 μm DPI. K, mechanisms suggested by the findings in A–J.
Responses in anaesthetized rats
In the right primary somatosensory cortex of anaesthetized rats, repetitive electrical stimulation (300 μA) at 5–100 Hz for 1 s was delivered via a tungsten electrode inserted into the cortex at the depth of 0.5 mm from the cortical surface. This stimulation produced a localized increase in green autofluorescence recorded in blue light around the stimulated site (Fig. 4A). Although the depth of the response centre was not directly estimated, it was about 300 μm deep from the cortical surface in the slice experiments (Fig. 2A, D). The time course of the increase in vivo was faster than that in the slices (Fig. 4C). The peak ΔF/F in 10 pixels × 10 pixels during stimulation at 100 Hz was as large as 20 ± 4 % (n = 6). The relative distribution of the autofluorescence responses was constant at stimulus frequencies of 5–100 Hz (Fig. 4A, B). In contrast, the amplitude was positively correlated with the stimulus frequency (Fig. 4B–D), and the relationship was almost linear when the stimulus frequency was lower than 20 Hz (Fig. 4D). The autofluorescence responses were compared with the field potentials recorded via a tungsten electrode inserted into various points of the cortex at a depth of 0.5 mm from the surface (Fig. 4E, F). The comparable distribution of both responses suggests that the increase in autofluorescence is a good indicator of neural activity. Autofluorescence responses were gradually suppressed and completely inhibited within 90–120 min of covering the exposed brain surface with agar containing 100 μm DPI (Fig. 4G, n = 3), while no such deterioration was observed in the brain covered with agar dissolved in saline (data not shown). Distorted neural activity was recorded near the stimulated site in the cortex covered with DPI (Fig. 4H). The apparent effects of DPI on neural activity in the anaesthetized rats were quite different from those observed in the slices, suggesting the importance of aerobic metabolism in the former but not in the latter.
Figure 4. Autofluorescence responses elicited by electrical stimulation in vivo.
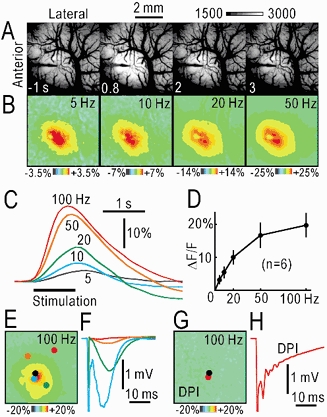
A, brain surface images before and after electrical stimulation at 100 Hz for 1 s. The fluorescence intensities between 1500 and 3000 in arbitrary units were expanded on a grey scale. Note the shadow of the stimulating electrode. B, distribution of the fluorescence responses (ΔF/F) 0.8 s after the onset of the stimulation at 5–50 Hz for 1 s. C, time course of changes in ΔF/F in a window of 10 pixels × 10 pixels. Results in A–C were obtained from the same rat. D, relationship between the amplitudes of ΔF/F and the stimulus frequency. The mean and s.d. are shown. E, autofluorescence responses elicited by electrical stimulation (100 Hz, 1 s). F, field potentials elicited by single pulse stimulation and recorded at the spots in E. The colours of the spots correspond to those of the traces. The black spot in E shows the stimulated site. G, suppressed autofluorescence responses in the brain covered by 3 % agar containing 100 μm DPI. The image was taken 90 min after covering the brain with DPI agar. H, field potentials recorded at the red spot near the stimulated site (black spot).
To investigate the neural responses elicited by natural stimuli in the somatosensory cortex, vibration (displacement: ± 1 mm, 50 Hz for 1 s) was applied via a plastic rod of 1 cm diameter on the surface of the left plantar forepaw. The vibratory stimulation generated localized autofluorescence responses in the right primary somatosensory cortex (Fig. 5A). The responses peaked about 0.8 s after the stimulus onset, and were followed by darkening of the arterial images, which lasted for several seconds (Fig. 5A, D). These responses were observed clearly in only a single trial, although averaging improved the quality of the images (Fig. 5B). Hindpaw stimulation produced autofluorescence responses at a different location in the cortex of the same rat (Fig. 5C). The peak ΔF/F elicited by the vibratory stimulation on the left planter hindpaw was 2.6 ± 0.5 % (n = 33). To identify the cortical area, an electric lesion was produced at the response centre during hindpaw stimulation. The location of the lesion was identified histologically in the granular somatosensory cortex (red arrow in Fig. 5E). The autofluorescence responses were compared with the field potentials recorded at various points on the cortex (Fig. 5F, G). The comparable distribution of both responses suggests that the increase in autofluorescence is a good indicator of the somatosensory activity elicited by natural stimuli. All of these findings indicate the usefulness of the autofluorescence responses for functional brain imaging.
Figure 5. Autofluorescence responses in the somatosensory cortex elicited by vibratory skin stimulation.
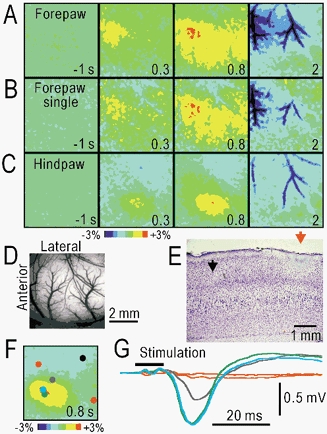
A, responses elicited by forepaw stimulation. B, responses in a single trial in A. C, responses elicited by hindpaw stimulation. D, original brain surface image in A–C. E, parasagittal section of the cortex stained with cresyl violet. The boundary between the agranular motor and granular somatosensory cortices (black arrow) and an electrically produced lesion (red arrow) made on the centre of the autofluorescence responses in C. The results in A–E were obtained from the same rat. F, autofluorescence responses elicited by hindpaw stimulation (50 Hz, 1 s). G, field potentials elicited by stimulation with a single mechanical pulse (duration 10 ms) and recorded at the spots in F. The colours of the spots correspond to those of the traces. To reduce stimulus artefacts, the differences from the reference potentials recorded at the black spot in F are shown.
Neural activity triggers local haemodynamic responses in the brain (Woolsey et al. 1996). The darkening of the arterial images that was observed following the autofluorescence responses (Fig. 5A–C) can be explained by an increase in arterial blood flow, since the blood absorbs the blue and green light used for the fluorescence measurement. Therefore, we compared the autofluorescence responses (Fig. 6A) and green or blue light reflection (Fig. 6B, C) during hindpaw stimulation in the same rat. As expected, only slow darkening of the arterial images was observed in the green or blue light reflection (ΔR/R, Fig. 6B–E). The autofluorescence responses recorded as the images of ΔF/F were more localized (Fig. 6A–B) and faster (Fig. 6E) than the haemodynamic responses recorded as ΔR/R. These two components were easily distinguished because the polarity of the changes differed between the two.
Figure 6. Comparison of autofluorescence responses and changes in light reflection.
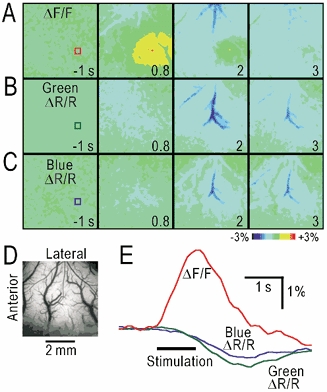
A, autofluorescence responses elicited by the stimulation. B, C, changes in the green (B) and blue (C) light reflection (ΔR/R). D, original brain surface image in the same rat. E, time course of ΔF/F and ΔR/R in the windows in A–C. The colours of the traces correspond to those in the windows.
We tried to separate the autofluorescence responses from the subsequent haemodynamic responses using pharmacological manipulations. Since suppression of aerobic energy metabolism in vivo may produce nonspecific neural damage, as observed in Fig. 4H, we tried to enhance the autofluorescence responses by supplying a sufficient amount of l-lactate, a substrate for aerobic energy metabolism in neurons (Schurr et al. 1988; Hassel & Brathe, 2000). The brain was covered with 3 % agar containing 50 mm l-lactate. In the three rats tested, the arteries and veins were observed on the brain surface covered with normal agar (Fig. 7A). After that, the agar was replaced with agar containing 50 mm l-lactate (Fig. 7B). Dilatation of the blood vessels induced by l-lactate was observed, probably because l-lactate is a potent vasodilator (Mori et al. 1998). The autofluorescence responses almost doubled in amplitude, while the darkening of the arterial images remained the same (Fig. 7C). These findings support the idea that the green autofluorescence responses in vivo can be attributed to mitochondrial flavoproteins.
Figure 7. Separation between autofluorescence responses and subsequent haemodynamic responses.
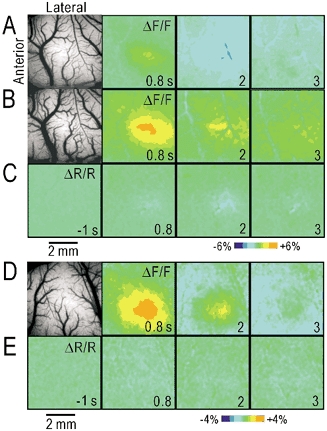
A, brain surface image and autofluorescence in the cortex covered with 3 % agar dissolved in saline. B, brain surface image and autofluorescence in the cortex covered with agar dissolved in lactate saline (50 mm sodium l-lactate plus 100 mm NaCl, neutralized with HCl). C, green light reflection during hindpaw stimulation in the brain covered with agar containing l-lactate. The images in B and C were taken after those in A were recorded, in the same rat. The pseudocolour scale was ± 6 % in A–C. D, brain surface image and autofluorescence responses elicited by hindpaw stimulation in the cortex covered with agar containing 100 μmNG-nitro-l-arginine. E, green light reflection during hindpaw stimulation in the same rat shown in D. The pseudocolour scale was ± 4 % in D and E.
To separate the autofluorescence responses from the subsequent haemodynamic responses, we tried to selectively inhibit the haemodynamic responses. Since cerebral blood flow is partly regulated by nitric oxide (Toda et al. 2000), the brain was covered with agar containing 100 μM NG-nitro-l-arginine, an inhibitor of nitric oxide synthase. In all of the three rats tested, very clear autofluorescence responses were observed after hindpaw stimulation (Fig. 7D), while the darkening of the arterial images in green light reflection was almost completely suppressed by NG-nitro-l-arginine (Fig. 7D, E). These findings suggest that the haemodynamic responses observed following neural activity are partly mediated by nitric oxide, and that pure autofluorescence responses can be observed in the brain covered with agar containing NG-nitro-l-arginine.
DISCUSSION
Mechanisms underlying the activity-dependent autofluorescence signal
In the present study, activity-dependent changes in autofluorescence were recorded in vitro and in vivo in order to elucidate the mechanism underlying the fluorescence responses. The blockage of the autofluorescence responses by TTX (Fig. 3A, B) indicates that neural activity triggers the responses. An activity-dependent increase in [Ca2+]i preceded the autofluorescence responses (Fig. 2E, F), and Ca2+-free medium eliminated them (Fig. 3C). The postsynaptic components in the field potentials were inhibited in the Ca2+-free medium (Fig. 3D). The postsynaptic components were also blocked by 10 μm CNQX with only partial inhibition of the autofluorescence responses, suggesting the importance of the Ca2+ rise, but not the postsynaptic potentials, for the autofluorescence responses. All of these findings support the hypothesis that the autofluorescence responses are triggered by neural activity and the resulting increase in [Ca2+]i. However, we cannot exclude the contribution of glial cells, since they also exhibit activity-dependent changes in [Ca2+]i (Verkhratsky & Kettenmann, 1996).
Although glucose- and O2-free media had differential effects on the basal level of green autofluorescence, both inhibited the activity-dependent changes in autofluorescence. In the absence of O2, neural activity was maintained, with no autofluorescence responses, probably because neural activity in the slices at room temperature could be maintained by anaerobic metabolism (Yamane et al. 2000). The coupling between aerobic energy metabolism and the [Ca2+]i increase (Fein & Tsacopoulos, 1988; Shibuki, 1989, 1990) can be explained by the Ca2+-dependence of a number of the mitochondrial enzymes that are essential for energy metabolism (Kavanagh et al. 2000; Territo et al. 2000). The involvement of flavoproteins in the autofluorescence responses is suggested by the wavelength specificity of the autofluorescence (Benson et al. 1979) and the inhibitory effects of DPI on the responses (Arnould et al. 1997; Ratz et al. 2000). Neural activity was affected by DPI in vivo (Fig. 4H) but not in vitro (Fig. 3J), indicating the importance of aerobic energy metabolism for brain activity in vivo. From these results, it is concluded that the activation of aerobic energy metabolism and the resulting oxidation of mitochondrial flavoproteins are the mechanisms underlying the autofluorescence responses (Fig. 3K).
Properties of the autofluorescence responses in vivo
The marked autofluorescence responses in vivo (Fig. 3), which were also sensitive to DPI, are very likely to be produced by the same mechanisms in the slices. However, in contrast to the results obtained in the slice experiments, the responses in vivo were contaminated by the haemodynamic responses. The centres of the autofluorescence responses were not necessarily the same as those of the haemodynamic responses (Fig. 6). We tried to pharmacologically differentiate the autofluorescence responses from the subsequent haemodynamic responses. The autofluorescence responses were facilitated by l-lactate, a substrate of aerobic energy metabolism in neurons (Schurr et al. 1988; Hassel & Brathe, 2000). We tried to suppress the haemodynamic responses by inhibiting the synthesis of nitric oxide, which is a potential mediator of the haemodynamic responses (Goadsby et al. 1992; Northington et al. 1992). The role of nitric oxide in haemodynamic responses is, however, controversial (Wang et al. 1993; Adachi et al. 1994). In our experiments, clear suppression of the haemodynamic responses with almost no effect on the autofluorescence responses was observed (Fig. 7D, E). The difference between the present study and the previous negative reports might be due to the method of application or the dose of nitric oxide synthase inhibitors. We applied a high dose (100 μm) of NG-nitro-l-arginine directly onto the surface of the brain, and therefore the nitric oxide synthesis located inside the blood brain barrier could be inhibited completely. Nitric oxide is derived from neurons or nerve terminals inside the blood–brain barrier (Toda et al. 2000), so it could have important roles in the coupling between neural activity and vasodilatation.
What is the spatial resolution achieved by autofluorescence recording? In the present study, a differential distribution in response area after forepaw/ hindpaw stimulation was shown (Fig. 5A, C). The size of the response area is comparable to that observed with intrinsic signal recording after mechanical stimulation of a single whisker in the rat somatosensory cortex (Chen-Bee & Frostig, 1996; Brett-Green et al. 2001). Although very fine columnar structures have been demonstrated in the visual cortex using intrinsic signal recording (Bonhoeffer & Grinvald, 1991) and a voltage-sensitive dye (Sharon & Grinvald, 2002), the spatial resolution in these studies was achieved by subtracting the column-nonspecific responses from the column-specific responses. Neural activity is probably reflected in both responses, because the pyramidal neurons in the cortex are connected extensively with the horizontal axon collaterals (Gilbert, 1992). Both the intrinsic signal recording and autofluorescence recording depend on the activity-dependent facilitation of local aerobic metabolism, and the mechanism of the autofluorescence response strongly suggests a parallel relationship between the autofluorescence responses and neural activity. Therefore, we expected that the autofluorescence responses reflect faithfully neural activity in vivo, and this possibility was confirmed in the present study (Fig. 4E, F and Fig. 5F, G).
Technical merits of autofluorescence recording
The present observations demonstrate that functional brain imaging using activity-dependent autofluorescence of flavoproteins has a signal-to-noise ratio sufficient to enable visualizion of the functional somatosensory map without averaging (Fig. 5B). The fluorescence signal reflecting neural activity was easily separated from the subsequent haemodynamic changes (Fig. 7). The stability of the autofluorescence responses (Fig. 2G) allowed us to investigate post-tetanic potentiation lasting about 30 min in vivo (unpublished data). This new method should have many experimental uses in animal preparations. Given the large signal magnitudes, the use of non-harmful levels of blue light in imaging and the demonstration of strong, localized responses without the requirement of dye use, this method may also be highly suitable in the clinical setting (Haglund et al. 1992; Cannestra et al. 1998; Sato et al. 2002).
Acknowledgments
We thank Y. Tamura, N. Taga and S. Maruyama for technical assistance. This work was supported by grants from the Japanese government.
References
- Adachi K, Takahashi S, Melzer P, Campos KL, Nelson T, Kennedy C, Sokoloff L. Increases in local cerebral blood flow associated with somatosensory activation are not mediated by NO. Am J Physiol. 1994;267:H2155–2162. doi: 10.1152/ajpheart.1994.267.6.H2155. [DOI] [PubMed] [Google Scholar]
- Arnould S, Berthon JL, Hubert C, Dias M, Cibert C, Mornet R, Camadro JM. Kinetics of protoporphyrinogen oxidase inhibition by diphenyleneiodonium derivatives. Biochemistry. 1997;36:10178–10184. doi: 10.1021/bi970549j. [DOI] [PubMed] [Google Scholar]
- Benson RC, Meyer RA, Zaruba ME, McKhann GM. Cellular autofluorescence-is it due to flavins? J Histochem Cytochem. 1979;27:44–48. doi: 10.1177/27.1.438504. [DOI] [PubMed] [Google Scholar]
- Brett-Green BA, Chen-Bee CH, Frostig RD. Comparing the functional representations of central and border whiskers in rat primary somatosensory cortex. J Neurosci. 2001;21:9944–9954. doi: 10.1523/JNEUROSCI.21-24-09944.2001. [DOI] [PMC free article] [PubMed] [Google Scholar]
- Cannestra AF, Black KL, Martin NA, Cloughesy T, Burton JS, Rubinstein E, Woods RP, Toga AW. Topographical and temporal specificity of human intraoperative optical intrinsic signals. Neuroreport. 1998;9:2557–2563. doi: 10.1097/00001756-199808030-00024. [DOI] [PubMed] [Google Scholar]
- Chance B, Cohen P, Jöbsis FF, Schoener B. Intracellular oxidation-reduction states in vivo. Science. 1962;137:499–508. doi: 10.1126/science.137.3529.499. [DOI] [PubMed] [Google Scholar]
- Chen-Bee CH, Frostig RD. Variability and interhemispheric asymmetry of single-whisker functional representations in rat barrel cortex. J Neurophysiol. 1996;76:884–894. doi: 10.1152/jn.1996.76.2.884. [DOI] [PubMed] [Google Scholar]
- Ebner TJ, Chen G. Use of voltage-sensitive dyes and optical recordings in the central nervous system. Prog Neurobiol. 1995;46:463–506. doi: 10.1016/0301-0082(95)00010-s. [DOI] [PubMed] [Google Scholar]
- Fein A, Tsacopoulos M. Activation of mitochondrial oxidative metabolism by calcium ions in Limulus ventral photoreceptor. Nature. 1988;331:437–440. doi: 10.1038/331437a0. [DOI] [PubMed] [Google Scholar]
- Frostig RD, Lieke EE, Ts'o DY, Grinvald A. Cortical functional architecture and local coupling between neuronal activity and the microcirculation revealed by in vivo high-resolution optical imaging of intrinsic signals. Proc Natl Acad Sci U S A. 1990;87:6082–6086. doi: 10.1073/pnas.87.16.6082. [DOI] [PMC free article] [PubMed] [Google Scholar]
- Gilbert CD. Horizontal integration and cortical dynamics. Neuron. 1992;19:1–13. doi: 10.1016/0896-6273(92)90215-y. [DOI] [PubMed] [Google Scholar]
- Goadsby PJ, Kaube H, Hoskin KL. Nitric oxide synthesis couples cerebral blood flow and metabolism. Brain Res. 1992;595:167–170. doi: 10.1016/0006-8993(92)91470-y. [DOI] [PubMed] [Google Scholar]
- Grinvald A, Lieke E, Frostig RD, Gilbert CD, Wiesel TN. Functional architecture of cortex revealed by optical imaging of intrinsic signals. Nature. 1986;324:361–364. doi: 10.1038/324361a0. [DOI] [PubMed] [Google Scholar]
- Haglund MM, Ojemann GA, Hochman DW. Optical imaging of epileptiform and functional activity in human cerebral cortex. Nature. 1992;358:668–771. doi: 10.1038/358668a0. [DOI] [PubMed] [Google Scholar]
- Haselgrove JC, Bashford CL, Barlow CH, Quistorff B, Chance B, Mayevsky A. Time resolved 3-dimensional recording of redox ratio during spreading depression in gerbil brain. Brain Res. 1990;506:109–114. doi: 10.1016/0006-8993(90)91205-u. [DOI] [PubMed] [Google Scholar]
- Hassel B, Brathe A. Cerebral metabolism of lactate in vivo: evidence for neuronal pyruvate carboxylation. J Cereb Blood Flow Metab. 2000;20:327–336. doi: 10.1097/00004647-200002000-00014. [DOI] [PubMed] [Google Scholar]
- Kavanagh NI, Ainscow EK, Brand MD. Calcium regulation of oxidative phosphorylation in rat skeletal muscle mitochondria. Biochim Biophys Acta. 2000;1457:57–70. doi: 10.1016/s0005-2728(00)00054-2. [DOI] [PubMed] [Google Scholar]
- Krieg WJS. Connections of the cerebral cortex. I. The albino rat. A. Topography of the cortical areas. J Comp Neurol. 1946;84:221–275. doi: 10.1002/cne.900840205. [DOI] [PubMed] [Google Scholar]
- Kudoh M, Shibuki K. Long-term potentiation of supragranular pyramidal outputs in the rat auditory cortex. Exp Brain Res. 1996;110:21–27. doi: 10.1007/BF00241370. [DOI] [PubMed] [Google Scholar]
- Kudoh M, Shibuki K. Importance of polysynaptic inputs and horizontal connectivity in the generation of tetanus-induced long-term potentiation in the rat auditory cortex. J Neurosci. 1997;17:9458–9465. doi: 10.1523/JNEUROSCI.17-24-09458.1997. [DOI] [PMC free article] [PubMed] [Google Scholar]
- Lewis DV, Schuette WH. NADH fluorescence, [K+]o and oxygen consumption in cat cerebral cortex during direct cortical stimulation. Brain Res. 1976;110:523–535. doi: 10.1016/0006-8993(76)90863-5. [DOI] [PubMed] [Google Scholar]
- Lothman E, Lamanna J, Cordingley G, Rosenthal M, Somjen G. Responses of electrical potential, potassium levels, and oxidative metabolic activity of the cerebral neocortex of cats. Brain Res. 1975;88:15–36. doi: 10.1016/0006-8993(75)90943-9. [DOI] [PubMed] [Google Scholar]
- Malonek D, Grinvald A. Interactions between electrical activity and cortical microcirculation revealed by imaging spectroscopy: implications for functional brain mapping. Science. 1996;272:551–554. doi: 10.1126/science.272.5261.551. [DOI] [PubMed] [Google Scholar]
- Mayevsky A, Chance B. Repetitive patterns of metabolic changes during cortical spreading depression of the awake rat. Brain Res. 1974;65:529–533. doi: 10.1016/0006-8993(74)90243-1. [DOI] [PubMed] [Google Scholar]
- Minta A, Kao JPY, Tsien RY. Fluorescent indicators for cytosolic calcium based on rhodamine and fluorescein chromophores. J Biol Chem. 1989;264:8171–8178. [PubMed] [Google Scholar]
- Mori K, Nakaya Y, Sakamoto S, Hayabuchi Y, Matsuoka S, Kuroda Y. Lactate-induced vascular relaxation in porcine coronary arteries is mediated by Ca2+-activated K+ channels. J Mol Cell Cardiol. 1998;30:349–356. doi: 10.1006/jmcc.1997.0598. [DOI] [PubMed] [Google Scholar]
- Northington FJ, Matherne GP, Berne RM. Competitive inhibition of nitric oxide synthase prevents the cortical hyperemia associated with peripheral nerve stimulation. Proc Natl Acad Sci U S A. 1992;89:6649–6652. doi: 10.1073/pnas.89.14.6649. [DOI] [PMC free article] [PubMed] [Google Scholar]
- Ratz JD, McGuire JJ, Anderson DJ, Bennett BM. Effects of the flavoprotein inhibitor, diphenyleneiodonium sulfate, on ex vivo organic nitrate tolerance in the rat. J Pharmacol Exp Ther. 2000;293:569–577. [PubMed] [Google Scholar]
- Rosenthal M, Jöbsis FF. Intracellular redox changes in functioning cerebral cortex. II. Effects of direct cortical stimulation. J Neurophysiol. 1971;34:750–762. doi: 10.1152/jn.1971.34.5.750. [DOI] [PubMed] [Google Scholar]
- Sato K, Nariai T, Sasaki S, Yazawa I, Mochida H, Miyakawa N, Momose-Sato Y, Kamino K, Ohta Y, Hirakawa K, Ohno K. Intraoperative intrinsic optical imaging of neuronal activity from subdivisions of the human primary somatosensory cortex. Cereb Cortex. 2002;12:269–280. doi: 10.1093/cercor/12.3.269. [DOI] [PubMed] [Google Scholar]
- Schurr A, West CA, Rigor BM. Lactate-supported synaptic function in the rat hippocampal slice preparation. Science. 1988;240:1326–1328. doi: 10.1126/science.3375817. [DOI] [PubMed] [Google Scholar]
- Seki K, Kudoh M, Shibuki K. Long-term potentiation of Ca2+ signal in the rat auditory cortex. Neurosci Res. 1999;34:187–197. doi: 10.1016/s0168-0102(99)00049-8. [DOI] [PubMed] [Google Scholar]
- Seki K, Kudoh M, Shibuki K. Sequence dependence of post-tetanic potentiation after sequential heterosynaptic stimulation in the rat auditory cortex. J Physiol. 2001;533:503–518. doi: 10.1111/j.1469-7793.2001.0503a.x. [DOI] [PMC free article] [PubMed] [Google Scholar]
- Sharon D, Grinvald A. Dynamics and constancy in cortical spatiotemporal patterns of orientation processing. Science. 2002;295:512–515. doi: 10.1126/science.1065916. [DOI] [PubMed] [Google Scholar]
- Shibuki K. Calcium-dependent and ouabain-resistant oxygen consumption in the rat neurohypophysis. Brain Res. 1989;487:96–104. doi: 10.1016/0006-8993(89)90944-x. [DOI] [PubMed] [Google Scholar]
- Shibuki K. Activation of neurohypophysial vasopressin release by Ca2+ influx and intracellular Ca2+ accumulation in the rat. J Physiol. 1990;422:321–331. doi: 10.1113/jphysiol.1990.sp017986. [DOI] [PMC free article] [PubMed] [Google Scholar]
- Shibuki K, Hishida R, Murakami H, Kudoh M, Kawaguchi T, Watanabe M, Watanabe S, Kouuchi T, Tanaka R. Functional brain imaging using autofluorescence of flavoproteins. Neurosci Res Suppl. 2001;25:S99. [Google Scholar]
- Territo PR, Mootha VK, French SA, Balaban RS. Ca2+ activation of heart mitochondrial oxidative phosphorylation: role of the F0/F1-ATPase. Am J Physiol Cell Physiol. 2000;278:C423–435. doi: 10.1152/ajpcell.2000.278.2.C423. [DOI] [PubMed] [Google Scholar]
- Toda N, Ayajiki K, Tanaka T, Okamura T. Preganglionic and postganglionic neurons responsible for cerebral vasodilation mediated by nitric oxide in anesthetized dogs. J Cereb Blood Flow Metab. 2000;20:700–708. doi: 10.1097/00004647-200004000-00007. [DOI] [PubMed] [Google Scholar]
- Tomlinson FH, Anderson RE, Meyer FB. Brain pHi, cerebral blood flow, and NADH fluorescence during severe incomplete global ischemia in rabbits. Stroke. 1993;24:435–443. doi: 10.1161/01.str.24.3.435. [DOI] [PubMed] [Google Scholar]
- Vanzetta I, Grinvald A. Increased cortical oxidative metabolism due to sensory stimulation: implications for functional brain imaging. Science. 1999;286:1555–1558. doi: 10.1126/science.286.5444.1555. [DOI] [PubMed] [Google Scholar]
- Verkhratsky A, Kettenmann H. Calcium signalling in glial cells. Trends Neurosci. 1996;19:346–352. doi: 10.1016/0166-2236(96)10048-5. [DOI] [PubMed] [Google Scholar]
- Wang Q, Kjaer T, Jorgensen MB, Paulson OB, Lassen NA, Diemer NH, Lou HC. Nitric oxide does not act as a mediator coupling cerebral blood flow to neural activity following somatosensory stimuli in rats. Neurol Res. 1993;15:33–36. doi: 10.1080/01616412.1993.11740103. [DOI] [PubMed] [Google Scholar]
- Woolsey TA, Rovainen CM, Cox SB, Henegar MH, Liang GE, Liu D, Moskalenko YE, Sui J, Wei L. Neuronal units linked to microvascular modules in cerebral cortex: response elements for imaging the brain. Cereb Cortex. 1996;6:647–660. doi: 10.1093/cercor/6.5.647. [DOI] [PubMed] [Google Scholar]
- Yamane K, Yokono K, Okada Y. Anaerobic glycolysis is crucial for the maintenance of neural activity in guinea pig hippocampal slices. J Neurosci Methods. 2000;103:163–171. doi: 10.1016/s0165-0270(00)00312-5. [DOI] [PubMed] [Google Scholar]


