

Abstract
Motor unit discharge rates decline by about 50 % over 60 s of a sustained maximum voluntary contraction (MVC). It has been suggested that this decline in discharge rate serves to maintain force by protecting against conduction failure and by optimizing the input to motor units as their contractile properties change. This hypothesis, known as muscle wisdom, is based in part on studies in which muscle force was shown to decline more rapidly when stimulation was maintained at a high rate than when stimulus rate was reduced over time. The stimulus rates used in those studies, however, were higher than those normally encountered during MVCs. The purpose of this study was to compare force loss under constant and declining stimulus rate conditions using rates similar to those that occur during voluntary effort. Isometric force and surface EMG signals were recorded from human adductor pollicis muscles in response to supramaximal stimuli delivered to the ulnar nerve at the elbow. Three fatigue protocols, each 60 s in duration, were carried out on separate days on each of 10 subjects: (1) continuous stimulation at 30 Hz, (2) stimulation at progressively decreasing rates from 30 to 15 Hz and (3) sustained MVC. The relative force–time integral (endurance index) was significantly smaller for the sustained MVC (0.75 ± 0.08) and decreasing stimulus rate conditions (0.76 ± 0.16) compared to the condition in which stimulus rate was maintained at 30 Hz (0.90 ± 0.13). These findings suggest that decreases in discharge rate may contribute to force decline during a sustained MVC.
Isometric skeletal muscle force declines rapidly during a sustained maximal voluntary contraction. This loss in force usually is accompanied by a marked decrease in motor unit discharge rate, which can be as much as 50 % in 1 min from initial rates of near 30 impulses s−1 (Grimby et al. 1981, 1990; Bigland-Ritchie et al. 1983a; Peters & Fuglevand, 1999; cf. Macefield et al. 2000). Generally, however, fatigue-related diminution of motor unit discharge rate has not been considered to contribute directly to loss in force. Rather, it has been hypothesized that a decrease in motor unit activity may serve to forestall fatigue by: (1) optimizing the force output of motor units as their contractile speed slows (Bigland-Ritchie et al. 1983a, b; Marsden et al. 1983) and (2) protecting against peripheral conduction failure associated with prolonged, high discharge rates (Jones et al. 1979; Marsden et al. 1983).
This hypothesis, referred to as muscle wisdom, derives in part from studies in which muscle force was shown to decrease more rapidly when stimulation was maintained at a high rate compared to that when stimulus rate was reduced over time (Jones et al. 1979; Jones, 1982, 1996; Jones & Bigland-Ritchie, 1986). Jones and colleagues (1979) demonstrated that while high stimulus rates (80 Hz) were needed initially to achieve maximal muscle force, maintenance of this high rate caused force to drop precipitously. Indeed, after about 40 s of stimulation, substantially more force could be exerted if the stimulus rate was reduced to around 20 Hz. This observation helped establish the idea that reduction in motor unit discharge rates during voluntary contraction may function to preserve force rather than promote fatigue.
The stimulus rates used by Jones and colleagues (1979), however, were higher than that normally encountered during a maximal voluntary contraction. Artificially high stimulus rates can cause partial interruption of neuromuscular propagation (Krnjevic & Miledi, 1958), which appears to recover rapidly when the stimulus rate is reduced (Lüttgau, 1965). Consequently, it remains uncertain whether the improvement in force output observed by Jones et al. (1979) and Jones (1982) when stimulus rates were lowered from 80 or 100 Hz to 20 Hz was representative of the type of adaptation that occurs during voluntary contraction or was primarily the result of abnormally high initial activation rates.
Therefore, the purpose of this study was to repeat the study of Jones et al. (1979) but to use rates of stimulation that more closely approximate those generated during voluntary effort. In the same muscle tested by Jones and colleagues (the human adductor pollicis), we compared the force generated over time when the stimulus rate was maintained at 30 Hz to that produced when stimulus rate declined from 30 to 15 Hz, similar to that which occurs naturally during a sustained maximum voluntary contraction (MVC; Bigland-Ritchie et al. 1983a). We found that force was better maintained if stimulation was sustained at the high, but still physiological, rate. This finding, therefore, implies that reduction in motor unit discharge rate may be partially responsible for the decline in force during a sustained MVC.
METHODS
Subjects and test muscle
Ten healthy adult subjects (two female, eight male, aged 20–38 years) volunteered to participate in the study. The procedures were approved by the institutional Human Investigation Committee and were in accord with the Declaration of Helsinki, and all subjects provided informed consent prior to participation in the study. Each subject participated in three experimental sessions involving different fatigue protocols during which isometric thumb adduction force and associated electromyographic (EMG) signals were recorded. Thumb adduction force is generated primarily by the adductor pollicis muscle, although the first dorsal interosseus and the flexor pollicis longus also contribute to this action. The adductor pollicis and first dorsal interosseus muscles are innervated by the ulnar nerve, whereas the flexor pollicis longus is innervated by the median nerve. Prior to the experimental sessions, all subjects participated in a familiarization session during which they practiced MVCs and were introduced to the electrical stimulation of the ulnar nerve, including brief trains using supramaximal stimuli.
Force and EMG recording
The wrist and hand were restrained in a supinated position within a thermoplastic cast (Smith & Nephew, Rolyan, USA) that was moulded for each subject. The thumb protruded through an opening in the cast and was attached to a force transducer by a rigid cylindrical fitting that encircled the interphalangeal joint of the thumb. Fittings of different internal diameters were used to accommodate digits of various sizes. The proximal forearm and elbow were supported on a vacuum pillow. This system of restraints effectively prohibited movements of the distal segments and facilitated repositioning the hand in the same orientation for each experimental session.
A custom-built strain-gauge transducer (stiffness 0.025 mm N−1, sensitivity 0.17 mV N−1) was used to monitor the isometric adduction force of the thumb. The force signal was amplified and displayed on an oscilloscope. EMG signals were recorded with bipolar surface electrodes (4 mm diameter, ∼1 cm interelectrode separation) attached to the skin overlying the adductor pollicis through the opening in the cast. EMG signals were amplified (× 1000), band-pass filtered (10–1000 Hz), and displayed on an oscilloscope. A disposable electrocardiogram electrode, attached to the ventral forearm, was connected to ground. Force and EMG signals were digitally sampled (1000 and 2500 samples s−1, respectively) by a computer-controlled data acquisition/analysis system (Cambridge Electronics Design, UK).
Nerve stimulation
Current pulses (1 ms duration) generated by an isolated, constant-current stimulator (World Precision Instruments, USA) were delivered through the skin to the ulnar nerve by a hand-held bipolar electrode (Dantec, USA) consisting of two saline-soaked felt pads (2 cm interelectrode spacing). The electrode (cathode distal, anode proximal) was placed over the nerve on the medial aspect of the upper arm just proximal to the elbow. At this location, the ulnar nerve lies just below the skin and is readily palpable. The timing of stimuli was controlled by a programmable system that produced sequences of pulses concurrently with data acquisition (Cambridge Electronics Design). Initially, the position of the stimulating electrode was adjusted to identify the location that yielded the largest EMG and force responses to submaximal stimuli delivered at 1 Hz. Once the optimal position was determined, the electrode was secured in place with a Velcro strap that encircled the upper arm. The stimulus intensity was then gradually increased until no further increment in EMG or force was detected. The stimulus intensity was then further increased to 120–200 % of this level and maintained at that intensity for the remainder of the experiment.
Protocol
After placement of EMG electrodes and securing the thumb to the force transducer, subjects performed two brief MVCs of isometric thumb adduction during which isometric force and EMG were recorded. The ulnar nerve was then stimulated with the following sequence, which was also delivered immediately after the fatigue protocol: (1) a 2.5 s train of stimuli at 15 Hz, (2) a 2.5 s train at 30 Hz and (3) following a 1 s delay, a single stimulus to evoke a twitch response. The brief trains at 15 and 30 Hz were delivered in order to rapidly obtain a rough estimate of the form of the force–frequency relationship by measuring two salient points on the force–frequency curve. In two of the subjects, complete force–frequency data in the unfatigued muscle were obtained by stimulating with 2 s trains at 4, 8, 10, 15, 20, 30, 40, 50, 80 and 100 Hz.
Three fatigue protocols, each with a duration of 60 s, were performed on separate days by each subject. One involved continuous stimulation at 30 Hz. In another protocol, the initial stimulation rate (30 Hz) was allowed to decay exponentially (time constant ≈ 20 s) to 15 Hz. This pattern was chosen to approximate the decline in motor neuron discharge rate that occurs during a sustained MVC (Bigland-Ritchie et al. 1983a) and in response to constant-current stimulation with intracellular electrodes (Kernell & Monster, 1982a). The third protocol was a sustained MVC during which subjects were vigorously encouraged by two investigators to exert their maximal effort throughout the test. Verbal encouragement was maintained at roughly the same intensity over the entire course of the protocol. Visual feedback of force was provided to the subjects. The order of the fatigue protocols was assigned randomly for each subject and at least 2 days separated consecutive sessions. Immediately following each fatigue protocol, the muscle was stimulated with 2.5 s trains of 15 and 30 Hz, a twitch was evoked, and a brief MVC was performed. In two of the 30 experiments, twitches obtained after the fatigue test were elicited before force had returned to baseline (e.g. Fig. 1A) and were therefore not included in the analysis.
Figure 1. Example force and EMG responses from the adductor pollicis muscle recorded in one subject during each of three 60 s fatigue protocols.
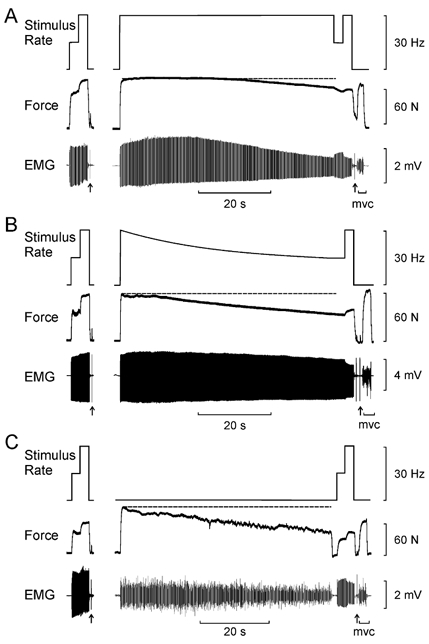
A, continuous stimulation at 30 Hz. B, decreasing stimulus rate from 30 to 15 Hz. C, sustained MVC. The dashed horizontal line indicates the force level at the beginning of the fatigue protocol. Prior to and immediately following each of the fatigue protocols, the adductor pollicis was activated with 2.5 s trains of stimuli at 15 and 30 Hz. A twitch response was also elicited (arrows). A brief MVC was performed before (not shown) and after the fatigue protocol. Force was better maintained during continuous stimulation at 30 Hz (A) compared to that generated in response to decreasing stimulus frequency (B) or sustained MVC (C).
In eight experimental sessions, an inadvertent step decrease in force occurred during the fatiguing stimulation. In these cases, the drop in force appeared to be due to a shift in the position of the stimulating electrode with respect to the nerve. These experiments were aborted and the session was repeated on a different day.
Data analysis
The amplitude, rise time (contraction time) and half-relaxation time were measured from twitches elicited before and after the fatigue protocol. Twitch parameters recorded after the fatigue protocol are expressed relative to post-tetanic responses obtained before fatigue. Likewise, the peak-to-peak amplitude and duration of the muscle-evoked potential (M wave) were measured from responses to the same stimuli used to elicit twitches. Post-fatigue values of the M wave are similarly expressed as a proportion of the corresponding pre-fatigue values.
The mean force over a 0.5 s epoch was measured from the plateau phase of the 15 and 30 Hz trains both before and after fatigue. The quotient of the mean force produced at 15 Hz to that at 30 Hz (15:30 Hz ratio) was calculated as an indicator of the effectiveness of low-frequency stimulation to generate force relative to that elicited at a high frequency. The ability to maintain force during each fatigue protocol was quantified by calculating the area of the force profile (N s) over the entire period of the fatigue task and expressing it as a ratio of the force-time integral had no fatigue occurred (endurance index). The pattern of change in force and EMG was evaluated by measuring the force and amplitude of the EMG every 6 s over the course of each fatigue task. For the voluntary fatigue task, EMG amplitude was calculated from the average rectified EMG over a 1 s epoch. For fatigue tasks involving electrical stimulation, EMG amplitude was measured from the peak-to-peak amplitude of the M wave. These force and EMG data were then expressed relative to the values obtained at the outset of the fatigue test. A standard fatigue index was also calculated for both force and EMG as the ratio of the value obtained at the end of the fatigue task to that at the outset.
A one-way repeated-measures analysis of variance (ANOVA) was performed to determine whether endurance index or fatigue indices varied significantly with different fatigue protocols. A two-way repeated-measures ANOVA was applied to determine whether twitch, M wave, MVC and brief tetanic responses at 15 and 30 Hz were different after fatigue compared to before fatigue and whether the type of fatigue protocol had a significant effect on those parameters. The level of statistical significance was set at P < 0.05.
RESULTS
Changes in force and EMG during fatigue protocols
Force
Figure 1 shows representative recordings made during each of the three fatigue protocols for one subject. Each fatigue protocol was preceded and followed by brief trains of stimuli at 15 and 30 Hz. During continuous stimulation at 30 Hz (Fig. 1A), force declined by approximately 20 % over the course of the 60 s stimulation protocol. When stimulus rate was reduced to 15 Hz at the end of the protocol, there was a small but noticeable drop in force that partly recovered when the stimulus rate was restored to 30 Hz. The amplitude of the evoked EMG responses (M waves) exhibited slight potentiation over the initial 20 s of stimulation, but then gradually declined during the remainder of the fatigue test. When the stimulus rate was briefly changed to 15 Hz at the end of the fatigue test, M-wave amplitude increased immediately, and then decreased when stimulus rate was restored to 30 Hz. As discussed below, such changes in EMG amplitude may have been caused by signal cancellation associated with temporal overlap of gradually broadened surface-detected potentials.
When the stimulus rate decreased progressively from 30 to 15 Hz, force output declined by about 40 % (Fig. 1B). This was about double the force loss that occurred when stimulus rate was maintained at 30 Hz in this subject (Fig. 1A). EMG amplitude was well maintained throughout this fatigue test. At the end of the fatigue test that involved a progressive decrease in stimulus rate, force increased by 22 %, and M-wave amplitude declined by 19 % when the stimulus rate was increased momentarily to 30 Hz.
When the subject performed a sustained MVC, force decreased by about 40 % in 60 s (Fig. 1C). This loss in force was similar to that which occurred during the experimental session involving decreasing stimulus rates (Fig. 1B), but was more than what occurred in the experiment in which stimulus rate was maintained at 30 Hz. As has been reported previously (Bigland-Ritchie et al. 1983b), the fall in isometric force during a sustained MVC was accompanied by a decline in the amplitude of the surface EMG.
The average patterns of force loss associated with the three different fatigue protocols are shown in Fig. 2A. Each point represents the mean force (± s.d.) of 10 subjects measured every 6 s and expressed relative to the force recorded at the beginning of each fatigue test. The time course and magnitude of the force decline was practically identical for the sustained MVC and for the protocol involving a progressive decrease in stimulus rate. In both these cases, force dropped almost linearly over the entire fatigue test to a final relative force value of 0.52 ± 0.14 and 0.57 ± 0.14, respectively (Table 1). In contrast, for the protocol involving continuous stimulation at 30 Hz, little decay in force occurred during the first third of the test. After this, force declined at a rate similar to that seen for the other two protocols, to a final relative force value of 0.69 ± 0.17. The differences in the final relative force across the three protocols, however, did not quite reach statistical significance (P = 0.054). When the entire force profile was included in the assessment of fatigue by use of the endurance index (force-time integral), significantly less fatigue (P < 0.005) occurred during continuous 30 Hz stimulation (endurance index 0.90 ± 0.13) compared to the protocols involving declining stimulus rates (endurance index 0.76 ± 0.16) or voluntary contraction (endurance index 0.75 ± 0.08; Table 1). Differences in the endurance index between these latter two conditions, however, were not statistically significant. On a subject-by-subject basis, 10 out of 10 subjects had greater endurance index values for the continuous 30 Hz stimulation condition compared to the protocol in which stimulus rate declined from 30 to 15 Hz. Similarly, eight out of 10 subjects had greater endurance index values for continuous 30 Hz stimulation compared to the voluntary contraction condition.
Figure 2. Pattern of force (A) and EMG (B) output over 60 s for each of the three fatigue protocols.
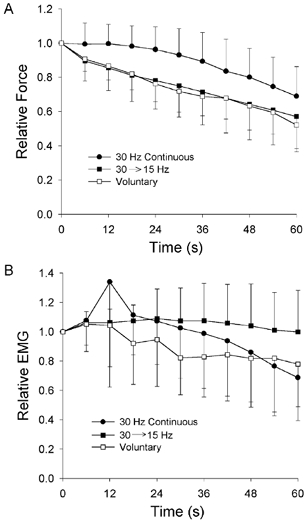
Symbols represent the mean (± 1 s.d.) for 10 subjects measured every 6 s. Filled circles represent continuous stimulation at 30 Hz; filled squares represent decreasing stimulus rate from 30 to 15 Hz; open squares represent sustained MVC. Force and EMG are expressed relative to the values obtained at the outset of each fatigue protocol. The differences in the final force values for the three protocols were of borderline significance (P = 0.054), but the difference between the 30 Hz protocol and the other protocols was significant when the force–time integral was calculated (P < 0.005; see Results).
Table 1.
Fatigue and endurance indices associated with three fatigue protocols each 60 s in duration: 30 Hz continuous stimulation (30 Hz), progressive decrease in stimulus rate from 30 to 15 Hz (30 → 15 Hz), and sustained maximum voluntary contraction (Voluntary)
| 30 Hz | 30 →15 Hz | Voluntary | |||
|---|---|---|---|---|---|
| Force | |||||
| Fatigue index | 0.69 ± 0.17 | 0.57 ± 0.14 | 0.52 ± 0.14 | ||
| (0.41 – 0.90) | (0.22 – 0.84) | (0.21 – 0.66) | |||
| Endurance index | 0.90 ± 0.13 | † | 0.76 ± 0.16 | 0.75 ± 0.08 | § |
| (0.65 – 1.04) | (0.46 – 0.93) | (0.64 – 0.87) | |||
| EMG | |||||
| Fatigue index | 0.69 ± 0.29 | † | 1.00 ± 0.28 | 0.78 ± 0.29 | |
| (0.19 – 1.18) | (0.74 – 1.65) | (0.34 – 1.21) | |||
| Endurance index | 0.99 ± 0.31 | 1.05 ± 0.20 | 0.89 ± 0.26 | ||
| (0.50 – 1.40) | (0.83 – 1.50) | (0.38 – 1.19) | |||
Data are presented as the mean ± S.D., with the range given in parentheses.
Significant difference (P < 0.05) 30 Hz vs. 30 → 15 Hz
significant difference (P < 0.05) Voluntary vs. 30 Hz.
EMG
There were clear differences in the EMG responses elicited during the various fatigue tests (Fig. 1). The average change in M-wave amplitude (for the two stimulation conditions) and in rectified EMG (for voluntary condition) are shown in Fig. 2B. During continuous stimulation at 30 Hz, after a brief period of potentiation, M-wave amplitude declined progressively to a final about 70 % of the initial amplitude (Table 1). In contrast, practically no change in M-wave amplitude was seen during the fatigue task that involved a gradual reduction in stimulus rate from 30 to 15 Hz (Fig. 2B). During sustained MVCs, the interference EMG signal decreased gradually over the test (Fig. 2B) to a final value of about 78 % of the initial level (Table 1).
The marked decrease in M-wave amplitude observed when stimulating at 30 Hz might have been due to fatigue-related increases in the duration of the M wave (Table 2), which could lead to temporal overlap and signal cancellation in successive surface-detected EMG potentials (Fuglevand, 1995). For example, Fig. 3A shows the transition from 15 Hz stimulation to 30 Hz recorded in one subject following a fatigue task involving continuous stimulation at 30 Hz. The peak-to-peak amplitude of the M waves decreased immediately by ∼15 % when stimulus frequency was increased to 30 Hz. Most of the decline in the M wave was due to a reduction in the magnitude of the positive phase of the evoked potentials.
Table 2.
Contractile and EMG parameters measured before and after three different fatigue protocols, each 60 s in duration: 30 Hz, 30 → 15 Hz and Voluntary
| Before fatigue | After fatigue | |||||||||
|---|---|---|---|---|---|---|---|---|---|---|
| 30 Hz | 30 → 15 Hz | Voluntary | 30 Hz | 30 → 15 Hz | Voluntary | |||||
| Brief tetani | ||||||||||
| 15 Hz force (N) | 46 ± 23 | 39 ± 22 | 42 ± 24 | 43 ± 271 | 37 ± 30 | 41 ± 31 | ||||
| (23 – 82) | (17 – 81) | (17 – 83) | (13 – 79)2 | (3 – 85) | (7 – 88) | |||||
| 90 ± 32%3 | 84 ± 36% | 89 ± 35% | ||||||||
| 30 Hz force (N) | 64 ± 30 | 57 ± 32 | 61 ± 30 | 45 ± 26 | 41 ± 29 | 54 ± 37 | ||||
| (24 – 123) | (22 – 111) | (20 – 119) | * | (15 – 80) | (8 – 87) | (13 – 112) | ||||
| 67 ± 18% | 67 ± 16% | 82 ± 23% ns | ||||||||
| 15:30 Hz force ratio | 0.70 ± 0.11 | 0.69 ± 0.10 | 0.69 ± 0.13 | 0.93 ± 0.06 | 0.82 ± 0.18 | 0.72 ± 0.11 | ||||
| (0.53 – 0.94) | (0.57 – 0.87) | (0.50 – 0.93) | * | (0.82 – 0.99) | † | (0.39 – 0.98) | ‡ | (0.54 – 0.83) | § | |
| 133 ± 25% | 121 ± 35% ns | 107 ± 28% ns | ||||||||
| Twitch | ||||||||||
| Amplitude (N) | 14 ± 7 | 13 ± 7 | 14 ± 8 | 5 ± 2 | 7 ± 4 | 6 ± 4 | ||||
| (6 – 28) | (5 – 25) | (4 – 32) | * | (3 – 8) | (2 – 13) | (3 – 12) | ||||
| 46 ± 21% | 59 ± 15% | 49 ± 20% | ||||||||
| Contraction time (ms) | 57 ± 10 | 52 ± 9 | 56 ± 10 | 69 ± 13 | 73 ± 15 | 69 ± 13 | ||||
| (44 – 72) | (38 – 69) | (43 – 70) | * | (48 – 81) | (53 – 94) | (47 – 87) | ||||
| 130 ± 28% | 138 ± 21% | 123 ± 10% | ||||||||
| Half-relaxation time (ms) | 60 ± 15 | 52 ± 13 | 52 ± 11 | 112 ± 25 | 112 ± 33 | 87 ± 21 | ||||
| (40 – 90) | (40 – 84) | (40 – 76) | * | (86 – 156) | (70 – 180) | ‡ | (66 – 134) | § | ||
| 208 ± 26% | 209 ± 56% | 173 ± 41% | ||||||||
| MVC | ||||||||||
| Force (N) | 114 ± 36 | 99 ± 41 | 109 ± 47 | 75 ± 31 | 73 ± 36 | 79 ± 41 | ||||
| (55 – 174) | (47 – 163) | (39 – 173) | * | (30 – 111) | (20 – 117) | (23 – 124) | ||||
| 65 ± 14% | 70 ± 13% | 67 ± 10% | ||||||||
| EMG (mV) | 0.21 ± 0.10 | 0.26 ± 0.15 | 0.23 ± 0.04 | 0.18 ± 0.11 | 0.23 ± 0.12 | 0.24 ± 0.13 | ||||
| (0.07 – 0.42) | (0.08 ± 0.50) | (0.17 ± 0.28) | (0.09 – 0.41) | (0.09 – 0.39) | (0.07 – 0.49) | |||||
| 87 ± 41% | 94 ± 32% | 101 ± 43% | ||||||||
| M wave | ||||||||||
| Peak-to-peak amplitude (mV) | 3.4 ± 1.9 | 4.4 ± 2.7 | 3.2 ± 1.5 | 3.4 ± 2.6 | 3.9 ± 2.4 | 3.2 ± 1.9 | ||||
| (1.4 – 7.9) | (1.4 – 10.00) | (1.3 – 5.5) | (0.5 – 9.2) | (1.0 – 5.9) | (0.3 – 6.0) | |||||
| 91 ± 38% | 94 ± 33% | 102 ± 57 | ||||||||
| Peak-to-peak duration (ms) | 4.0 ± 1.1 | 3.7 ± 0.8 | 4.2 ± 1.3 | 6.0 ± 2.0 | 5.9 ± 1.5 | 5.6 ± 1.6 | ||||
| (2.4 – 6.4) | (2.4 – 4.8) | (2.0 – 5.2) | * | (2.8 – 8.8) | (2.8 – 8.0) | (3.2 – 8.0) | ||||
| 160 ± 75% | 163 ± 53% | 144 ± 60 | ||||||||
The first three columns of data represent control measures obtained from the 10 subjects in the three different experimental sessions. Data are presented as the mean ± S.D., with the range given in parentheses and, where appropriate (after fatigue data), the mean ± S.D. percentage of the pre-fatigue value. ns = difference not significant.
Significant difference (P < 0.05) before vs. after fatigue
significant difference (P < 0.05) 30 Hz vs. 30 → 15 Hz
significant difference (P < 0.05) 30 → 15 Hz vs. Voluntary
significant difference (P < 0.05) Voluntary vs. 30 Hz.
Figure 3. Evaluation of EMG signal cancellation due to temporal summation of overlapping evoked potentials during high-frequency stimulation.
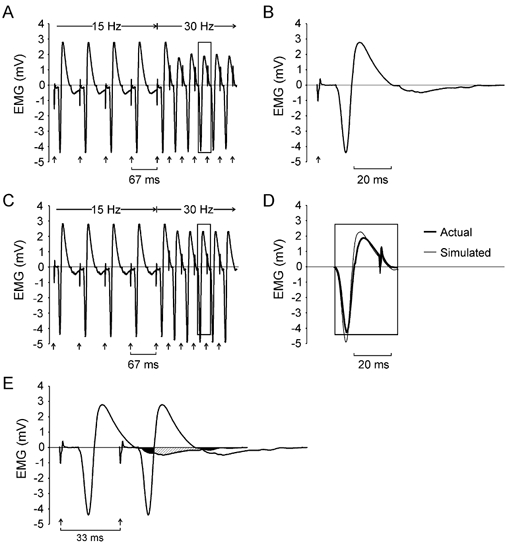
A, M waves recorded in one subject during a transition from 15 to 30 Hz following a fatigue protocol involving continuous stimulation at 30 Hz. Arrows show the timing of stimuli delivered to the ulnar nerve. The associated stimulus artefacts are evident in the EMG recording. Note the reduction in the positive phase of M waves during 30 Hz stimulation. B, an M wave evoked in the same subject 1 s after completion of a fatigue protocol. This M wave was then used to simulate an EMG signal by linear summation of 10 of these waveforms distributed in time with intervals equivalent to the interstimulus intervals shown in A. The resulting simulated EMG signal is shown in C. D, superimposed M waves extracted from the actual recording during 30 Hz stimulation (rectangle in A) and during simulation of 30 Hz stimulation (rectangle in C). The top and bottom of the rectangles in A, C and D indicate the magnitude of the positive and negative peak of the M wave shown in B. Note that while there was some reduction in the positive phase of the simulated M waves during 30 Hz stimulation, the magnitude of the negative potential also increased. Consequently, there was little change in the peak-to-peak amplitude of the simulated M wave with 30 Hz stimulation. E, regions of overlap between two successive potentials when stimulating at 30 Hz. A portion of the terminal negative phase of the first potential (black area) overlaps with the initial negative phase of the second potential, leading to an increase in the amplitude of the negative phase in the summed response. A later portion of the terminal negative phase of the first potential (hatched area) overlaps with the positive phase of the second potential causing a decrease in the amplitude of the positive phase in the summed response.
To assess the role that signal cancellation may have played in the reduction of evoked potentials shown in Fig. 3A, the M wave recorded 1 s after the fatigue test in this subject (Fig. 3B) was used to simulate the EMG signal associated with a train of stimuli that involved a transition from 15 to 30 Hz (Fig. 3C). The simulation simply entailed a linear summation of the 10 voltage waveforms shown in Fig. 3B distributed in time with intervals equivalent to the interstimulus intervals shown in Fig. 3A. The positive phases of the simulated EMG responses shown in Fig. 3C decreased when stimulus frequency was increased to 30 Hz, similar to that shown in the recording in Fig. 3A. However, the amplitude of the negative phase in the simulated responses was larger after the transition to 30 Hz (Fig. 3D).
The cause of this pattern of change in simulated M waves following 30 Hz activation can be appreciated by examining regions of overlap between two successive potentials (Fig. 3E). The increase in the negative phase was due to temporal overlap of the terminal negative phase of one potential (black area) with the initial negative phase of the subsequent potential. Likewise, the reduction in the positive phase was due to overlap of the terminal negative phase of the one potential (hatched area) with the positive phase of the subsequent potential. Overall, however, there was little change in the peak-to-peak amplitude of the simulated responses during 30 Hz stimulation. Therefore, the reduction in peak-to-peak amplitude of the evoked EMG responses when stimulating at 30 Hz in the fatigued adductor pollicis is not explicable on the basis of signal cancellation associated with temporal overlap of adjacent potentials.
Comparison of contractile and EMG responses before and after fatigue
The contractile and EMG responses obtained before and after each fatigue protocol are compiled in Table 2. The first three columns of data in Table 2 represent control measures obtained from 10 subjects in the three different experimental sessions. The means (as well as standard deviations and ranges) were similar across the control sessions and were not significantly different from one another, suggesting that the experimental measures were reasonably reliable.
The 15:30 Hz force ratio
Brief stimulation at 15 and 30 Hz provided a simple means to estimate the form of the force-frequency curve by measuring two salient points that comprise the relationship. Stimulation of the ulnar nerve at 30 Hz with supramaximal current pulses prior to fatigue elicited an isometric force of, on average, about 60 N (Table 2). This is substantially less than the pre-fatigue MVC force (average across all sessions, 107 ± 40 N). More force would have been generated with electrical stimulation had higher rates been used. In two subjects in whom complete force-frequency data were obtained, the force exerted with 30 Hz stimulation was 73 % and 85 % of the force produced with 100 Hz stimulation, similar to the values reported by Edwards et al. (1977) and Martin et al. (1999). Still, the MVC force was about 30 % greater than the force evoked with supramaximal stimulation at 100 Hz (also see Martin et al. 1999). This is because other muscles, such as the flexor pollicis longus, contribute to thumb adduction force during MVC, but are not activated by ulnar nerve stimulation (Marsden et al. 1983).
Prior to fatigue, 15 Hz stimulation evoked ∼70 % of the force generated at 30 Hz (Table 2). After the fatigue protocol with continuous stimulation at 30 Hz, the 15:30 Hz ratio increased significantly suggesting a shift in the force-frequency relationship towards lower frequencies. After the fatigue protocol involving a decrease in stimulus rate from 30 to 15 Hz, the 15:30 Hz ratio increased modestly (but not significantly). The 15:30 Hz ratio did not change following voluntary fatigue. This absence of change after voluntary fatigue might have been partly due to the brief recovery period (see Fig. 1C) between the end of the fatigue test and the onset of the 15:30 Hz stimulation. Nevertheless, in no case did stimulation at the lower frequency after fatigue lead to greater force output than stimulation at the higher frequency (i.e. 15:30 Hz force ratio was always < 1.0, Table 2). This is in contrast to the observations of Jones et al. (1979), in which markedly greater force was exerted when stimulus frequency was lowered to 20 Hz from initial sustained rates of 80 or 100 Hz.
Twitch
Overall, the twitch amplitude was reduced by about 50 % following all three fatigue protocols (Table 2). In addition, a marked increase in both twitch contraction time and half-relaxation time occurred following each of the three fatigue protocols. The increase in half-relaxation time was significantly greater following the two electrical stimulation protocols compared to that following voluntary contraction. Again, the smaller change after voluntary fatigue might have been due partly to the brief period of relaxation (∼1 s) before stimulating at 15:30 Hz and evoking the twitch. The half-relaxation time increased by more than 100 % after the electrical stimulation protocols and by about 70 % after the sustained voluntary contraction. Fatigue induced with electrical stimulation was also associated with greater values of 15:30 Hz force ratio. Such changes are consistent with the idea that slowing of contractile responses with fatigue can lead to a shift in the force–frequency relationship towards lower frequencies (Bigland-Ritchie et al. 1983b).
M wave
The peak-to-peak amplitude of the M wave delivered 1 s after the end of the fatigue protocol was not significantly different from that evoked prior to fatigue (Table 2). The duration of the M wave, however, increased markedly following all three types of fatigue protocol.
MVC
The maximum force that could be exerted voluntarily declined by about 30 % following all three of the 60 s fatigue protocols (Table 2). There were no significant differences in the post-fatigue MVC force values across the different types of protocols. The decline in MVC force, however, was not accompanied by a significant decrease in the magnitude of the rectified average EMG. While highly variable, the average post-fatigue MVC EMG across all three conditions was 94 ± 39 % (range 37–177 %) of the pre-fatigue MVC EMG. Interestingly, the magnitude of the rectified average EMG at the end of the sustained MVC (78 ± 29 %) was significantly smaller than that obtained a few seconds later during the subsequent brief post-fatigue MVC (101 ± 43 % of pre-fatigue MVC). Therefore, the combination of neural and muscular factors that likely contribute to the reduction in EMG during a sustained MVC appear to recover rapidly.
DISCUSSION
We have shown here that isometric force in the human adductor pollicis muscle is better maintained in response to sustained stimulation at 30 Hz compared to when stimulus frequency decreases from 30 to 15 Hz over a 60 s period. This pattern of decrease in stimulus frequency roughly corresponds to the change in motor unit firing rates recorded in the adductor pollicis during a sustained MVC (Bigland-Ritchie et al. 1983a). In addition, the relative loss of force during the fatigue task involving a decrease in stimulus frequency from 30 to 15 Hz was practically identical to that recorded during a sustained MVC. The implications of these findings with regard to the concept of muscle wisdom and the mechanisms of fatigue are outlined below.
First, however, it is important to consider the degree to which the 30–15 Hz stimulation protocol corresponds to the pattern of motor unit discharge that occurs during a sustained MVC. One obvious difference is that with electrical stimulation, all motor units are induced to discharge identically, whereas during an MVC, there is known to be a wide variation in discharge rates across a motor unit population (Bigland-Ritchie et al. 1983a). There may even be systematic differences in the rates of discharge at the outset of a MVC, with low-threshold units tending to discharge at greater rates than high-threshold units during strong contractions (Tanji & Kato, 1973; Monster & Chan, 1977; De Luca et al. 1982). Furthermore, the degree of decrease in discharge rate during the sustained contraction may vary across motor unit types. High-threshold motor neurons innervating fast-twitch motor units exhibit a greater reduction in firing rate in response to sustained depolarizing current than do low-threshold motor neurons supplying slow-twitch units (Kernell & Monster, 1982a, b). Therefore, there is likely to be a wide range of discharge patterns across a population of motor units during a sustained MVC. Consequently, the stimulus sequence use in the present experiments to mimic motor unit discharge must be considered only as a crude outline of the average pattern of activity that occurs during sustained maximal contractions.
In an important set of experiments, Jones, Bigland-Ritchie and their colleagues showed that force (Jones et al. 1979) and associated EMG responses (Bigland-Ritchie et al. 1979) decreased markedly, and more or less in parallel, when the adductor pollicis muscle was stimulated at a high rate (80–100 Hz). However, when the stimulus rate was suddenly reduced to 20 Hz after about 40 s of high-frequency stimulation, force and EMG responses recovered to a large degree. Those observations indicated that high-frequency stimulation probably leads to impaired muscle activation (as reflected in the decrease in the EMG responses), which in turn contributes to loss of force (Jones 1982; Jones & Bigland-Ritchie, 1986, Jones, 1996). Furthermore, Jones & Bigland-Ritchie (1986) provided compelling evidence from experiments in isolated mouse muscle, which was supported by later studies (e.g. Cairns & Dulhunty, 1995), that the mechanism underlying the high-frequency impairment of muscle excitation was probably related to a disturbance in the normal concentrations of extracellular ions.
Those findings, in addition to their fundamental importance in neuromuscular physiology, played a prominent role in the interpretation of the neural and muscular adaptations that accompany the fatigue associated with voluntary contractions. Key among those was the observation that the discharge rates of motor units usually decreased from an initial level of around 30 impulses s−1 to about 15 impulses s−1 during a sustained MVC lasting 1 min (Grimby et al. 1981; Bigland-Ritchie et al. 1983a, Gandevia et al. 1990; Peters & Fuglevand, 1999). Another adaptation that may occur during a sustained voluntary contraction is a slowing in contractile speed (Bigland-Ritchie et al. 1983b), which in turn should promote a shift in the force-frequency curve towards lower frequencies (Bigland-Ritchie et al. 1983b; cf. Binder-Macleod & McDermond, 1992; Fuglevand et al. 1999) and thereby allow maximum muscle or motor unit force to be achieved with lower activation rates (Bigland-Ritchie et al. 1983b; Bigland-Ritchie & Woods, 1984). These observations, together with the finding that high-frequency activation leads to impaired muscle excitation, led to the proposal (referred to as muscle wisdom) that the decreases in motor neuron output observed during an MVC is an adjustment of the central nervous system that optimizes, rather than undermines, force output during fatigue (Bigland-Ritchie et al. 1983a, b; Marsden et al. 1983).
The present study, however, raises some doubts as to the literal interpretation of this hypothesis (see also reviews by Fuglevand, 1996; Gandevia, 2001; Garland & Gossen, 2002). Specifically, minimal loss of force was observed in the present investigation when the activation frequency of the adductor pollicis was maintained for 1 min at a rate comparable to the peak discharge rate recorded from motor units during brief MVCs. When stimulus frequency was allowed to decay in a way that resembled the decline in motor unit discharge recorded during a sustained MVC, significantly greater force loss occurred. Furthermore, when stimulus frequency was changed abruptly from 30 to 15 Hz at the termination of the fatigue protocols, in no case did the lower frequency elicit greater force. It seems, therefore, that little deficit in muscle excitation was accrued when the activation rate was maintained at a rate that roughly corresponded to the maximum rates generated during voluntary effort. Consequently, little benefit in terms of force output was gained by decreasing activation rate; indeed, such a decrease in rate was associated with augmented force loss.
The main difference between the studies of Jones et al. (1979) and Bigland-Ritchie et al. (1979) and the present investigation is related to the magnitude of stimulus rates used to fatigue the adductor pollicis. At the time of those earlier studies, little was known about the maximum rates of motor unit discharge during voluntary contraction. Accordingly, the sustained frequency used in their fatigue protocol corresponded to the frequency required initially to generate maximum force in the muscle, usually around 80 Hz. Nevertheless, in both the earlier and the current investigation, the amplitude of the EMG responses decreased in response to sustained high-frequency stimulation: by 30 % on average when stimulating at 30 Hz for 60 s (present study), and by about 75 % when stimulating at 80 Hz (Bigland-Ritchie et al. 1979).
The decrease in EMG associated with high-frequency stimulation in the present study, however, was not directly related to a decline in force. For example, in Fig. 1A, force was well maintained during the 60 s fatigue protocol, despite a substantial reduction in EMG amplitude. In contrast, force decreased markedly during the fatigue protocol shown in Fig. 1B, while EMG responses were little altered. The dissociation between EMG and force can be further appreciated in Fig. 1B where an increase in stimulus frequency to 30 Hz at the end of the fatigue protocol caused an increase in force output and a decrease in EMG amplitude. This decrease in EMG when stimulating at 30 Hz but not at 15 Hz, however, did not appear to be due to signal cancellation associated with temporal overlap of adjacent potentials (Fig. 3).
Therefore, the reduction in evoked EMG observed when stimulating at high frequencies seen in this study and others (Bigland-Ritchie et al. 1979; Clamann & Robinson, 1985; Enoka et al. 1989) presumably reflects some decrease in the amplitude of the sarcolemma action potential (Sandercock et al. 1985; Lännergren & Westerblad, 1986; Metzger & Fitts, 1986; Radicheva et al. 1986) consequent to an activity-related change in the transmembrane distribution of electrolytes (Hirche et al. 1980; Vyskocil et al. 1983; Sjøgaard, 1991). If the decrease is large enough, the sarcolemma action potential may fail to fully engage the voltage-sensor and calcium-release system of the t-tubules, and thereby lead to incomplete activation and force loss (Fuglevand, 1995). However, when muscle is activated continuously at high rates that are similar to those encountered naturally (as in the present study), it appears that the sarcolemma action potential, while decreasing, continues to operate within its safety margin such that little deficit in fibre activation occurs (Sandow, 1952). On the other hand, when muscle is driven at unusually high rates (e.g. 80 Hz), the time-dependent processes that operate to maintain an optimal ionic environment for action-potential conduction may be temporarily overwhelmed (Sjøgaard & McComas, 1995), causing a more severe diminution of the sarcolemma action potential and impaired excitation-contraction coupling. Reduction of the stimulus rate from the unnaturally high level of 80 Hz to one within the physiological range (20 Hz) in the study of the Jones et al. (1979), therefore, may have allowed partial restoration of the transmembrane concentration gradients, leading to a rapid recovery of the sarcolemma action potential (Bigland-Ritchie et al. 1979) and an increase in force.
The decrease in amplitude of the interference EMG signal detected during the sustained MVC (Fig. 2B, also Bigland-Ritchie et al. 1983b) might also have been associated with some reduction in sarcolemma action potentials. However, there was little decline in evoked potentials during the stimulation protocol meant to mimic the pattern of discharge associated with a voluntary contraction (Fig. 2B). Therefore, the decrease in EMG observed during sustained MVCs might be more related to the decline in motor unit discharge rates (Grimby et al. 1981; Bigland-Ritchie et al. 1983b) and the possibility that some motor units stop discharging altogether (Peters & Fuglevand, 1999).
Finally, it is of interest to consider the implications of the present findings in terms of the underlying mechanisms of fatigue. In an extensive review, Gandevia (2001) has summarized several lines of evidence implicating the central nervous system in fatigue. While indirect, the current results also support the view that loss of force during sustained activity is due, in part, to a failure of the central nervous system to provide an adequate level of drive to the muscle. In particular, force loss was less when the adductor pollicis was artificially activated at a rate of 30 Hz for 60 s compared to that associated with a sustained MVC. This finding seems at odds with those of Merton (1954) and Bigland-Ritchie et al. (1983b), in which force generated with electrical stimulation never exceeded that produced during voluntary effort, and led to the conclusion that the central nervous system fully activates muscle during fatiguing contractions (see also Jones & Bigland-Ritchie, 1986). However, it is clear from records like those shown in Fig. 1a of Jones & Bigland-Ritchie (1986) that the absolute force exerted by the adductor pollicis in response to 20 Hz stimulation was indeed greater than that generated by an MVC after about 30 s of sustained effort.
In conclusion, the findings of the present study do not support the muscle wisdom hypothesis and suggest that fatigue during a 60 s sustained contraction is enhanced, rather than reduced, by a decline in the discharge rates of the motor units. Therefore, the view that fatigue is caused primarily by the impairment of processes within muscle (Fitts, 1994) requires expansion to include a significant component related to neural factors (Gandevia, 2001).
Acknowledgments
This work was supported by NIH grants AR 42893 and NS 39489 to AJF.
References
- Bigland-Ritchie B, Johansson R, Lippold OJC, Smith S, Woods JJ. Changes in motoneurone firing rates during sustained maximal voluntary contractions. J Physiol. 1983a;340:335–346. doi: 10.1113/jphysiol.1983.sp014765. [DOI] [PMC free article] [PubMed] [Google Scholar]
- Bigland-Ritchie B, Johansson R, Lippold OJC, Smith S, Woods JJ. Contractile speed and EMG changes during fatigue of sustained maximal voluntary contractions. J Neurophysiol. 1983b;50:313–324. doi: 10.1152/jn.1983.50.1.313. [DOI] [PubMed] [Google Scholar]
- Bigland-Ritchie B, Jones DA, Woods JJ. Excitation frequency and muscle fatigue: electrical responses during human voluntary and stimulated contractions. Exp Neurol. 1979;64:414–427. doi: 10.1016/0014-4886(79)90280-2. [DOI] [PubMed] [Google Scholar]
- Bigland-Ritchie B, Woods JJ. Changes in muscle contractile properties and neural control during human muscular fatigue. Muscle Nerve. 1984;7:691–699. doi: 10.1002/mus.880070902. [DOI] [PubMed] [Google Scholar]
- Binder-MacLeod SA, McDermond LR. Changes in the force-frequency relationship of the human quadriceps femoris muscle following electrically and voluntarily induced fatigue. Phys Ther. 1992;72:95–104. doi: 10.1093/ptj/72.2.95. [DOI] [PubMed] [Google Scholar]
- Cairns SP, Dulhunty AF. High-frequency fatigue in rat skeletal muscle: role of extracellular ion concentrations. Muscle Nerve. 1995;18:890–898. doi: 10.1002/mus.880180814. [DOI] [PubMed] [Google Scholar]
- Clamann HP, Robinson AJ. A comparison of electromyographic and mechanical fatigue properties in motor units of the cat hindlimb. Brain Res. 1985;327:203–219. doi: 10.1016/0006-8993(85)91514-8. [DOI] [PubMed] [Google Scholar]
- De Luca CJ, Lefever RS, McCue MP, Xenakis AP. Behavior of human motor units in different muscles during linearly varying contractions. J Physiol. 1982;329:113–128. doi: 10.1113/jphysiol.1982.sp014293. [DOI] [PMC free article] [PubMed] [Google Scholar]
- Edwards RHT, Young A, Hosking GP, Jones DA. Human skeletal muscle function: description of tests and normal values. Clin Sci Mol Med. 1977;52:283–290. doi: 10.1042/cs0520283. [DOI] [PubMed] [Google Scholar]
- Enoka RM, Rankin LL, Stuart DG, Volz KA. Fatigability of rat hindlimb muscle: associations between electromyogram and force during a fatigue test. J Physiol. 1989;408:251–270. doi: 10.1113/jphysiol.1989.sp017458. [DOI] [PMC free article] [PubMed] [Google Scholar]
- Fitts RH. Cellular mechanisms of muscle fatigue. Physiol Rev. 1994;74:49–94. doi: 10.1152/physrev.1994.74.1.49. [DOI] [PubMed] [Google Scholar]
- Fuglevand AJ. The role of the sarcolemma action potential in fatigue. In: Gandevia SC, Enoka RM, McComas AJ, Stuart DG, Thomas CK, editors. Fatigue: Neural and Muscular Mechanisms. New York: Plenum; 1995. pp. 101–108. [Google Scholar]
- Fuglevand AJ. Neural aspects of fatigue. Neuroscientist. 1996;2:203–206. [Google Scholar]
- Fuglevand AJ, Macefield VG, Bigland-Ritchie B. Force-frequency and fatigue properties of motor units in muscles that control digits of the human hand. J Neurophysiol. 1999;81:1718–1729. doi: 10.1152/jn.1999.81.4.1718. [DOI] [PubMed] [Google Scholar]
- Gandevia SC. Spinal and supraspinal factors in human muscle fatigue. Physiol Rev. 2001;81:1725–1789. doi: 10.1152/physrev.2001.81.4.1725. [DOI] [PubMed] [Google Scholar]
- Gandevia SC, Macefield G, Burke D, McKenzie DK. Voluntary activation of human motor axons in the absence of muscle afferent feedback. Brain. 1990;113:1563–1581. doi: 10.1093/brain/113.5.1563. [DOI] [PubMed] [Google Scholar]
- Garland SJ, Gossen ER. The muscular wisdom hypothesis in human muscle fatigue. Exerc Sport Sci Rev. 2002;30:45–49. doi: 10.1097/00003677-200201000-00009. [DOI] [PubMed] [Google Scholar]
- Grimby L, Hannerz J, Hedman B. The fatigue and voluntary discharge properties of single motor units in man. J Physiol. 1981;316:545–554. doi: 10.1113/jphysiol.1981.sp013805. [DOI] [PMC free article] [PubMed] [Google Scholar]
- Hirche H, Schumacher E, Hagemann H. Extracellular K+ concentration and K+ balance of the gastrocnemius muscle of the dog during exercise. Pflugers Arch. 1980;387:231–237. doi: 10.1007/BF00580975. [DOI] [PubMed] [Google Scholar]
- Jones DA. Muscle fatigue due to changes beyond the neuromuscular junction. In: Edwards RHT, editor. Human Muscle Fatigue: Physiological Mechanisms. London: Pitman Medical London; 1982. pp. 178–196. [Google Scholar]
- Jones DA. High- and low-frequency fatigue revisited. Acta Physiol Scand. 1996;156:265–270. doi: 10.1046/j.1365-201X.1996.192000.x. [DOI] [PubMed] [Google Scholar]
- Jones DA, Bigland-Ritchie B. Electrical and contractile changes in muscle fatigue. In: Saltin B, editor. Biochemistry of Exercise: International Series on Sport Sciences. Champaign, IL, USA: Human Kinetics; 1986. pp. 377–392. [Google Scholar]
- Jones DA, Bigland-Ritchie B, Edwards RHT. Excitation frequency and muscle fatigue: mechanical responses during voluntary and stimulated contractions. Exp Neurol. 1979;64:401–413. doi: 10.1016/0014-4886(79)90279-6. [DOI] [PubMed] [Google Scholar]
- Kernell D, Monster AW. Time course and properties of late adaptation in spinal motoneurons of the cat. Exp Brain Res. 1982a;46:191–196. doi: 10.1007/BF00237176. [DOI] [PubMed] [Google Scholar]
- Kernell D, Monster AW. Motoneurone properties and motor fatigue an intracellular study of gastrocnemius motoneurones of the cat. Exp Brain Res. 1982b;46:197–204. doi: 10.1007/BF00237177. [DOI] [PubMed] [Google Scholar]
- Krnjevic K, Miledi R. Failure of neuromuscular propagation in rats. J Physiol. 1958;140:440–461. [PMC free article] [PubMed] [Google Scholar]
- Lännergren J, Westerblad H. Force and membrane potential during and after fatiguing, continuous high-frequency stimulation of single Xenopus muscle fibers. Acta Physiol Scand. 1986;128:359–368. doi: 10.1111/j.1748-1716.1986.tb07989.x. [DOI] [PubMed] [Google Scholar]
- Lüttgau HC. The effect of metabolic inhibitors on the fatigue of the action potential in single muscle fibres. J Physiol. 1965;178:45–67. doi: 10.1113/jphysiol.1965.sp007613. [DOI] [PMC free article] [PubMed] [Google Scholar]
- Macefield VG, Fuglevand AJ, Howell JN, Bigland-Ritchie B. Discharge behavior of single motor units during maximal voluntary contractions of a human toe extensor. J Physiol. 2000;528:227–234. doi: 10.1111/j.1469-7793.2000.00227.x. [DOI] [PMC free article] [PubMed] [Google Scholar]
- Marsden CD, Meadows JC, Merton PA. ‘Muscular wisdom’ that minimizes fatigue during prolonged effort in man: peak rates of motoneuron discharge and slowing of discharge during fatigue. In: Desmedt JE, editor. Motor Control Mechanisms in Health and Disease. New York: Raven; 1983. pp. 169–211. [PubMed] [Google Scholar]
- Martin A, Carpentier A, Guissard N, Van Hoecke J, Duchateau J. Effect of time of day on force variation in a human muscle. Muscle Nerve. 1999;22:1380–1387. doi: 10.1002/(sici)1097-4598(199910)22:10<1380::aid-mus7>3.0.co;2-u. [DOI] [PubMed] [Google Scholar]
- Merton PA. Voluntary strength and fatigue. J Physiol. 1954;123:553–564. doi: 10.1113/jphysiol.1954.sp005070. [DOI] [PMC free article] [PubMed] [Google Scholar]
- Metzger JM, Fitts RH. Fatigue from high- and low-frequency muscle stimulation: role of sarcolemma action potentials. Exp Neurol. 1986;93:320–333. doi: 10.1016/0014-4886(86)90193-7. [DOI] [PubMed] [Google Scholar]
- Monster AW, Chan H. Isometric force production by motor units of extensor digitorum communis muscle in man. J Neurophysiol. 1977;40:1432–1443. doi: 10.1152/jn.1977.40.6.1432. [DOI] [PubMed] [Google Scholar]
- Peters EJD, Fuglevand AJ. Cessation of human motor unit discharge during sustained maximal voluntary contraction. Neurosci Lett. 1999;274:66–70. doi: 10.1016/s0304-3940(99)00666-7. [DOI] [PubMed] [Google Scholar]
- Radicheva N, Gerilovsky L, Gydikov A. Changes in the muscle fibre extracellular action potentials in long-lasting (fatiguing) activity. Eur J Appl Physiol. 1986;55:545–552. doi: 10.1007/BF00421651. [DOI] [PubMed] [Google Scholar]
- Sandercock TG, Faulkner JA, Albers JW, Abbrecht PH. Single motor unit and fiber action potentials during fatigue. J Appl Physiol. 1985;58:1073–1079. doi: 10.1152/jappl.1985.58.4.1073. [DOI] [PubMed] [Google Scholar]
- Sandow A. Excitation-contraction coupling in muscular response. Yale J Biol Med. 1952;25:176–201. [PMC free article] [PubMed] [Google Scholar]
- Sjøgaard G. Role of exercise-induced potassium fluxes underlying muscle fatigue: a brief review. Can J Physiol Pharm. 1991;69:238–245. doi: 10.1139/y91-037. [DOI] [PubMed] [Google Scholar]
- Sjøgaard G, McComas AJ. Role of interstitial potassium. In: Gandevia SC, Enoka RM, McComas AJ, Stuart DG, Thomas CK, editors. Fatigue: Neural and Muscular Mechanisms. New York: Plenum; 1995. pp. 69–80. [Google Scholar]
- Tanji J, Kato M. Firing rate of individual motor units in voluntary contraction of abductor digiti minimi muscle in man. Exp Neurol. 1973;40:771–783. doi: 10.1016/0014-4886(73)90111-8. [DOI] [PubMed] [Google Scholar]
- Vyskocil F, Hník P, Rehfeldt H, Vejsada R, Ujec E. The measurement of K+ concentration changes in human muscles during volitional contractions. Pflugers Arch. 1983;399:235–237. doi: 10.1007/BF00656721. [DOI] [PubMed] [Google Scholar]