

Abstract
In order to examine the phenotypic consequences of genetic manipulation in the function of the sinoatrial (SA) node, it is a prerequisite to record the electrical activities of a single pacemaker cell of the SA node of mouse heart. In the present study, we isolated spontaneously beating pacemaker cells from the SA node by enzymatic digestion. The rate of spontaneous action potential firing was 294 ± 59 min−1 at 33–34 °C. The maximal diastolic potential (MDP) was −56.7 ± 7.4 mV and the overshoot was 22.7 ± 6.2 mV. With hyperpolarizing voltage clamp pulses, the hyperpolarization-activated, cyclic nucleotide-sensitive cation current (Ih or If) was recorded. Ih started to activate at −70 to ≈−80 mV, more negative than MDP. The half-maximal activation of Ih was obtained at −107.9 ± 10.4 mV. The inward-rectifier K+ current (IK1) was also recorded in spontaneously beating myocytes. However, the amplitude of outward IK1 was negligibly small (9.1 ± 3.4 pA at −60 mV). With depolarization, voltage-gated Na+ current, L-type Ca2+ current and T-type Ca2+ current were consistently observed. The sustained inward current (Ist) was also recorded in spontaneously beating pacemaker cells. E4031-sensitive, rapidly activating delayed rectifier K+ current (IKr) was activated by depolarization, although the amplitude was no more than 38.3 ± 22.2 pA at 0 mV. The chromanol 293B-sensitive, slowly activating delayed rectifier K+ current (IKs) was not present. The major repolarizing current was the slowly inactivating, 4-aminopyridine-insensitive outward current. We concluded that mouse pacemaker cells possess similar membrane currents, including Ist, to those of other species.
In order to explore the physiological functions of ion channels, transporters and receptors expressed in the heart, many strains of transgenic and gene-targeted mice have so far been generated. They are also used as models for congenital ECG abnormalities such as long QT syndrome (Nerbonne et al. 2001; Keating & Sanguinetti, 2001). In some strains, genetic manipulations have given rise to functional abnormalities of the sinoatrial (SA) node and conduction system. For example, targeted disruption of the α1D subunit of L-type Ca2+ channels led to sinus bradycardia and atrioventricular (AV) block (Platzer et al. 2000). Complete disruption of Kir2.1 unexpectedly produced sinus bradycardia as well as prolongation of ventricular action potential (Zaritsky et al. 2001). Sinus bradycardia was also observed in the mouse expressing the dominant negative KCNQ1-isoform2 (Demolombe et al. 2001). AV block was evident when the pore mutant Kv4.2W362F was expressed in Kv1.4 knockout mouse (Guo et al. 2000). Most recently, it has been reported that a mouse lacking HCN2, one of the hyperpolarization-activated, cyclic nucleotide-sensitive cation channel (HCN) family, has sinus dysrhythmia (Ludwig et al. 2003).
In order to evaluate such phenotypic consequences of genetic manipulation of SA node function, it is a prerequisite to understand the electrophysiological properties of the pacemaker cells in the mouse SA node (Verheijck et al. 2001; Mangoni & Nargoet, 2001). In the present study, we performed systematic examination of spontaneously beating pacemaker cells isolated from the mouse SA node, and identified at least eight kinds of ionic currents including the sustained inward current (Ist).
METHODS
All experiments were carried out according to the Guiding Principles for Using Experimental Animals in the Field of Physiological Science, laid down by the Japanese Physiological Society.
Cell isolation
We purchased ddY mice, which were bred in a closed colony, from Nippon SLC (Hamamatsu, Japan). The ddY mice of both sexes (8–10 weeks, body weight 30–40 g) were deeply anaesthetized with an intramuscular injection of 100 mg pentobarbital sodium. The chest was opened under artificial ventilation, and an injection needle (25 g) connected to the perfusion line was inserted from the right ventricular apex. The tip of the needle was positioned in the cavity of the right atrium. The atrial cavity was perfused with normal Tyrode solution containing heparin (5 i.u. ml−1) until the blood was washed out from the heart (usually for 3–5 min). The perfusion rate was 7 ml min−1, the hydrostatic pressure was 70 cmH2O and the temperature was 37 °C. In the meantime, the inferior vena cava was ligated and cut distal to the ligature, and the superior vena cava was cut as distal as possible. After the drainage became blood-free, normal Tyrode solution was switched to nominally Ca2+-free Tyrode solution to stop the spontaneous beating. Then, nominally Ca2+-free Tyrode solution containing 0.3 mg ml−1 trypsin (Wako, Osaka, Japan) was applied for 5 min to remove the endocardial endothelium. This was followed by further enzymatic digestion with the nominally Ca2+-free Tyrode solution containing 0.85 mg ml−1 collagenase (Wako) and 0.2 mg ml−1 protease (Sigma, USA). During this period, the lung and connective tissue around the superior vena cava were removed. After enzymatic digestion for 5 min, the heart was removed. The right atrium was opened with an incision along the sulcus terminalis into the vena cava in the collagenase solution. A strip of tissue was removed from the intercaval region very near and parallel to the crista terminalis so that it contained the primary pacemaking region (Verheijck et al. 2001). This excised SA node tissue was placed in a vial filled with 5 ml of the nominally Ca2+-free Tyrode solution containing 0.85 mg ml−1 collagenase (Wako), 0.2 mg ml−1 protease (Sigma) and 0.4 mg ml−1 elastase (Boehringer Mannheim GmbH, Germany). This vial was placed in a water bath (37 °C) for 5–10 min. Finally, the strip was transferred to a tissue culture dish containing Kraft-Brühe (KB) solution. The KB solution was refreshed twice to remove the enzymatic solution. The strip was fixed on the bottom of the dish with fine mesh. Single myocytes were gently isolated from the strip by puffing KB solution out of a glass pipette (tip diameter of 1–1.5 mm) for 5–10 min. The dissociated cells were kept in KB solution for up to 5 h (4 °C) until used. A drop of cell suspension was transferred to the recording bath. Then the myocytes were perfused with normal Tyrode solution. We used only spindle-shaped, spontaneously beating myocytes (≈2 % of total cells).
Composition of solutions
The control Tyrode solution contained (mM): NaCl 140; NaH2PO4 0.33; KCl 5.4; MgCl2 0.5; CaCl2 1.8; N-(2-hydroxyethyl)piperizine-N′-(2-ethanesulphonic acid) (Hepes) 5; glucose 5.5. The pH was adjusted to 7.4 with NaOH. KB solution contained (mM): 2-aminoethanesulphonic acid (taurine) 10; glutamic acid 70; KCl 25; KH2PO4 10; glucose 11; O,O′-bis(2-aminoethyl)-ethyleneglycol-N,N,N′,N′-tetraacetic acid (EGTA) 0.5; Hepes 10; and the pH was adjusted to 7.3 with KOH. For the electrophysiological experiments, the control Tyrode solution was used as the bath solution. BaCl2 and CsCl were added to the control Tyrode solution when required. In the whole-cell patch experiments, the pipette solution contained: aspartic acid 100; adenosine 5′-triphosphate dipotassium salt 5.0; creatine phosphate disodium salt 5; EGTA 5; guanine 5′-triphosphate sodium salt 0.1; Hepes 5; KCl 20; KOH 100; and MgCl2 1. The pH was adjusted to 7.2 with KOH.
Whole-cell recordings
The whole-cell patch clamp experiments were carried out using a patch clamp amplifier (Axopatch 1D, Axon Instruments, CA, USA). The tip diameter of the electrode was approximately 2–3 μm and its resistance was 3–7 MΩ. After the formation of a gigaohm seal (> 3 GΩ) in control Tyrode solution, we ruptured the patch membrane to form the whole-cell patch configuration. Because the Cl− concentration of the pipette solution was 20 mM, we corrected the liquid junction potential (−10 mV) between the pipette solution and control Tyrode solution. The input capacitance of the myocytes was determined by integrating capacitive current at the onset of a voltage jump. Approximately 70 % of the series resistance was corrected. The experiments were carried out at 33–35 °C. The statistical data are expressed as means ± S.D.
RESULTS
Morphology, action potential waveform and membrane currents of spontaneously beating pacemaker cells
Figure 1 depicts a typical pacemaker cell used in the present study. The regularly beating pacemaker cells were ≈2 % of the total cells isolated, showing a long and slender shape with faint sarcomere striations. The input capacitance of spontaneously beating cells was 42.0 ± 10.2 pF (n = 16).
Figure 1. A representative pacemaker cell isolated from mouse SA node.

The myocyte showed spontaneous beating. The triangular shadow overlapping the myocyte is the whole-cell patch pipette. The calibration bar is 20 μm.
Spontaneous action potentials recorded in this type of cell are shown in Fig. 2A. After the formation of the whole cell patch configuration, the myocyte immediately ceased beating as EGTA in the pipette solution diffused into the cytoplasm. However, in most of the pacemaker cells, spontaneous action potentials continued to fire stably even 5 min after the cessation of beating. In such pacemaker cells, the action potential parameters were measured in 15 successive action potentials, and their mean values in 12 cells are summarized in Table 1. It is clear that beating rate (294 ± 59 min−1) was more rapid than those of rabbit (189 ± 76.7 min−1) and rat (214 ± 58 min−1) (Denyer & Brown, 1990; Shinagawa et al. 2000). In accordance with this, the 50 % duration of action potential was significantly shorter in mouse (42.0 ± 5.9 ms). It should be noted that maximum upstroke velocity (14.5 ± 4.4 V s−1) was higher in mouse pacemaker cells. The other parameters such as the maximum diastolic potential and overshoot were similar to those of other species.
Figure 2. Action potential and membrane currents of mouse pacemaker cells.

A, action potential recording (upper panel) and dV/dt (lower panel). B, a family of current traces recorded in the same cell as in A. The holding potential was −50 mV. The depolarizing test pulses ranged from −30 to +50 mV in the upper panel. The hyperpolarizng pulses were applied from −70 to −150 mV in the lower panel. C, the current-voltage (I-V) relationship; •, measured at the peak of inward current elicited by the depolarization. For hyperpolarization, • indicates the initial current level upon the onset of each test pulse. The late current (○) was measured by averaging the amplitude for 15 ms at the end of test pulses.
Table 1.
Comparison of spontaneous action potentials
| Parameters | Mouse | Rata | Rabittb |
|---|---|---|---|
| Overshoot (mV) | 22.7 ± 6.2 | 14.8 ± 10.8 | 31.3 ± 4.2 |
| Maximal diastolic potential (mV) | −567 ± 7.4 | −57.6 ± 7.6 | −66.2 ± 4.6 |
| Amplitude (mV) | 79.4 ± 7.5 | 72.5 ± 17.9 | — |
| 50% duration (ms) | 42.0 ± 5.9 | 73.9 ± 16.4 | 85.8 ± 4.6 |
| Maximal upstroke velocity (V s−1) | 14.5 ± 4.4 | 4.4 ± 16.4 | 7.91 ± 2.77 |
| Beating rate (min−1) | 294 ± 59 | 214 ± 58 | 189 ± 76.7 |
Parameters from aShinagawa et al. (2000) and bDenyer & Brown (1990).
One of the electrophysiological criteria of cardiac pacemaker cells may be the presence of hyperpolarization-activated, cyclic nucleotide-sensitive cation current (Ih; DiFrancesco, 1993). We first recorded spontaneous action potentials (Fig. 2A). Thereafter, the voltage clamp experiments were carried out, setting the holding potential at −50 mV throughout the experiments unless otherwise mentioned. As shown in Fig. 2B, the L-type calcium current (ICa-L) was activated by depolarizing voltage steps. The peak amplitude of inward current was measured for depolarizing pulses, and the current-voltage (I-V) relationship is illustrated in Fig. 2C. ICa-L started to appear at −40 mV and was maximally activated at −10 mV. The depolarizing pulses also induced time-dependent outward currents followed by the outward current tails upon repolarization. Hyperpolarizing pulses produced a slow and continuous increase of the inward current, Ih, at membrane potentials more negative than −100 mV. Upon returning to the holding potential, the tail current of Ih overlapped with a rapid inward current, due to the activation of Na+ current (INa).
Ba2+-sensitive background K+ current in mouse pacemaker cells
In rabbit pacemaker cells, there was only a small Ba2+-sensitive background K+ current, which was attributed to spontaneous activity of muscarinic K+ channels (Ito et al. 1994). The inward-rectifier K+ channel was present in rat pacemaker cells, but not in rabbit pacemaker cells (Shinagawa et al. 2000). In mouse pacemaker cells, sizeable Ba2+-sensitive, inwardly rectifying current was present as typically shown in Fig. 3. The initial current jump upon hyperpolarization was relatively large and the apparent activation phase of Ih was less obvious in this experiment. The application of 0.5 mM Ba2+ in the bathing solution largely inhibited the initial current jumps and disclosed the activation phase of Ih (Fig. 3A). The Ba2+-sensitive current was then obtained by subtracting the current recorded in the presence (○) from that in the absence (•) of Ba2+ as shown in Fig. 3B. The Ba2+-sensitive current was observed during the hyperpolarization beyond −80 mV. The quasi-steady-state I-V relationship in Fig. 3C showed strong inward rectification, and the reversal potential was close to the equilibrium potential for K+ (EK≈-86 mV). At potentials more negative than −110 mV, the Ba2+-sensitive current underwent inactivation, which is typical for inward-rectifier K+ current (IK1), but not for muscarinic K+ current (IK-Ach). Therefore, Ba2+-sensitive current appeared to be IK1 rather than IK-Ach. This finding closely resembles that of the rat pacemaker cell and the previous report of mouse pacemaker cell (Shinagawa et al. 2000; Mangoni & Nargoet, 2001). At membrane potentials more positive than EK, the amplitudes of outward Ba2+-sensitive currents were negligibly small (for example, 9.1 ± 3.4 pA, n = 6 at −60 mV).
Figure 3. The inward rectifier K+ current of mouse pacemaker cells.

A, the current traces recorded in the presence (○) and absence (•) of 0.5 mM BaCl2. The voltage of test pulse is shown at the top of each trace. At −140 mV, the activation phase of Ih became clear in the presence of BaCl2. B, Ba2+-sensitive currents obtained by subtracting corresponding current traces indicated by ○ and •. The dotted lines indicate zero current levels both in A and B. C, I-V relationship of Ba2+-sensitive current. The amplitude was measured for 500 ms at the end of test pulse. The amplitude of the outward current was 9.1 ± 3.4 pA at −60 mV.
The properties of Ih of mouse pacemaker cells
In the following experiments, we recorded Ih in the presence of 0.5 mM Ba2+. As shown in Fig. 4A, we applied conditioning pulses of 3 s duration, and then hyperpolarized to −150 mV for 1 s to obtain full activation of Ih. We measured the amplitude of time-dependent current (Itd) during the hyperpolarization to −150 mV (difference between • and ○ in Fig. 4A). The magnitude of the activation (% activation) was normalized to the maximal value of Itd (Itd-max):
| (1) |
Figure 5B summarizes the voltage dependence of percentage activation. The relationship was fitted with the Boltzmann equation:
 |
(2) |
where Vm is the membrane potential, V1/2 the membrane potential for the half-maximal activation, and S the slope factor. The smooth line in Fig. 4B was drawn using their mean values (V1/2=−107.9 ± 10.3 mV and S =−15.9 ± 1.9 mV). The value of V1/2 is more negative than that (−87.4 ± 10.3 mV) measured using the ramp pulse protocol by Mangoni & Nargoet (2001). Although we do not have a ready explanation for this difference, it might be due to the difference in cell types or the different experimental protocol (voltage step vs. ramp pulse).
Figure 4. The hyperpolarization-activated, cyclic nucleotide-sensive current.
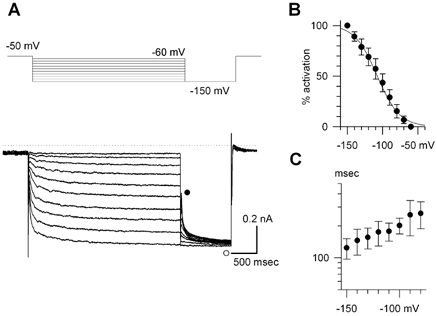
A, current traces of Ih recorded in the presence of 0.5 mM BaCl2. The conditioning voltage steps were applied for 3 s ranging from −60 to −150 mV in 10 mV increments as shown in the top panel. Ih was fully activated by the following hyperpolarization to −150 mV. B, the steady-state voltage dependence of activation. Each data point was obtained from 5 cells. The voltage for the half-maximal activation was −107 ± 5.6 mV, and the slope factor was 15.4 ± 3.6 mV when fitted with the Boltzmann equation (see text). C, the time constants of the activation phase measured at 33–35 °C. The values are plotted on a semi-logarithmic scale.
Figure 5. The sustained inward current.
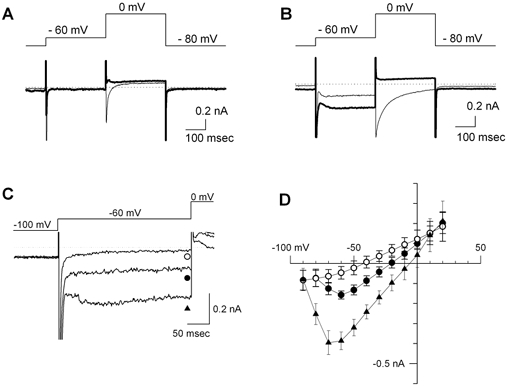
A, membrane current in a quiescent cell isolated from the SA node region. The pipette solution was a Cs+-rich solution. The pulse protocol is shown in the top panel. No sustained inward current was recorded in the first voltage step to −60 mV. The thin trace was recorded in Tyrode solution containing 1.8 mM Ca2+ and 5 mM Cs+. The thick trace was recorded in nominally Ca2+-free Tyrode solution containing 5 mM Cs+. The L-type Ca2+ current activated at 0 mV was completely inhibited in this condition. B, membrane current recorded in a spontaneously beating pacemaker cell. The pacemaker cell used in this experiment is depicted in Fig. 1. The experimental conditions were the same as in A. Note that after the activation and inactivation of INa, a sustained inward current was record during the depolarization to −60 mV. The amplitude of Ist activated at −60 mV became larger in nominally Ca2+-free Tyrode solution containing 5 mM Cs+ (thick trace). C, current traces of Ist recorded in Tyrode solution containing 0.1 mM Ca2+ and 5 mM Cs+. The membrane potential was depolarized to −60 mV for 200 ms from the holding potential at −100 mV. •, control; ▴, in the presence of 0.3 μM isoprotenol; ○, in the presence of 1 μM nicardipine. D, the I-V relationships of Ist. The symbols are the same as in C. In the presence of isoprotenol, activation of Ist started between −80 and −90 mV. The intersection of I-V curves was ≈10 mV.
The time course of activation of Ih was well described by a single exponential function. An additional slow component became visible during a long hyperpolarizing pulse more negative than −120 mV. However, the amplitude of the additional slow component was less than 10 % of the total amplitude. We therefore fitted a single exponential curve to the activation phase. The values of the time constant are summarized in Fig. 4C. The time course of the activation was intermediate between those of HCN1 and HCN4 examined at a similar temperature (Ishii et al. 2001).
The Na+ current and sustained inward current
In order to outline the types of voltage-gated inward currents, we inhibited the outward K+ currents by replacing K+ with the same amount of Cs+ in the pipette solution. In the experiments shown in Fig. 6, we compared the voltage-gated inward currents in a quiescent cell (Fig. 5A) and those in a spontaneously beating cell (Fig. 5B). The holding potential was set at −80 mV, and a conditioning pulse to −60 mV was applied for 300 ms, followed by a test pulse to 0 mV. In the control bathing solution (thin lines in Fig. 5A and B), activation of INa and ICa-L was observed at the beginning of the conditioning and test voltage steps. In the mouse pacemaker cell, voltage-gated Na+ current (INa) was consistently observed and was largely inhibited by 10 μM tetrodotoxin (data not shown). This finding was consistent with the report by Mangoni & Nargoet (2001). In the present experiment, we did not carry out the measurement of the I-V relationship of INa in 140 mM Na+ solution, because voltage control was difficult in practice during robust activation of INa.
Figure 6. T-type and L-type Ca2+ currents.

A, T-type Ca2+ current recorded in Na+-free bathing solution. The pipette solution was Cs+-rich solution. ICa-T was activated by depolarization to −40 mV from the holding potential at −90 mV. When the holding potential was raised to −50 mV, ICa-T was almost completely inactivated. B, I-V relationship of ICa-T. The difference in amplitude of peak inward current (▴ in A) and the late current (▵ in A) was plotted at membrane potentials between −80 and −50 mV. At the potentials more positive than −40 mV, the amplitudes of the current traces recorded at the holding potential of −50 mV were subtracted from those recorded at the holding potential of −90 mV. C, ICa-L recorded in Na+-free bathing solution. The holding potential was −50 mV. D, I-V relationship of ICa-L. The difference between peak (• in C) and late (○ in C) current was plotted.
In the spontaneously beating myocyte, but not in the quiescent cell, a sustained inward current was observed throughout the depolarization to −60 mV (Fig. 5B). On jumping to 0 mV, a transient inward current was activated both in the spontaneously beating cell and in the quiescent cell. To determine the ionic nature of the sustained inward currents at −60 mV, the bathing solution was switched to nominally Ca2+-free solution (thick lines in Fig. 5A and B). As shown by the thick line in Fig. 5B, the inward current during the voltage step to −60 mV was not inhibited, but slightly enlarged in the nominally Ca2+-free solution, demonstrating that this current was the sustained inward current (Ist) described in other species (Guo et al. 1995). On the other hand, the transient inward current at 0 mV was completely suppressed both in spontaneously beating cells and in quiescent cells, demonstrating that the transient inward current activated at 0 mV was ICa-L (thick lines in Fig. 5A and B).
The properties of Ist were further examined in the bathing solution containing 0.1 mM Ca2+. In Fig. 5C, the current traces in response to a depolarizing pulse to −60 mV were superimposed. The application of 3 μM isoproterenol markedly increased the amplitude of Ist (▴) compared to the control trace (•). In the same cell, 1 μM nicardipine, a Ca2+ channel blocker, completely inhibited Ist (○). I-V relationships measured at the end of the voltage steps are shown in Fig. 5D. Ist started to occur at −70 mV in the control condition. The threshold of activation shifted to −80 mV in the presence of isoproterenol. From the intersection between the I-V curves measured in the presence and absence of nicardipine, the reversal potential of Ist was ≈10 mV. By subtracting the background current recorded in the presence of nicardipine, the peak amplitude of Ist was found to be −110 ± 35.4 pA at −40 mV in the control condition (n = 6). These properties were similar to those of Ist found in rabbit, guinea-pig and rat pacemaker cells (Guo et al. 1995; Shinagawa et al. 2000).
T-type and L-type Ca2+ currents
In the next experiment shown in Fig. 6, INa and Ist were suppressed by replacing the extracellular Na+ with an equimolar amount of NMDG. In the Na+-free bathing solution containing 1.8 mM Ca2+, depolarizing pulses were applied from the holding potential at −90 mV. As shown in Fig. 6A, a transient inward current was consistently activated by the depolarization to −40 mV, demonstrating the presence of T-type Ca2+ current (ICa-T) in mouse pacemaker cells. When the holding potential was raised to −50 mV, ICa-T was almost completely inactivated. The I-V relationship of ICa-T was measured by subtracting current traces elicited from the holding potential of −50 mV from those from −90 mV (Hagiwara et al. 1988). As shown in Fig. 6B, ICa-T was maximally activated at −40 mV. The peak inward amplitude was −438 ± 53.8 pA (n = 7). The I-V relationship of ICa-L was measured with the holding potential of −50 mV (Fig. 6C), and is illustrated in Fig. 6D. The peak amplitude of ICa-T was larger than that ICa-L in the mouse SA node cells. This observation seems consistent with that of Mangoni & Nargoet (2001).
IKr and IKs
In rabbit and rat pacemaker cells, the major components of voltage-gated outward K+ currents were E4031-sensitive, rapidly activating K+ currents (IKr) (Ono & Ito, 1995; Shinagawa et al. 2000). In contrast, only chromanol 293B-sensitive, slowly activating K+ current (IKs) was recorded in guinea-pig and porcine pacemaker cells (Guo et al. 1997; Ono et al. 2000). We therefore examined the existence of these types of K+ currents in mouse pacemaker cells. In Fig. 7A, the outward K+ current was elicited by varying depolarizing pulses. Under this condition, 3 μM E4031 partially but clearly inhibited the outward current. Chromanol 293B did not show the inhibitory effect (n = 8, data not shown). However, even in the presence of a saturating dose of E4031, sizeable outward currents remained, as shown in Fig. 7A. It should be noted that in the rabbit pacemaker cell, sizeable outward current also existed after the inhibition of IKr by E4031, although its electrophysiological properties remain unexplored (Ono & Ito, 1995). In Fig. 7B, IKr was isolated as E4031-sensitive current. When the test pulse was more positive than −40 mV, the activation of IKr became visible. The tail currents elicited at −50 mV also became evident. The I-V relationships measured at the end of the test pulse (○) are plotted in Fig. 7C. The peak amplitude was 38.3 ± 22.2 pA at 0 mV (n = 5). The amplitudes of the tail current (•) were normalized to the maximal value and plotted in Fig. 7D. We also fitted the Boltzmann equation to each set of data (eqn (2)). In this experiment, V1/2 was −19.3 ± 3.2 mV (n = 5), which was close to that measured in rabbit pacemaker cells (Ono & Ito, 1995).
Figure 7. E4031-sensitive ERG current.

A, current traces recorded in the presence and absence of 3 μM E4031 are superimposed. B, E4031-sensitive components were obtained by subtraction of corresponding current traces in A. The holding potential was −40 mV. The voltage of the test pulse is indicated at the bottom of each trace. C, I-V curves of E4031-sensitive IKr current measured at the end of depolarizing pulses (○ in A). D, activation curve of E4031-sensitive current. The amplitudes of the tail currents recorded at −50 mV (• in A) were normalized to the maximal value. The half-maximal activation was obtained at −19.3 ± 3.2 mV, and the slope factor was −19.3 ± 3.2 mV (n = 6).
Voltage-gated outward currents
In mouse ventricular and atrial myocytes, four types of kinetically distinct voltage-gated outward currents have been reported other than IKr and IKs: the fast transient outward current (Ito,f) whose time constant of decay (τdecay) was 85 ± 2 ms; slowly inactivating transient outward current (Ito,s, τdecay= 196 ± 7 ms); a slowly inactivating current (IK,slow, τdecay= 1162 ± 29 ms); and non-inactivating, steady-state current (Iss) (all values are means ±s.e.m.; Xu et al. 1999; Bou-Abboud et al. 2000; Nerbonne, 2000). In the experiments shown in Fig. 8A, we examined the existence of these currents in the pacemaker cells. Depolarizing pulses (8 s in duration) were applied from the holding potential of −90 mV. INa and ICa-T were blocked by replacing external Na+ with the same amount of NMDG, and Ca2+ with Mg2+. E4031 (3 μM) was present throughout the experiments. Non-inactivating outward current was activated by depolarization more positive than −50 mV. At potentials more positive than −20 mV, an additional decaying component became evident. The time course of decay was single exponential and was less voltage dependent. The value of τdecay measured at 10 mV was 808 ± 20.6 ms (n = 5), which was similar to that of IK,slow rather than Ito,f and Ito,s. We further examined the pharmacological properties of the decaying component and non-inactivating component of the K+ current. As shown in Fig. 8A, 1 mM 4-aminopyridine (4-AP) slightly inhibited the peak current. In the I-V relationship, inhibition of peak current (▾) was observed at the membrane potentials more positive than 10 mV. Steady-state amplitudes measured in the presence and the absence of 4-AP (▿ and ○, respectively, in Fig. 8B) were not statistically different. In contrast, 25 mM TEA significantly inhibited peak current (▪) and the steady-state current (□) as shown in Fig. 8C. Based on the above physiological and pharmacological properties, it seems likely that the slowly inactivating component and the non-inactivating component in mouse pacemaker cell correspond to 4-AP-insensitive, TEA-sensitive IK,slow and Iss in atrial myocytes, respectively.
Figure 8. 4-AP-insensitive, slowly inactivating outward currents.

A, voltage-gated, outward K+ currents recorded in Na+-free, Ca2+-free bathing solution containing 3 μM E4031. From left to right, the families of current traces were recorded in control, in the presence of 1 mM 4-AP and in the presence of 25 mM TEA. The pulse protocol is shown in the right panel. The duration of voltage steps was 6 s. B, peak (•, ▾) and steady-state (○, ▿) I-V relationships in the presence (triangles) and absence (circles) of 1 mM 4-AP. C, I-V relationships in the presence (squares) and absence (circles) of 25 mM TEA. The filled symbols represent peak amplitudes, and the open symbols steady-state amplitudes. Each data point was obtained from 5 cells. D, measurements of quasi-steady-state inactivation of IK,slow. Conditioning voltage steps were applied for 3 s followed by the test pulse to 10 mV. E, quasi-steady-state inactivation curve. The amplitudes of time-dependent currents during the test pulse were normalized by the maximal value. The voltage for the half-maximal inactivation was −41 ± 3.8 mV, and slope factor was −15.7 ± 1.9 mV (n = 6).
The amplitude of IK,slow of mouse pacemaker cells decreased when the holding potential was depolarized close to the maximal diastolic potential (−56.7 ± 7.4 mV). In the experiments shown in Fig. 8D, we examined the voltage dependence of quasi-steady-state inactivation of IK,slow. The conditioning voltage pulses were applied for 2 s from the holding potential of −80 mV, followed by a test pulse to 10 mV. The amplitudes of IK,slow during the test pulse were defined as the differences between the amplitudes measured at the peak and those at the end of the test pulse. They were normalized by their maximal value and were plotted against the voltages of conditioning pulses. The voltage for half-maximal inactivation was −41 ± 3.8 mV. Therefore, it is clear from Fig. 8E that only ≈30 % of IK,slow was inactivated at the membrane potential close to the maximal diastolic potential. Thus, the major component of repolarizing currents in mouse pacemaker cells appears to be 4-AP-insensitive IK,slow, rather than IKr.
DISCUSSION
The ionic mechanism of the spontaneous action potentials of the SA node is one of the central questions in cardiac electrophysiology, and has been mainly investigated in rabbit heart (Irisawa et al. 1993; DiFrancesco, 1993; Boyett et al. 2000). Recently, genetic manipulation has been widely used to investigate the physiological role of ion channels and transporters, although this has only been accomplished in mouse. In this respect, it appears important to understand the electrophysiological properties of mouse pacemaker cells. However, there have been only a few reports on this subject, presumably due to technical difficulties.
Verheijck et al. (2001) carried out the mapping of spontaneous action potentials in mouse SA node tissue. They demonstrated that SA node tissue consists of primary pacemaker tissue (slower maximal upstroke velocity; 6.2 ± 2 V s−1), and secondary pacemaker tissue (faster maximal upstroke velocity; 27 ± 14 V s−1). The primary pacemaking region of the mouse SA node was measured as being within 300 μm parallel to and 150 μm perpendicular to the crista terminalis. We isolated pacemaker cells from a strip of SA node tissue, the size of which was ≈5 mm parallel and ≈3 mm perpendicular to the crista terminalis. Therefore, spontaneously beating myocytes used in the present study should consist of myocytes isolated from primary and secondary pacemaker regions. We focused on the spontaneously beating myocytes, the morphology of which resembled ‘spider cells’ described in previous reports (e.g. Fig. 2C in Mangoni & Nargoet, 2001).
As shown in the present study, the beating rate of a single pacemaker cell was 294 ± 59 min−1, which is clearly slower than that in vivo (≈600 min−1). This discrepancy may be due to several reasons. Firstly, all of the experiments in the present study were carried out at 33–34 °C, whereas the body temperature of the mouse is 38.5 °C. At 26 °C, Mangoni & Nargoet (2001) reported that the interval of the action potential of mouse pacemaker cells was > 300 ms (beating rate < 200 min−1). Secondly, sympathetic nerve activity in vivo may also underlie the discrepancy. In fact, Wickman et al. (1998) reported that administration of propranol caused bradycardia in both wild-type and GIRK4-/- mice. In certain mice, irrespective of their genotype, heart rate decrease was profound (≈300 min−1 decrease). In the excised SA node tissue, which should be completely denerved, the interval of spontaneous action potentials was 144 ± 16 ms (≈416 min−1; Verheick et al. 2000) or ≈200 ms (≈300 min−1; Platzer et al. 2000) at 37 °C. These values were similar to the beating rate of a single pacemaker cell, rather than that in vivo. Thirdly, the interference of cyclic change of intracellular Ca2+ seems to hinder the spontaneous action potential of pacemaker cells, although its significance is a matter of debate (Honjo et al. 2003; Lakatta et al. 2003). In the present study, intracellular Ca2+ was chelated by 5 mM EGTA. Although we could record spontaneous action potentials stably under this condition, the rate of spontaneous action potentials might be slower if compared with experimental conditions such as the perforated patch configuration, which maintains an intact intracellular Ca2+ transient.
Likewise in larger animals, the slow diastolic depolarization (pacemaker potential) of mouse SA node seemed to be generated by a balance between the activation of inward currents (Ih, ICa-T, ICa-L, Ist) and the deactivation of outward currents (IKr and IK,slow). The significance of Ih in the pacemaker potential has been discussed in many publications (Irisawa et al. 1993; DiFrancesco, 1993; Vassalle, 1995). Gene targeting should provide a clue to address this question, although it is a prerequisite to identify the molecular subtypes of HCN expressed in mouse SA node (Santoro et al. 1998; Ludwig et al. 1998; Ishii et al. 1999). In situ hybridization suggested that HCN4 (high mRNA level) and HCN2 (low mRNA level) were expressed in mouse SA node (Moosmang et al. 2001). In contrast, Moroni et al. (2001) suggested that HCN1 was the molecular determinant of rabbit SA node. Our preliminary PCR experiments also suggest HCN1 and HCN4 are expressed in mouse SA node (T. M. Ishii, M. Takano & H. Ohmori, unpublished observation). These HCN channels possess remarkably different physiological properties: HCN1 has the fastest activation kinetics, and is insensitive to intracellular cAMP; HCN4 shows the slowest activation kinetics and is highly sensitive to cAMP; the activation kinetics of HCN2 are intermediate and sensitive to cAMP. As shown in the present study, the activation kinetics of Ih in mouse pacemaker cells were intermediate between those of HCN4 and HCN1 measured at a similar temperature (Fig. 5C; see also Fig. 1 in Ishii et al. 2001). Therefore, it appears very likely that HCN4 forms a heteromultimer with HCN1 and/or HCN2 in mouse pacemaker cells.
Most recently and most notably, Ludwig et al. (2003) reported that mice with cardiomyocyte-specific deletion of HCN2 displayed SA node dysfunction: isolated atria from HCN2-knockout mice showed arrhythmic beating. In the single pacemaker cells isolated from the HCN2-knockout mouse, the maximal diastolic potential was ≈5 mV more hyperpolarized than that of wild-type mouse. The amplitude of Ih was ≈30 % reduced, and the activation kinetics of Ih were slightly slower than those of wild-type. They concluded that HCN2 contributes to the determination of resting membrane properties, and to the control of physiological pacemaking. As reported by Moosmang et al. (2001), the major component of Ih in mouse pacemaker cells seems to be HCN4. Therefore, in order to investigate the physiological role of Ih in the SA node, deletion of HCN4 also appears to be necessary.
The present study demonstrated that IKr and IK,slow, but not IKs, were present in mouse SA node pacemaker cells. The lack of IKs seems to be in good agreement with the observation that targeted disruption of minK showed no significant alteration in SA node function, despite the expression of minK being restricted in the conduction system (Kupershmidt et al. 1999). Overexpression of the dominant negative ERG channel failed to modify mouse cardiac function, suggesting that the ERG channel does not play a significant role in mouse heart (Babij et al. 1998). This finding also appears to be in a good agreement with the present study showing that the amplitude of IKr was much smaller than that of IK,slow in mouse pacemaker cells. However, it should be noted that the ERG-deficient mouse died in the early stages of fetal development (London et al. 2001). This finding may suggest that the ERG channel plays a significant role in mouse fetal cardiac myocytes.
Among various Ca2+ channels expressed in mouse SA node, phenotypic consequences of the deletion of Cav1.2 (α1C) and Cav1.3 (α1D) have so far been reported. Cav1.2 is a major component in the mouse SA node. The mRNA of Cav1.3 has been detected, but in much lesser quantities than Cav1.2 (Bohn et al. 2000). In accordance with this finding, deletion of Cav1.2 gave rise to fetal death (Seisenberger et al. 2000). Knockout of Cav1.3 was not lethal, but lead to sinus bradycardia even in the isolated heart (Platzer et al. 2000). We have recently cloned Cav1.3 from mouse SA node; it was activated at more negative potentials than Cav1.2, and was sensitive to dihydropyridine (Koschak et al. 2001; M. Takano, T. M. Ishii, H. S. Cho & S. Kuratomi, unpublished observation). In the present study, we separated ICa-L and ICa-T by changing the holding potential. Therefore, the amplitude of ICa-T might have been overestimated by contamination with the Cav1.3 current. The amplitude of ICa-L might be underestimated because of rundown after the formation of the ruptured whole-cell patch. Although the activation potential and the pharmacological properties of Cav1.3 closely resembled those of Ist, Cav1.3 did not possess permeability to Na+ under physiological conditions (M. Takano, T. M. Ishii, H. S. Cho & S. Kuratomi, unpublished observation). Since the physiological charge carrier of Ist is Na+, it appears unlikely that Cav1.3 encodes Ist. The molecular entity of Ist remains unclear.
In conclusion, we have outlined the electrophysiological properties of pacemaker cells of mouse SA node. As in larger animals, mouse pacemaker cells possessed at least eight types of membrane currents including Ist.
Acknowledgments
M.T. thanks Dr T. M. Ishii for discussion and Mr M. Fukao for technical support. The present study was supported by a grant from the Ministry of Culture, Education, Science and Sports of Japan to A.N., and grants from the Takeda Science Foundation and the Japanese Foundation of Cardiovascular Research to M.T.
REFERENCES
- Babij P, Askew GR, Nieuwenhuijsen B, Su CM, Bridal TR, Jow B, Argentieri TM, Kulik J, Degennaro LJ, Spinelli W, Colatsky TJ. Inhibition of cardiac delayed rectifier K+ current by overexpression of the long-QT syndrome HERG G628S mutation in transgenic mice. Circ Res. 1998;83:668–678. doi: 10.1161/01.res.83.6.668. [DOI] [PubMed] [Google Scholar]
- Bohn G, Moosmang S, Conrad H, Ludwig A, Hofmann F, Klugbauer N. Expression of T- and L-type calcium channel mRNA in mouse sinoatrial node. FEBS Lett. 2000;481:73–76. doi: 10.1016/s0014-5793(00)01979-7. [DOI] [PubMed] [Google Scholar]
- Bou-Abboud E, Li H, Nerbonne JM. Molecular diversity of the repolarizing voltage-gated K+ currents in mouse atrial cells. J Physiol. 2000;529:345–358. doi: 10.1111/j.1469-7793.2000.00345.x. [DOI] [PMC free article] [PubMed] [Google Scholar]
- Boyett MR, Honjo H, Kodama K. The sinoatrial node, a heterogeneous pacemaker structure. Cardiovasc Res. 2000;47:658–687. doi: 10.1016/s0008-6363(00)00135-8. [DOI] [PubMed] [Google Scholar]
- Demolombe S, Lande G, Charpentier F, van Roon MA, van den Hoff MJ, Toumaniantz G, Baro I, Guihard G, Le Berre N, Corbier A, De Bakker J, Ophof T, Wilde A, Moorman AF, Escande D. Transgenic mice overexpressing human KvLQT1 dominant negative isoform, part I: phenotypic characterization. Cardiovasc Res. 2001;50:314–327. doi: 10.1016/s0008-6363(01)00231-0. [DOI] [PubMed] [Google Scholar]
- Denyer JC, Brown HF. Rabbit sino-atrial node cells: isolation and electrophysiological properties. J Physiol. 1990;428:405–424. doi: 10.1113/jphysiol.1990.sp018219. [DOI] [PMC free article] [PubMed] [Google Scholar]
- DiFrancesco D. Pacemaker mechanisms in cardiac tissue. Annu Rev Physiol. 1993;55:455–472. doi: 10.1146/annurev.ph.55.030193.002323. [DOI] [PubMed] [Google Scholar]
- Guo J, Mitsuiye T, Noma A. The sustained inward current in sinoatrial node cells of guinea-pig heart. Pflugers Arch. 1997;433:390–396. doi: 10.1007/s004240050293. [DOI] [PubMed] [Google Scholar]
- Guo J, Ono K, Noma A. A sustained inward current activated at the diastolic potential range in rabbit sino-atrial node cells. J Physiol. 1995;483:1–14. doi: 10.1113/jphysiol.1995.sp020563. [DOI] [PMC free article] [PubMed] [Google Scholar]
- Guo W, Li H, London B, Nerbonne JM. Functional consequences of elimination of Ito,f and Ito,s: early afterdepolarizations, atrioventricular block, and ventricular arrhythmia in mice lacking Kv1. 4 and expressing dominant-negative Kv4α subunit. Circ Res. 2000;87:73–79. doi: 10.1161/01.res.87.1.73. [DOI] [PubMed] [Google Scholar]
- Hagiwara N, Irisawa H, Kameyama M. Contribution of two types of calcium currents to the pacemaker potentials of rabbit sino-atrial node cells. J Physiol. 1988;395:233–253. doi: 10.1113/jphysiol.1988.sp016916. [DOI] [PMC free article] [PubMed] [Google Scholar]
- Honjo HS, Inada S, Lancaster MK, Yamamoto M, Niwa R, Jones SA, Shibata N, Mitsui K, Horiuchi T, Kamiya K, Kodama I, Boyett MR. Sarcoplasmic reticulum Ca2+ release is not a dominating factor in sinoatrial node pacemaker activity. Circ Res. 2003;92:e41–e44. doi: 10.1161/01.res.0000055904.21974.be. [DOI] [PubMed] [Google Scholar]
- Irisawa H, Brown HF, Giles W. Cardiac pacemaking in the sinoatrial node. Physiol Rev. 1993;73:197–227. doi: 10.1152/physrev.1993.73.1.197. [DOI] [PubMed] [Google Scholar]
- Ishii TM, Takano M, Ohmori H. Determinants of activation kinetics in mammalian hyperpolarization-activated cation channels. J Physiol. 2001;537:93–100. doi: 10.1111/j.1469-7793.2001.0093k.x. [DOI] [PMC free article] [PubMed] [Google Scholar]
- Ishii TM, Takano M, Xie LH, Noma A, Ohmori H. Molecular characterization of the hyperpolarization-activated cation channel in rabbit heart sinoatrial node. J Biol Chem. 1999;274:12853–12839. doi: 10.1074/jbc.274.18.12835. [DOI] [PubMed] [Google Scholar]
- Ito H, Ono K, Noma A. Background conductance attributable to spontaneous opening of muscarinic K+ channels in rabbit sino-atrial node cells. J Physiol. 1994;476:55–68. [PMC free article] [PubMed] [Google Scholar]
- Keating MT, Sanguinetti MC. Molecular and cellular mechanisms of cardiac arrhythmias. Cell. 2001;104:569–580. doi: 10.1016/s0092-8674(01)00243-4. [DOI] [PubMed] [Google Scholar]
- Kodama I, Nikmaram MR, Boyett MR, Suzuki R, Honjo H, Owen JM. Regional difference in the role of the Ca2+ and Na+ currents in pacemaker activity in the sinoatrial node. Am J Physiol. 1997;272:H2793–2806. doi: 10.1152/ajpheart.1997.272.6.H2793. [DOI] [PubMed] [Google Scholar]
- Koschak A, Reimer D, Huber I, Grabner M, Glossmann H, Engel J, Striessnig J. α1D (Cav1. 3) subunits can form L-type Ca2+ channels activating at negative voltages. J Biol Chem. 2001;276:22100–22106. doi: 10.1074/jbc.M101469200. [DOI] [PubMed] [Google Scholar]
- Kupershmidt S, Yang T, Anderson ME, Wessels A, Niswender KD, Mgnuson MA, Roden DM. Replacement by homologous recombination of the minK gene with lacZ reveals restriction of minK expression to the mouse cardiac conduction system. Circ Res. 1999;84:146–152. doi: 10.1161/01.res.84.2.146. [DOI] [PubMed] [Google Scholar]
- Lakatta EG, Maltsev VA, Bogdanov KY, Stern MD, Vinogradova TM. Cyclic variation of intracellular calcium: A critical factor for cardiac pacemaker cell dominance. Circ Res. 2003;92:e45–e50. doi: 10.1161/01.res.0000055920.64384.fb. [DOI] [PubMed] [Google Scholar]
- London B, Pan X-H, Lewarchik CM, Lee CS. QT-interval prolongation and arrhythmias in heterozygous Merg1-targeted mice. Circulation. 1998;98:1–56. [Google Scholar]
- Ludwig A, Budde T, Stieber J, Moosmang S, Wahl C, Holthoff K, Langebartels A, Wotjak C, Munsch T, Zong X, Feil S, Feil R, Lancel M, Chien KR, Konnerth A, Pape HC, Biel M, Hofmann F. Absence epilepsy and sinus dysrhythmia in mice lacking the pacemaker channel HCN2. EMBO J. 2003;15:216–224. doi: 10.1093/emboj/cdg032. [DOI] [PMC free article] [PubMed] [Google Scholar]
- Ludwig A, Zong X, Jeglitsch M, Hofmann F, Biel M. A family of hyperpolarization-activated mammalian cation channels. Nature. 1998;393:587–591. doi: 10.1038/31255. [DOI] [PubMed] [Google Scholar]
- Mangoni ME, Nargeot J. Properties of the hyperpolarization-activated current (If) in isolated mouse sino-atrial cells. Cardiovasc Res. 2001;52:51–64. doi: 10.1016/s0008-6363(01)00370-4. [DOI] [PubMed] [Google Scholar]
- Moosmang S, Stieber J, Zong X, Biel M, Hofmann F, Ludwig A. Cellular expression and functional characterization of four hyperpolarization-activated pacemaker channels in cardiac and neuronal tissues. Eur J Biochem. 2001;268:1646–1652. doi: 10.1046/j.1432-1327.2001.02036.x. [DOI] [PubMed] [Google Scholar]
- Moroni A, Gorza L, Beltrame M, Gravante B, Vaccari T, Bianchi ME, Altomare C, Longhi R, Heurteaux C, Vitadello M, Malgaroli A, DiFrancesco D. Hyperpolarization-activated cyclic nucleotide-gated channel 1 is a molecular determinant of the cardiac pacemaker current I(f) J Biol Chem. 2001;276:29233–29241. doi: 10.1074/jbc.M100830200. [DOI] [PubMed] [Google Scholar]
- Nerbonne JM. Molecular basis of functional voltage-gated K+ channel diversity in the mammalian myocardium. J Physiol. 2000;525:285–298. doi: 10.1111/j.1469-7793.2000.t01-1-00285.x. [DOI] [PMC free article] [PubMed] [Google Scholar]
- Nerbonne JM, Nichols CG, Schwartz TL, Escande D. Genetic manipulation of cardiac K+ channel function in mice. Circ Res. 2001;89:944–956. doi: 10.1161/hh2301.100349. [DOI] [PubMed] [Google Scholar]
- Ono K, Ito H. A rapidly activating delayed rectifier K+ channel in rabbit sinoatrial node cells. Am J Physiol. 1995;259:H443–452. doi: 10.1152/ajpheart.1995.269.2.H443. [DOI] [PubMed] [Google Scholar]
- Ono K, Shibata T, Iijima T. Properties of delayed rectifier potassium current in porcine sino-atrial node. J Physiol. 2000;524:51–62. doi: 10.1111/j.1469-7793.2000.00051.x. [DOI] [PMC free article] [PubMed] [Google Scholar]
- Platzer J, Engel J, Schrott-Fischer A, Stephan K, Bova S, Chen H, Zheng H, Stiessnig J. Congenital deafness and sinoatrial node dysfunction in mice lacking class D L-type Ca2+ channels. Cell. 2000;102:89–97. doi: 10.1016/s0092-8674(00)00013-1. [DOI] [PubMed] [Google Scholar]
- Santoro B, Liu DT, Yao H, Bartisch D, Kandel ER, Siegelbaum SA, Tibbs GR. Identification of a gene encoding a hyperpolarization-activated pacemaker channel of brain. Cell. 1998;93:717–729. doi: 10.1016/s0092-8674(00)81434-8. [DOI] [PubMed] [Google Scholar]
- Seisenberger C, Specht V, Welling A, Platzer J, Pfeifer A, Kühbandner S, Striessnig J, Klugbauer N, Feil R, Hofmann F. Functional embryonic cardiomyocytes after disruption of the L-type α1C (Cav1. 2) calcium channel gene in the mouse. J Biol Chem. 2000;275:39193–39199. doi: 10.1074/jbc.M006467200. [DOI] [PubMed] [Google Scholar]
- Shinagawa Y, Satoh H, Noma A. The sustained inward current and inward rectifier K+ current in pacemaker cells dissociated from rat sinoatrial node. J Physiol. 2000;523:593–605. doi: 10.1111/j.1469-7793.2000.t01-2-00593.x. [DOI] [PMC free article] [PubMed] [Google Scholar]
- Vassalle M. The pacemaker current (If) does not play an important role in regulating SA node pacemaker activity. Cardiovasc Res. 1995;30:309–310. [PubMed] [Google Scholar]
- Verheick EE, van Kempen MJA, Veereschild M, Lurvink J, Jongsma HJ, Bouman LN. Electrophysiological features of the mouse sinoatrial node in relation to connexin distribution. Cardiovasc Res. 2001;52:40–50. doi: 10.1016/s0008-6363(01)00364-9. [DOI] [PubMed] [Google Scholar]
- Wickman K, Nemec J, Gendler SJ, Clapham DE. Abnormal heart rate regulation in GIRK4 knockout mice. Neuron. 1998;20:103–114. doi: 10.1016/s0896-6273(00)80438-9. [DOI] [PubMed] [Google Scholar]
- Xu H, Guo W, Nerbonne JM. Four kinetically distinct depolarization-activated K+ currents in adult mouse ventricular myocytes. J Gen Physiol. 1999;113:661–677. doi: 10.1085/jgp.113.5.661. [DOI] [PMC free article] [PubMed] [Google Scholar]
- Zaritsky JJ, Redell JB, Tempel BJ, Schwarz TL. The consequence of disrupting cardiac inwardly rectifying K+ current (IK1) as revealed by the targeted deletion of the mouse Kir2. 1 and Kir2.2 genes. J Physiol. 2001;533:697–710. doi: 10.1111/j.1469-7793.2001.t01-1-00697.x. [DOI] [PMC free article] [PubMed] [Google Scholar]