

Abstract
The effect of glycosylation on Kv1.1 potassium channel function was investigated in mammalian cells stably transfected with Kv1.1 or Kv1.1N207Q. Macroscopic current analysis showed that both channels were expressed but Kv1.1N207Q, which was not glycosylated, displayed functional differences compared with wild-type, including slowed activation kinetics, a positively shifted V1/2, a shallower slope for the conductance versus voltage relationship, slowed C-type inactivation kinetics, and a reduced extent of and recovery from C-type inactivation. Kv1.1N207Q activation properties were also less sensitive to divalent cations compared with those of Kv1.1. These effects were largely due to the lack of trans-Golgi added sugars, such as galactose and sialic acid, to the N207 carbohydrate tree. No apparent change in ionic current deactivation kinetics was detected in Kv1.1N207Q compared with wild-type. Our data, coupled with modelling, suggested that removal of the N207 carbohydrate tree had two major effects. The first effect slowed the concerted channel transition from the last closed state to the open state without changing the voltage dependence of its kinetics. This effect contributed to the G-V curve depolarization shift and together with the lower sensitivity to divalent cations suggested that the carbohydrate tree and its negatively charged sialic acids affected the negative surface charge density on the channel's extracellular face that was sensed by the activation gating machinery. The second effect reduced a cooperativity factor that slowed the transition from the open state to the closed state without changing its voltage dependence. This effect accounted for the shallower G-V slope, and contributed to the depolarized G-V shift, and together with the inactivation changes it suggested that the carbohydrate tree also affected channel conformations. Thus N-glycosylation, and particularly terminal sialylation, affected Kv1.1 gating properties both by altering the surface potential sensed by the channel's activation gating machinery and by modifying conformational changes regulating cooperative subunit interactions during activation and inactivation. Differences in glycosylation pattern among closely related channels may contribute to their functional differences and affect their physiological roles.
The electrical properties of excitable cells are strongly influenced by the potassium channels that they express and voltage-gated K+ channels in these cells are involved in action potential repolarization and waveform modulation (Hodkgin & Huxley, 1952; for review see Rudy, 1988; Hille, 2001). Homomeric and heteromeric assembly of Kv1 α-subunits occurs to form functional tetrameric K+ channels and many amino acids involved in function have been determined (for review see Jan & Jan, 1997; Coetzee et al. 1999).
Many membrane proteins are glycosylated on their extracellular domain but the role of this post-translational modification is not well understood. Glycosylation may affect their proper folding and stability in intracellular organelles, their routing to the cell surface and turnover, and/or their function (Lennarz, 1983). The overall importance of glycosylation of membrane and secretory proteins in animal physiology has been revealed by carbohydrate-deficient glycoprotein syndromes (CDGS) I-IV that affect humans. These syndromes are severe multi-system disorders that may cause mental retardation or death (Jaeken et al. 1991; Carchon et al. 1999).
The mammalian Kv1 subfamily members Kv1.1-Kv1.5 (Stuhmer et al. 1989) are core N-glycosylated in the endoplasmic reticulum (ER) on the first extracellular loop between transmembrane segments S1 and S2, and further glycosylated at this site in the Golgi, and thus they are expressed as heavily glycosylated proteins on the cell surface. Each glycosylated tetramer contains significant amounts of sialic acid residues on its external face. The orientation of this carbohydrate tree in the folded channel is currently unknown. Glycosylation affected channel expression and/or function in some studies (Covarrubias et al. 1989; Recio-Pinto et al. 1990; Schwalbe et al. 1995; Gurnett et al. 1996; Thornhill et al. 1996; Bennett et al. 1997; Castillo et al. 1997; Petrecca et al. 1999; Freeman et al. 2000; Ufret-Vincenty et al. 2001b) but not in others (Deal et al. 1994; Santacruz-Toloza et al. 1994; Pabon et al. 2000; Liu et al. 2001).
When wild-type Kv1.1 was expressed in two glycosylation-deficient Chinese hamster ovary (CHO) Lec cell lines that had a reduced potential for glycosylation of membrane proteins and glycolipids in the trans-Golgi, and when control cells expressing Kv1.1 were treated with sialidase, we recorded significant changes in its functional properties that suggested glycosylation played an important role in channel operation (Thornhill et al. 1996). However, these mutant cells expressed Kv1.1 with a truncated carbohydrate tree(s) compared with control cells and so the effect of complete removal of a sugar tree(s) was not tested. Furthermore the mutant cell lines had a reduced glycolipid content on their cell surface, and some may be tightly associated with Kv1.1, and these altered or reduced sugar groups on the glycolipids may have contributed to some of the changes that we detected.
Kv1.1 subunits (Stuhmer et al. 1989) are expressed throughout development and in many areas of the brain (Wang et al. 1993, 1994) and are one of the major components of the brain dendrotoxin-binding protein (Scott et al. 1994). Mutations in these channels are also responsible for episodic ataxia-I (EA) in humans (Adelman et al. 1995; for review see Ashcroft, 2000). Moreover a mouse Kv1.1 knock-out exhibited epileptic and ataxic bouts highlighting the channel's prominent role in action potential repolarization in different brain areas and suggesting that other members of the Kv1 subfamily cannot substitute for it (Smart et al. 1998).
Given the above observations the aims of this report were to (a) express wild-type Kv1.1 or Kv1.1N207Q in control CHO cells, with the same surface glycolipid composition, to investigate in detail the effects of complete removal of the N-linked carbohydrate tree at this defined site on its macroscopic current properties, and (b) test which of the different kinetic gating models developed for Shaker-like K+ channels best fitted our data to gain insight into the underlying mechanism(s) of the effect of glycosylation on channel gating.
METHODS
Cell lines, cDNAs and transfections
CHO pro5 cells were obtained from American Type Culture Collection (Rockville, MD, USA) and maintained in Dulbecco's modified Eagle's medium (DMEM) or α-minimal essential medium, supplemented with 0.35 mM proline, with 10 % fetal bovine serum at 37 °C under 5 % CO2. Kv1.1 has one extracellular N-glycosylation consensus site at NTT which is between S1 and S2 (Stuhmer et al. 1989), and this was mutated by constructing an N207Q mutant by standard polymerase chain reaction (PCR) methods with the following oligo pair: sense TTCACCGCATCGATCAAACCACAGTCATCTAC/SP6; antisense GTAGATGACTGTGGTTTGATCGATGCGGTGAAT/T7. Appropriate fragments from the first PCR reactions were gel-purified and used in a second PCR reaction to construct Kv1.1N207Q. Restriction enzyme-treated cDNAs were subcloned into the eukaryotic expression vector pcDNA3 and the integrity of constructs was confirmed by DNA sequencing. The Kv1.1 or Kv1.1N207Q cDNAs were transfected into CHO cells by the calcium phosphate method, and neomycin-resistant (800 μg ml−1 G418) colonies were selected from each condition and maintained in media containing 200 μg ml−1 G418 (Thornhill et al. 1996). Stable transfectants were further selected by immunoblotting to obtain clones with the highest proportion of total Kv1.1 in the trans-Golgi glycosylated state, similar to Kv1.1 in rat brain, and by electrophysiological methods to obtain clones of Kv1.1 and Kv1.1N207Q that had similar whole-cell currents at a depolarizing potential of 50 mV from 1000 to 3000 pA.
Electrophysiological recordings and analysis
CHO cell lines were plated on glass coverslips and recorded from 2–4 days later at room temperature (23–25 °C). Recordings from both Kv1.1 and Kv1.1N207Q cell lines were taken the same day after plating to reduce possible differences in expression levels. Our standard recording bath solution contained (mM): NaCl 150.0; KCl 5.0; MgCl2 1.0; CaCl2 2.0; glucose 5.0; Hepes 10.0 (pH 7.3, NaOH). Patch pipettes were fashioned from 8161 Corning glass (Warner Instruments) and had tip resistances of 1.2–1.8 MΩ when filled with an intracellular solution containing (in mM): KCl 70.0; KF 65.0; Na 5.0; MgCl2 1.0; EGTA 10.0; glucose 5.0; Hepes 10.0 (pH 7.3, KOH). Whole-cell membrane currents were recorded and analysed with an Axopatch 200B amplifier (Axon Instruments) and the pCLAMP 8/Digidata 1200 data acquisition/analysis system (Axon Instruments) (Hamill et al. 1981). After obtaining the whole-cell configuration cells were kept at −80 mV until stabilized. Mean linear membrane leak current was subtracted by the P/4 protocol. Membrane capacitance and series resistance (Rs) were estimated by the Clampex software from a transient capacitance current elicited by a 10 mV hyperpolarizing voltage step from −80 mV. Membrane capacitance was compensated using the amplifier controls and Rs was compensated 85–95 % by patch clamp circuitry. The voltage-induced currents were filtered at 5 kHz (−3 dB cut-off) and digitized at 50 μs, unless otherwise indicated. Non-transfected CHO pro5 cells showed 0–80 pA of endogenous Na+ inward current, and more rarely K+ outward current of the same magnitude, at a depolarizing pulse to 50 mV. The bath solution contained 300 nM tetrodotoxin to block these occasional Na+ currents. In order to minimize any voltage errors the following criteria were used for cells that were analysed: membrane seal resistance > 1 GΩ, series resistance of < 6 MΩ before compensation, and peak current at depolarizations to 50 mV of 800–2200 pA. A number of these parameters are listed in Table 1.
Table 1.
| Cell line | Gm(pS) | Rm(GΩ) | Rs before compensation (MΩ) |
|---|---|---|---|
| Kv1.1 (n = 25) | 10740 ± 652 | 1.5 ± 0.2 | 4.3 ± 0.2 |
| Kv1.1N207Q (n = 17) | 9741 ± 768 | 1.5 ± 0.2 | 4.2 ± 0.3 |
Gm is the maximum sustained conductance, Rm is membrane seal resistance and Rs is series resistance.
All voltages were corrected for a liquid junction potential of 8 mV. For activation parameters, the voltage-pulse protocol was to hold at −80 mV and step to −70 to 50 mV in 5 or 10 mV increments for 80 ms with an interpulse duration of 2 s, which is sufficient to prevent accumulative C-type inactivation. Conductance values (G) were obtained from the mean peak value of the leak-subtracted peak current (I) at each test potential (Vp) using Ohm's law (G =I/(Vp - EK)) and a predicted Nernst K+ equilibrium potential (EK) of −84 mV. For activation kinetics, current traces were analysed by rise time (10–90 % value) and activation time constants (τ). As the potential became more positive, the time course of activation had a complex multiexponential behaviour but, for a class of models commonly used to describe Shaker gating, the slowest exponential component had a time constant that was the inverse of the slowest forward rate (Hoshi et al. 1994; Zagotta et al. 1994a,b; Schoppa & Sigworth 1998a,b,c). This exponential component was measured by fitting a single exponential to the latter phase of the trace beginning with the time at which currents reached their half-maximal amplitude. For C-type inactivation and for recovery parameters, the voltage-pulse protocols are described in the text or figure legends. Leak current was estimated from the obtained membrane resistance using Ohm's law and off-line subtracted.
Estimation of ‘effective’ surface charge density (e nm−2)
We used two extracellular strontium concentrations, 20 and 50 mM, on Kv1.1 and Kv1.1N207Q to measure their effect on voltage gating. These concentrations have been used previously on ion channels (Elinder et al. 1996). If shifts in V1/2 of voltage-gated channels with extracellular divalent cations are parallel, one generally assumes that the shifts arise from changes in uniform surface potentials as described by the Gouy-Chapman theory (Latorre et al. 1992), and hence the apparent ‘effective’ surface charge density (σ or e nm−2), surface potential (Vs) and electrolyte composition (I) can be related by:
where A is a constant (= (8kTeoer)0.5), eo is the permitivity of free space and er is the relative dielectric constant, T is the absolute temperature, k is the Boltzmann constant and [I]i and zi are the concentration and valency of ion species i, respectively. For a combination of divalent cations (D = Ca2++ Mg2++ Sr2+) and monovalent cations (M = Na++ K+) this equation was solved for Vs (Mathcad Plus-5.0, Mathsoft Inc, Cambrige, MA, USA). A change in the aqueous electrolyte concentration will produce a change in the surface potential (ΔVs) that corresponds to the ΔV1/2. By using Mathcad software we obtained the best estimates for σ by using the measured shift in ΔV1/2.
Computer modelling and simulation
Simulations used QuB Software (version 1.1.0.2712) in the macroscopic current mode (Qin et al. 1996, 1997). The three kinetic models for Shaker-type K+ channels used in our study are shown in Appendix I–IV in the abbreviated and complete forms (Hoshi et al. 1994; Zagotta et al. 1994a,b) and are explained in the Discussion section. Simulation and modelling helped to determine which of the three models best fitted our data but, of course, goodness of fit does not prove that a model is correct but rather that this approach provides insights into underlying mechanisms.
Membrane isolation, glycosidase treatment and immunoblot analysis
Rat brain membrane proteins and cell line membranes were prepared as described previously (Thornhill et al. 1996). Rat brains were from rats killed by a rising concentration of CO2 followed by decapitation, as approved by the institutional animal protocol committee. Endo H and PNGase F glycosidases (Boehringer Mannheim) were used as per the manufacturer's protocol with the final concentration of glycosidases at 0.16 and 13 U ml−1, respectively, for 20–24 h at 37 °C. Twenty-five per cent of the membranes recovered from a well of a six-well dish were used to run 9 % polyacrylamide SDS gels (∼20 μg membrane protein per gel lane). The proteins were electrotransferred to nitrocellulose (Biorad), and the filter was blocked with 5 % non-fat milk in PBS and then incubated overnight in Kv1.1 rabbit polyclonal N-terminus (to amino acids 4–27) primary antibody, 1:1000 dilution (Thornhill et al. 1996). After washing, horseradish peroxidase-linked anti-rabbit secondary antibodies were added and the bound antibodies were detected using enhanced chemiluminscence (Amersham: ECL detection kit) and X-ray film (Kodak XAR5). Cell surface Kv1.1 proteins were detected by biotinylation and immunoblotting of plasma membrane proteins in intact transfected cells as we have described previously (Zhu et al. 2001).
Statistical evaluation
A P value < 0.05 was considered significant in a statistical test. Data are shown as means ±s.e.m.
RESULTS
Glycoprotein expression pattern of Kv1.1
Membrane proteins from brain and Kv1.1 stably transfected cell lines were used for immunoblot analysis. The denatured Kv1.1 monomer from whole adult brain was a diffuse ∼80 kDa (p80) band (Fig. 1A, lane 1). The brain Kv1.1 protein was sensitive to sialidase, which cleaves sialic acids, and to PNGase F (Endo F), which cleaves all N-linked carbohydrate trees, but was insensitive to Endo H, which cleaves only high N-linked mannose-type carbohydrate trees, and this suggested each Kv1.1 subunit was a mature glycoprotein that had significant carbohydrate content (∼20–25 kDa by gel mobility shift, data not shown). Kv1.1 has only one extracellular N-glycosylation consensus site (NXS/T, with X any amino acid but proline) (Kornfeld & Kornfeld, 1985) on the S1-S2 loop at N207 (Fig. 1B).
Figure 1. Kv1.1 and Kv1.1N207Q immunoblot analysis.
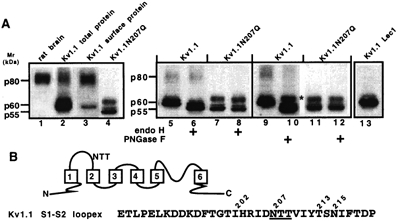
A, immunoblot analysis using Kv1.1 antibodies of membranes isolated from native brain and from Kv1.1 or Kv1.1N207Q stably transfected cell lines. About 20 μg membrane protein from Kv1.1 or Kv1.1N207Q stable transfectants was +/- Endo H or PNGase glycosidase treated and immunoblotted as described in Methods. p80, p60 and p55 represent protein bands of 80, 60 and 55 kDa. In lane 3, cell surface biotinylation/immunoblotting methods were used to determine the glycosylation pattern of Kv1.1 channels on the cell surface as described in the Methods. In lane 11, Kv1.1 Lec1 represents Kv1.1 expressed in Lec1 cells (glycosylation-deficient CHO cells). B, schematic diagram of a Kv1.1 monomer and the amino acid sequence of its extracellular S1-S2 loop.
In contrast to brain, Kv1.1 proteins in total membrane proteins (ER, Golgi, plasma membrane) from transfected CHO cells were mostly ∼58–60 kDa (termed p60) bands (Fig. 1A, lane 2). These ∼58–60 kDa bands were sensitive to both Endo H and PNGase F (Fig. 1A, lanes 6 and 10, respectively), which indicated they were immature glycoproteins that were not fully Golgi-glycosylated. Endo H deglycosylation produced multiple bands (Fig. 1A, lane 6), which implied Kv1.1 had an additional post-translational modification(s) (see next paragraph). The Kv1.1 diffuse ∼80 kDa band (p80) had a similar molecular mass to Kv1.1 in rat brain (Fig. 1A, compare lane 2 with 1) and was PNGase F sensitive but Endo H insensitive, which indicated it was a mature glycoprotein that had been processed in the Golgi (Fig. 1A, lanes 10 and 6, respectively). Stable Kv1.1 CHO transfectants were selected that had the highest percentage of the p80 band in total membrane immunoblots because it was similar to brain and we reasoned it would be enriched on the cell surface. Indeed, cell surface biotinylation and immunoblotting methods showed that of the total cell surface Kv1.1 proteins, ∼73 % represented the p80 band (trans-Golgi glycosylated/ sialylated) and ∼27 % represented lower bands (high mannose-type glycoproteins) (Fig. 1A, lane 3). The Kv1.1 p80 band was somewhat enriched, although not to the level in CHO cells, in the plasma membrane of Kv1.1 cRNA-injected frog oocytes (Ivanina et al. 1993). It should be noted that we have shown that Kv1.1 homomers in transiently transfected cell lines exhibited a much lower trans-Golgi glycosylation and sialylation of cell surface channels (Zhu et al. 2001) compared with our immunoblot-selected stable transfectants here.
Kv1.1N207Q showed a ∼55 kDa (p55) band, similar to the core protein size, and a ∼60 kDa (p60) band (Fig. 1A, lane 4). All bands were insensitive to Endo H or PNGase F (Fig. 1A, lanes 8 and 12, respectively), which indicated there was only one N-linked sugar tree on Kv1.1 at N207. The Kv1.1N207Q p60 band presumably was due to phosphorylation at S446 (Ivanina et al. 1994). PNGase F-treated Kv1.1 had two lower Mr bands (Fig. 1A, lane 10), which were similar to those of Kv1.1N207Q, and both p55 and p60 bands were non-glycosylated, but the p60 band, indicated by an asterisk in Fig. 1A, was also phosphorylated. Alternatively, another uncharacterized post-translational modification(s), such as a small O-linked sugar tree, may have contributed to the Mr of the p60 band.
Glycosylation of Kv1.1 affected steady-state activation and kinetic properties but not deactivation kinetic properties of ionic currents
Non-transfected CHO cells do not express αKv1 subfamily proteins (Helms et al. 1997) or Kv β-subunit proteins (Shamotienko et al. 1999) and the Kv1.1 channel would be expressed as a homotetramer in these cells. In Kv1.1- and Kv1.1N207Q-transfected cells, macroscopic K+ current traces were elicited by 80 ms depolarizing pulses (Fig. 2A and B, respectively). The voltage dependence for channel activation was examined by plotting fractional conductance as a function of test depolarization, and data were fitted to Boltzmann equations (Hoshi et al. 1994; Zagotta et al. 1994a,b). For a simple Boltzmann equation, a ∼8 mV positive shift in V1/2 was recorded for Kv1.1N207Q, which indicated that more depolarization was required for half-maximal channel opening, and the slope (a) of its G-V curve was also shallower compared with that of Kv1.1 (Fig. 2C and D). A shallower G-V slope may indicate an apparent reduced voltage dependence of the channel. Current traces were not superimposable at the V1/2 for Kv1.1 and Kv1.1N207Q (Fig. 2A and B on an expanded scale). For a Boltzmann equation raised to the 4th power, V1/2 values were only slightly different for Kv1.1 and Kv1.1N207Q, which indicated that the voltage at which the channel was half-way in the activation process was not changed, whereas the N207Q mutant had a shallower G-V slope that implied there was an apparent reduction in the total amount of apparent charge displaced by each subunit during the activation process (Fig. 2C and D).
Figure 2. Kv1.1 and Kv1.1N207Q exhibited differences in activation parameters.
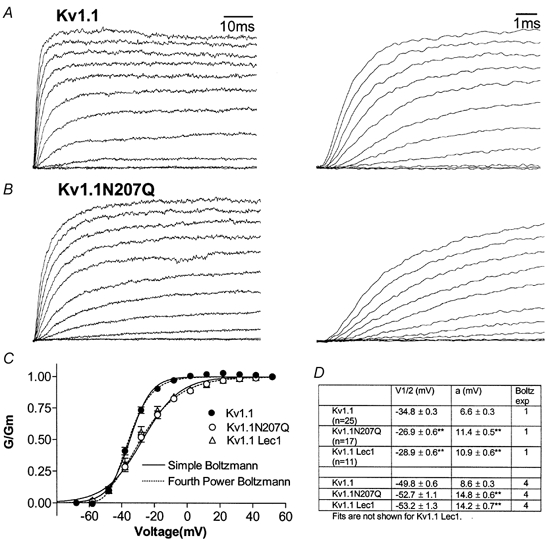
A and B, whole-cell current traces for Kv1.1 and Kv1.1N207Q. Eighty millisecond depolarizing pulses were applied from −70 to 50 mV in 10 mV increments. The currents were scaled to equal each other so that activation kinetics can be compared visually. In original traces, Kv1.1 had a peak current of 1500 pA and Kv1.1N207Q had a peak current of 1700 pA at 50 mV. C, normalized G/Gmvs. voltage curves of Kv1.1, Kv1.1N207Q and Kv1.1 in Lec1 cells. Conductance values were plotted as a function of test potential and points were fitted to either a simple (n = 1) or a fourth power (n = 4) Boltzmann equation, G = (Gm/1 + exp[(Vp - V1/2)/a]n, using an automated non-linear least squares curve fitting routine (Levenberg-Marquardt Method). Gm is the maximum sustained conductance, Vp is the membrane potential. D, group data. For a simple Boltzmann equation, V1/2 was the test potential, where G/Gm= 0.5 and a represented the slope of the voltage dependence of activation (given by a =kT/ze; where T is the absolute temperature, k the Boltzmann constant, e the electron charge, and z the valency of the gating charge). For a Boltzmann equation raised to the 4th power, V1/2 was the potential at which the channel was half-way through the activation process and the a slope value was the total apparent charge displayed by each subunit during the activation process (Hoshi et al. 1994; Zagotta et al. 1994a,b). **Statistical significance of P < 0.01 in an ANOVA test.
We controlled for changing asparagine 207 to glutamine as follows. (1) Kv1.1 was expressed in CHO glycosylation-deficient Lec1 cells that produced only high mannose-type glycoproteins (carbohydrate tree = GlcNAc2-Mannose5 and surface glycolipids were not affected; Stanley, 1987). Kv1.1 in Lec1 cells were high mannose-type glycoproteins (Fig. 1A, lane 13) and sensitive to Endo H (data not shown), and these cells exhibited similar gating to Kv1.1N207Q with a positively shifted V1/2 of ∼6 mV and a shallower G-V slope compared with control (Fig. 2C and D). (2) Kv1.1 channels with conservative mutations around N207, such as I202L, T213S and N215Q (Fig. 1B), exhibited gating parameters similar to control (data not shown). (3) Kv1.1 in control CHO cells treated with sialidase exhibited a positively shifted V1/2 compared with control (Thornhill et al. 1996). These findings suggested it was the N207 sugar tree reduction, and not the amino acid replacement per se, that affected Kv1.1N207Q gating.
Kv1.1N207Q exhibited a longer delay to current rise following voltage pulses and slower activation (opening) kinetics compared with Kv1.1 (Fig. 2A and B). Kv1.1 and Kv1.1N207Q currents activated with a sigmoidal delay reflecting a multistep opening process, but it appeared that Kv1.1N207Q displayed less sigmoidicity. As the test potential was stepped to more positive values, channel activation kinetics accelerated for both conditions. Kv1.1N207Q exhibited significantly slower rise times (10–90 % values) (Fig. 3A and B) and slower activation time constants (Fig. 3C and D) at depolarizations more positive than −30 mV compared with Kv1.1. With depolarizing voltage steps more positive than −10 mV the probability of opening for both channels nears saturation, the reverse rates can be considered negligible, and the kinetics of activation are mostly determined by forward rates (Hoshi et al. 1994; Zagotta et al. 1994a,b). This region was more clearly detected when time constants were plotted on a log scale (Fig. 3D versus C). We found that a good single-exponential fit was obtained at potentials more positive than −10 mV and Kv1.1N207Q activated more slowly than Kv1.1. Moreover the voltage dependence was similar for Kv1.1 and Kv1.1N207Q and the deduced amount of charge moved for these forward transitions was small and similar for the two conditions (0.67 and 0.63 e− charges).
Figure 3. Kv1.1 and Kv1.1N207Q exhibited differences in activation kinetics of ionic currents.
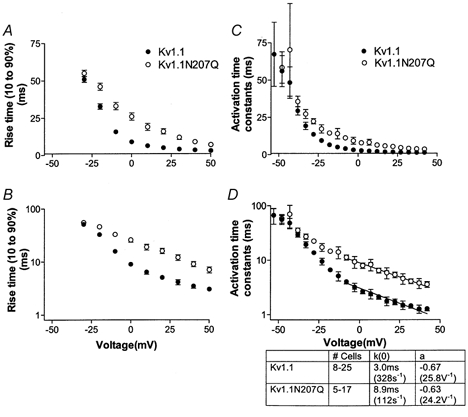
A and B, activation rise time as a function of test voltages. Rise time is the required time for each trace to rise from 10 % up to 90 % of its peak current; A is a linear plot and B a log plot. C and D, activation time constants (τ) as a function of voltage. Activating current traces were fitted with a single-exponential function from the time they reached half-maximal amplitude to the maximum current level as a function of test voltages; C is a linear plot and D a log plot. Data were fitted with a decaying exponential function above −10 mV (at potentials where deactivation was minimal); k(0) = activation time constant at 0 mV; a = voltage dependence.
In contrast, the deactivation ionic current time course (Fig. 4A and B) and the measured magnitude and voltage dependence of the deactivation time constants (Fig. 4C and D) were similar for Kv1.1 and Kv1.1N207Q. The N207Q mutation appeared not to affect the amount of charge during the forward transitions late in the activation process or the charge associated with the early backward transitions (∼0.87 e− charges). Thus the steady-state G-V slope change appeared not to involve charge amounts changed during these steps.
Figure 4. Kv1.1 and Kv1.1N207Q exhibited no differences in deactivation kinetics of ionic currents.
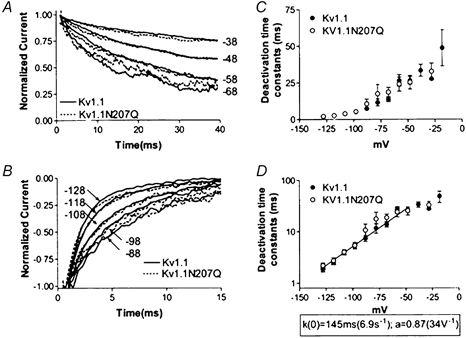
A and B, averaged normalized deactivation currents are shown for both Kv1.1 and Kv1.1N207Q. Cells were held at −80 mV and depolarized to 20 mV for 80 ms followed by repolarizations to different test potentials indicated beside the traces (mV). Data were normalized to the value at 1 ms to avoid contributions from residual capacitance transients. C and D, deactivation time constants (τ) as a function of test voltage. Individual deactivation current traces were fitted with a single exponential and the time constants were plotted as a function of voltage in C as a linear plot and in D as a log plot. Data were fitted with a decaying exponential function below −50 mV (where activation was minimal). k(0) = deactivation time constant at 0 mV; a = voltage dependence.
These results suggested that N-glycosylation of the Kv1.1 channel significantly affected the steady-state activation curve and activation kinetic properties but apparently not the deactivation kinetic properties of ionic currents. About ∼73 % of Kv1.1 surface subunits had a mature carbohydrate tree similar to brain, whereas ∼27 % had an immature high mannose-type sugar tree. Thus 100 % maturely glycosylated Kv1.1 channels on the cell surface, as is found in brain, would be expected to exhibit a more negative V1/2 than we recorded here and hence the differences between Kv1.1 and Kv1.1N207Q gating would be greater.
Glycosylation of Kv1.1 affected C-type inactivation parameters and recovery parameters
Kv1.1 and Kv1.1N207Q both showed slow C-type inactivation and Kv1.1N207Q inactivated with slower kinetics and to a lesser extent than Kv1.1 (Fig. 5A and B). Inactivation differences were quantified as an inactivated ratio (current amplitude at pulse end/peak current amplitude; Fig. 5C). Inactivated ratios at 20 mV were plotted as a function of time and at all measured times Kv1.1N207Q inactivated less than Kv1.1 (Fig. 5E). We next plotted inactivated ratios at two duration times, 10 and 3 s, as a function of depolarization and at all voltages tested Kv1.1N207Q inactivated to an extent that was less than Kv1.1 (Fig. 5D). The extent of inactivation for a channel was voltage independent over the range tested (Fig. 5D). The kinetics of inactivation were best fitted by the sum of two exponentials and this suggested that at least two processes were involved in C-type inactivation. The two time constants, τfast and τslow, and their ratios of the total decaying current trace are shown in Fig. 5F. τslow for Kv1.1N207Q was slower compared with that of Kv1.1 and comprised a larger percentage of the total trace. The τfast values for the two conditions were not significantly different. Recovery from C-type inactivation was examined with a series of double-pulse protocols (Fig. 6) and was less for Kv1.1N207Q compared with Kv1.1 at all repolarization times (Fig. 6D).
Figure 5. Kv1.1 and Kv1.1N207Q exhibited differences in C-type inactivation parameters.
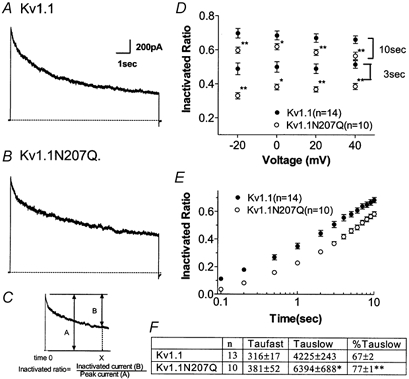
A and B, whole-cell recordings showing C-type inactivation at 20 mV. A double exponential fitted the current decay very well. Inactivation was examined further with long pulse protocols: depolarizing to −20, 0, 20 and 40 mV from −80 mV for 10 s with a sampling rate of 10 kHz (filtered at 2 kHz). C, inactivation ratio is defined as shown. D, inactivated ratio of Kv1.1 and Kv1.1N207Q at 10 and 3 s at each test voltage (*P < 0.05, **P < 0.01 vs. Kv1.1, Student's unpaired t test). Within the same time group containing four different voltages no significant difference was observed. E, inactivated ratio as a function of time (at 20 mV). At every time point significant differences were observed (P < 0.01) between Kv1.1N207Q and Kv1.1. F, inactivating traces at 20 mV for 10 s (A and B) were fitted with a double-exponential function. A significant difference was apparent in the slow component (τslow) and its magnitude.
Figure 6. Kv1.1 and Kv1.1N207Q exhibited differences in recovery from C-type inactivation.
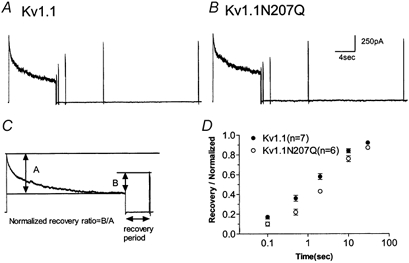
A and B, superimposed whole-cell current traces elicited by a series of double-pulse protocols. The first depolarizing pulse was to 20 mV for 10 s, then an 80 ms pulse to 20 mV with holding intervals from 100 ms to 30 s at −80 mV (sampling rate 5–10 kHz and filtered at 1–2 kHz depending on the protocol's length). C, because of the different magnitude of C-type inactivation, recovery processes were evaluated using a normalized ratio (A, inactivated current in the first 10 s pulse; B, recovered current during the various interval period). D, normalized recovery ratio as a function of the intervals of the double-pulse protocols, showing a slower recovery process of Kv1.1N207Q compared with wild-type.
Glycosylation of Kv1.1 affected sensitivity to extracellular divalent cations
Ion channel V1/2 values are shifted positively or negatively with high or low, respectively, extracellular divalent cations. This divalent cation effect is thought to be due to their screening and/or binding fixed cell surface negative charges on channels and closely associated lipids (Frankenhaeuser & Hodgkin, 1957; Begenisich, 1988; Hille, 2001). We used the divalent cation strontium (Sr2+) in the bath solution to test for its effect on Kv1.1 and Kv1.1N207Q gating because it is more of a screener of negative surface charge compared with a mixed screener/binder like Ca2+ (Elinder et al. 1996; Hille, 2001). A family of K+ currents were recorded with 2 mM Ca2+ in the bath solution with or without extracellular 20 mM or 50 mM Sr2+. In the presence of Sr2+ the V1/2 values for both Kv1.1 and Kv1.1N207Q were shifted positively but that for Kv1.1N207Q was shifted less, whereas the G-V slope was not affected by Sr2+ (Fig. 7). Fifty millimolar extracellular Sr2+ induced a positive V1/2 shift of 14.7 mV for Kv1.1, whereas it only induced an 8.4 mV positive shift for Kv1.1N207Q. The V1/2 for Kv1.1N207Q was shifted to a significantly less extent, i.e. ∼60 % (8.4/14.7) compared with wild-type with 50 mM extracellular Sr2+ (P < 0.05 by a two-way fractional ANOVA). Assuming that the extracellular Sr2+-induced V1/2 shifts arose from changes in uniform surface potentials that resulted from simple screening of fixed planar surface charges, as the Gouy-Chapman surface charge theory postulates (reviewed in Hille, 2001), the apparent ‘effective’ surface change density (e nm−2) that affected channel gating can be estimated as outlined in Methods. Indeed, Kv1.1′s effective surface charge density was 0.43 e nm−2, whereas Kv1.2N207Q's was lower at 0.26 e nm−2. Similar results were obtained with 20 mM extracellular Sr2+ (Fig. 7C). These results suggested that part of the total extracellular Sr2+-sensitive screenable negative surface charges on the channel were from sialic acids attached to the N207 carbohydrate tree.
Figure 7. Extracellular strontium affected the V1/2 for Kv1.1 more than that for Kv1.1N207Q and the former had a higher effective surface charge density than the latter.
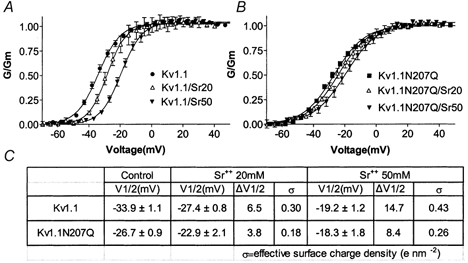
A and B, steady-state activation versus voltage curves for Kv1.1 and Kv1.1N207Q with and without external Sr2+ (20 mM, n = 7; 50 mM, n = 10). C, table of group data for V1/2 mean values ±s.e.m. V1/2 values were used to calculate the effective surface charge densities associated with Kv1.1 and Kv1.1N207Q, as described in the Methods. ΔV1/2, V1/2 shifts (in mV).
DISCUSSION
This report presents evidence that preventing N-glycosylation of the Kv1.1 channel modifies its function. Kv1.1N207Q exhibited slowed activation kinetics, a positively shifted V1/2, a shallower G-V slope, slowed C-type inactivation kinetics, a reduced extent of C-type inactivation, and slower recovery from C-type inactivation compared with Kv1.1. The Kv1.1 in Lec1 cells displayed similar activation gating changes to those of Kv1.1N207Q, which implied that lack of trans-Golgi sugars on the tree, such as galactose and sialic acid, was responsible for most of the differences. Deactivation kinetics were similar for the two conditions. Kv1.1N207Q was less sensitive to extracellular divalent cations compared with Kv1.1, which suggested channel sialic acids contributed to the surface potential sensed by activation gating elements. Moreover, a shallower G-V slope in the mutant, without a change in the voltage dependence of activation and deactivation kinetics, suggested that carbohydrate tree removal induced an additional effect. This additional effect was probed by modelling in the following sections.
Possible mechanisms involved in gating modulation of K+ channels by glycosylation
Two theories pertinent to our results are the surface potential (SP) theory (Frankenhaeuser & Hodgkin, 1957) and a gating stabilizing (GS) theory (for review see Hille, 2001). The SP theory states that an ion channel's voltage sensor(s) experiences a uniform transmembrane electrical field and that a negative surface potential, from negatively charged moieties on a channel and/or on closely associated lipids, affects a channel's voltage sensor(s) equally. Increasing extracellular cations screens these charges, effectively neutralizing their effect on gating, and a greater depolarization is required for channel activation, and this does not stabilize or alter a channel's conformational state. It rigorously requires that surface charges be close to the gating machinery, that cations of similar valency affect all voltage gating parameters equally, and that titrating surface charge be equivalent to changing the voltage clamp holding potential, with the result that G-V curves are shifted positively without a change in their G-V slopes. In contrast a GS theory states that a factor(s) that stabilizes a channel's open state, relative to its closed state, will cause hyperpolarized gating shifts, whereas a destabilizing factor(s) will cause depolarized shifts. A factor(s) is not required to be close to the gating machinery and changes may or may not affect G-V slopes or other gating parameters equally.
The Kv1.1 N207 sugar tree contributed ∼40 % of the Sr2+-screenable negative surface charge, whereas ∼60 % was from the channel's extracellular negatively charged amino acids, an unknown O-linked sugar containing sialic acid, and/or closely associated phospholipids and/or sialylglycolipids. The screenable N207 tree charges appeared to be sialic acids because we showed that sialidase treatment affected Kv1.1 gating (Thornhill et al. 1996). This sialic acid effect was probably direct but we cannot rule out the possibility that removing sugars induced a conformational change that altered pertinently charged channel amino acid positions. Consistent with a SP mechanism, we recorded a positively shifted V1/2 with sugar removal, and activation kinetics for both conditions that at positive voltages showed a parallel shift in voltage dependence. However, numerous gating changes of Kv1.1N207Q compared with Kv1.1 were inconsistent with a SP mechanism, such as its longer delay to current onset following voltage pulses that produced similar G/Gm values (where Gm is the maximum sustained conductance), its non-superimposability of the current trace at its V1/2, its shallower G-V slope, and no change in deactivation kinetics (Hille, 2001). Given these findings, a GS mechanism that involved cooperative subunit interactions also appeared to be involved, as discussed below.
Our current and previous (Thornhill et al. 1996) studies suggested that the Kv1.1 glycosylation state affected G-V slopes. For G-V slope steepness the order was as follows: Kv1.1 ∼ Kv1.1 sialidase treated (reduced sialic acids) ∼ Kv1.1Lec2 (reduced sialic acids) > Kv1.1Lec8 (sugar tree = GlcNAc2-Mannose3-GlcNAc2) > Kv1.1Lec1 (sugar tree = GlcNAc2-Mannose5) ∼ Kv1.1N207Q (no sugar tree). The general mature N-linked sugar tree on plasma membrane proteins is Asparagine-GlcNAc2-Mannose3-GlcNAc2-Galactose2- Sialic acidn. It should also be noted that Kv1.1 in Lec2 had significant channel sialic acids because this line did not completely block sialic acid addition, and that sialidase treatment did not remove all sialic acids from the channel (Thornhill et al. 1996). We could not analyse Kv1.1 with only a GlcNAc2-Mannose3-GlcNAc2-Galactose2 tree, that is, a tree that contained terminal galactose but no sialic acid, because our conditions did not generate it. Nonetheless, our data suggested that partial Kv1.1 sialic acid removal (Kv1.1 sialidase treated or Kv1.1Lec2, Thornhill et al. 1996) was consistent with a SP mechanism, whereas complete removal of the sugar tree in Kv1.1N207Q was more consistent with a combined SP and GS mechanism. Furthermore, Kv1.1 in Lec1 and in Lec8, with truncated carbohydrate trees, both displayed shallower G-V slopes compared with control and this suggested that even with a truncated sugar tree the effect on gating was more consistent with a combined SP and GS mechanism. In addition, Kv1.1 in Lec2 and Lec8 cells, both with a truncated N-linked sugar tree, exhibited positively shifted V1/2 values of ∼8 and ∼16 mV, respectively, compared with control (Thornhill et al. 1996), whereas in our current study Kv1.1N207Q, with no N-linked sugar tree, had a ∼8 mV positively shifted V1/2. The greater than 8 mV shift recorded in Lec8 may be because this mutant, like Lec2, had reduced surface glycolipids. Thus glycolipids may be closely associated with Kv1.1 and influence gating by their negative surface charge effect. Another possibility is that Kv1.1 had an unknown O-linked sugar tree with sialic acid(s) that affected gating.
Modelling
As previously found for Shaker-type K+ channels (Hodkgin & Huxley, 1952; Hoshi et al. 1994; Zagotta et al. 1994a,b; Schoppa & Sigworth, 1998a,b,c; Koren et al. 1999), Kv1.1 and Kv1.1N207Q activation currents exhibited a delay prior to current rise and sigmoidal kinetics that could not be simulated with models using only independent channel transitions (e.g. four independent and identical voltage-dependent transitions C1⇔ C2⇔ C3⇔ C4⇔ O). Such models predict faster deactivation rates than the ones measured. These properties have been interpreted to mean that an activating voltage pulled the S4 region outward through part of the membrane electrical field and this induced a series of conformational steps in each of the four subunits through a number of closed (C) states (accounting for the current delay and sigmoidal kinetics) until all subunits were in a last closed but permissive state (Ledwell & Aldrich, 1999). Moreover the transition from the open to the first closed state in the deactivation pathway was slowed through cooperative subunit interactions (Zagotta et al. 1994b). We tested three models that included four channel subunits and subunit cooperative interactions that have been used for Shaker K+ channels (Hoshi et al. 1994; Zagotta et al. 1994a,b). In these models, Q represents a cooperativity stabilizing factor that reduced the first closing rate, and the inverse of the measured activation and deactivation time constants were assigned as the forward and backward rates between the last closed state to the open state (C5⇔ O for Model 1 or C14⇔ O for Models 2 and 3, see below).
The first model, referred to as C5-Q (Appendix I; Hoshi et al. 1994; Zagotta et al. 1994a,b), postulated that each of the four subunits had a single conformational change that was followed by a final concerted conformational change to open (O). All rates are related to the C5⇔ O rates, and the only parameter that was changed to optimize the data simulation was Q. The best G-V simulations were obtained for Q = 28 and 10 for Kv1.1 and Kv1.1N207Q, respectively (Fig. 8A and B). The effect of lowering Q is to lower the G-V curve steepness and to produce a depolarization shift of the G-V curve. Kinetic analysis showed the N207Q mutation increased the activation time constants. However, it did not change their voltage dependence or the value and voltage dependence of the deactivation time constants. Therefore, the G-V curve depolarized shift could be accounted for in part by increased activation time constants and in part by a lowered Q value, whereas the shallower G-V slope could be accounted for by a lowered Q value. This model reproduced the G-V curve very nicely for Kv1.1 but not so nicely for Kv1.1N207Q (Fig. 8A and B). Moreover, for both channels the model simulated current traces with time constants that were slower than the ones collected (Fig. 9A and B).
Figure 8. Data and simulations of steady-state activation versus voltage curves of Kv1.1 and Kv1.1N207Q.
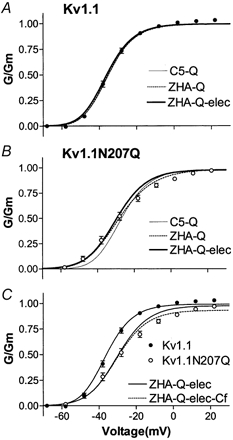
A-C, steady-state activation versus voltage curves for Kv1.1 and Kv1.1N207Q and simulations from models developed for Shaker-type K+ channels (Hoshi et al. 1994; Zagotta et al. 1994a,b; see text and appendices for description of these models).
Figure 9. Activation ionic current traces and simulations for Kv1.1 and Kv1.1N207Q.
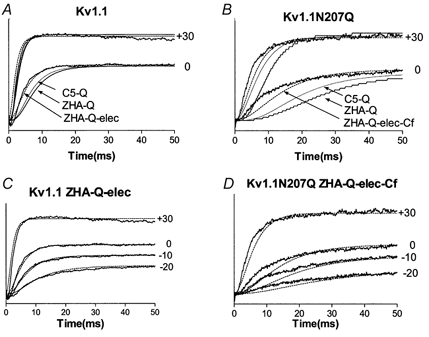
A-D, activation ionic current traces at different voltages (mV) of Kv1.1 and Kv1.1N207Q and simulations using the three models described in the text.
The second model, referred to as ZHA-Q (Appendices IB and II; Hoshi et al. 1994; Zagotta et al. 1994a,b), postulated that opening required two conformational changes within each subunit before a final concerted conformational change to open. If each rate constant was exponentially dependent on voltage, this model possessed nine parameters for the transitions that occurred before opening (see Appendix IV). The values and voltage dependence for α and β were initially set to values previously found for Shaker K+ channels (Zagotta et al. 1994a,b), then these values and the Q value were changed to fit the G-V curve (Table 2, Model 2). During this manual fit we attempted to keep the α and β values similar between Kv1.1 and Kv1.1N207Q. If needed, differences were allowed first for the α rate and then for the β rate, but no changes were allowed for their voltage dependence. As for Model 1, the G-V curve depolarized shift observed with the N207Q mutation could be accounted for in part by increased activation time constants (γ, α) and in part by a lowered Q value, whereas the shallower G-V slope could only be accounted for by a lowered Q value (Table 2, Model 2). In addition this model suggests that the N207Q mutation completely eliminated the cooperativity stabilizing factor that reduced the first closing rate (Q = 1). This model reproduced the G-V curve nicely for both Kv1.1 and Kv1.1N207Q (Fig. 8A and B) but not the time course of the current traces (Fig. 9A and B).
Table 2.
| Kv1.1 | Kv1.1N207Q | |||||
|---|---|---|---|---|---|---|
| VD | VD | |||||
| k(0) (s−1) | (V−1) | (e−charges) | k(0) (s−1) | (V−1) | (e−charges) | |
| (1) Model 1. C5-Q | ||||||
| α (C5→ O) | 328 | 25 | 0.65 | 112 | 25 | 0.65 |
| 5βIQ (C5← O) | 6.9 | 34 | 0.87 | 6.9 | 34 | 0.87 |
| β | 39 | 34 | 0.87 | 14 | 34 | 0.87 |
| Q (cooperativity) | 28 | — | — | 10 | — | — |
| (2) Model 2. ZHA-Q* | ||||||
| γ (C14→ O) | 328 | 25 | 0.65 | 112 | 25 | 0.65 |
| 47δ/Q(C14← O) | 6.9 | 34 | 0.87 | 6.9 | 34 | 0.87 |
| α | 3000 | 3 | 0.08 | 800 | 3 | 0.08 |
| β | 800 | 30 | 0.78 | 400 | 30 | 0.78 |
| δ | 17.2 | 34 | 0.87 | 1.7 | 34 | 0.87 |
| Q (cooperativity) | 10 | — | — | 1 | — | — |
| (3) Model 3. ZHA-Q-elec† | ||||||
| γxy3yy3 (C14→ O) | 328 | 25 | 0.65 | 112 | 25 | 0.65 |
| 4δxδ3yγ3/Q (C14→ O) | 6.9 | 34 | 0.87 | 6.9 | 34 | 0.87 |
| α | 70000 | 5 | 0.13 | 80000 | 5 | 0.13 |
| β | 200 | 80 | 2.08 | 200 | 80 | 20.08 |
| γ | 1038 | 28 | 0.65 | 354 | 25 | 0.65 |
| δ | 3.7 | 34 | 0.87 | 0.37 | 34 | 0.87 |
| Q (cooperativity) | 10 | — | — | 1 | — | — |
| η(mV/e−) | 4 | — | — | 4 | — | — |
| O → Cf | — | — | — | 200 | — | — |
| O ← Cf | — | — | — | 4000 | 4 | 0.10 |
k(0) = rate at 0 mV; VD = voltage dependence (volts−1 (V−1) or e− charges). Bold numbers in the Kv1.1 column are different in the Kv1.1N207Q column. See text for details and the appendices for abbreviated and complete forms of Models 1,2 and 3.
Zagotta et al. (1994a), Fig. 17.
The third model, referred to as ZHA-Q-elec (Appendices I and III; Hoshi et al. 1994; Zagotta et al. 1994a,b), is a modified ZHA-Q model. It postulated that each conformational transition exerted an electrostatic effect on all subsequent transitions in proportion to the total amount of charge moved, as determined by their voltage dependence (Appendix IV). This electrostatic effect is not related to the screenable surface charge. In this model the first transition in each subunit will slow the second transition in that subunit as well as the first and second transitions of other subunits, and this can be viewed as a type of negative cooperativity. This modification introduced only one additional free parameter, η, which represented the voltage shift produced per unit gating charge already moved (mV/e−) (Appendix IV; Zagotta et al. 1994a,b). During this manual fit the η value was kept the same for Kv1.1 and Kv1.1N207Q and modified to improve the fit to the time course of the current traces. If needed, changes were allowed for the α and β rates, but no changes were allowed for their voltage dependence. The simulation indicated that the G-V curve depolarized shift observed with the N207Q mutation could be accounted for in part by an increase in the late activation time constant (R2→ A) (not in the early one R1→ R2) and in part by lowering Q; and again the shallower G-V slope could only be accounted for by a lowered Q value (Table 2, Model 3). The 10-fold-decreased Q value translated into a 10-fold decreased δ value (R2← A) (Table 2), then based on modelling both Kv1.1 and Kv1.1N207Q channels could have the same first closing rate value from open to the permissive non-conducting state (C14← O), whereas the N207Q mutation appeared to have a strong effect on deactivation rates following the permissive non-conductive state (R2← A) and no effect on late deactivation rates (R1← R2). In addition, the N207Q does not appear to affect η. This model reproduced the G–V curves of both Kv1.1 and Kv1.1N207Q channels nicely (Fig. 8A and B), but a better simulation of the G–V curve for Kv1.1N207Q, especially at positive voltages, was obtained by introducing a fast closed state, Cf, after the open state (Fig. 8C). This Cf state has been described previously in Shaker K+ channels (Hoshi et al. 1994; Zagotta et al. 1994a,b) and Kv1.1 channels (Koren et al. 1990). The ZHA-Q-elec model also simulated more closely the time course of the current traces for both the Kv1.1 and the Kv1.1N207Q channels, although the simulation was better for the Kv1.1 channels, particularly at negative voltages (Fig. 9). For Kv1.1 and Kv1.1N207Q channels the time course (Fig. 10A) and the voltage dependence of deactivation (Fig. 10B) were also simulated reasonable well with this model.
Figure 10. Deactivation ionic current traces and simulations for Kv1.1 and Kv1.1N207Q.
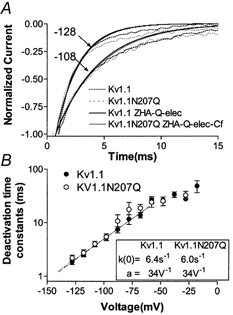
Deactivation ionic current traces at different voltages of Kv1.1 (A) and Kv1.1N207Q (B), and their voltage dependence, were fitted by simulation using the ZHA Q-elec model described in the text.
Thus our data, coupled with modelling, suggested that removal of the N207 carbohydrate tree on Kv1.1 had two major effects. The first effect slowed the channel's concerted transition from the last closed state to the open state without changing the voltage dependence of its kinetics. This effect accounted for the G-V depolarization shift and together with the lower sensitivity to divalent cations it suggested the carbohydrate tree, and its negatively charged sialic acids, affected the negative surface charge density on the channel's extracellular face that was sensed at least by the activation gating elements. The second effect involved conformational changes: one type that reduced the cooperativity factor Q that slowed the transition from the open state to the closed state (the deactivation pathway), and this accounted for the shallow G-V slope and also contributed to the depolarized G-V shift; and a second type that slowed C-type inactivation. C-type inactivation has been proposed to involve cooperative subunit interactions from possible transient changes in the external pore (Grissmer & Cahalan, 1989; Choi et al. 1991; Hoshi et al. 1991; Yellen et al. 1994; Panyi et al. 1995; Liu et al. 1996). Thus, partial sialic acid removal (sialidase treatment, Kv1.1Lec2; Thornhill et al. 1996) was somewhat consistent with a SP mechanism, whereas truncation of the sugar tree (Kv1.1Lec1) or its complete removal (Kv1.1N207Q) was more consistent with a combined SP and cooperative subunit interaction mechanism.
Are there alternative explanations for the effect of glycosylation on Kv1.1 G-V slope change? We also considered the possibility that the shallow G-V slope of Kv1.1N207Q may in part be due to an increased gating variability of individual channels. Although this remains a possibility it implies that there is more than one open state for Kv1.1 and Kv1.1N207Q channels and we only used one open state in our modelling/simulations, as has been done for Shaker K+ channels (Hoshi et al. 1994) and Kv1.1 channels (Koren et al. 1990). In contrast, we have presented data that sialidase-treated batrachotoxin (BTX)-modified electroplax voltage-gated sodium channels exhibited both a depolarized G-V curve shift and a shallower G-V slope (Recio-Pinto et al. 1990). The shallower G-V slope appeared to result at least in part from an increase in single-channel gating variability, between channels and for the same channel over time, indicative of more than one open state for both wild-type and treated BTX-modified sodium channels.
Other reports on glycosylation and K+ channel function and expression
A study has reported no functional effects of Kv1.1 N-glycosylation (Deal et al. 1994). Kv1.1 in this study appeared to be expressed on the cell surface as an immature high mannose-type glycoprotein lacking sialic acids. Their Kv1.1 mannose-type glycoproteins were biochemically similar to the Kv1.1 mannose-type glycoproteins expressed in Lec1 cells in our current study, and the functional properties of Kv1.1Lec1 were similar to those of Kv1.1N207Q. Thus a possible explanation for the Deal et al. (1994) finding is that their wild-type Kv1.1 lacked sialic acids, in contrast to Kv1.1 in our study, and so its gating properties were already similar to those of Kv1.1N207Q.
Glycosylation of KvLQT1/minK K+ channels (Freeman et al. 2000) or ROMK1 K+ channels (Schwalbe et al. 1995) affected their expression and function. Sialylation of some ventricular K+ channels (Kv4.3) also affected channel gating (Ufret-Vincenty et al. 2001b) and preventing glycosylation of HERG channels inhibited their surface expression (Petrecca et al. 1999). In contrast, no functional effects of glycosylation on Shaker B K+ channels (Santacruz-Toloza et al. 1994) or squid Kv1-type K+ channels (Liu et al. 2001) were reported, and we did not detect any functional effects of glycosylation on G-protein-coupled inward rectifying K+ channels (Pabon et al. 2000). However, it appeared that glycosylation did affect the Kv1 squid channel's rate of trafficking to the surface (Liu et al. 2001) as well as Shaker B K+ channel protein half-life and surface levels (Khanna et al. 2001). These reports suggested that the glycosylation effect on function were channel dependent.
Possible role of glycosylation in ion channel function
Ion channels are expressed in brain as pore-forming homomers or heteromers and are often associated with auxiliary subunits. This gives a neuron a large combinatorial repertoire with which to form functional channels with different properties that will give it its characteristic excitability. Phosphorylation of channels may increase channel functional diversity further (Kaczmarek & Levitan, 1987). Our study suggested that N-glycosylation, and particularly sialylation, modified Kv1.1 function (see also Thornhill et al. 1996). Other reports have suggested this modification affected voltage-gated Na+ channel functional properties by a possible SP mechanism (Recio-Pinto et al. 1990; Bennett et al. 1997; Castillo et al. 1997). It also appeared that the skeletal muscle Na+ channel function was affected by sialic acids whereas cardiac Na+ channels, with sialic acids but at lower levels, were not, and this suggested that sialic acids played different roles in two Na+ channel isoforms (Bennett, 2002; but see also Zhang et al. 1999; Ufret-Vincenty et al. 2001a). Thus the role of glycosylation in channel function may not be generalized to other ion channels but must be empirically determined. Nonetheless, these findings suggested that glycosylation, and particularly sialylation, modified gating of some ion channels. Furthermore, cells could use glycosylation, either in the number of sugar monomers on a tree or in their branching pattern, to increase channel diversity. Treatment of ventricular myocytes with sialidase increased the duration of the action potential waveform and the frequency of early after-depolarization and suggested that channel sialic acids affected function in a native tissue (Ufret-Vincenty et al. 2001b). Although the functional properties of ion channels are dictated by their unique primary sequence it appears that in some cases glycosylation can modify channel operation.
Acknowledgments
This research was supported by National Institutes of Health grant NS29633 (W.B.T.) and a Glycoscience award from the Mizutani Foundation (W.B.T.).
APPENDIX I

APPENDIX II

APPENDIX III

APPENDIX IV
In the ZHA-Q and ZHA-Q-elec models the rate constants were assumed to be exponentially dependent on voltage, and are given by:
where αo, βo, γo and δo are the values of the rate constants at 0 mV; Zα, Zβ, Zγ and Zδ are the equivalent charge movements up to the transition state for each transition; F is Faraday's constant; R is the universal gas constant; and T is the absolute temperature. The total charge moved for the first transition in each subunit is given by:
and the total charge moved for the second transition in each subunit is given by:
The ZHA-Q model then contains nine parameters for the transitions before first opening: αo, βo, γo,δo, Zα, Zβ, Zγ, Zδ and Q.
In the ZHA-Q-elec model interactions between subunits are assumed to occur by an electrostatic interaction (not related to the surface potential mechanism discussed in the text). This electrostatic interaction has been introduced by assuming a constant voltage offset per unit of gating charge moved (η); that is, only one additional parameter (η) is introduced in this model as compared with the ZHA-Q model. The factor by which each rate is affected is shown in the ZHA-Q-elec model were the x and y values are given by the expressions shown below. Also shown below are their numerical values when η= 4, the value required to obtain good simulations for both Kv1.1 and Kv1.1N207Q current traces:
 |
REFERENCES
- Adelman JP, Bond CT, Pessia M, Maylie J. Episodic ataxia results from voltage-dependent potassium channels with altered functions. Neuron. 1995;15:1449–1454. doi: 10.1016/0896-6273(95)90022-5. [DOI] [PubMed] [Google Scholar]
- Ashcroft FM. Ion Channels and Disease. New York: Academic Press; 2000. [Google Scholar]
- Begenisich T. The role of divalent cations in potassium channels. Trends Neurosci. 1988;11:270–273. doi: 10.1016/0166-2236(88)90109-9. [DOI] [PubMed] [Google Scholar]
- Bennett E. Isoform-specific effects of sialic acid on voltage-dependent Na+ channel gating: functional sialic acids are localized to the S5-S6 loop of domain I. J Physiol. 2002;538:675–690. doi: 10.1113/jphysiol.2001.013285. [DOI] [PMC free article] [PubMed] [Google Scholar]
- Bennett E, Urcan MS, Tinkle SS, Koszowski W, Levinson SR. Contribution of sialic acid to the voltage dependence of sodium channel gating: a possible electrostatic mechanism. J Gen Physiol. 1997;109:327–343. doi: 10.1085/jgp.109.3.327. [DOI] [PMC free article] [PubMed] [Google Scholar]
- Carchon H, Van Schaftingen E, Matthijs G, Jaeken J. Carbohydrate-deficient glycoprotein syndrome type IA (phosphomannomutase-deficiency) Biochim Biophys Acta. 1999;1455:155–165. doi: 10.1016/s0925-4439(99)00073-3. [DOI] [PubMed] [Google Scholar]
- Castillo C, Diaz ME, Balbi D, Thornhill WB, Recio-Pinto E. Changes in sodium channel function during postnatal brain development reflect increases in the level of channel sialidation. Dev Brain Res. 1997;104:119–130. doi: 10.1016/s0165-3806(97)00159-4. [DOI] [PubMed] [Google Scholar]
- Choi KL, Aldrich RW, Yellen G. Tetraethylammonium blockade distinguishes two inactivation mechanisms in voltage-activated K+ channels. Proc Natl Acad Sci U S A. 1991;88:5092–5095. doi: 10.1073/pnas.88.12.5092. [DOI] [PMC free article] [PubMed] [Google Scholar]
- Coetzee WA, Amarillo Y, Chiu J, Chow A, Lau D, McCormack T, Moreno H, Nadal MS, Ozaita A, Pountney D, Saganich M, de Vega-Saenz Miera E, Rudy B. Molecular diversity of K+ channels. Ann NY Acad Sci. 1999;86:233–285. doi: 10.1111/j.1749-6632.1999.tb11293.x. [DOI] [PubMed] [Google Scholar]
- Covarrubias M, Kopta C, Steinbach JH. Inhibitors of asparagine-linked oligosaccharide processing alter the kinetics of the nicotinic acetylcholine receptor. J Gen Physiol. 1989;93:765–783. doi: 10.1085/jgp.93.5.765. [DOI] [PMC free article] [PubMed] [Google Scholar]
- Deal KK, Lovinger DM, Tamkun MM. The brain Kv1. 1 potassium channel: in vitro and in vivo studies on subunit assembly and posttranslational processing. J Neurosci. 1994;14:1666–1676. doi: 10.1523/JNEUROSCI.14-03-01666.1994. [DOI] [PMC free article] [PubMed] [Google Scholar]
- Elinder F, Madeja M, Arhem A. Surface charge on K+ channels: Effects of strontium on five cloned channels expressed in Xenopus oocytes. J Gen Physiol. 1996;108:325–332. doi: 10.1085/jgp.108.4.325. [DOI] [PMC free article] [PubMed] [Google Scholar]
- Frankenhaeuser B, Hodgkin AL. The action of calcium on the electrical properties of squid axons. J Physiol. 1957;137:218–244. doi: 10.1113/jphysiol.1957.sp005808. [DOI] [PMC free article] [PubMed] [Google Scholar]
- Freeman LC, Lippold JJ, Mitchell KE. Glycosylation influences gating and pH sensitivity of Isk. J Membr Biol. 2000;177:65–79. doi: 10.1007/s002320001100. [DOI] [PubMed] [Google Scholar]
- Gurnett CA, De Waard M, Campbell KP. Dual function of the voltage-dependent Ca channel alpha2/gamma subunit in current stimulation and subunit interaction. Neuron. 1996;16:431–440. doi: 10.1016/s0896-6273(00)80061-6. [DOI] [PubMed] [Google Scholar]
- Grissmer S, Cahalan M. TEA prevents inactivation while blocking open K+ channels in human T lymphocytes. Biophys J. 1989;55:203–206. doi: 10.1016/S0006-3495(89)82793-6. [DOI] [PMC free article] [PubMed] [Google Scholar]
- Hamill OP, Marty A, Neher E, Sakman B, Sigworth FJ. Improved patch-clamp techniques for high resolution current recording from cells and cell-free membrane patches. Pflugers Arch. 1981;391:85–100. doi: 10.1007/BF00656997. [DOI] [PubMed] [Google Scholar]
- Helms LM, Feliz JP, Bugianesi RM, Garcia ML, Stevens S, Leonard RJ, Knaus HG, Koch R, Wanner SG, Kaczorowski GJ, Slaughter RS. Margatoxin binds to a homomultimer of Kv1. 3 channels in Jurkat cells. Comparison with Kv1.3 expressed in CHO cells. Biochemistry. 1997;36:3737–3744. doi: 10.1021/bi962351p. [DOI] [PubMed] [Google Scholar]
- Hille B. Ionic Channels of Excitable Membranes. 3. Sunderland, MA, USA: Sinauer; 2001. [Google Scholar]
- Hodkgin AL, Huxley AF. A quantitative description of membrane current and its application to conduction and excitation in nerve. J Physiol. 1952;117:500–544. doi: 10.1113/jphysiol.1952.sp004764. [DOI] [PMC free article] [PubMed] [Google Scholar]
- Hoshi T, Zagatta WN, Aldrich RW. Two types of inactivation in Shaker K+ channels: effects of alterations in the carboxy-terminal region. Neuron. 1991;7:547–556. doi: 10.1016/0896-6273(91)90367-9. [DOI] [PubMed] [Google Scholar]
- Hoshi T, Zagotta WN, Aldrich RW. Shaker potassium channel gating I: transitions near the open state. J Gen Physiol. 1994;103:249–278. doi: 10.1085/jgp.103.2.249. [DOI] [PMC free article] [PubMed] [Google Scholar]
- Ivanina T, Perez T, Thornhill WB, Levin G, Dascal N, Lotan I. Phosphorylation of RCK1 K channels expressed in Xenopus oocytes by protein kinase A. Biochemistry. 1994;33:8786–8792. doi: 10.1021/bi00195a021. [DOI] [PubMed] [Google Scholar]
- Jaeken J, Stibler H, Hagberg B. The carbohydrate-deficient glycoprotein syndrome. A new inherited multisystemic disease with severe nervous system involvement. Acta Paediatr Scand. 1991;375:1–71. [PubMed] [Google Scholar]
- Jan LY, Jan YN. Cloned potassium channels from eukaryotes and prokaryotes. Ann Rev Neurosci. 1997;20:91–123. doi: 10.1146/annurev.neuro.20.1.91. [DOI] [PubMed] [Google Scholar]
- Kaczmarek LK, Levitan IB. Neuromodulation: The Biochemical Control of Neuronal Excitability. New York: Oxford University Press; 1987. [Google Scholar]
- Khanna R, Myers MP, Laine M, Papazian DM. Glycosylation increases potassium channel stability and surface expression in mammalian cells. J Biol Chem. 2001;276:34028–34034. doi: 10.1074/jbc.M105248200. [DOI] [PubMed] [Google Scholar]
- Koren G, Liman ER, Logothetis DE, Nadal-Ginard B, Hess P. Gating mechanism of a cloned K channel expressed in frog oocytes and mammalian cell. Neuron. 1990;2:39–51. doi: 10.1016/0896-6273(90)90442-i. [DOI] [PubMed] [Google Scholar]
- Kornfeld R, Kornfeld S. Assembly of asparagine-linked oligosaccharides. Ann Rev Biochem. 1985;54:631–664. doi: 10.1146/annurev.bi.54.070185.003215. [DOI] [PubMed] [Google Scholar]
- Latorre R, Labarca P, Naranjo D. Surface charge effects on ion conduction in ion channels. Methods Enzy. 1992;207:471–501. doi: 10.1016/0076-6879(92)07034-l. [DOI] [PubMed] [Google Scholar]
- Ledwell JL, Aldrich RW. Mutations in the S4 region isolate the final voltage-dependent cooperative step in potassium channel activation. J Gen Physiol. 1999;113:389–414. doi: 10.1085/jgp.113.3.389. [DOI] [PMC free article] [PubMed] [Google Scholar]
- Lennarz W. Overview: role of intracellular membrane systems in glycosylation of proteins. Methods Enzymol. 1983;98:91–97. doi: 10.1016/0076-6879(83)98142-9. [DOI] [PubMed] [Google Scholar]
- Liu Y, Jurman ME, Yellen G. Dynamic rearrangement of the outer mouth of a K+ channel during gating. Neuron. 1996;16:859–867. doi: 10.1016/s0896-6273(00)80106-3. [DOI] [PubMed] [Google Scholar]
- Liu TI, Lebaric ZN, Rosenthal JJC, Gilly WF. Natural substitutions at highly conserved T1-domain residues perturb processing and functional expression of squid Kv1 channels. J Neurophysiol. 2001;85:61–71. doi: 10.1152/jn.2001.85.1.61. [DOI] [PubMed] [Google Scholar]
- Pabon A, Chan KW, Sui JL, Wu X, Logothetis DE, Thornhill WB. Glycosylation of GIRK1 at N119 and ROMK1 at N117 have different consequences in potassium channel function. J Biol Chem. 2000;275:30677–30682. doi: 10.1074/jbc.M005338200. [DOI] [PubMed] [Google Scholar]
- Panyi G, Sheng Z, Deutsch C. C-type inactivation of a voltage-gated K+ channel occurs by a cooperative mechanism. Biophys J. 1995;69:896–903. doi: 10.1016/S0006-3495(95)79963-5. [DOI] [PMC free article] [PubMed] [Google Scholar]
- Petrecca K, Atanasiu R, Akhavan A, Shrier A. N-linked glycosylation sites determine HERG channel surface membrane expression. J Physiol. 1999;515:41–48. doi: 10.1111/j.1469-7793.1999.041ad.x. [DOI] [PMC free article] [PubMed] [Google Scholar]
- Qin FA, Auerbach A, Sachs F. Estimating single channel kinetic parameters from idealized patch clamp data containing missing events. Biophys J. 1996;70:264–280. doi: 10.1016/S0006-3495(96)79568-1. [DOI] [PMC free article] [PubMed] [Google Scholar]
- Qin F, Auerback A, Sachs F. Maximum likelihood estimation of aggregated Markov processes. Proc R Soc Lond B. 1997;264:375–383. doi: 10.1098/rspb.1997.0054. [DOI] [PMC free article] [PubMed] [Google Scholar]
- Recio-Pinto E, Thornhill WB, Duch DS, Levinson SR, Urban BW. Neuraminidase treatment modifies the function of electroplax sodium channels in planar lipid bilayers. Neuron. 1990;5:675–684. doi: 10.1016/0896-6273(90)90221-z. [DOI] [PubMed] [Google Scholar]
- Rudy B. Diversity and ubiquity of K channels. Neuroscience. 1988;25:729–750. doi: 10.1016/0306-4522(88)90033-4. [DOI] [PubMed] [Google Scholar]
- Santacruz-Toloza L, Huang Y, John SA, Papazian DM. Glycosylation of Shaker potassium channel protein in insect cell culture and in Xenopus oocytes. Biochemistry. 1994;33:5607–5613. doi: 10.1021/bi00184a033. [DOI] [PubMed] [Google Scholar]
- Schoppa NE, Sigworth FJ. Activation of Shaker potassium channels. I. Characterization of voltage-dependent transitions. J Gen Physiol. 1998a;111:271–294. doi: 10.1085/jgp.111.2.271. [DOI] [PMC free article] [PubMed] [Google Scholar]
- Schoppa NE, Sigworth FJ. Activation of Shaker potassium channels. II. Kinetics of the V2 mutant channel. J Gen Physiol. 1998b;111:295–311. doi: 10.1085/jgp.111.2.295. [DOI] [PMC free article] [PubMed] [Google Scholar]
- Schoppa NE, Sigworth FJ. Activation of Shaker potassium channels. III. An activation gating model for wild type and V2 mutant channles. J Gen Physiol. 1998c;111:312–342. doi: 10.1085/jgp.111.2.313. [DOI] [PMC free article] [PubMed] [Google Scholar]
- Schwalbe RA, Wang Z, Wiblew BA, Brown AM. Potassium channel structure and function as reported by a single glycosylation sequon. J Biol Chem. 1995;270:15336–15340. doi: 10.1074/jbc.270.25.15336. [DOI] [PubMed] [Google Scholar]
- Scott VES, Muniz ZM, Sewing S, Lichtinghagen R, Parcej DN, Pongs O, Dolly JO. Antibodies specific for distinct Kv subunits unveil a heterooligomeric basis for subtypes of alpha-dendrotoxin-sensitive K+ channels in bovine brain. Biochemistry. 1994;33:1617–1623. doi: 10.1021/bi00173a001. [DOI] [PubMed] [Google Scholar]
- Shamotienko O, Akhtar S, Sidera C, Meunier FA, Ink B, Weir M, Dolly JO. Recreation of neuronal Kv1 channel oligomers by expression in mammalian cells using Semliki Forest virus. Biochemistry. 1999;38:16766–16776. doi: 10.1021/bi991039n. [DOI] [PubMed] [Google Scholar]
- Smart SL, Lopantsev V, Zhang CL, Robbins CA, Wang H, Chiu SY, Schwartzkroin PA, Messing A, Tempel BL. Deletion of the Kv1. 1 potassium channel causes epilepsy in mice. Neuron. 1998;20:809–819. doi: 10.1016/s0896-6273(00)81018-1. [DOI] [PubMed] [Google Scholar]
- Stanley P. Biochemical characterization of animal cell glycosylation mutants. Methods Enzymol. 1987;138:443–457. doi: 10.1016/0076-6879(87)38038-3. [DOI] [PubMed] [Google Scholar]
- Stuhmer W, Ruppersberg JP, Schruer KH, Sakmann B, Stocker M, Giese KP, Perschke A, Baumann A, Pongs O. Molecular basis of functional diversity of voltage-gated potassium channels in mammalian brain. EMBO J. 1989;8:3235–3244. doi: 10.1002/j.1460-2075.1989.tb08483.x. [DOI] [PMC free article] [PubMed] [Google Scholar]
- Thornhill WB, Wu MB, Jiang X, Wu X, Morgan P, Margiotta JF. Expression of Kv1. 1 delayed-rectifier potassium channels in Lec mutant CHO cell lines reveals a role for sialidation in channel function. J Biol Chem. 1996;271:19093–19098. doi: 10.1074/jbc.271.32.19093. [DOI] [PubMed] [Google Scholar]
- Ufret-Vincenty CA, Baro DJ, Lederer EJ, Rockman HA, Quinones LE, Santana LF. Role of sodium channel deglycosylation in the genesis of cardiac arrhythmias in heart failure. J Biol Chem. 2001a;276:28197–28203. doi: 10.1074/jbc.M102548200. [DOI] [PubMed] [Google Scholar]
- Ufret-Vincenty CA, Baro DJ, Santana LF. Differential contribution of sialic acid to the function of repolarizing K+ currents in ventricular myocytes. Am J Physiol Cell Physiol. 2001b;281:C462–474. doi: 10.1152/ajpcell.2001.281.2.C464. [DOI] [PubMed] [Google Scholar]
- Wang H, Kunkel DD, Martin TM, Schwartzkroin PR, Tempel B. Heteromultimeric K channels in terminal and juxtaparanodal regions of neurons. Nature. 1993;365:75–79. doi: 10.1038/365075a0. [DOI] [PubMed] [Google Scholar]
- Wang H, Kunkel DD, Schwartzkroin PA, Tempel B. Localization of Kv1. 1 and Kv1.2, two K channel proteins, to synaptic terminals, somata, and dendrites in the mouse brain. J Neurosci. 1994;14:4588–4599. doi: 10.1523/JNEUROSCI.14-08-04588.1994. [DOI] [PMC free article] [PubMed] [Google Scholar]
- Yellen G, Sodickson D, Chen TY, Jurman ME. An engineered cysteine in the external mouth of a K+ channel allows inactivation to be modulated by metal binding. Biophys J. 1994;66:1068–1075. doi: 10.1016/S0006-3495(94)80888-4. [DOI] [PMC free article] [PubMed] [Google Scholar]
- Zhang Y, Hartmann HA, Satin J. Glycosylation influences voltage-dependent gating of cardiac and skeletal muscle sodium channels. J Memb Biol. 1999;171:195–207. doi: 10.1007/s002329900571. [DOI] [PubMed] [Google Scholar]
- Zagotta WN, Hoshi T, Aldrich RW. Shaker K channel gating III: Evalution of kinetic model for activation. J Gen Physiol. 1994a;103:321–362. doi: 10.1085/jgp.103.2.321. [DOI] [PMC free article] [PubMed] [Google Scholar]
- Zagotta WN, Hoshi T, Dittman J, Aldrich RW. Shaker K channel gating II: Transitions in the activation pathway. J Gen Physiol. 1994b;103:279–319. doi: 10.1085/jgp.103.2.279. [DOI] [PMC free article] [PubMed] [Google Scholar]
- Zhu J, Wanatabe I, Gomez B, Thornhill WB. Determinants involved in Kv1 potassium channel folding in the endoplasmic reticulum, glycosylation in the Golgi, and cell surface expression. J Biol Chem. 2001;276:39419–39427. doi: 10.1074/jbc.M107399200. [DOI] [PubMed] [Google Scholar]