

Abstract
Lucifer Yellow CH (LY), a membrane-impermeant fluorescent dye, has been used in electrophysiological studies to visualize cell morphology, with little concern about its pharmacological effects. We investigated its effects on TTX-sensitive voltage-gated Na+ channels in mouse taste bud cells and hippocampal neurons under voltage-clamp conditions. LY applied inside cells irreversibly slowed the inactivation of Na+ currents upon exposure to light of usual intensities. The inactivation time constant of Na+ currents elicited by a depolarization to −15 mV was increased by fourfold after a 5 min exposure to halogen light of 3200 lx at source (3200 lx light), and sevenfold after a 1-min exposure to 12 000 lx light. A fraction of the Na+ current became non-inactivating following the exposure. The non-inactivating current was ≈ 20 % of the peak total Na+ current after a 5 min exposure to 3200 lx light, and ≈ 30 % after a 1 min exposure to 12 000 lx light. Light-exposed LY shifted slightly the current-voltage relationship of the peak Na+ current and of the steady-state inactivation curve, in the depolarizing direction. A similar light-dependent decrease in kinetics occurred in whole-cell Na+ currents of cultured mouse hippocampal neurones. Single-channel recordings showed that exposure to 6500 lx light for 3 min increased the mean open time of Na+ channels from 1.4 ms to 2.4 ms without changing the elementary conductance. The pre-incubation of taste bud cells with 1 mM dithiothreitol, a scavenger of radical species, blocked these LY effects. These results suggest that light-exposed LY yields radical species that modify Na+ channels.
Lucifer Yellow CH (LY) is a membrane-impermeant, fluorescent dye. Once introduced into a cell, LY diffuses throughout the entire intracellular space and allows fluorescent visualization of the outline of the cell (Fig. 1). Therefore, electrophysiologists have added LY to electrode solutions to mark recorded cells as well as to study their morphology. Since early electrophysiological studies involved the use of high-resistant microelectrodes that released only small amounts of LY, little attention was paid to the pharmacology and effects of this dye. However, in whole-cell patch-clamp experiments, where the electrode solution readily dialyses the cell (Hamill et al. 1981), the effect of LY could not be negated.
Figure 1. Fluorescence photomicrograph of a branched taste bud cell (A), a cultured hippocampal neuron (B) and voltage-gated Na+ currents of a taste bud cell (C).

A, a branched cell, a subset of the taste bud cells, filled with LY, pulled from a taste bud by withdrawing the electrode, shedding ambiguous fluorescence above the cell body after electrophysiological recordings. Note that this is not the cell eliciting currents shown in C. B, a LY-filled cultured hippocampal neuron. C, the membrane potential was depolarized from a holding potential of −70 mV to −15 mV in dark conditions (dark), after exposure to 3200 lx light for 300 s (light), and then in the presence of 1 μM TTX on its basolateral membrane (light + 1 μM TTX).
While investigating taste bud cells with an in situ whole-cell patch-clamp technique (Furue & Yoshii 1997, 1998), we found that LY modulates voltage-gated Na+ currents during illumination. Previously demonstrated modulators of voltage-gated Na+ channels have comprised animal toxins. For example, sea anemone toxins (Narahashi et al. 1969) and α-scorpion toxins (Koppenhofer & Schmidt 1968a, b) block the inactivation. Class 2 β-scorpion toxins shift the activation-voltage relationship in the hyperpolarizing direction without slowing the inactivation kinetics (Cahalan, 1975). Class 3 β-scorpion toxins shift both the activation and inactivation curves in the hyperpolarizing direction (Vijverberg et al. 1984). Sea anemone toxins and α-scorpion toxins are bound to site 3, in contrast to β-scorpion toxins, which bind to site 4 (Catterall, 1992). In contrast to the action of these toxins, the modulation by LY occurred only in the presence of light.
Here, we show that LY exposed to light inside cells increases the inactivation time constant of voltage-gated Na+ currents, shifts the voltage dependence of steady-state inactivation in the depolarizing direction and increases the mean open time of elementary Na+ currents in a light-dependent manner. A preliminary report of these observations has been presented elsewhere (Higure et al. 2001).
METHODS
Taste bud cells
Tongue epithelia containing taste bud cells were prepared as described previously (Furue & Yoshii 1997, 1998; Ohtubo et al. 2001). All experimental protocols were conducted in compliance with the Guiding Principles for the Care and Use of Animals in the Field of Physiological Sciences approved by the council of the Physiological Society of Japan. In brief, 5-week-old ddY-strain mice were anaesthetized with ether, decapitated, and their tongues rapidly removed. The tongues were injected subcutaneously with collagenase, and after ≈ 3 min the epithelia were peeled, with taste buds intact. The peeled epithelium was then mounted on a recording platform with the taste pore side down and placed under a differential interference contrast microscope equipped with a × 60 water-immersion objective.
Hippocampalneurons
Mouse hippocampal neurons were also prepared as described previously (Furue & Yoshii, 1997; Noguchi et al. 1999). In brief, we took fetuses (16 day gestation) from ddY-strain mice anaesthetized with ether and decapitated. We decapitated these fetuses, isolated their hippocampal neurons, plated these on coverslips in 60 mm dishes (1.8 × 10⁴ cells cm−2), and cultured them with Eagle's minimal essential medium supplemented with 5 % heat-inactivated newborn bovine and horse serum for the 1st day, and then with B18, a serum-free medium (Brewer & Cotman, 1989) for ≈ 10 days until use. We chose neurons with short neurites to achieve better voltage-clamp conditions and rapid diffusion with LY.
Whole-cell current recordings
Voltage-gated Na+ currents of taste bud cells were investigated by in situ tight-seal whole-cell clamping (Furue & Yoshii 1997, 1998). We recorded voltage-clamp currents with an amplifier (Axopatch 200B, Axon Instruments, Union City, CA, USA) filtered at 10 kHz, digitized with an analog-to-digital converter (Digidata 1200, Axon Instruments), and stored using pCLAMP data acquisition software (version 6.0.4, Axon Instruments) on a personal computer. Voltage-gated Na+ currents of hippocampal neurons were processed similarly.
In whole-cell recordings, we filled patch pipettes (≈ 5 MΩ) with a Cs-Cl electrode solution supplemented with 4.2 mM LY, unless otherwise noted. We neglected the liquid junction potential of ≈−7 mV. During experiments, we irrigated the receptor and basolateral membranes of taste bud cells and hippocampal cultures with a physiological saline solution.
Single-channel recordings
We prepared outside-out patch membranes from cultured mouse hippocampal neurons, and recorded elementary currents of voltage-gated Na+ channels with the same method described previously (Noguchi et al. 1999). In brief, we obtained an outside-out configuration with Sylgard-coated, fire-polished electrodes (≈ 20 MΩ), and recorded elementary currents with the same amplifier, high-pass filtered at 3 kHz. Currents were digitized and stored as described previously. In order to generate elementary Na+ currents, we held outside-out patch membranes at −80 mV and depolarized to −20 mV for 10 ms every 500 ms, 80 times. To minimize background noise, we subtracted ensemble averages of traces with no Na+ channel openings from each trace with openings, and then idealized and analysed subtracted traces with pCLAMP. The mean open times were estimated by fitting an exponential decay of openings.
Illumination
We epi-illuminated taste bud cells through a dichroic mirror unit (U-MWIG, Olympus, Tokyo, Japan) with a 100 W halogen lamp powered by a regulated DC power supply. The intensities of light used were 1500 lx, 3200 lx, 4800 lx, 8500 lx and 12 000 lx at the entrance of the dichroic mirror unit, and attenuated on the focal plane of the objective. On the focal plane of the inverted microscope, the light intensity was 6500 lx. For convenience, we referred to the intensity of light as, for example, 3200 lx light. The dichroic mirror unit reflected wavelengths between 400 nm and 440 nm, excited LY (λmax= 428 nm) through the × 60 water-immersion objective and transmitted fluorescence through a high-pass filter (> 475 nm) to a cooled CCD camera (C4742-95-12, Hamamatsu Photonics K.K.). Cultured hippocampal neurons were illuminated on an inverted microscope by 6500 lx light through a phase-contrast condenser.
Solutions
All solutions were prepared with deionized water and the components are expressed in millimolar concentrations, unless otherwise noted. Physiological saline comprised: 150 NaCl, 5 KCl, 2 CaCl2, 0.5 MgCl2, 10 glucose, 5 Hepes-NaOH, pH 7.4. The Cs-Cl electrode solution comprised: 120 CsCl, 15 NaCl, 5 MgCl2, 10 EGTA, 5 Na2ATP, 0.3 Na3GTP 10 Hepes-CsOH, pH 7.2. LY was added to the electrode solutions in the form of the dilithium salt. Dithiothreitol (DTT) was added to the physiological saline just before use. The collagenase solution comprised 0.4 % collagenase (Sigma type IA) dissolved in physiological saline solution.
Unless stated otherwise, the results are presented as means ± S.D.
RESULTS
Modification of Na+ currents
Since the fluorescence of LY inside taste bud cells reached a saturation level in 30 s after the onset of whole-cell recordings, we waited for several minutes before exposure to light. It was likely that the intracellular LY concentration was equal to the LY concentration of 4.2 mM in the Cs-Cl electrode solution at the saturation level. On exposure to light, the intracellular LY slowed the inactivation of voltage-gated Na+ currents of taste bud cells (Fig. 1). A small fraction of the Na+ currents lasted for more than 70 ms. The electrode solution of the LY-Li+ salt contained 8.4 mM Li+ as the counter ion of 4.2 mM LY, since LY is divalent. However, the replacement with 8.4 mM LiCl never slowed the inactivation (data not shown). These results show that light-exposed LY slows the inactivation and yields practically non-inactivating currents. The addition of 1 μM TTX to the basolateral membrane side of taste bud cells blocked both slowed transient currents and non-inactivating currents (Fig. 1).
The light-exposed LY shifted the current-voltage relationship of peak Na+ currents in the depolarizing direction by ≈ 10 mV (Fig. 2C). These results showed that light-exposed LY modified the voltage-dependent activation of voltage-gated Na+ channels as well as their inactivation, although we focused on the latter effect of LY in this study. On the other hand, the reversal potentials of Na+ currents obtained before light exposure was ≈ 47 mV and remained unchanged after the exposure. This value, typical after compensation with the liquid-junction potential of ≈−7 mV, matched the Na+ equilibrium potential of 44.0 mV calculated for the present conditions. These results indicate that light-exposed LY never changed the ion selectivity of Na+ channels.
Figure 2. Slowed inactivation of voltage-gated Na+ currents of taste bud cells caused by the exposure of LY inside cells to 3200 lx light.
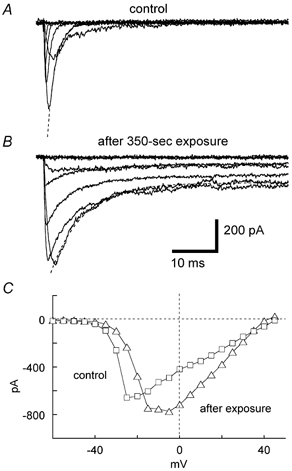
The membrane potential was depolarized from a holding potential of −70 mV to various levels ranging from −60 to +45 mV in 15 mV steps in dark conditions (A) and after the exposure to 3200 lx light for 350 s (B). Leak and capacitive currents were eliminated by subtracting their respective currents recorded in the presence of 1 μM TTX. Dotted lines in A and B show the sum of inactivating currents and non-inactivating currents estimated as described in the text. Scale bars apply to A and B. C, current-voltage relationship of peak Na+ currents recorded from the same cell, yielding the currents shown in A and B before (squares) and after the exposure to light (triangles).
Exposure of LY-injected cells to 3200 lx light for 350 s increased the magnitude of peak Na+ currents by a factor of 1.23 ± 0.19 (n = 3), although the increase was not significant (Student's two-tailed paired t test, P > 0.05). In contrast, exposure of cells to 12 000 lx light for 100 s decreased the magnitude of the maximum Na+ currents by a factor of 0.74 ± 0.21 (n = 4), a change that was also not significant (two-tailed paired t test, P > 0.05).
Inactivation time constant
Upon exposure of LY to light inside cells, the inactivation rate of inactivating Na+ currents decreased, and non-inactivating currents appeared (Fig. 2A and B). We assumed that the whole Na+ current (INa) was the sum of inactivating and non-inactivating currents, and that the magnitude of the inactivating current decreased with a single time constant (τ). In order to quantify this effect, we calculated these parameters as follows:
| (1) |
where ICt= 0 is inactivating current extrapolated to the onset of depolarization (t = 0), τ is the inactivation time constant of inactivating current and NIC is non-inactivating current.
This function was fitted to the INa obtained before and after the exposure (dotted lines in Fig. 2A and B) with correlation coefficients of higher than 0.98. The inactivation time constant estimated for control inactivating currents decreased upon depolarization (Fig. 3A). After the exposure, the inactivation time constant increased in the range of membrane potentials examined with a similar voltage dependence to the control.
Figure 3. Voltage dependence of inactivation time constant, τ (A) and non-inactivating currents (B).
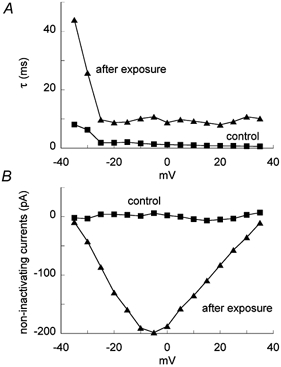
Squares, control; triangles, after 350 s exposure to 3200 lx light.
Non-inactivating currents occurred only after light exposure (Fig. 3B). They had a negative peak in a range from −15 to +5 mV. The extrapolation of the current-voltage relationship for non-inactivating currents showed a reversal potential of 38 mV that matched the Na+ equilibrium potential of 44 mV. In the following experiments, we took the inactivation time constant and non-inactivating currents at −15 mV as the measures of the effects of LY.
Light dependence
The inactivation time constant increased linearly with increasing exposure duration (Fig. 4A). The rate was 1.00 ms min−1 for exposure to 3200 lx light and 11.2 ms min−1 for exposure to 12 000 lx light. In order to estimate the rate for non-inactivating currents, we normalized the magnitude of each non-inactivating current relative to the respective peak total Na+ current. The magnitude of the normalized non-inactivating current also increased linearly with increasing exposure duration. The rate was 0.03 min−1 on exposure to 3200 lx light and 0.38 min−1 on exposure to 12 000 lx light (Fig. 4B). A 6 min exposure to 1500 lx light had no effect on the inactivation time constant nor on the normalized non-inactivating currents (data not shown).
Figure 4. Exposure dependence of the inactivation time constant, τ (A) and non-inactivating currents normalized relative to respective peak Na+ currents (B).
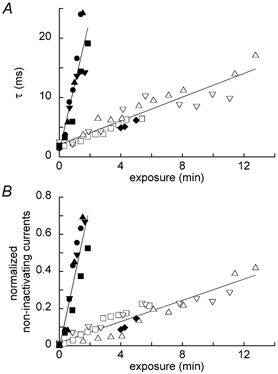
Currents were elicited by a test-pulse potential of −15 mV from a holding potential of −70 mV in this and subsequent figures, unless otherwise noted. Different symbols plot data obtained from different cells. Open symbols, exposure to 3200 lx light; filled symbols except for diamonds, exposure to 12 000 lx light. The leftmost filled diamond represents data obtained following a 4 min exposure to 3200 lx light, showing the inactivation time constant in A and normalized non-inactivating currents in B of the first Na+ channel opening after exposure to light. The subsequent filled diamonds show the second and third openings obtained from the same cell. Lines are the best fits to the data.
Although these results show that the LY effect depends on light, we intermittently exposed LY to 4800 lx light in order to confirm the light dependence (Fig. 5). During dark periods, both parameters remained unchanged. In contrast, both parameters increased during the subsequent light periods following the dark periods. These results showed that the LY effect depended on light and, in addition, that the effect was irreversible.
Figure 5.
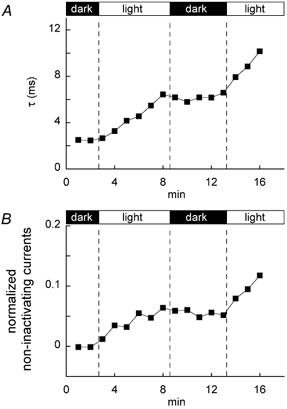
Inactivation time constant, τ (A), and non-inactivating currents normalized relative to the respective peak Na+ currents containing them (B), examined during intermittent exposure to 4800 lx light
Use independence
In order to clarify whether the LY effect required the opening of Na+ channels, we kept Na+ channels closed by voltage-clamping a taste bud cell at −70 mV for 4 min under 3200 lx light illumination, and then opened them with a depolarizing pulse to −15 mV. The inactivation time constant obtained from this first opening of Na+ channels was 4.5 ms (the leftmost filled diamond in Fig. 4A). This value is in agreement with the inactivation time constant obtained from periodically opened channels on different cells with a holding potential of −70 mV and a depolarizing pulse to −15 mV. Similarly, the normalized non-inactivating current level obtained from this first opening was 0.08, in agreement with that obtained from periodically opened channels on different cells (the leftmost filled diamond in Fig. 4B). Both the inactivation time constant and the normalized non-inactivating currents obtained from the second and third openings of Na+ channels on the same cell (the second and third filled diamond from left in Fig. 4) were also similar in magnitude to those obtained from periodically opened channels on different cells. These results show that light-exposed LY modifies closed channels. Its effect on open channels remained to be investigated.
Steady-state inactivation
Light-exposed LY modified the steady-state voltage dependence of the inactivation (Fig. 6). Increasing the duration of exposure to 4800 lx light slightly shifted the inactivation curve in the depolarizing direction. The exposure to 8500 lx light shifted the inactivation curve more effectively. On the other hand, the magnitude of normalized non-inactivating currents elicited by these exposures decreased slightly with increasing conditioning voltages. The 1 s pre-pulses more positive than −40 mV seemed to slightly inactivate the level of non-inactivating currents (Fig. 6), although depolarizations lasting for 70 ms never inactivated it (Fig. 1).
Figure 6. Shift of the voltage dependence of steady-state inactivation by the exposure to 4800 lx light (A) and 8500 lx light (B).

Taste bud cells were stepped from a holding potential of −70 mV to pre-pulse potentials for 1 s ranging in 5 mV steps from −90 mV to −20 mV, and then to a test-pulse potential of −20 mV for 40 ms. Pre-pulse intervals = 2 s. Open symbols plot inactivating currents (differences between peak Na+ currents and their non-inactivating components) normalized relative to inactivating currents elicited by the test pulse with a pre-pulse to −90 mV for each exposure. Filled symbols: non-inactivating currents normalized relative to respective peak Na+ currents obtained with a pre-pulse to −90 mV for each exposure. Squares, control; triangles, after a 3 min exposure; diamonds, after a 6 min exposure. Insets, Na+ currents elicited with a pre-pulse to −70 mV for the indicated exposure duration.
DTT block of LY effects
The most likely explanation for the light-dependent effects on the Na+ current inactivation was that they arose from photodynamic damage due to light-dependent generation of free radicals inside the cells. If this were the case, the intracellular application of free-radical scavengers would provide effective protection. In general, however, when free-radical scavengers were added to electrode solutions, the AgCl coating on the Ag wire placed inside recording electrodes was reduced, which resulted in distortion of the voltage-clamp conditions. Instead, we applied DTT (a water- and lipid-soluble scavenger) extracellularly. We dissolved 1 mM DTT in the physiological saline just before use, irrigated basolateral membranes with the DTT-containing saline 10 min before the application of LY, and examined the effect of LY during the irrigation with the DTT-containing saline. As expected, extracellular application of 1 mM DTT had no effect on voltage-clamp conditions, although when added to the Cs-Cl electrode solution, the same concentration of DTT distorted the voltage-clamp conditions by reducing the AgCl coating.
The application of 1 mM DTT decreased both the light-dependent increase of the inactivation time constant and non-inactivating current (Fig. 7). The addition of 1 mM DTT alone had no effect on either the inactivation time constant or non-inactivating current. The light exposure alone (in the absence of LY and DTT) also had no effect on them.
Figure 7. Blocking effect of 1 mM DTT on the light-exposed LY-induced increase in inactivation time constant (A) and non-inactivating currents normalized relative to respective peak Na+ currents containing them (B).
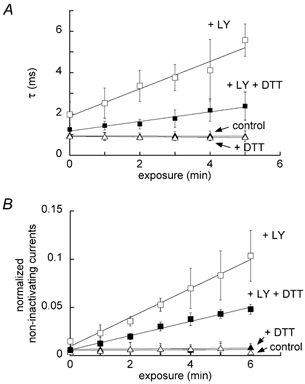
Each point indicates the mean ± S.D. (n = 3).
Hippocampal neurons
It is likely that the slowed inactivation was a result of the increase in mean open time of voltage-gated Na+ channels or from repetitive openings of voltage-gated Na+ channels. We investigated the effect of LY on the elementary Na+ channel currents of cultured hippocampal neurons, since they are more suitable for single-channel recordings than taste bud cells.
Before recording elementary currents, we tested the effect of light-exposed LY on whole-cell Na+ currents. Since the fluorescence of LY inside stomata reached a saturation level within 30 s after the onset of whole-cell clamping, we waited for 30 s before exposure to light. A 16 s exposure to 12 000 lx light of hippocampal neurones dialysed with 2.5 mM LY slowed the inactivation of voltage-gated Na+ currents and generated non-inactivating currents (Fig. 8A). We thus confirmed that light-exposed LY modified voltage-gated Na+ channels of hippocampal neurons as well as those of taste bud cells.
Figure 8. Slowed Na+ inactivation in cultured hippocampal neurones.

A, voltage-gated Na+ currents of neurones before and after a 16 s exposure of 2.5 mM LY to 12 000 lx light. B, exposure dependence of the inactivation time constant obtained with 1 mM LY and 6500 lx light. Each point indicates the mean ± S.D. (n = 3). C, voltage dependence of steady-state inactivation obtained with 1 mM LY and 6500 lx light. The experimental procedure is the same as that for Fig. 6. Squares, control; triangles, 3 min exposure; diamonds, 10 min exposure. Open symbols represent the inactivation time constant; filled symbols represent the normalized non-inactivating currents.
However, the above conditions injured the hippocampal neurons and interfered with the ability to maintain long-lasting recordings. We therefore decreased LY concentration to 1.0 mM and the light intensity to 6500 lx. The new conditions extended the lifetime of whole-cell recordings, and we confirmed that the inactivation time constant increased with increasing the duration of light exposure, although the relationship was different from that obtained from taste bud cells. The inactivation time constant of hippocampal neurons consisted of a rapidly increasing phase just after the onset of light exposure, which followed a linearly increasing phase (Fig. 8B), as observed in taste bud cells. However, this condition was less effective than the previous condition, and neither non-inactivating currents nor the shifts of inactivation curves occurred on light exposure for up to 10 min (Fig. 8C).
The new conditions elongated the lifetime of single-channel recordings. Since little non-inactivating current occurred in whole-cell recordings under these new conditions, elementary currents obtained under the same condition must represent LY-slowed inactivating, but not non-inactivating, currents.
The traces of elementary currents included overlapping elementary currents (insets of Fig. 9A and B), indicating that our outside-out patch membranes contained several channels. Therefore, we analysed only the open times from the parts of records containing no overlapping of elementary currents. A 3 min exposure to light increased the mean open time from 1.4 to 2.4 ms (Fig. 9A and B), and the number of openings decreased after the exposure. Although the vulnerability of hippocampal neurons to LY even under the new condition seemed to cause this decrease, the elimination of overlapping events derived from the increase in mean open time also decreased the number. A best-fit line to elementary currents obtained from a control patch membrane showed that the elementary conductance was 17 pS and the reversal potential was +49.6 mV (Fig. 9C). This line was also fitted to those obtained from the patch membrane after a 3 min exposure, showing that the elementary conductance remained unchanged.
Figure 9. Open times (A and B) and current-voltage relationships (C) of elementary Na+ currents from hippocampal neurones.

Insets in A and B, test pulse (top) and current traces filtered at 3 kHz bandwidth. C, open squares, control; filled squares, after a 3 min exposure to 6500 lx light. A line is fitted to the control elementary currents. Each point is a mean ± S.D. (n = 15).
DISCUSSION
The present results show that exposure of LY to light slows the inactivation of TTX-sensitive, voltage-gated Na+ currents. The effect occurred when LY inside cells was exposed to light at intensities similar to those used while visually guiding recording electrodes to target cells. Light-exposed LY even modified Na+ channels when they were in a closed state. Since these effects could produce misleading results, we advise shading target cells from light whenever using low-resistance recording electrodes containing LY at the concentrations used here.
The mechanisms underlying this light-excited LY slowing of the inactivation of TTX-sensitive, voltage-gated Na+ channels remain to be investigated. However, the present result showing that DTT antagonized the LY effect (Fig. 7) suggests that radical species elicited that effect. It is thus likely that light-excited LY produces LY radicals, and probably various radical species such as O2 radicals, and that these free radicals oxidize Na+ channels. Since cell membranes are impermeable to free radicals, any free radicals that are generated would remain inside cells and oxidize Na+ channels that are exposed to intracellular spaces. That is, radical species seem to oxidize the cytoplasmic loop-linking homologous repeat domains III and IV of Na+ channel proteins, since it has been shown that the modification of this region slows inactivation and prolongs channel open times (Vassilev et al. 1988, 1989; Stuhmer et al. 1989).
Light-exposed LY increased the inactivation time constant and the mean open time with increasing exposure duration. According to Hodgkin & Huxley (1952), the inactivation time constants (τh) and the voltage dependence of steady-state inactivation (hinfinite) of voltage-gated Na+ channels can be determined by using the following equations:
where αh and βh are rate constants of inactivation gates from closed to open states and the opposite direction, respectively.
In addition, the mean open time (τopen) of single Na+ channels is 1/βh. Since the present results showed that light-exposed LY increased the τh and hinfinite of hippocampal neurons and taste bud cells and increased the τopen of hippocampal neurons, we conclude that light-exposed LY decreased βh, and probably αh.
The inactivation time constant increased with increasing exposure duration (Fig. 4A and Fig. 8B). These results indicate that the open time of each Na+ channel increases during the exposure; less modified Na+ channels will yield shorter mean open times than those of much-modified channels. Therefore, a group of equally modified Na+ channels eliciting the largest fraction of Na+ currents supplies the inactivation time constant and the mean open time that we measured. Further studies will reveal the relationships between the gating and modification of Na+ channels.
Although for convenience we classified Na+ currents into inactivating and non-inactivating currents, a continuum of modified Na+ channels seems to elicit them. The exposure of 1 mM LY to 6500 lx light failed to elicit non-inactivating currents in hippocampal neurons, although the inactivation time constant increased under these conditions. These results suggest that progressive modifications are required to elicit non-inactivating currents.
Since the fluorescence of Fluo-3 and Fura-red elicited and enhanced a TTX-sensitive, persistent Na+ current (Somjen, 1999,2000), one might conclude that the fluorescence of LY also elicits persistent Na+ currents rather than slowed Na+ inactivation. However, this is not the case, because, the magnitude of the non-inactivating current increased, even when peak Na+ currents decreased in magnitude. If the fluorescence of LY generated persistent currents, the magnitude of the peak Na+ currents should increase, since it is the sum of the inactivating Na+ currents and any newly generated persistent current. We thus conclude that light-exposed LY slowed inactivating Na+ currents rather than newly generated persistent Na+ currents.
The inactivation time constant of taste bud cells increased linearly with increasing light-exposure duration (Fig. 4A). In contrast, that of hippocampal neurons consisted of a rapidly increasing phase just after the onset of exposure, followed by the linearly increasing phase (Fig. 8B) that was also observed in taste bud cells. These results suggest that Na+ channels of hippocampal neurons differ from those of taste buds in their sensitivity to light-exposed LY. The difference may arise because hippocampal neurons have multiple voltage-gated Na+ channel subtypes that are classified by the amino acids sequences of their α or β subunits (Goldin et al. 2000; Vijayaragavan et al. 2001). Alternatively, the difference may arise from the complex morphology of cultured hippocampal neurons. That is, the rapidly increasing phase of the inactivation time constant lasting for ≈ 30 s may occur in somata where the LY concentration was already in equilibrium with that in the Cs-Cl electrode solution. The subsequent linearly increasing phase may occur in neurites where the LY concentration is still increasing.
We predicted that the increase in the mean open time of Na+ channels should produce an increase in the magnitude of peak Na+ currents. However, the exposure to 12 000 lx light failed to increase the magnitude of peak Na+ currents, and that to 3200 lx light produced only a tendency towards an increase (not statistically significant), although both exposures slowed the inactivation. These results suggest that light-exposed LY injures Na+ channels in addition to slowing inactivation. The synthesis of LY analogues that have no injurious effects would provide effective tools for studying the gating mechanisms of Na+ channels.
Acknowledgments
The authors are grateful to Drs OHUCHI Shokichi and NIKAWA Junichi of Kyushu Institute of Technology for introductions to free-radical chemistry. This work was supported by a Grant-in-Aid for Scientific Research (12640666) from The Ministry of Education, Science, Sports and Culture of Japan.
REFERENCES
- Brewer GJ, Cotman CW. Survival and growth of hippocampal neurones in defined medium at low density: advantages of a sandwich culture technique or low oxygen. Brain Res. 1989;494:65–74. doi: 10.1016/0006-8993(89)90144-3. [DOI] [PubMed] [Google Scholar]
- Cahalan MD. Modification of sodium channel gating in frog myelinated nerve fibres by Centruroides sculpturatus scorpion venom. J Physiol. 1975;244:511–534. doi: 10.1113/jphysiol.1975.sp010810. [DOI] [PMC free article] [PubMed] [Google Scholar]
- Catterall WA. Cellular and molecular biology of voltage-gated sodium channels. Physiol Rev. 1992;72:S15–48. doi: 10.1152/physrev.1992.72.suppl_4.S15. [DOI] [PubMed] [Google Scholar]
- Furue H, Yoshii K. In situ tight-seal recordings of taste substance-elicited action currents and voltage-gated Ba currents from single taste bud cells in the peeled epithelium of mouse tongue. Brain Res. 1997;776:133–139. doi: 10.1016/s0006-8993(97)00974-8. [DOI] [PubMed] [Google Scholar]
- Furue H, Yoshii K. A method for in-situ tight-seal recordings from single taste bud cells of mice. J Neurosci Methods. 1998;84:109–114. doi: 10.1016/s0165-0270(98)00104-6. [DOI] [PubMed] [Google Scholar]
- Goldin AL, Barchi RL, Caldwell JH, Hofmann F, Howe JR, Hunter JC, Kallen RG, Mandel G, Meisler MH, Netter YB, Noda M, Tamkun MM, Waxman SG, Wood JN, Catterall WA. Nomenclature of voltage-gated sodium channels. Neuron. 2000;28:365–368. doi: 10.1016/s0896-6273(00)00116-1. [DOI] [PubMed] [Google Scholar]
- Hamill OP, Marty A, Neher E, Sakmann B, Sigworth FJ. Improved patch-clamp techniques for high-resolution current recording from cells and cell-free membrane patches. Pflugers Arch. 1981;391:85–100. doi: 10.1007/BF00656997. [DOI] [PubMed] [Google Scholar]
- Higure Y, Katayama Y, Ohtubo Y, Fueta Y, Yoshii K. Lucifer yellow inhibited the inactivation process of voltage-gated sodium currents. Soc Neurosci Abstr. 2001;27:287. [Google Scholar]
- Hodgkin AL, Huxley AF. A quantitative description of membrane current and its application to conduction and excitation in nerve. J Physiol. 1952;117:500–544. doi: 10.1113/jphysiol.1952.sp004764. [DOI] [PMC free article] [PubMed] [Google Scholar]
- Koppenhofer E, Schmidt H. Die Wirkung von Skorpiongift auf die Ionenstrome des Ranvierschen Schnurrings. I. Die Permeabilitaten PNa und PK. Pflugers Arch. 1968a;303:133–149. doi: 10.1007/BF00592631. [DOI] [PubMed] [Google Scholar]
- Koppenhofer E, Schmidt H. Die Wirkung von Skorpiongift auf die Ionenstrome des Ranvierschen Schnurrings. II. Unvollstandiage Natrium-Inaktivierung. Pflugers Arch. 1968b;303:150–161. doi: 10.1007/BF00592632. [DOI] [PubMed] [Google Scholar]
- Narahashi T, Moore JW, Shapiro BI. Condylactis toxin: interaction with nerve membrane ionic conductances. Science. 1969;163:680–681. doi: 10.1126/science.163.3868.680. [DOI] [PubMed] [Google Scholar]
- Noguchi T, Ishii K, Ohtubo Y, Shuto S, Ono S, Matsuda A, Yoshii K. Open channel block of NMDA receptors by conformationally restricted analogs of milnacipran and their protective effect against NMDA-induced neurotoxicity. Synapse. 1999;31:87–96. doi: 10.1002/(SICI)1098-2396(199902)31:2<87::AID-SYN1>3.0.CO;2-H. [DOI] [PubMed] [Google Scholar]
- Ohtubo Y, Suemitsu T, Shiobara S, Matsumoto T, Kumazawa T, Yoshii K. Optical recordings of taste responses from fungiform papillae of mouse in situ. J Physiol. 2001;530:287–293. doi: 10.1111/j.1469-7793.2001.0287l.x. [DOI] [PMC free article] [PubMed] [Google Scholar]
- Somjen GG. Low external NaCl concentration and low osmolarity enhance voltage-gated Ca currents but depress K currents in freshly isolated rat hippocampal neurons. Brain Res. 1999;851:189–197. doi: 10.1016/s0006-8993(99)02185-x. [DOI] [PubMed] [Google Scholar]
- Somjen GG. Enhancement of persistent sodium current by internal fluorescence in isolated hippocampal neurons. Brain Res. 2000;885:94–101. doi: 10.1016/s0006-8993(00)02947-4. [DOI] [PubMed] [Google Scholar]
- Stuhmer W, Conti F, Suzuki H, Wang XD, Noda M, Yahagi N, Kubo H, Numa S. Structural parts involved in activation and inactivation of the sodium channel. Nature. 1989;339:597–603. doi: 10.1038/339597a0. [DOI] [PubMed] [Google Scholar]
- Vassilev PM, Scheuer T, Catterall WA. Identification of an intracellular peptide segment involved in sodium channel inactivation. Science. 1988;241:1658–1661. doi: 10.1126/science.241.4873.1658. [DOI] [PubMed] [Google Scholar]
- Vassilev P, Scheuer T, Catterall WA. Inhibition of inactivation of single sodium channels by a site-directed antibody. Proc Natl Acad Sci U S A. 1989;86:8147–8151. doi: 10.1073/pnas.86.20.8147. [DOI] [PMC free article] [PubMed] [Google Scholar]
- Vijayaragavan K, O'Leary ME, Chahine M. Gating properties of Na(v)1. 7 and Na(v)1.8 peripheral nerve sodium channels. J Neurosci. 2001;21:7909–7918. doi: 10.1523/JNEUROSCI.21-20-07909.2001. [DOI] [PMC free article] [PubMed] [Google Scholar]
- Vijverberg HP, Pauron D, Lazdunski M. The effect of Tityus serrulatus scorpion toxin gamma on Na channels in neuroblastoma cells. Pflugers Arch. 1984;401:297–303. doi: 10.1007/BF00582600. [DOI] [PubMed] [Google Scholar]