

Abstract
At physiological pH, negatively charged glycosaminoglycans in the extracellular matrix may influence distribution volume of a probe. We hypothesized that by varying the probe charge we would be able to observe a graded response of available volume fraction. Human serum albumin (HSA) (isoelectric point (pI) 5.0) was made more positive by cationization. Using reaction times of 10, 45 and 60 min, cationized HSA (cHSA) with respective pIs of 6.5, 7.3 and 8.0 were made. After eight days of equilibration in a buffer containing labelled native HSA and cHSA, the distribution volumes were calculated relative to that of 51Cr-EDTA, an extracellular tracer. The available volume in fully swollen dermis for native albumin relative to that of the extracellular tracer averaged 0.485 ± 0.008 (n = 49), with corresponding volumes for cHSA-10 min, cHSA-45 min and cHSA-60 min of 0.554 ± 0.012 (n = 17), 0.647 ± 0.026 (n = 17) and 0.718 ± 0.021 (n = 12), respectively. Increasing the ionic strength of the bathing solution to 1 M NaCl, thereby screening the fixed charges of tissue elements and probes alike, resulted in similar available and thereby excluded volumes of native HSA and neutral cHSA-45 min. These experiments suggest that fixed negative charges, most likely glycosaminoglycans, contribute significantly to interstitial exclusion of charged macromolecules, a phenomenon of importance for hydration of the interstitial fluid phase and therefore for body fluid balance. Moreover, the data indicate that previous findings of similar excluded volumes for the two differently sized major plasma proteins albumin (molecular mass 66 kDa) and IgG (molecular mass 160 kDa) may be explained by a more pronounced electrostatic repulsion of the former by the extracellular matrix.
In the interstitium, defined as the space located between the capillary walls and the cells, the presence of substances such as collagen and glycosaminoglycans (GAGs) limit the space available for plasma proteins and other macromolecules simply due to the fact that two materials cannot occupy the same space at the same time. This is called volume exclusion (Bert & Pearce, 1984). As a consequence of such exclusion, the concentration of the plasma proteins in the accessible space is higher than that calculated from tissue protein mass and total interstitial fluid volume. Interstitial exclusion is thus of importance for interstitial fluid balance, but this phenomenon also influences plasma volume regulation in situations with fluid volume perturbations (Aukland & Reed, 1993). Furthermore, the study of exclusion phenomena may tell us about the structural organization of the interstitium since the distribution of a specific probe in the interstitial fluid is determined in part by both its size and charge (Bert & Pearce, 1984; Aukland & Reed, 1993) as well as by the composition of the tissue, i.e. by the quantity and organization of structural components such as collagen and hyaluronan (Wiig et al. 2000).
Due to the wide variation in previous albumin exclusion results, we developed an alternative method for in vivo exclusion determination based on establishing steady-state levels of 125I-labelled homologous albumin in plasma and interstitial fluid, with subsequent sampling of free interstitial fluid from skin, skeletal muscle and tendon by subcutaneous, intermuscular and intratendon wicks (Wiig et al. 1992). Using this method we have compared the value for albumin to that of the larger molecule IgG (Wiig et al. 1994) and two differently charged subtypes of IgG (Wiig & Tenstad, 2001). These studies have suggested an in vivo charge effect on exclusion as observed in the dog lung (Gilchrist & Parker, 1985; Parker et al. 1985). We wanted to explore the charge effects on interstitial exclusion further and in order to vary independently the various determinants of exclusion we turned to an in vitro model.
Albumin is the abundant plasma protein, and because of its isoelectric point (pI) of ≈5 the molecule has a net negative charge at physiological pH (Bert & Pearce, 1984). The interstitium contains a gel phase of glycosaminoglycans that are polyanionic polysaccharide chains of variable length made up of repeating disaccharide units (Comper & Laurent, 1978; Bert & Pearce, 1984; Aukland & Reed, 1993). Our hypothesis was that by varying the charge of the probe (here albumin) an observable graded response on interstitial available volume, and thereby also excluded volume fraction, would result. We were able to titrate the pI of albumin and could thus study a graded effect of charge on exclusion in vitro. The present data suggest that the interstitium acts as a negatively charged matrix and that both collagen and GAGs contribute to volume exclusion in a manner that is probably dependent on their organization.
METHODS
The experiments were performed on skin sampled from the back of anaesthetized female Wistar-Møller rats, 202-260 g, fed a standard laboratory diet. All experiments were performed in accordance with recommendations given by the Norwegian State Commission for Laboratory Animals and were approved by the local ethical committee.
Before harvesting tissue, a ‘stock’ bathing solution was made from phosphate buffered saline (PBS) containing 0.05 % azide to prevent bacterial growth. To this was added 10 μl serum (ml buffer)−1, to counteract non-specific protein binding and 15 μl Protease Inhibitor Cocktail (P8340, Sigma) to counteract proteolytic activity during tissue equilibration with tracers. The mixture of buffer, serum, protease inhibitor and tracers is later referred to as tracer solution. The tracers were 131I-labelled, charge-modified human serum albumin (HSA) (see below), 0.3 kBq ml−1; 125I-HSA, 0.15 kBq ml−1 and 51Cr-EDTA, 0.15 kBq ml−1. The tracer doses were chosen to obtain optimal separation of 131I and 51Cr at the time of counting buffer and tissue when starting the washout.
The rats were not fasted before the experiments. At the day of the experiment, the rat was anaesthetized with pentobarbital, 50 mg kg−1 I.P. After obtaining surgical anaesthesia, blood was aspirated by cardiac puncture, and the rat was killed by intracardiac injection of saturated potassium chloride. An area of dorsal back skin was closely clipped and shaved, and a piece of full thickness skin, ≈3 × 3 cm, consisting of dermis and subcutis, was excised. To enhance the uptake of tracer by diffusion, the epithelial side of the skin was scraped with a scalpel to remove the epidermis. Thereafter the dermis and subcutis were separated by careful blunt dissection in the space of natural separation between the layers. The separated skin and subcutis were divided into two to four pieces each and immersed in 5 ml tracer solution contained in a vial. These vials were transferred to the coldroom (4 °C) for tissue tracer equilibration.
A fundamental requirement in these experiments is the attainment of steady-state tracer concentration in the tissue. To ascertain that this condition was met, tissue and 100 μl tracer solution were counted daily for up to 8 days after starting the tracer equilibration. The tissue was taken out from the tracer solution and excess tracer was removed by blotting the tissue while carefully avoiding dehydration. The tissue was then transferred to another vial for counting. After a series of initial experiments it was established that 5-7 days was sufficient to reach steady-state conditions in dermis, and the ‘wash-in' period of 7-8 days was thereafter used for the rest of the experiments. Buffer sampled at the end of the wash-in period was collected for counting and chemical analysis.
After counting tissue bathing solutions at the end of the wash-in period, a corresponding wash-out period was started by soaking the tissue in azide containing phosphate-buffered saline (PBS). Fresh buffer was added at days 2 and 4 of the wash-out period to maintain the tracer diffusion gradient. At the end of the wash-out period the tissue sample was removed from the buffer, carefully blotted as described above, and transferred to a vial for counting residual activity and later chemical analysis. Counts remaining in the tissue at the end of the wash-out period remained constant and were assumed to be non-specifically bound to the tissue and were, after correction for decay, subtracted from the corresponding tissue counts measured at the end of the wash-in period (see Results).
Samples were counted in a LKB gamma counter (Model 1282 Compugamma) using window settings of 530-690 keV for 51Cr, 700-860 keV for 131I and 120-320 keV for 125I. Standards were counted in each experiment, spillover as well as background and decay during the period of measurement were automatically corrected for. After counting, tissue samples were dried at 60 °C to constant weight (change < 1 mg in 24 h) to obtain the dry weight ratio of the tissue.
Preparation of charge-modified albumin
Charge-modified albumin was prepared by a method slightly modified from that described by Hoare & Koshland (1967). The basic principle of this method is activation of carboxyl groups within the protein by 1-ethyl-3,(3-dimethylaminopropyl carbodiimide) hydrochloride (EDC) and their subsequent amidation by ethylenediamine (free base). Briefly, 150 mg human serum albumin was dissolved in 15 ml of 0.133 M glycine methyl ester (Sigma) with pH adjustment to 4.75 by addition of HCl. The cationization was started by adding 5 ml 0.04 M EDC (Sigma) to the reaction mixture. The level of cationization is dependent on the reaction time with increasing positivity with increasing time. By stopping the reaction at defined reaction times it was possible to titrate the pI of the human serum albumin. The reaction was stopped by removing aliquots at 10, 45 and 60 min and adding one volume of 4 M sodium acetate buffer to the reaction mixture. These charge-modified human serum albumins are later referred to as cHSA-10, cHSA-45 and cHSA-60, respectively. All reactions took place at 20 °C while stirring continuously and adding weak HCl or NaOH to keep pH at 4.75. After the charge modification, the albumin solutions were dialysed against distilled water for at least 24 h before radiolabelling.
In preliminary cationization experiments we used concentrations of EDC and glycine methyl ester as originally described (Hoare & Koshland, 1967), i.e. 10 times higher than used here, and 7.5 M urea. Under these conditions, the pI of albumin was > 8 after a few minutes of reaction. Furthermore, a high non-specific tissue binding, shown by a low elutability of the modified probe from the tissue after in vitro equilibration, led us to use the probe modification procedure described above.
The pI of native and charge-modified human serum albumin was determined by isoelectric focusing (IEF) on a vertical mini-gel system (CBS Scientific Company, Inc., CA, USA). Precasted IEF gels (NOVEX, pH 3-10) were run for 1 h at 100 V; 1 h at 200 V and 30 min at 500 V; fixed for 60 min (12 g trichloroacetic acid (TCA) and 3.5 g sulfosalicylic acid in 100 ml deionized water) and stained with NOVEX Colloidal Blue stain. The pH gradient profile was determined using 11 marker proteins with pI values ranging from 3.5 to 9.3 (Pharmacia Biotech Broad pI Calibration Kit).
Preparation of radioactive tracer
The native and charge-modified human serum albumins were labelled with 125I or 131I by Iodo-Gen. Briefly, 5 mg 1,3,4,6,tetrachloro-3α,6α diphenylglycouril (Sigma-Aldrich Co., product number T0656) was dissolved in 5 ml chloroform and 0.1 ml of this solution was dispersed in a 1.8 ml Nunc vial (Nunc-Kamstrup, Roskilde, Denmark). A film of the virtually water insoluble Iodo-Gen was formed in the Nunc vial by allowing the chloroform to evaporate to dryness under nitrogen. Then 1.5 mg of albumin dissolved in 1 ml 0.05 M PBS solution, pH 7.5, containing 5 MBq 125I or 131I (Institute for Energy Technology, Kjeller, Norway) and 15 μl 0.01 M NaI was added and the iodinating tube gently agitated for 10 min before the reaction was terminated by removing the albumin solution. Un-incorporated iodine isotope, accounting for 5-10 % of the total radioactivity as estimated by TCA precipitation, was removed by dialysing the tracer against 1 l 0.9 % saline containing 0.02 % azide. The stock solution was stored in the dark at 4 °C and dialysed for at least 24 h before use.
Characterization of iodine-labelled isotopes
During tissue-bathing solution equilibration, radiolabel may come off the probes. To check for free radiolabel and whether the probes were modified during equilibration, the tracer solution used for 8 days of tissue equilibration was compared to freshly prepared stock solution by HPLC using a Superdex 200 HR 10/30 column (Pharmacia-Biotech) with an optimal separation range of 10-600 kDa. Elution was with 0.005 M phosphate buffer, pH 7.6 in 0.15 M NaCl. Successive fractions of 1.0 ml were collected and counted in the gamma counter.
Composition of the tissue extracellular matrix
The composition of the extracellular matrix is amongst the determinants of the exclusion properties of a tissue. Therefore, the tissue content of collagen, hyaluronan and total glycosaminoglycans (assayed as uronic acid) was measured. Analysis of hyaluronan was performed using a radioassay (HA-test 50, Pharmacia Diagnostics, Uppsala, Sweden) after papain digestion of freeze-dried specimens (Reed et al. 1988).
Uronic acid was measured by the method of Bitter & Muir (1962) utilizing the carbazole reaction to determine hexuronic acid, as described in a previous paper (Reed et al. 1989). When using this method, plasma proteins or tissue components in a concentration above ≈100 μg ml−1 may interfere with the colour reaction causing a shift from pink to brown, resulting in an underestimation of uronic acid (Harris & Fraser, 1969). Such colour shift was never observed in our analyses, suggesting that tissue proteins did not interfere with our results.
Collagen was determined according to the method of Woessner (1961), based on the determination of hydroxyproline content as described in a previous publication (Reed et al. 1989) assuming a hydroxyproline content of 0.91 μmol 1−1 (mg collagen)−1 (Bert et al. 1986).
Effect of ionic strength
To study the effect of ionic strength on exclusion, we added a group of experiments where 1 M NaCl was used as buffer. In these experiments native HSA and cHSA-45 were used as probes and except for NaCl concentration, the composition of the tracer solution was similar to that described above.
Calculations
The tissue distribution volumes of tracer were calculated as tracer solution equivalent spaces when a steady state situation was established, i.e. a stable level of counts in the tissue soaked in tracer solution. When such conditions were established, it was assumed that the tracer concentration in the available space in the tissue was similar to that in the buffer solution. Accordingly tracer distribution volumes (Vt) were calculated as:
| 1 |
51Cr-EDTA is an extracellular tracer (MW 341) assumed to distribute in the entire extracellular space (Vx), whereas the two albumin probes due to their size and charge are excluded from parts of this space. Expressing the available volume of native (HSA) and charge-modified albumin (cHSA) as a fraction of the 51Cr-EDTA space will cancel out weighing and pipetting errors, thus the relative available volume, Va(native) and Va,c (cationized) were calculated as:
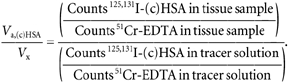 |
2 |
Native or charge-modified HSA excluded volumes (Ve) expressed as a fraction of extracellular fluid volume Vx, i.e. fractional excluded volume, can then be found as:
| 3 |
Only the elutable (i.e. unbound) fractions of the HSA tracers were used in calculation of the distribution volumes (see above).
Statistics
All tissue and tracer masses were determined by weighing and volumes and masses are given as masses. Data are given as means ± 1 s.e.m., and were compared using one-way analysis of variance (ANOVA), with Tukey tests for multiple comparisons. Differences were accepted as statistically significant at the P < 0.05 % level.
RESULTS
Preparation of tracer
By modification of the procedure originally described by Hoare & Koshland (1967) it was possible to ‘titrate’ the charge of human serum albumin. As determined by isoelectric focusing, the pI of the native HSA was 4.8, whereas cationization for 10, 45 and 60 min produced cationized HSA (cHSA) having an average pI of 6.5, 7.3 and 8.0, respectively (Fig. 1A). That the labelled protein had a charge distribution corresponding to that observed from the isoelectric focusing was verified by auto-radiography (Fig. 1B).
Figure 1. Isoelectric focusing and autoradiography of tracers.
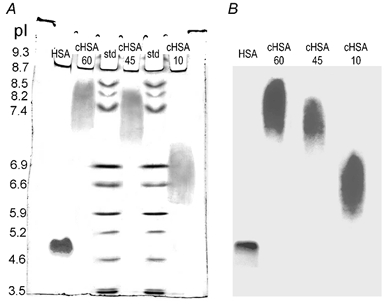
A, isoelectic focusing gel stained with Coomassie blue. Left lane, native human serum albumin (HSA), followed by cationized human serum albumin (cHSA) subjected to 60, 45 and 10 min reaction time. Also shown are two lanes with IEF standards containing 11 proteins with known pI. B, autoradiography of native (HSA) and cationized albumin (cHSA) after 60, 45 and 10 min reaction time.
Establishment of tissue steady-state levels of tracer
To establish the time needed for tissue equilibration we followed the tissue concentration of tracers during wash-in and wash-out; both were for at least 7 days, and the results for relative tracer concentration in the tissues for native HSA and cHSA-60 are shown in Fig. 2. We observe that there was uptake of probe for ≈100 h of tissue exposure to buffer; thereafter tissue probe content remained stable until wash-out was initiated at 168 h. Although a steady state seemed to be established at ≈100 h of wash-in, there was a slight tendency in some of the samples to increasing tracer concentration beyond this time. We therefore decided to use 7-8 days (or 168-192 h) as the tracer wash-in period for the rest of the experiments. Preliminary experiments showed that the tissue water content increased for up to 2-4 days of soaking in buffer, and then remained stable for the rest of the wash-in period.
Figure 2. Concentration of tracer relative to that at start of wash-out (at 168 h).
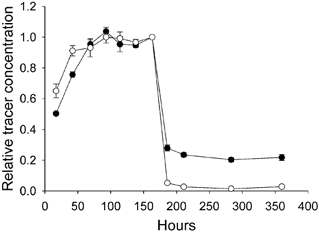
Results are plotted for native (○) and cationized human serum albumin using a reaction time of 60 min (•). The error bars indicate ± 1 s.e.m. or are included in symbols.
Wash-out was essentially complete after 2 days (Fig. 2), but the wash-out period was set to 7 days as for the wash-in. Early in the experiments it became clear that a substantial fraction of tracer was not extractable from the tissue, in accordance with previous observations on native, homologous IgG (Wiig et al. 1994). The non-elutable albumin (Fig. 2, washout period) is assumed to be non-specifically bound to the tissue and not free in the interstitial fluid. If this fraction is not taken into account, the calculated available distribution volume will be overestimated and consequently the interstitial exclusion underestimated. We therefore measured the non-elutable (i.e. bound) fraction in all individual samples. The amount of such binding increased with increased positive charge for albumin. Thus, for native albumin, the non-elutable amount of tracer was 0.039 ± 0.006 (n = 49) as compared to 0.170 ± 0.051 (n = 17), 0.24 ± 0.076 (n = 17) and 0.276 ± 0.083 (n = 12) for cHSA-10, cHSA-45 and cHSA-60, respectively. Of these values, the non-elutable fraction of cHSA-60 differed significantly from that of cHSA-10 (P < 0.05, ANOVA). The non-elutable amount was subtracted from the total tracer concentration in each sample and not included in the calculation of available volume. For 51Cr-EDTA, the non-elutable fraction was 0.009 ± 0.001 (n = 46).
Whereas the wash-out for dermis was predictable and reproducible, the wash-out from subcutis was more variable. Thus, for cHSA-10, the bound label remaining in the subcutis ranged from 13-59 %, for cHSA-45 it ranged from 16-65 % and for cHSA-60 from 32-79 %. This high and variable non-specific binding in the subcutis in some experiments led to clearly erroneous distribution volumes of cHSAs two to three times that of 51Cr. Furthermore, we observed substantial variability in the amount of swelling of the subcutis. Accordingly we discarded the results from this tissue and only data from the dermis are reported here.
Available and excluded volumes
Soaking dermis in buffer for the 7 day wash-in period resulted in swelling, to a mean value of 1.531 ± 0.044 (n = 34) of the initial weight. The wet-to-dry weight ratio after swelling averaged 4.090 ± 0.062 (n = 34).
Absolute distribution volumes for 51Cr-EDTA, native and cationized HSA expressed as gram per fluid per gram wet weight and dry weight, respectively, are shown in Table 1. We observe that the 51Cr-EDTA distribution volume, corresponding to the extracellular fluid volume, averaged 0.751 g fluid (g wet weight)−1 in fully swollen dermis, with a corresponding distribution volume for native HSA of 0.363 g (g wet weight)−1 (Table 1). Making the probe more positive resulted in a gradual increase of the HSA distribution volume, e.g. with an average distribution volume of cHSA-60 of 0.535 g (g wet weight)−1.
Table 1.
Absolute distribution volumes
| In g (g wet weight)−1 | |||||
|---|---|---|---|---|---|
| 51Cr-EDTA | Native HSA | cHSA-10 | cHSA-45 | cHSA-60 | |
| Mean | 0.751 | 0.363 | 0.418 | 0.480 | 0.535 |
| s.e.m. | 0.006 | 0.008 | 0.015 | 0.025 | 0.015 |
| n | 49 | 49 | 17 | 17 | 12 |
| In g (g dry weight)−1 | |||||
|---|---|---|---|---|---|
| 51Cr-EDTA | Native HSA | cHSA-10 | cHSA-45 | cHSA-60 | |
| Mean | 3.074 | 1.486 | 1.787 | 1.964 | 1.995 |
| s.e.m. | 0.038 | 0.035 | 0.061 | 0.103 | 0.110 |
| n | 49 | 49 | 17 | 17 | 12 |
When expressed per gram dry weight (Table 1), the extracellular fluid volume averaged 3.074 g (g dry weight)−1, with a corresponding distribution volume for native HSA of 1.486 g (g dry weight)−1, increasing gradually to 1.995 g (g dry weight)−1 for cHSA-60.
Absolute distribution volume calculations involves weighing of tissue and pipetting of buffer; both operations containing inherent systematic errors. To cancel such errors, we calculated available volume for the HSA probes relative to that of the extracellular tracer. The distribution volumes of native HSA, cHSA-10, cHSA-45 and cHSA-60 relative to the distribution volume of 51Cr-EDTA are shown in Fig. 3. For native albumin, the fractional available space was 0.485 of the corresponding 51Cr-EDTA space, with corresponding relative spaces for cHSA-10, cHSA-45 and cHSA-60 of 0.554, 0.647 and 0.718, respectively. One-way analysis of variance showed that the relative distribution spaces for cHSA all differed significantly from that of native HSA (P = 0.018 for cHSA-10 and P < 0.001 for cHSA-45 as well as cHSA-60). Furthermore, the relative distribution volumes for all different cHSAs differed significantly from each other except when comparing cHSA-45 and cHSA-60 (P = 0.088).
Figure 3. Available volume fraction for native and charge-modified human serum albumin (cHSA) with reaction times of 10, 45 and 60 min relative to that of the extracellular tracer 51Cr-EDTA.
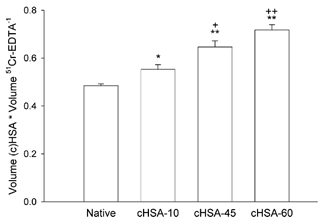
* P < 0.05 and ** P < 0.01 when compared to native albumin; + P < 0.05 and ++ P < 0.01 when compared to cHSA-10 min. The error bars indicate ± 1 s.e.m.
The relative excluded volumes (1 - Va/Ve) calculated from the data above averaged 0.515 ± 0.008 (n = 49) for native albumin, with corresponding averages for cHSA-10, cHSA-45 and cHSA-60 of 0.446 ± 0.019 (n = 17), 0.353 ± 0.026 (n = 17) and 0.282 ± 0.058 (n = 12), respectively.
Effect of ionic strength
Increasing the salt concentration of the buffer solution strongly affected the distribution volume of the negatively charged native HSA. In these experiments, the extracellular volume was 0.68 (± 0.10, n = 15) g fluid (g wet weight)−1, significantly lower than the corresponding volume using 0.15 M NaCl (P < 0.001); i.e. the tissue swelled less than in the more concentrated buffer. The distribution volumes for native HSA and cHSA-45 averaged 0.58 (± 0.02, n = 15) and 0.56 (± 0.01), respectively, of the extracellular volume in this situation, and did not differ significantly from each other.
Since the tissue's swelling differed and the amount of dry material (i.e. excluding agents) may be assumed to be constant, we chose to express the absolute excluded volume as a function of dry weight. The extracellular volume in 1 M NaCl was 2.58 g fluid (g dry weight)−1, with corresponding excluded volumes of native HSA and cHSA-45 of 0.98 (± 0.03, n = 15) and 1.04 (± 0.04, n = 15) g fluid (g dry weight)−1, respectively. In Fig. 4 we have plotted these absolute excluded volumes for native HSA and cHSA-45 using 0.15 and 1 M NaCl as buffer. We observe that in high salt solution, the excluded volume for native HSA is reduced compared to that in normal saline and is not significantly different from that of cHSA-45.
Figure 4. Excluded volume of native (native HSA) and cationized human serum albumin after 45 min reaction time (cHSA-45 min) in phosphate-buffered saline (0.15 M) and 1 M NaCl solution (1 M).
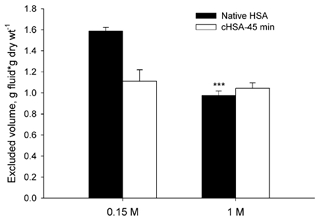
The error bars indicate ± 1 s.e.m. *** P < 0.001 when compared to native HSA at 0.15 M.
Characteristics of tracer albumin in the buffer
The tracers were run on an HPLC size exclusion column (Superdex 75HR 10/30 Amersham Pharmacia Biotech) to examine whether the cationization affected the hydrodynamic radii of the probes. Charge modification did not affect the size of the albumin molecule. However, the chemical reaction resulted in the formation of less than 5 % dimer. Free iodine in the stock tracer solution was kept below a level distinguishable from background levels by continuous dialysis. After tissue equilibration at the time of start of wash-out, the amount of free 125I was below 1.0 %, whereas the corresponding value for 131I was 1.2 %. These values were used to correct for free tracer in solution.
Samples of buffer remaining after tissue equilibration for 7 days were also applied to an HPLC column. The tracers did not change during their stay for up to 168 h in the buffer, as shown by nearly identical elution patterns of tracer stock solution and buffer after equilibration. Figure 5 shows the effluent 125I and 131I radioactivity from the column after applying buffer after 168 h of tissue equilibration. The tracers eluted in the same volume as the stock solutions. Furthermore, the stay in solution during tissue equilibration did not lead to isotope degradation products or an increased amount of dimer cHSA. As evident from Fig. 5, practically no radioactive degradation products could be detected in the buffer solution after equilibration.
Figure 5. 125I-cHSA-45 min (□) and 131I-HSA (•) radioactivity in successive gel filtration fractions of buffer sampled at the end of a 168 h tissue equilibration period from a Superdex 75HR 10/30 Amersham Pharmacia Biotech column.
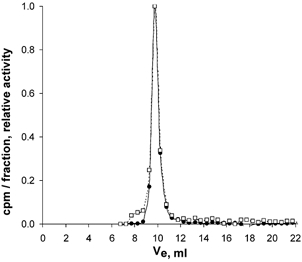
Void volume (V0) and total column volume (VT) as measured by blue dextran and acetone were 7.5 and 20 ml, respectively. Radiolabelled albumin peaked at 9.5 ml whereas dimers or polymers of 125I-albumin peak together with blue dextran at VE = 7.5 ml in this column with an exclusion limit for globular proteins of 100 kDa.
Chemical analysis of dermis and buffer
We measured hyaluronan in the dermis before and after soaking in buffer and in the buffer itself to investigate whether the hyaluronan content changed during the equilibration process. In control dermis before soaking in buffer, hyaluronan averaged 0.90 ± 0.07 (n = 14), as compared to 0.88 ± 0.07 mg (g dry weight)−1 after wash-out of tracer (P > 0.8).
To estimate the potential loss of tissue hyaluronan to the buffer solution, the total amount of hyaluronan in the buffer solution after equilibration was calculated (concentration in buffer × buffer volume) and compared to the total amount in the dermis of origin. Such calculations showed that the fraction of buffer hyaluronan amounted to 0.080 ± 0.008 (n = 20) of the total quantity in the dermis of origin.
Uronic acid determined in the dermis averaged 3.08 ± 0.18 mg (g dry weight)−1 (n = 16) after soaking in buffer, whereas the concentration in control dermis before soaking was 3.35 ± 0.25 mg (g dry weight)−1 (n = 10; P > 0.45). The fraction of uronic acid in the buffer relative to that in the tissue sample calculated as described for hyaluronan above, was 0.026 ± 0.004.
The content of collagen in the dermis averaged 546.5 ± 25.4 mg (g dry weight)−1 (n = 13) in control dermis before soaking in buffer, with a corresponding content of 581.6 ± 27.1 mg (g dry weight)−1 (n = 12; P > 0.4) for samples used for buffer equilibration. When assaying for collagen in the tracer solution after the wash-in period, the signal was indistinguishable from blank, showing that the collagen concentration in solution was zero.
DISCUSSION
We wanted to explore whether fixed negative charges in the interstitium affect the distribution volume of a macromolecular probe. Graded neutralization of the negatively charged carboxyl groups present at physiological pH in human serum albumin resulted in a subsequent dose–response increase in the fraction of interstitial fluid volume available to those albumins from 0.48 to 0.72 in fully swollen dermis in vitro. Such a graded albumin exclusion has not been demonstrated before. This finding shows a significant influence of fixed charges in distribution of plasma proteins in the interstitium, and is supported by the demonstration that neutralization of the fixed negative charges by adding salt eliminated the effect of probe charge. These observations, in agreement with studies in cartilage (e.g. Snowden & Maroudas, 1976), suggest that collagen is not the only determinant of excluded volume for charged macromolecules in dermis as suggested previously (Bert et al. 1982; Bert & Pearce, 1984).
Methodological considerations
The procedure we have used for evaluating interstitial distribution and exclusion of native and charge-modified albumins has similarities to that applied by Bert et al. in human dermis (1982). By calculating ratios of HSA distribution volume to interstitial fluid volume, thereby cancelling out the volume of buffer from the equation (eqn (2)), the evaluation of tracer protein distribution and exclusion is based solely on relative counts from gamma-emitting tracers, from the whole tissue exposed and buffer samples. Potential errors involved in tissue extraction, chemical or immuno-assays, evaporative losses and measurement of very small weights or volumes are eliminated. Whereas our previous studies of the exclusion phenomenon have been in intact animals (Wiig et al. 1992, 1994; Wiig & Tenstad, 2001), we turned to an in vitro model here. Preliminary experiments showed that chemical modification of native albumin may render the modified substance more prone to chemical degradation and to increased non-specific tissue binding if infused in vivo. Although the in vitro approach has limitations, it enables us to study independently the factors that influence probe distribution. A fundamental assumption in this method is that buffer solution albumin reaches a steady state with albumin in its available space in the tissue. This requirement was ascertained by monitoring the tissue uptake of tracer during equilibration and adding 1-2 days, resulting in a total wash-in period of 7-8 days. During such a long period, tissue may degrade and change characteristics that may influence probe distribution. To prevent degradation we used protease inhibitors. HPLC of the buffer used for tissue soaking showed no new fractions in the small molecular weight area when compared to that of wick fluid from subcutis sampled in previous studies, suggesting no tissue degradation had taken place. Furthermore, the colour yield in the buffer collagen assay was not different from blank suggesting no collagen degradation had occurred.
Another question associated with long equilibration times is whether the probe remains patent, and is related to the stability of the probe as well as to the presence of free radiolabel. Regarding the stability of labelled and charge-modified HSA, we compared it to native stock HSA using size exclusion chromatography. Except for the small amount of dimer, cHSA eluted at the same volume as native HSA, suggesting that the size had not changed during the labelling process. Furthermore, the elution patterns of buffer solutions after tissue equilibration were indiscernible from the corresponding patterns of buffer elution before the start of the experiments, suggesting no change in probe structure during equilibration. The observed dimer formation will lead to a slight increase in average cHSA molecular weight, and thereby to a minor underestimation for the available volume for probe cHSA. Probe degradation may also result in free iodine in the buffer. If liberated from albumin, this molecule will distribute in the entire extracellular fluid phase and result in an overestimation of available albumin volume. However, free radiolabel in buffer after equilibration was < 1.2 %, showing that this was only a minor problem.
A requirement for the present method is that the tracers used are free in the interstitial fluid and not bound to extracellular matrix components or cells. Furthermore, it is assumed that the extravascular tracer, 51Cr-EDTA, distributes in the whole extracellular fluid phase and is not essentially excluded from this fluid phase. In a detailed study on fluid distribution spaces in tail tendon, Aukland (1991) found that 51Cr-EDTA was excluded from 8 % of total tendon water. In that study intracellular water could account for a major part of the water inaccessible to 51Cr-EDTA. We were able to elute on average > 99 % of this tracer from the tissue, suggesting that intracellular passage and binding do not influence the results and accordingly that the tracer distributes in the whole extracellular phase.
One problem observed using cationized HSA probes was the significant non-specific binding to the tissue. As in a previous study (Wiig et al. 1992), we were able to remove ≈96 % of the native albumin from the dermis by elution, whereas for cHSA the corresponding fractions were 70-80 %. It therefore seems that up to 30 % of the labelled cHSA in our tissue samples is not free in the interstitial fluid but is bound in some way within the tissue. This binding and uptake process seem to be influenced by the charge of the molecule since the degree of binding increased with increasing positivity of the probe. High and variable binding in subcutaneous tissue accounted for virtual distribution volumes higher than tissue volume, and we therefore decided to discard all these data. We, as well as others, have experienced non-specific binding of IgG in previous studies (Wiig et al. 1994; Flessner & Schwab, 1996; Wiig & Tenstad, 2001). Based on studies by others (Griffin et al. 1976; Bill, 1977) we have concluded that the non-elutable tracer was probably bound to lymphocytes or was taken up by macrophages, and tracer may have also been sequestered intracellularly in the present study too. If not corrected for, tracer binding will lead to an overestimation of the available volume and to an underestimation of excluded volume. We therefore eluted all samples in order to be able to correct each sample individually, and by doing so to get a reliable estimate of tracer albumin, native as well as charge-modified, free in the interstitial fluid.
Comparison to previous studies
Whereas several investigators have studied exclusion of albumin in skin (for references see Aukland & Reed, 1993), few have dealt with albumin distribution volumes in the dermis. Of most relevance, Bert et al. (1982) studied albumin exclusion in fully swollen excised human dermis in vitro and found that 32 % only of the fluid phase was available to albumin. If we express our data on a wet weight basis, native albumin distributed in 45 % of the fluid phase, i.e. significantly higher than the corresponding fraction observed by Bert et al. (1982), a difference that may be explained by a higher content of collagen in human dermis. In a study on rat dermis in vivo, Reed et al. (1989) found fractional excluded volumes of 57.8 and 53.5 % in normally and overhydrated dermis, respectively. These data correspond well to our finding of 51.5 % excluded volume fraction in fully swollen tissue when considering that the relative excluded volume diminishes with increasing hydration (Bert et al. 1982; Mullins & Bell, 1982; Mullins et al. 1987).
The potential effect of charge on extravascular distribution of probes has been addressed by use of anionic lactate dehydrogenase (LDH) 1 (pI 5.0) and LDH 5 (pI 7.9) in the lung (Gilchrist & Parker, 1985; Parker et al. 1985) and by the use of IgG 1 (pI 8.7) and IgG 4 (pI 6.6) in rat skin and muscle (Wiig & Tenstad, 2001). In all these studies a larger distribution volume was found for the more positively charged probe, supporting the assumption that negatively charged glycosaminoglycans reduce the distribution volume of negatively charged probes by repulsion. Albumin is the most abundant plasma protein, and ≈60 % of this protein is located extravascularly (Bert & Pearce, 1984). Additionally, it carries a significant negative charge (-17). These facts make albumin important as a probe for studies of interstitial exclusion in normal (for references see Aukland & Reed, 1993) as well as in pathological tissues such as tumours (Krol et al. 1999), including studies of charge effects. To our knowledge this topic has only once been addressed previously. In an abstract, Bell (1985) described measurements of tissue uptake and distribution of native (pI 5.0) and charge-modified albumin (pI 7.6). After tracer infusion for 33-76 h he found the distribution volume in rabbit hindpaw skin of the charge-modified albumin to be 60 % greater than that of native albumin, in qualitative agreement with our data. Whether binding was corrected for in his study is not known, making a quantitative comparison difficult.
Physiological implications
Due to its large mass, collagen is probably the major excluding agent of the interstitium (Comper & Laurent, 1978; Bert & Pearce, 1984; Aukland & Reed, 1993) but hyaluronan also contributes significantly, e.g. in the umbilical cord where it contributes more than 50 % to the total excluded fraction (Meyer, 1983). The background for our studies on exclusion and charge was the finding of no significant differences in the excluded volumes of albumin (molecular mass 66 kDa, Stokes-Einstein radius 3.53 nm, pI 4.8) and the significantly larger molecule IgG (molecular mass 160 kDa, Stokes-Einstein radius 5.61 nm, pI 5.8-7.3) in skin and muscle in vivo, suggesting that charge influenced extravascular probe distribution significantly (Wiig et al. 1992; Wiig & Tenstad, 2001). That the charge of the albumin molecule also influences transvascular transport has been shown for skin and muscle in rabbits (Gandhi & Bell, 1992).
The present data may be used for a further quantification of the charge effects of albumin exclusion and to explore the question of whether domains of excluding agents are overlapping or additive (Bert et al. 1982). Collagen has a slight positive charge at physiological pH (Li & Katz, 1976), and since it has close to no net charge, it behaves as a tissue element with effectively no areas with high local charge (i.e. it does not support an electron cloud and has no Debye length). In human dermis, highly organized collagen will exclude albumin from a volume of 1.57 g fluid (g collagen)−1 (Bert et al. 1982). If the same applies to rat dermis, the measured amount of collagen of 0.58 g (g dry weight)−1 (corresponds to 0.142 g (g wet weight)−1) excludes native albumin from 0.22 g fluid (g wet tissue)−1. The total extracellular fluid volume (51Cr-EDTA space) was 0.75 g fluid (g wet tissue)−1, whereas the excluded volume fraction of native albumin was 0.516, corresponding to exclusion of 0.39 g fluid (g wet tissue)−1, suggesting that agents other than collagen account for 44 % of the excluded volume fraction for unmodified albumin.
A more direct estimate of the charge effect on excluded volume can be obtained by comparing exclusion in PBS and 1 M NaCl. The latter solution will efficiently screen charged sites on fixed tissue elements (and probes as well), including collagen. If we use the data for native HSA from Fig. 4, and assume that the exclusion in PBS is the sum of steric and charge effects (i.e. additive) and that in 1 M NaCl it is representative for steric exclusion only, we find that steric and charge effects account for 61 and 39 %, respectively, of the exclusion effect.
Whereas previous studies have suggested a major role for hyaluronan (e.g. Comper & Laurent, 1978; Meyer, 1983; Reed et al. 1989), the present data suggest a limited role for this molecule for albumin exclusion in the dermis. We found a hyaluronan content of 0.90 mg (g dry weight)−1 corresponding to 0.22 mg (g wet weight)−1. This value is lower than found in a previous study (Reed et al. 1989), but in agreement with more recent observations (Wiig et al. 2000). Since 1 mg hyaluronan will exclude 0.05 g fluid (Laurent, 1964), this material will contribute about 0.01 g to the total excluded volume of 0.39 g fluid (g wet weight)−1 for native albumin. Even with the reservations regarding hyaluronan content discussed above, it suggests a minor role for hyaluronan as an excluding agent in the dermis, in agreement with observations from the rat tail tendon (Aukland et al. 1997).
On the other hand, if we assume that of the total excluded volume of 0.39 g fluid (g wet tissue)−1, 61 % of the exclusion effect is due to steric factors and the remaining 39 % is due to charge (see above), and that all the charge effect can be ascribed to glycosaminoglycans (GAGs), we obtain 0.15 g fluid (g wet weight)−1 exclusion by GAG. If we use the data for tissue composition after wash in, and a hyaluronan-to-uronic acid ratio of 2.28, the hyaluronan accounted for 0.39 mg (g dry weight)−1 of the uronic acid. The remaining uronic acid (2.69 g (g dry weight)−1) is presumably derived from proteoglycans, and using a conversion factor of 2.61 (Aukland et al. 1997), this corresponds to a glycosaminoglycan moiety of 7.02 mg (g dry weight)−1, giving total GAGs of 7.41 mg (g dry weight)−1. The dominating proteoglycan in skin is dermatan sulphate (Parry et al. 1982), which has a protein moiety of 30 % (Anderson, 1975), resulting in a total proteoglycan of 10.02 and thereby a total GAG content of 10.41 mg (g dry weight)−1. If we assume that the proteoglycans distribute in the interstitial fluid phase of 0.75 g (g wet weight)−1, and use the observed wet/dry ratio of 4.090, the concentration of GAGs in the interstitial fluid averaged 3.39 mg (g interstitial fluid)−1. Thus, our data suggest that the GAGs exclude 0.044 g fluid mg−1 in intact dermis, i.e. close to the 0.05 ml mg−1 obtained for hyaluronan in vitro (Laurent, 1964).
Another implication of the calculations above is that there are no overlapping domains of the excluding agents in fully swollen dermis, i.e. that the excluded volumes due to collagen and GAGs are additive. This contention is based on the fact that the overall exclusion for HSA in the dermis was described as the sum of the excluded volumes by two separate excluding species (collagen and GAGs). Moreover, the specific exclusion by collagen (Bert et al. 1982) and GAGs (hyaluronan as a surrogate (Laurent, 1964)) as used in our calculations were from independent in vitro studies, yet with the use of these values our findings could be explained quantitatively. This contrasts with observations made in normally hydrated dermis (Wiig et al. 1992) and tail tendon (Aukland et al. 1997), which could not be explained by addition of exclusion by structural elements, but the difference in these studies may relate to the degree of hydration of the tissue.
Conclusion
By graded cationization of serum albumin we were able to titrate charge to study its effect on available and excluded volume in fully swollen dermis. Raising pI in the native HSA from 5.0 to 8.0 resulted in a reduction in excluded volume fraction from 0.52 to 0.34, showing a significant and graded response of probe charge on excluded volume fraction. This effect could be eliminated by increasing the buffer ionic strength, thereby reducing the effect of probe repulsion by fixed negative charges in the tissue. Whereas previous studies have suggested that the weakly positive collagen is the dominating excluding agent, calculations based on the present experiments suggest that that collagen and glycosaminoglycans contribute to about 60 and 40 %, respectively, of the exclusion of albumin in fully swollen dermis.
Acknowledgments
This work was supported by The Norwegian Council on Cardiovascular Diseases and The Research Council of Norway. Expert technical assistance from Wibeke Skytterholm and Sigrid Lepsøe is gratefully acknowledged.
REFERENCES
- Anderson JC. Isolation of a glycoprotein and proteodermatan sulphate from bovine achilles tendon by affinity chromatography on concanavalin A-Sepharose. Biochim Biophys Acta. 1975;379:444–455. doi: 10.1016/0005-2795(75)90151-8. [DOI] [PubMed] [Google Scholar]
- Aukland K. Distribution volumes and macromolecular mobility in rat tail tendon interstitium. Am J Physiol. 1991;260:H409–419. doi: 10.1152/ajpheart.1991.260.2.H409. [DOI] [PubMed] [Google Scholar]
- Aukland K, Reed RK. Interstitial-lymphatic mechanisms in the control of extracellular fluid volume. Physiol Rev. 1993;73:1–78. doi: 10.1152/physrev.1993.73.1.1. [DOI] [PubMed] [Google Scholar]
- Aukland K, Wiig H, Tenstad O, Renkin EM. Interstitial exclusion of macromolecules studied by graded centrifugation of rat tail tendon. Am J Physiol. 1997;273:H2794–2803. doi: 10.1152/ajpheart.1997.273.6.H2794. [DOI] [PubMed] [Google Scholar]
- Bell DR. Extravascular transport and distribution of charge-modified albumin in skin. Microvasc Res. 1985;29:207. [Google Scholar]
- Bert JL, Mathieson JM, Pearce RH. The exclusion of human serum albumin by human dermal collagenous fibres and within human dermis. Biochem J. 1982;201:395–403. doi: 10.1042/bj2010395. [DOI] [PMC free article] [PubMed] [Google Scholar]
- Bert JL, Pearce RH. In: The interstitium and microvascular exchange Handbook of Physiology, section 2, The Cardiovascular System, Microcirculation. Renkin EM, Michel CC, editors. IV. Bethesda, MD: American Physiological Society; 1984. pp. 521–547. part 1. [Google Scholar]
- Bert JL, Pearce RH, Mathieson JM. Concentration of plasma albumin in its accessible space in postmortem human dermis. Microvasc Res. 1986;32:211–223. doi: 10.1016/0026-2862(86)90055-5. [DOI] [PubMed] [Google Scholar]
- Bill A. Plasma protein dynamics: albumin and IgG capillary permeability, extravascular movement and regional blood flow in unanesthetized rabbits. Acta Physiol Scand. 1977;101:28–42. doi: 10.1111/j.1748-1716.1977.tb05980.x. [DOI] [PubMed] [Google Scholar]
- Bitter T, Muir HM. A modified uronic carbazole reaction. Anal Biochem. 1962;4:330–334. doi: 10.1016/0003-2697(62)90095-7. [DOI] [PubMed] [Google Scholar]
- Comper WD, Laurent TC. Physiological function of connective tissue polysaccharides. Physiol Rev. 1978;58:255–315. doi: 10.1152/physrev.1978.58.1.255. [DOI] [PubMed] [Google Scholar]
- Flessner MF, Schwab A. Pressure threshold for fluid loss from the peritoneal cavity. Am J Physiol. 1996;270:F377–390. doi: 10.1152/ajprenal.1996.270.2.F377. [DOI] [PubMed] [Google Scholar]
- Gandhi RR, Bell DR. Importance of charge on transvascular albumin transport in skin and skeletal muscle. Am J Physiol. 1992;262:H999–1008. doi: 10.1152/ajpheart.1992.262.4.H999. [DOI] [PubMed] [Google Scholar]
- Gilchrist SA, Parker JC. Exclusion of charged macromolecules in the pulmonary interstitium. Microvasc Res. 1985;30:88–98. doi: 10.1016/0026-2862(85)90041-x. [DOI] [PubMed] [Google Scholar]
- Griffin FM, Jr, Griffin JA, Silverstein SC. Studies on the mechanism of phagocytosis. II. The interaction of macrophages with anti-immunoglobulin IgG-coated bone marrow-derived lymphocytes. J Exp Med. 1976;144:788–809. doi: 10.1084/jem.144.3.788. [DOI] [PMC free article] [PubMed] [Google Scholar]
- Harris G, Fraser JR. Behavior of serum in the borate modification of the carbazole reaction. Anal Biochem. 1969;27:433–438. doi: 10.1016/0003-2697(69)90057-8. [DOI] [PubMed] [Google Scholar]
- Hoare DG, Koshland DE., Jr A method for the quantitative modification and estimation of carboxylic acid groups in proteins. J Biol Chem. 1967;242:2447–2453. [PubMed] [Google Scholar]
- Krol A, Maresca J, Dewhirst MW, Yuan F. Available volume fraction of macromolecules in the extravascular space of a fibrosarcoma: implications for drug delivery. Cancer Res. 1999;59:4136–4141. [PubMed] [Google Scholar]
- Laurent TC. The interaction between polysaccharides and other macromolecules. 9. The exclusion of molecules from hyaluronic acid gels and solutions. Biochem J. 1964;93:106–112. doi: 10.1042/bj0930106. [DOI] [PMC free article] [PubMed] [Google Scholar]
- Li ST, Katz EP. An electrostatic model for collagen fibrils. The interaction of reconstituted collagen with Ca++, Na+, and Cl−. Biopolymers. 1976;15:1439–1460. doi: 10.1002/bip.1976.360150802. [DOI] [PubMed] [Google Scholar]
- Meyer FA. Macromolecular basis of globular protein exclusion and of swelling pressure in loose connective tissue (umbilical cord) Biochim Biophys Acta. 1983;755:388–399. doi: 10.1016/0304-4165(83)90242-8. [DOI] [PubMed] [Google Scholar]
- Mullins RJ, Bell DR. Changes in interstitial volume and masses of albumin and IgG in rabbit skin and skeletal muscle after saline volume loading. Circ Res. 1982;51:305–313. doi: 10.1161/01.res.51.3.305. [DOI] [PubMed] [Google Scholar]
- Mullins RJ, Powers MR, Bell DR. Albumin and IgG in skin and skeletal muscle after plasmapheresis with saline loading. Am J Physiol. 1987;252:H71–79. doi: 10.1152/ajpheart.1987.252.1.H71. [DOI] [PubMed] [Google Scholar]
- Parker JC, Gilchrist S, Cartledge JT. Plasma-lymph exchange and interstitial distribution volumes of charged macromolecules in the lung. J Appl Physiol. 1985;59:1128–1136. doi: 10.1152/jappl.1985.59.4.1128. [DOI] [PubMed] [Google Scholar]
- Parry DA, Flint MH, Gillard GC, Craig AS. A role for glycosaminoglycans in the development of collagen fibrils. FEBS Lett. 1982;149:1–7. doi: 10.1016/0014-5793(82)81060-0. [DOI] [PubMed] [Google Scholar]
- Reed RK, Lepsøe S, Wiig H. Interstitial exclusion of albumin in rat dermis and subcutis in over- and dehydration. Am J Physiol. 1989;257:H1819–1827. doi: 10.1152/ajpheart.1989.257.6.H1819. [DOI] [PubMed] [Google Scholar]
- Reed RK, Lilja K, Laurent TC. Hyaluronan in the rat with special reference to the skin. Acta Physiol Scand. 1988;134:405–411. doi: 10.1111/j.1748-1716.1988.tb08508.x. [DOI] [PubMed] [Google Scholar]
- Snowden JM, Maroudas A. The distribution of serum albumin in human normal and degenerate articular cartilage. Biochim Biophys Acta. 1976;428:726–740. doi: 10.1016/0304-4165(76)90204-x. [DOI] [PubMed] [Google Scholar]
- Wiig H, De Carlo M, Sibley L, Renkin EM. Interstitial exclusion of albumin in rat tissues measured by a continuous infusion method. Am J Physiol. 1992;263:H1222–1233. doi: 10.1152/ajpheart.1992.263.4.H1222. [DOI] [PubMed] [Google Scholar]
- Wiig H, Kaysen GA, Al-Bander HA, De Carlo M, Sibley L, Renkin E. Interstitial exclusion of IgG in rat tissues estimated by continuous infusion. Am J Physiol. 1994;266:H212–219. doi: 10.1152/ajpheart.1994.266.1.H212. [DOI] [PubMed] [Google Scholar]
- Wiig H, Reed RK, Tenstad O. Interstitial fluid pressure, composition of interstitium, and interstitial exclusion of albumin in hypothyroid rats. Am J Physiol Heart Circ Physiol. 2000;278:H1627–1639. doi: 10.1152/ajpheart.2000.278.5.H1627. [DOI] [PubMed] [Google Scholar]
- Wiig H, Tenstad O. Interstitial exclusion of positively and negatively charged IgG in rat skin and muscle. Am J Physiol Heart Circ Physiol. 2001;280:H1505–1512. doi: 10.1152/ajpheart.2001.280.4.H1505. [DOI] [PubMed] [Google Scholar]
- Woessner JF. The determination of hydroxyproline in tissue and protein samples containing small proportions of this imino acid. Arch Biochem Biophys. 1961;93:440–447. doi: 10.1016/0003-9861(61)90291-0. [DOI] [PubMed] [Google Scholar]