

Abstract
Placental growth factor (PlGF) and vascular endothelial growth factor (VEGF) are involved in placental angiogenesis through interactions with the VEGFR-1 and VEGFR-2 receptors. The placenta of pregnancies whose outcome is fetal growth restriction (FGR) are characterized by abnormal angiogenic development, classically associated with hypoxia. The present study evaluated the near-term expression of this growth factor family in an ovine model of placental insufficiency–FGR, in relationship to uteroplacental oxygenation. Compared to controls, FGR pregnancies demonstrated a 37 % increase in uterine blood flow (FGR vs. control, 610.86 ± 48.48 vs. 443.17 ± 37.39 ml min−1 (kg fetus)−1; P < 0.04), which was associated with an increased maternal uterine venous PO2 (58.13 ± 1.00 vs. 52.89 ± 1.26 mmHg; P < 0.02), increased umbilical artery systolic/diastolic ratio (3.90 ± 0.33 vs. 2.12 ± 0.26, P < 0.05), and fetal hypoxia (arterial PO2; 12.79 ± 0.97 vs. 18.65 ± 1.6 mmHg, P < 0.005). Maternal caruncle PlGF mRNA was increased in FGR (P < 0.02), while fetal cotyledon VEGF mRNA was reduced (P < 0.02). VEGFR-1 mRNA was also reduced in FGR fetal cotyledon (P < 0.001) but was not altered in caruncle tissue. Immunoblot analysis of PlGF and VEGF demonstrated single bands at 19 000 and 18 600 Mr, respectively. Caruncle PlGF concentration was increased (P < 0.04), while cotyledon VEGF was decreased (P < 0.05) in FGR placentae. The data establish that uterine blood flow is not reduced in relationship to metabolic demands in this FGR model and that the transplacental PO2 gradient is increased, maintaining umbilical oxygen uptake per unit of tissue. Furthermore, these data suggest that an increased transplacental gradient of oxygen generates changes in angiogenic growth factors, which may underline the pathophysiology of the post-placental hypoxic FGR.
Animal studies from many laboratories have confirmed the impact of placental insufficiency (PI) upon delivery of nutrients to the fetus and the role of PI in the development of a growth-restricted fetus (FGR). In human FGR the placenta is often characterized by abnormal vascular development, either as failure in trophoblastic invasion resulting in reduced vascular impedance, or as a defect in fetoplacental perfusion associated with increased placental vascular impedance (Jackson et al. 1995; Macara et al. 1995).
The vascular endothelial growth factor (VEGF) family has been highlighted as a major regulator of placental vascular development or angiogenesis and includes placental growth factor (PlGF) and VEGF-A, -B and -C. Alternative splicing of the single PlGF mRNA yields three isoforms: PlGF149 (PlGF-1), PlGF170 (PlGF-2) and PlGF219 (PlGF-3) (Park et al. 1994; Cao et al. 1997). Similar to PlGF, alternative splicing of the VEGF-A transcript also yields multiple isoforms: VEGF121, VEGF145, VEGF165, VEGF189 and VEGF206 (Ferrara et al. 1991a). Placental expression of other members of the family, VEGF-B and VEGF-C, has been reported (Clark et al. 1996; Vuorela et al. 1997). PlGF and VEGF-A act through two high affinity cell surface tyrosine kinase receptors: VEGFR-1 (flt-1) and VEGFR-2 (KDR/flk-1) (Terman et al. 1994; Waltenberger et al. 1994). While VEGF-A isoforms exert their effects through binding to both VEGFR-1 and VEGFR-2, PlGF isoforms interact only with VEGFR-1 (Park et al. 1994; Sawano et al. 1996).
During early placental development, branching angiogenesis occurs (Benirschke & Kaufmann, 2000) under relatively hypoxic conditions (Rodesch et al. 1992). As the pregnancy proceeds into the third trimester, vascular development is predominantly of a non-branching nature and is thought to occur under relatively normoxic conditions (Ong et al. 2000). Previous studies indicate that the interaction of VEGF with VEGFR-2 induces branching angiogenesis, whereas non-branching angiogenesis results from PlGF interacting with VEGFR-1 (Kingdom et al. 2000). Observations that different forms of angiogenesis occur under differing oxygen tensions in vivo, and in culture systems in vitro, suggest that the interactions of these various factors and their receptors appear to be regulated by oxygen partial pressure (Castellucci et al. 1990; Shore et al. 1997). PlGF expression is stimulated under elevated PO2 and down-regulated by a low PO2 (Khaliq et al. 1999; Ahmed et al. 2000), whereas VEGF and its receptors are up-regulated by a low PO2 (Tuder et al. 1995; Brogi et al. 1996; Taylor et al. 1997).
The situation of FGR is commonly associated with an altered placental angiogenesis, and impaired placental oxygenation has often been cited as the cause. Recently, however, it has been proposed that the different villous morphologies associated with FGR outcomes, such as maternal anaemia-associated FGR, late gestational pre-eclampsia-associated FGR and severe early-onset FGR with absent end-diastolic flow (AEDF) in the umbilical artery do not share a common aetiology (Kingdom et al. 2000). Maternal anaemia, as well as pregnancy at high altitude, is characterized by pre-placental hypoxia. However, pre-eclampsia is often associated with inadequate trophoblast invasion, leading to a reduced intraplacental oxygen pressure, or uteroplacental hypoxia. Both pre-placental and uteroplacental hypoxia are associated with increased angiogenesis of a branching nature and consequently, reduced capillary-mediated impedance within the fetal placental vasculature (Ong et al. 2000). Severe early-onset FGR with umbilical AEDF, on the other hand, is postulated to be associated with increased intraplacental oxygen pressure, or relative ‘placental hyperoxia' (Krebs et al. 1996; Kingdom & Kaufmann, 1997). In this situation, it is postulated that branching angiogenesis is suppressed, and predominantly non-branching angiogenesis occurs, resulting in the development of increased vascular impedance.
Previously, we have reported alterations in VEGF, VEGFR-1 and VEGFR-2 mRNA expression during the period of maximal placental growth in an ovine model of PI-FGR and proposed that these may contribute to the development of placental insufficiency (Regnault et al. 2002b). The present study was designed to examine the expression of these angiogenic growth factors and their receptors, in conjunction with fetal and uteroplacental oxygenation, in near-term PI-FGR sheep pregnancies.
METHODS
Animal care, placental resistance indices measurements and surgery
Sixteen time-mated 2- to 3-year-old Columbia-Rambouillet ewes pregnant with a single fetus were studied. Animal care was in strict compliance with National Institutes of Health guidelines within an American Association for Accreditation of Laboratory Animal Care certified facility. The study was approved by the University of Colorado Health Sciences Center Animal Care and Use Committee, protocol number 56304098(06) 1F. At approximately 39 days gestational age (dGA; term = 147 ± 3 dGA), ewes were allocated to either the thermoneutral control (TN) or hyperthermic (HT) treatment. A total of six ewes were maintained in the TN treatment and ten ewes were placed into individual pens in a HT chamber. Prior to allocation, ewe blood type was determined as described before (Wilkening et al. 1988). The relevant temperature, humidity and lighting arrangements used in this treatment were as previously described (Regnault et al. 1999). Rectal temperature as a measure of core body temperature (CBT) and breathing rate (breaths min−1) were measured in all animals twice weekly.
Ewes in the HT environment had their feed and water intake recorded daily and were fed a diet of alfalfa hay pellets, containing 90.4 % dry matter, 20.8 % crude protein and 25.9 % detergent fibre. Calculated metabolizable energy content was 9.7 MJ kg−1. Gestational age-matched TN ewes were fed the average of the HT ewes' daily intake, which never fell below 1 kg day−1 (9.7 MJ), a level in excess of required metabolizable energy intakes for ewes at this period of gestation (National Research Council-Subcommittee on Sheep Nutrition, 1985). Ewes were maintained in the HT environment until 120 ± 1 dGA, at which time they were moved to the TN environment where feeding continued ad libitum.
Approximately 2-3 days after exit from the HT environment (≈123 dGA), umbilical artery resistance indices were measured on all ewes with pulsed-wave Doppler ultrasound, under TN (room temperature) conditions. Briefly, Doppler velocimetry measurements were obtained using an ATL Ultramark 9 with a 4.0 MHz abdominal transducer as previously described (Galan et al. 1998). Umbilical artery resistance indices calculated from blood flow velocity waveforms included the umbilical systolic/diastolic ratio (Umb S/D), the resistance index (Umb RI; (systolic - diastolic)/systolic) and the pulsatility index (Umb PI; (systolic - diastolic)/mean) near the fetal umbilical cord insertion. Examinations generally lasted less than 15 min. Resistance indices were calculated from flow velocity waveforms that had a minimum of three clear cardiac cycles.
At 127 ± 1 dGA, five ewes from the TN group and seven from the HT group underwent surgery for placement of fetal and maternal catheters for blood gas and flow determinations. After 24 h fasting and 12 h without water, buprenorphine (1 mg kg−1, S.C.) and diazepam (0.11 mg kg−1, I.V.) were administered. Approximately 1 h later animals were sedated with ketamine (4.4 mg kg−1, I.V.) and then placed on isoflurane (1-3 %) inhalation. The uterus was exposed through a midline abdominal incision. The fetus was exposed through a 6 cm incision of the uterine wall, and polyvinyl catheters (1.4 mm o.d.) were placed in the fetal pedal artery and vein and in the umbilical vein. An additional catheter was placed in the amniotic cavity to allow amniotic antibiotic prophylaxis delivery to the fetus. The maternal femoral artery, uterine vein and femoral vein were also catheterized. All catheters were then tunnelled subcutaneously to a pouch secured to the animal's flank. Following surgery, sheep were placed in individual carts with free access to water, alfalfa hay pellets (as described) and mineral blocks. Ampicillin (500 mg) was injected daily into the amniotic cavity for the first 3 days after surgery. Animals were allowed to recover from laparotomy for at least 5 days before study. After surgery, daily samples were collected from mother and fetus and analysed for glucose and lactate concentrations using a glucose analyser (YSI, Model 2700 Select, Yellow Springs, OH, USA). Samples were also collected for pH, PO2, PCO2 and O2 content determinations (OMSB3 and ABL 500, Radiometer, Copenhagen) to verify maternal and fetal well-being. Catheters were maintained patent with daily heparinized saline flushes (35 U heparin ml−1).
Uteroplacental and fetal oxygenation, blood flow determination and tissue collection
At 135 ± 1 dGA, under control temperature (19 ± 2 °C), uteroplacental and fetal oxygenation and blood flow determinations were conducted on the 12 animals that had undergone surgery. All animals' CBTs were approximately 39.1 ± 0.05 °C. Uterine and umbilical blood flows were determined by the steady state ethanol diffusion method as previously described (Bonds et al. 1980). Briefly, a solution of ethanol was given as a 10 mg % solution at 5.1 ml h−1 following a 5 ml priming dose in the fetal pedal vein. The ethanol infusion began 90 min before sampling commenced to ensure steady state ethanol concentrations during the course of the four-sample collection study. Four sets of 1 ml blood samples were drawn from the maternal femoral artery (MA), uterine vein (UtV), umbilical vein (Umbv) and fetal artery (Fa) for analysis of maternal and fetal blood gas parameters and ethanol concentration (steady state period). Blood samples for ethanol determination were collected in EDTA-treated syringes, and ethanol concentrations were determined using a quantitative enzymatic UV determination method in triplicate aliquots and converted to blood ethanol content on the basis of the haematocrit, as per the supplier's instructions (Sigma Cat No. Alcohol 332-UV, St Louis, MO, USA). Haematocrit was determined as packed cell volume. Plasma glucose and lactate concentrations were measured in a glucose analyser (YSI, Model 2700 Select). Blood samples were also drawn into heparinized capillary syringes and analysed for pH, PO2 and PCO2 (mmHg) and bicarbonate concentration (HCO3−, mmol l−1) in an ABL 500 blood gas analyser (Radiometer). Oxygen capacity (HGB, mmol l−1), oxygen saturation (SO2, %), carboxyhaemoglobin (HbCO, %) and methaemoglobin (MetHb, %) values were determined using a OMSB3 haemoximeter (Radiometer).
Plasma flows were calculated using uterine or umbilical flow multiplied by 1 minus the fractional maternal or fetal haematocrit, respectively. Ethanol clearance rates were calculated from the ratio of transplacental ethanol diffusion rate divided by the difference between the ethanol concentration in umbilical arterial blood and maternal arterial blood. Oxygen content was calculated using the formula: O2 content = mean HGB × (1 - (HbCO/100) - (MetHb/100)) × (SO2/100). Uterine and umbilical oxygen uptake was calculated using the Fick principle (Meschia et al. 1980). The uteroplacental uptake of oxygen was calculated as the difference between the uterine uptake and the umbilical uptake. Prior to the study, two HT Umbv catheters became non-patent. Blood flow and associated parameters were collected on the remaining five animals.
All ewes were killed at 135 ± 1 dGA (TN, n = 6; HT, n = 10), and the gravid uterus was removed and dissected into placental and fetal components. Placentomes were trimmed of endometrium and fetal membranes and weighed, with placental weight being recorded as the sum of the placentomes. A total of 10 placentomes per placenta were collected randomly and rinsed in ice-cold sterile saline, carefully dissected into maternal (caruncle) and fetal (cotyledon) components, snap frozen in liquid nitrogen and stored at −80 °C. Approximately 6-10 g of sample was ground under liquid nitrogen and stored at −80 °C pending mRNA extraction. Fetuses were towel dried, weighed and crown rump length (CRL) measured (Mellor & Matheson, 1979). Fetal liver and brain were removed and weighed. From these measurements the fetal brain/liver ratio (brain weight (g)/liver weight (g)) and fetal ponderal index (fetal weight (g)/CRL (cm)3) were calculated (Bell et al. 1987).
Northern blot hybridizations for PlGF and VEGF
Caruncle and cotyledon total cellular (tc) RNA was isolated as previously described (Kappes et al. 1992; Regnault et al. 1999). Ovine PlGF (Genbank Accession No. AY157708) and β-actin cDNAs were generated as previously described (Regnault et al. 2002b). The oVEGF cDNA was a gift of Dr D. Redmer (North Dakota State University, Fargo, ND, USA)(Redmer et al. 1996). Twenty micrograms of each tcRNA was analysed and blots were hybridized first with [α-32P]dCTP-radiolabelled PlGF cDNA. Following an overnight hybridization (42 °C), blots were washed for 5 min (2 × SSC-0.1 % SDS) at room temperature, then 5 min (2 × SSC-0.1 % SDS) at 42 °C and twice for 20 min (0.1 × SSC-0.1 % SDS) at 60 °C. Membranes were exposed to a phosphor image screen for 48 h, scanned with a Storm Analyzer (Molecular Dynamics) and then stripped of radiolabelled cDNA by incubation with boiling 0.5 % SDS for 30 min. These membranes were hybridized with [α-32P]dCTP-radiolabelled VEGF cDNA, following the same procedure as above. Finally, the membranes were stripped and hybridized with a [α-32P]dCTP-radiolabelled β-actin cDNA following the same procedure as described. Resulting band intensities were determined densitometrically through Image Quant (Molecular Dynamics). The sizes of PlGF, VEGF and β-actin hybridization signals were calculated by extrapolation from a 0.4-9.5 kb RNA ladder (Gibco-BRL, Gaithersburg, MD, USA).
RNase protection assay of VEGFR-1 and VEGFR-2 expression
Ovine VEGFR-2 (AF513909) and β-actin were generated as previously described (Regnault et al. 2002b). The 272 bp oVEGFR-1 cDNA was a gift of Dr D. Redmer (North Dakota State University, Fargo, ND, USA), generated from synthetic oligonucleotides designed from human VEGFR-1 (Genbank accession number X51602). RNase protection assays (RPA) were conducted as previously described (Regnault et al. 2002b). Briefly, VEGFR-1 and VEGFR-2 cDNAs were digested with Tfil (New England BioLabs, Beverly, MA, USA), which when used in the RPA, generated protected fragments of 184 and 198 bp respectively, whilst actin was digested with AvaII (New England BioLabs) to yield a protected fragment of 141 bp. Antisense [α-32P]CTP-radiolabelled cRNA probes (2 × 10⁵ c.p.m.) were synthesized by in vitro transcription using either T3 or T7 RNA polymerases (Ambion, Austin, TX, USA) in the presence of unlabelled NTPs. RPAs were performed as per the manufacturer's instructions (Ambion). Gel-purified antisense radiolabelled cRNA probes were hybridized at 48 °C for 2 h with 20 μg of tcRNA in hybridization solution, after which single-stranded RNA was digested for 30 min at 37 °C with an RNase A/T1 mixture. After ethanol precipitation, the protected fragments were analysed by electrophoresis on 4 % denaturing polyacrylamide gels and vacuum dried. Gels were exposed to a phosphor image screen for 48 h and scanned with a Storm Analyzer. Resulting band intensities were analysed densitometrically through Image Quant (Molecular Dynamics).
RT-PCR of PlGF and VEGF isoforms in near-term placental tissues
RT-PCR was used to identify the presence of PlGF and VEGF isoforms in the placental tcRNA samples. PlGF primers were designed from nucleotide sequences derived from exon 1 as previously described (Cao et al. 1997) and in the 3′-untranslated region (3′-UTR) (Hauser & Weich, 1993). The sense oligonucleotide primer included the flanking sequence of the translation initiation codon of PlGF149 (5′ TGC CGG TCA TGA GGC TGT 3′) and the antisense oligonucleotide primer contained a sequence within the 3′-UTR (5′ GCA GTC ACT GAA GAG TGT GAC 3′). The two primers amplify cDNAs of PlGF149 (440 bp), PlGF170 (503 bp) and PlGF219 (650 bp). The VEGF primers were ovine specific primers as previously published (Matsumoto et al. 2002), designed to flank the insertion/deletion site for alternative splicing. The VEGF RT-PCR was conducted using the sense (5′ TGT AAT GAC GAA AGT CTG CAG 3′) and antisense (5′ TCA CCG CCT CGG CTT GTC ACA 3′) synthetic oligonucleotides. The primers were predicated to amplify the five forms of VEGF-A, VEGF121 (186 bp), VEGF145 (258 bp), VEGF165 (318 bp), VEGF189 (390 bp) and VEGF206 (441 bp).
Five micrograms of tcRNA from each animal were pooled within their respective tissue/treatment group, resulting in four pooled samples: a TN caruncle pool, a HT caruncle pool, a TN cotyledon pool and a HT cotyledon pool. Five micrograms of each of these pooled experimental tcRNA groups and 1 μl (0.5 μg) of oligo (dT) were utilized for each specific tissue/treatment reverse transcriptase (RT) reaction. A negative control, a RT reaction with no tcRNA subjected to PCR, was also performed with each growth factor RT-PCR. Two additional negative controls were used in the PCR reactions, one reaction with RNA and no primers and one reaction without RT product. The PlGF PCR reactions were performed for 35 cycles utilizing 3 μl of RT product (denature: 96 °C for 60 s, annealing: 55 °C for 120 s and extension: 72 °C for 120 s) and then held at 72 °C for a final 10 min extension. VEGF PCR reactions were performed for 35 cycles utilizing 3 μl of RT product (denature: 96 °C for 45 s, annealing: 60 °C for 40 s and extension: 72 °C for 80 s) and then held at 72 °C for a final 10 min extension. An aliquot of the RT-PCR products was fractionated on a 1.5 % agarose gel stained with ethidium bromide. Southern blotting and hybridization with the PlGF and VEGF cDNA probes was conducted to authenticate the PCR products.
Immunoblot determination of placental PlGF and VEGF
Caruncle and cotyledon tissues were homogenized on ice in 50 mM Tris–HCl (pH 7.4), containing 1 mM EDTA, 1 mM EGTA, 0.1 % (v/v) 2-mercaptoethanol, 0.1 mM PMSF and a protease-phosphatase inhibitor cocktail (Sigma Cat No. P8340) at 1:1 000. The homogenate was centrifuged at 14 000 g for 3 min to remove cell debris. Total cellular protein concentration was determined using a modified Lowry assay (DC-protein assay, Bio-Rad, Hercules, CA, USA).
Electrophoresis for PlGF was performed using 50 μg aliquots of homogenate protein in a Bio-Rad Mini-Protean II System (Bio-Rad) using a 14 % Tris-glycine SDS-PAGE gel run in a Laemmli buffer system. Prior to loading, samples were treated as per Bio-Rad's supplied protocol. They were mixed with an equal volume of Laemmli sample buffer (Bio-Rad, Cat. No. 161-0737), 5 % total mercaptoethanol, heated to 95 °C for 5 min and placed on ice for 2 min. Gels were run at 200 V for 1 h. Proteins were transferred to nitrocelluose membrane (Amersham) using Mini Trans-Blot (Bio-Rad) for 1 h at 100 V. The blot was blocked in TBS-T (20 mM Tris.HCl (pH 7.4), 150 mM NaCl, 0.05 % Tween 20 (v/v)) and 5 % NFDM (w/v) overnight at 4 °C.
Detection of PlGF protein was conducted using a rabbit polyclonal antiserum raised against human PlGF (Abcam Cat. No. ab9542, Cambridge, UK). The transferred blot was incubated in antiserum diluted in blocking buffer (1:10 000) for 1 h followed by extensive TBS-T washes and secondary detection using a goat anti rabbit-HRP (Santa Cruz, Cat. No. SC2030, Santa Cruz, CA, USA) in blocking buffer (1:10000), also for 1 h. The blot was washed again, and proteins were visualized by enhanced chemiluminescence (Amersham). The PlGF specific response was confirmed by using two recombinant human PlGF standards (RDI; PlGF-1 (PlGF149) Cat. No. RDI-300-015 and PlGF-2 (PlGF170) Cat. No. RDI-300-019). The relative molecular weights were determined using migration fronts analysis (Hames, 1990). Under reducing conditions the PlGF-1 standard yielded a immunoreactive band at 19 000 Mr (apparent molecular weight) and PlGF-2 at 22 000 Mr. Apparent molecular weight was confirmed by comparison with prestained molecular size markers. Following the first immunodetection, antibodies were removed by incubation in 100 mM 2-mercaptoethanol, 62.5 mM Tris.HCl (pH 6.8) and 2 % (w/v) SDS, at 50 °C for 30 min with slight agitation, and then washed with TBS-T twice for 10 min at room temperature. Lane loading differences were then normalized through determination of the β-actin signal using a primary antiserum (ICN, Cat. No. 691001; Costa Mesa, CA, USA) at a 1:10000 dilution, followed by a donkey anti mouse-HRP (Santa Cruz, Cat. No. SC2314) diluted in blocking buffer at 1:10 000. Blots following each immunodectection were exposed to Hyperfilm (Amersham) for 30 s.
Electrophoresis for VEGF was performed using 50 μg aliquots of homogenate protein as described for PlGF, using 16 % Tris-glycine SDS-PAGE gels. VEGF determination was conducted using a rabbit anti-human VEGF polyclonal antibody (Santa Cruz, Cat. No. SC-152) diluted 1:1000 in buffer for 1 h at room temperature. The blot was then extensively washed with TBS-T at room temperature and incubated for 1 h with goat anti-rabbit-HRP (Santa Cruz, Cat. No. SC2030) diluted in blocking buffer (1:10 000). The blot was washed, and proteins were visualized by enhanced chemiluminescence. The VEGF specific response was confirmed by using three recombinant human VEGF standards (VEGF121: Calbiochem, Cat. No. 676473, San Diego, CA, USA; VEGF165: NeoMarkers, Cat. No. RP-3089-P0, Union City, CA, USA; and VEGF189: Santa Cruz, Cat. No. SC-4045 WB). Apparent molecular weights of the standards and samples were determined using migration fronts analysis (Hames, 1990). Estimated molecular weights, as supplied by the manufacturer, and apparent molecular weights (Mr) from migration front analysis for the standards were 17 000 (18 600) for VEGF121, 20600 (19 100) for VEGF165 and 21 000 (19 800) for VEGF189. Molecular weights were confirmed by comparison with prestained molecular size markers. Normalization was conducted as described for PlGF. Resulting band intensities (PlGF, VEGF and β-actin) were analysed densitometrically through NIH Image (NIH, Bethesda, MD, USA).
Statistical analysis
Differences between CBT, feed and water intakes, breathing rates, umbilical artery resistance indices, placental oxygen and blood flow parameters and slaughter data were determined utilizing unpaired Student's two-tailed t test. Alterations in growth factor mRNA concentration, protein concentration and growth factor receptor mRNA concentration between caruncle and cotyledon tissues within treatments, and the effects of treatment upon caruncle and cotyledon concentrations were analysed by two-way ANOVA (SAS, 1989).
RESULTS
In each treatment group, all ewes were homozygous for low O2 affinity haemoglobin B, except one, which was AB heterozygous. Table 1 presents mean CBT, breathing rate, and feed and water intakes of all ewes prior to removal of the HT group from the environmental chamber at approximately 120 dGA and again at 135 dGA under control TN conditio ns, on the day of study and/or tissue collection. The CBT of ewes in the HT treatment was elevated at 120 dGA (P < 0.002), in agreement with previously published reports (Thureen et al. 1992;Regnault et al. 1999), but was similar to TN (control) animals at time of study and/or tissue collection (TN; 39.2 ± 0.3 °C). The breathing rate of ewes in the HT treatment was increased 8-fold while in treatment (P < 0.001), and this reverted to values comparable to those of TN ewes (TN; 27 ± 4 breaths min−1) once the ewes were housed in TN conditions. Feed and water intakes were constant between the treatment groups and within treatment groups across time, both prior to HT removal and at study and/or tissue collection.
Table 1.
The core body temperature (CBT), breathing rate (breaths min−1), daily feed and water intakes of TN and HT ewes prior to end of HT exposure time period at 120 dGA and at study/tissue collection at 135 dGA
| TN | HT | P value | |
|---|---|---|---|
| Prior to HT removal at 120 dGA | |||
| CBT (°C) | 39.1 ± 0.1 | 40.3 ± 0.2 | < 0.002 |
| Breathing rate (breaths min−1) | 17.8 ± 5.2 | 133.8 ± 16.3 | < 0.001 |
| Feed intake (kg) | 1.10 ± 0.04 | 1.00 ± 0.08 | n.s. |
| Water intake (1) | 5.8 + 1.1 | 9.0 ± 1.10 | n.s. |
| At study/tissue collection at 135 dGA | |||
| CBT (°C) | 39.20 ± 0.03 | 39.00 ± 0.08 | n.s. |
| Breathing rate (breaths min−1) | 27.0 ± 3.6 | 39.3 ± 5.3 | n.s. |
| Feed intake (kg) | 1.23 ± 0.07 | 1.00 ± 0.10 | n.s. |
| Water intake (1) | 5.0 ± 0.4 | 4.0 ± 0.4 | n.s. |
Data are means ± s.e.m. for six TN (Control) and ten HT ewes. P determined by unpaired Student's t test. n.s., not significant (P > 0.05).
Placental and fetal tissue weight comparisons and placental resistance indices
Compared to the control (TN) animals, the HT-exposed animals demonstrated significant reductions in both placental (190.50 ± 28.95 g vs. 388.74 ± 47.52 g; P < 0.005) and fetal weights (1989.07 ± 252.47 g vs. 3435 ± 150.33 g; P < 0.002, Table 2) at 135 dGA. These reductions were equivalent to a 50 % reduction in placental weight and a 40 % reduction in fetal weight. The brain/liver weight ratio was increased in HT fetuses (P < 0.03, Table 2), while the ponderal index was not different between the two groups.
Table 2.
Age, placental and fetal weights, brain/liver and ponderal indices of collected pregnancies at 135 dGA
| TN | HT | P value | |
|---|---|---|---|
| Gestational age (days) | 133 ± 1 | 134 ± 1 | n.s. |
| Placental weight (g) | 388.74 ± 47.52 | 190.50 ± 28.95 | < 0.005 |
| Fetal weight (g) | 3435.68 ± 150.33 | 1989.07 ± 252.47 | < 0.002 |
| Brain/liver ratio | 0.40 ± 0.02 | 0.85 ± 0.14 | < 0.03 |
| Ponderal index (fetal wt (g)/CRL (cm)3) | 2.51 ± 0.59 | 2.60 ± 0.31 | n.s. |
Data are means ± s.e.m. for six TN (Control) and ten HT (FGR) fetuses. P determined by unpaired Student's t test. n.s., not significant (P > 0.05).
Figure 1 presents the umbilical artery resistance indices. All three calculations of resistance were increased in HT pregnancies, Umb S/D 1.8-fold (P < 0.005), Umb PI 1.9- fold (P < 0.01) and Umb RI 1.6-fold (P < 0.005). These increased values are indicative of increased resistance to blood flow downstream from the sampling site in the umbilical artery, within the placental vascular bed.
Figure 1.
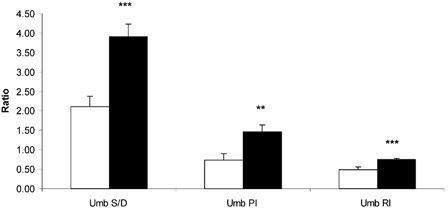
Umbilical arterial systolic/diastolic (Umb S/D), umbilical placental resistance (Umb PI) and umbilical resistance index (Umb RI) in TN (□) and HT (▪) pregnancies, determined following HT treatment. ** P < 0.01, *** P < 0.005, between-treatment comparisons.
Uterine and umbilical blood flows, ethanol clearance and fetal and uteroplacental oxygenation
Uterine blood flows were all significantly increased when expressed per kg conceptus, per 100 g placenta or per kg fetus in HT-exposed ewes (Table 3). Umbilical blood flow (ml min−1) was reduced in the HT group (P < 0.004, Table 3), and umbilical blood flow per 100 g placenta was also depressed, though not significantly. The uterine/umbilical blood flow ratio was increased approximately 2-fold (TN vs. HT, 2.28 ± 0.45 vs. 3.94 ± 0.35, P < 0.03, Table 3). Ethanol clearance per unit mass of placenta or fetus was not significantly altered (Table 3).
Table 3.
Uterine and umbilical blood flow and placental clearance of ethanol in HT-exposed pregnancies (HT for 80 days from ∼40 to 120 dGA), studied under control (TN) conditions 15 days after removal from treatment
| TN | HT | P value | |
|---|---|---|---|
| UtBF (ml min−1) | 1517.24 ± 126.01 | 1123.54 ± 128.12 | n.s. (P < 0.07) |
| UtBF/wt conceptus (ml min−1 kg−1) | 346.74 ± 28.18 | 471.40 ± 35.53 | < 0.03 |
| UtBF/100 g placenta (ml min−1 (100 g placenta)−1) | 410.51 ± 51.75 | 655.88 ± 59.88 | < 0.02 |
| UtBF/kg fetus (ml min−1 (kg fetus)−1) | 443.17 ± 37.39 | 610.86 ± 48.48 | < 0.04 |
| Ut plasma flow/kg fetus (ml min−1 (kg fetus)−1) | 322.49 ± 33.07 | 413.05 ± 20.38 | < 0.05 |
| UmbBF (ml min−1) | 728.14 ± 105.59 | 288.24 ± 49.27 | < 0.004 |
| UmbBF/100 g placenta (ml min−1 (100 g placenta)−1) | 196.16 ± 33.47 | 162.94 ± 9.87 | n.s. |
| UmbBF/kg fetus (ml min−1 (kg fetus)−1) | 209.55 ± 24.73 | 145.90 ± 10.32 | < 0.04 |
| Umb plasma flow/kg fetus (ml min−1 (kg fetus)−1) | 141.49 ± 16.16 | 92.64 ± 4.50 | < 0.03 |
| UtBF-to-UmbBF ratio | 2.28 ± 0.45 | 3.94 ± 0.35 | < 0.03 |
| EtOH clearance (ml min−1)* | 334.20 ± 24.84 | 178.26 ± 24.62 | < 0.02 |
| EtOH clearance/100 g placenta (ml min−1 (100 g placenta)−1) | 75.53 ± 2.40 | 100.18 ± 6.83 | n.s. |
| EtOH clearance/kg fetus (ml min−1 (kg fetus)−1) | 98.10 ± 5.81 | 92.71 ± 3.83 | n.s. |
Data are means ± s.e.m. for five TN (Control) and seven HT (FGR) pregnancies. P values were determined by unpaired Student's t test. n.s. not significant (P > 0.05). UtBF, uterine blood flow; wt conceptus, sum of uterine, placenta and fetus weights; UmbBF, umbilical blood flow; placental and fetal weights. EtOH, ethanol.
EtOH clearance calculations calculated on three animals in TN group.
Maternal uterine vein oxygen content and saturation were significantly greater in HT than TN ewes (P < 0.05 and P < 0.02, respectively, Table 4), similar to increases in PO2 values (P < 0.004, Table 4). The uterine arteriovenous difference for oxygen content was greater in the TN pregnancies (TN vs. HT, 1.17 ± 0.15 vs. 0.76 ± 0.06, P < 0.06), whereas maternal haematocrit was similar in both groups. HT umbilical vein and fetal pedal artery displayed increased oxygen capacity levels, associated with an increased haematocrit (Table 4). Fetal arterial and umbilical venous PO2 were reduced in HT pregnancies (P < 0.005 and P < 0.09, respectively, Table 4). Fetal arterial O2 content and saturation were both reduced in the HT fetus (P < 0.03 and P < 0.01, respectively; Table 4), while fetal pH, lactate and HCO3− values were not different between the treatments (Table 4).
Table 4.
Effect of HT exposure for 80 days (40–120 dGA) on maternal and fetal oxygenation, uteroplacental oxygenation and fetal acid-base status when studied under TN conditions at 135 dGA
| TN | HT | P value | |
|---|---|---|---|
| Maternal artery | |||
| Oxygen capacity (mM) | 5.59 ± 0.42 | 6.09 ± 0.23 | n.s. |
| Hct | 0.28 ± 0.02 | 0.31 ± 0.01 | n.s. |
| O2 content (mM) | 4.98 ± 0.37 | 5.31 ± 0.19 | n.s. |
| O2 saturation (%) | 90.58 ± 0.94 | 90.44 ± 0.75 | n.s. |
| PO2 (mmHg) | 82.54 ± 2.70 | 84.48 ± 2.07 | n.s. |
| Uterine vein | |||
| O2 content (mM) | 3.81 ± 0.26 | 4.55 ± 0.19 | < 0.05 |
| O2 saturation (%) | 69.46 ± 1.70 | 75.94 ± 1.49 | < 0.02 |
| PO2 (mmHg) | 52.89 ± 1.26 | 58.13 ± 1.00 | < 0.004 |
| Umbilical vein* | |||
| Oxygen capacity (HIM) | 5.91 ± 0.13 | 6.95 ± 0.25 | < 0.02 |
| Hct | 0.33 ± 0.01 | 0.39 ± 0.02 | < 0.04 |
| PH | 7.38 ± 0.01 | 7.36 ± 0.03 | n.s. |
| O2 content (mM) | 4.25 ± 0.14 | 3.79 ± 0.38 | n.s. |
| O2 saturation (%) | 76.55 ± 2.74 | 58.23 ± 6.38 | n.s. |
| PO2 (mmHg) | 29.38 ± 2.65 | 22.20 ± 2.11 | n.s. |
| PCO2 (mmHg) | 45.28 ± 3.17 | 44.47 ± 0.58 | n.s. |
| [HCO3−] (mM) | 25.59 ± 1.52 | 24.78 ± 1.78 | n.s. |
| [Lactate] (mM) | 2.12 ± 0.19 | 3.96 ± 1.27 | n.s. |
| Fetal artery | |||
| Oxygen capacity (mM) | 5.88 ± 0.16 | 7.07 ± 0.30 | < 0.02 |
| Hct | 0.32 ± 0.01 | 0.40 ± 0.01 | < 0.005 |
| pH | 7.35 ± 0.01 | 7.33 ± 0.02 | n.s. |
| O2 content (mM) | 2.47 ± 0.13 | 1.58 ± 0.27 | < 0.03 |
| O2 saturation (%) | 44.19 ± 2.35 | 25.73 ± 4.08 | < 0.01 |
| PO2 (mmHg) | 18.65 ± 1.16 | 12.79 ± 0.97 | < 0.005 |
| PCO2 (mmHg) | 52.72 ± 3.92 | 51.81 ± 1.17 | n.s. |
| [HCO3−] (mM) | 27.19 ± 1.89 | 26.56 ± 1.51 | n.s. |
| [Lactate] (mM) | 1.98 ± 0.17 | 3.63 ± 1.11 | n.s. |
Data are means ± s.e.m. for five TN (Control) and seven HT (FGR) pregnancies. Hct, haematocrit. P determined by unpaired Student's t test, n.s., not significant (P > 0.05).
Measurements on five HT fetuses.
The transplacental PO2 and PCO2 gradients (Δ) were calculated as the difference between uterine vein and umbilical vein PO2 and PCO2, respectively (Table 5). Though the PCO2 gradient was not affected by treatment, the PO2 gradient was significantly increased in the HT pregnancies (P < 0.01, Table 5 and Fig. 2). Uterine and umbilical oxygen uptakes were decreased in HT pregnancies (P < 0.03 and P < 0.05, respectively, Table 5). The percentage uterine oxygen extraction was decreased in HT pregnancies (P < 0.007, Table 5), a consequence of a high rate of flow of maternal O2 to the pregnant uterus (i.e. arterial O2 content × blood flow) in relation to uterine O2 uptake. However, oxygen uptake per unit weight was not different between TN and HT groups for uterine, umbilical or uteroplacental units (Table 5).
Table 5.
Effect of HT exposure for 80 days (40–120 dGA) on uterine vein-umbilical vein PO2 and PCO2 differences, and umbilical and uteroplacental oxygen uptake when studied under TN conditions at 135 dGA
| TN | HT | P value | |
|---|---|---|---|
| Uterine vein–umbilical vein | |||
| ΔPO2 | 23.92 ± 1.91 | 37.02 ± 2.76 | < 0.01 |
| ΔPCO2 | −5.02 ± 1.3 | −5.60 ± 0.61 | n.s. |
| Uterine O2 uptake | |||
| mM min−1 | 1.81 ± 0.29 | 0.94 ± 0.16 | < 0.03 |
| mM min−1 (kg fetus)−1 | 0.52 ± 0.06 | 0.48 ± 0.03 | n.s. |
| mM min−1 (100 g placenta)−1 | 0.48 ± 0.06 | 0.52 ± 0.04 | n.s. |
| Uterine O2 extraction | |||
| % | 23.19 ± 1.77 | 15.69 ± 1.27 | < 0.007 |
| Umbilical O2 uptake* | |||
| mM min−1 | 1.18 ± 010 | 0.71 ± 0.14 | < 0.05 |
| mM min−1 (kg fetus)−1 | 0.34 ± 0.01 | 0.33 ± 0.03 | n.s. |
| mM min−1 (100 g placenta)−1 | 0.32 ± 0.04 | 0.34 ± 0.03 | n.s. |
| Uteroplacental O2 uptake* | |||
| mM min−1 | 0.64 ± 0.20 | 0.29 ± 0.06 | n.s. |
| mM min−1 (100 g placenta)−1 | 0.16 ± 0.04 | 0.15 ± 0.02 | n.s. |
Data are means ± s.e.m. for five TN (Control) and seven HT (FGR) pregnancies. P determined by unpaired Student's t test. n.s., not significant (P > 0.05).
Measurements in five HT pregnancies.
Figure 2.

Comparison of uterine venous and umbilical venous PO2 and PCO2 differences in TN (□) and HT (▪) pregnancies. ** P < 0.01, between-treatment comparisons.
Expression of PlGF, VEGF, VEGR-1 and VEGFR-2 in placenta tissues
A single major PlGF transcript of approximately 1.7 kb was expressed in both maternal caruncle and fetal cotyledon tissues at 135 dGA. The concentration of PlGF mRNA was greater in TN fetal cotyledon tissue than in caruncle tissue (P < 0.0008, Fig. 3A). The HT caruncle PlGF mRNA concentration was increased over that of the TN caruncle concentration (P < 0.02, Fig. 3A). In both placental tissues a major VEGF transcript of approximately 3.7 kb was expressed. Similar to PlGF mRNA tissue concentrations, the VEGF mRNA caruncle concentration was less than that observed in TN cotyledon tissue (P < 0.03, Fig. 3B). HT cotyledon tissues had a reduced concentration of VEGF mRNA compared to TN cotyledon tissues (P < 0.03, Fig. 3B). The VEGFR-1 mRNA concentration was greater in TN cotyledon tissues than in TN caruncle (P < 0.001, Fig. 4A), though in HT cotyledon tissues it was reduced 50 % (P < 0.0002, Fig. 4A). The concentration of VEGFR-2 mRNA was consistent across treatments within tissue type (Fig. 4B).
Figure 3.

Concentration of ovine PlGF mRNA (A) and VEGF mRNA (B) (GF/actin mRNA densitometry units) in TN (□) and HT (▪) maternal caruncle and fetal cotyledon tissues at 135 dGA.
Figure 4.

Concentration of ovine VEGFR-1 mRNA (A) and VEGFR-2 mRNA (B) (VEGFR/actin mRNA densitometry units) in TN (□) and HT (▪) maternal caruncle and fetal cotyledon tissues at 135 dGA.
RT-PCR determination of placental PlGF and VEGF isoforms
Analysis of the PlGF RT-PCR reaction products by agarose gel electrophoresis revealed two bands (Fig. 5A), corresponding to PlGF149 (440 bp) and PlGF170 (510 bp). The isoforms PlGF149 and PlGF170 were found in both caruncle and cotyledon tissue, and this was confirmed by Southern blot hybridization. Three major bands for VEGF (Fig. 5B) corresponding to VEGF121 (186 bp), VEGF165 (318 bp), and VEGF189 (390 bp) were observed, and Southern blot hybridization confirmed these results. Negative controls yielded no result.
Figure 5.

RT-PCR amplification demonstrates PlGF (A) and VEGF (B) isoform expression in pooled 135 dGA TN and HT caruncle and cotyledon samples.
Immunoblot analysis of placental PlGF and VEGF
Using two commercially available PlGF standards (PlGF149 and PlGF170), a single dominant band for each standard was observed (Fig. 6A), and migration analysis confirmed these bands to be approximately 19 000 and 22 000 Mr, equivalent to monomers of PlGF149 and PlGF170, respectively. Tissue samples displayed a band with an approximate Mr of 19 000, equivalent to PlGF149 (Fig. 6A). In the collected tissue of TN placentae, caruncle PlGF149 protein was greater than in cotyledon tissues (P < 0.0006, Fig. 7A). While cotyledon PlGF149 concentrations were consistent between treatments, PlGF was elevated in the HT caruncle tissue (P < 0.04, Fig. 7A). To determine the VEGF isoforms in placental tissues, a rabbit anti-human VEGF polyclonal antibody was used to determine the presence of the three VEGF isoforms VEGF189, VEGF165 and VEGF121, together with three commercially available standards. Single immunoreactive signals were observed for VEGF189 and VEGF165 standards, but two bands were observed for the VEGF121 standard (Fig. 6B). Migration analysis was conducted on three separate occasions and the apparent molecular weights of the immunoreactive signals were determined to be approximately 19 800, 19 100, and 18 600 and 17 700 Mr for VEGF189, VEGF165 and the two bands of VEGF121, respectively. Information from the supplier indicated that the double bands observed with VEGF121, were due to either degradation or differential glycosylation properties, and that the band at 18 600 Mr was VEGF121. In tissue samples, a single predominant signal was observed at an estimated molecular weight of 18 600 Mr, corresponding to the VEGF121 recombinant standard. VEGF121 was equally present in TN caruncle and cotyledon tissues, though in HT cotyledon it was decreased (P < 0.05, Fig. 7B) compared to TN cotyledon tissue.
Figure 6.

Representative immunoblots of PlGF standards, PlGF149 and PlGF170 (A), and VEGF standards, VEGF121, VEGF165 and VEGF189 (B), and representative immunoblots of PlGF and VEGF in pooled placental (caruncle and cotyledon) samples.
Figure 7.

Ovine PlGF (A) and VEGF (B) protein measured by Western immunoblot (GF/Actin) in TN (□) and HT (▪) maternal caruncle and fetal cotyledon tissues at 135 dGA.
DISCUSSION
The present study shows that in FGR pregnancies, generated by exposure to a HT environment for 80 days of gestation, an increased transplacental oxygen diffusion gradient occurred in conjunction with alterations in the placental expression of members of the VEGF family. Furthermore, these changes occurred in association with a significant increase of the uterine/umbilical blood flow ratio and increased fetal umbilical arterial vascular impedance indices.
The formation of a vascular network throughout the villous from pre-existing blood vessels is a complex multistep process, resulting from an interaction between angiogenic peptides and their respective receptors (Folkman & Klagsburn, 1987; Iruela-Arispe & Dvorak, 1997). The development of the placental vascular villous tree is regulated by a number of growth factors, of which the VEGF growth factor family has been extensively studied (see reviews by Ahmed & Perkins, 2000; Ong et al. 2000; Regnault et al. 2002a), and the differential expression of PlGF and VEGF throughout gestation suggests that both these growth factors play a role in placental angiogenesis. The interactions between oxygen partial pressure (PO2), vascular cell types and the regulation of cellular responses, such as growth factor and receptor expression, lead to the development of a low resistance placental vascular network. Placental blood vessel development is divided into two phases, branching and non-branching angiogenesis. Branching angiogenesis occurs during the early phases of gestation under relatively hypoxic conditions and is responsible for the expansion of the pre-existing vascular bed, a process postulated to be driven by VEGF. Non-branching angiogenesis, on the other hand, promotes the elongation of pre-existing capillary loops and occurs later in gestation under the influence of PlGF (Benirschke & Kaufmann, 2000). The balance of these two growth factors throughout gestation is responsible for the formation of the normal placenta. Recently, a number of different villous morphologies have been documented in association with altered states of placental oxygenation. For example, the villous structure observed from FGR placentae that develop under maternal hypoxia, as in pregnancy at altitude, are characterized by increased branching angiogenesis and a reduced vascular impedance (Ali et al. 1996; Kingdom & Kaufmann, 1997). In contrast, those placentae of severe FGR pregnancies, characterized by AEDF in the umbilical artery and an increased vascular impedance, are associated with a predominance of non-branching angiogenesis (Ahmed & Perkins, 2000; Kingdom et al. 2000). Kingdom and colleagues have proposed that there are two alternative pathways by which these FGR villous structures develop. It is proposed that villous development with excessive branching-type angiogenesis, as a result of an elevated VEGF concentration in relation to PlGF, develop in situations of intraplacental hypoxia. On the other hand, non-branching angiogenesis becomes the dominant form of angiogenesis where there is an increase in the intraplacental oxygen concentration and PlGF is thought to dominate (Kingdom & Kaufmann, 1997; Benirschke & Kaufmann, 2000; Kingdom et al. 2000).
The increasing oxygen requirements of the placenta and fetus as pregnancy advances are met through increases in uterine perfusion and oxygen extraction. In the FGR pregnancies studied in this report, maternal uterine blood flow was increased, though uterine O2 extraction was depressed. The changes observed in uterine venous PO2 are especially interesting as these are similar to those observed in human FGR pregnancies (Pardi et al. 1992). The changes reported here suggest that increases in uterine blood flow and venous PO2 are related to a reduced oxygen diffusion capacity of the FGR placenta. Furthermore, under normal physiological conditions a uterine/umbilical flow ratio of two is observed in the near-term pregnant sheep. In the HT-exposed ewes, the uterine/umbilical blood flow ratio increased almost 2-fold, from 2.28 to 3.94, similar to other reports (Thureen et al. 1992), further demonstrating the compromised diffusing capacity of the placenta. The relationship between blood flow, the uterine arteriovenous difference for oxygen and the diffusing capacity of the placenta leads to the development of the transplacental PO2 gradient (Wilkening & Meschia, 1991). This gradient, approximately 24 mmHg in the TN ewes, maintains an umbilical oxygen uptake of approximately 0.32 mM min−1 (100 g placenta)−1 and a fetal arterial PO2 of 19 mmHg. Our studies demonstrate that despite an increased transplacental PO2 gradient of almost 30 % (37 mmHg) in the HT animals, the flux of oxygen across the placenta is similar to control animals. The fact that umbilical and uteroplacental oxygen uptake is unchanged, despite increases in uterine blood flow and transplacental O2 gradient, further suggest that the oxygen diffusing capacity of the HT placenta is severely compromised. We speculate that in fetal growth restriction, secondary to placental insufficiency, there is a reduction in the placental oxygen diffusing capacity which requires a compensatory increase in the PO2 gradient to drive and maintain oxygen movement from mother to fetus at normal uptakes per unit tissue.
The significantly elevated uterine vein PO2 represents a site of increased oxygen tension within the maternal placental vasculature. Our data demonstrate that these changes occur concomitantly with changes in angiogenic factor expression. Our RT-PCR analysis displayed two forms of PlGF, PlGF149 and PlGF170, and Northern blot hybridization analysis confirmed both placental tissues as a site of PlGF transcription. We demonstrated a significantly elevated concentration of PlGF mRNA in the HT caruncle compared to the TN caruncle, and immunoblot analysis demonstrated it to be PlGF149. Placental PlGF protein has been reported in human tissues over gestation and in early to mid-pregnancy in sheep placenta (Khaliq et al. 1999; Regnault et al. 2002b). The elevated levels of PlGF149 seen in our studies and the interactions observed between PlGF149 and trophoblast and endothelium have been related to failed angiogenesis in the terminal villi of human placenta (Khaliq et al. 1999). Our data demonstrate that increased PlGF149 levels, within the maternal component of the placenta, are associated with an increased uterine blood flow and increased PO2. These changes in flow and PO2 are most likely the result of a reduced total placenta mass and a developing impairment of oxygen diffusion. It should be noted that implicit in the hypothesis that increased PlGF expression results from a PO2 increase is the assumption that PlGF expression responds to very small PO2 changes in vivo, since in the present FGR model, uterine venous PO2 was only 6 mmHg higher than in the TN situation. The mechanisms for this increased PlGF in terms of maternal caruncle vessel development await further investigation.
VEGF mRNA and protein (VEGF121) were detected in both caruncle and cotyledon tissues. Both mRNA concentration and protein levels in the cotyledon were reduced in HT placentae, when compared to control tissues, whilst the caruncle expression and protein content of VEGF were not altered. Analysis of various cDNA libraries obtained from cells and tissues reveal multiple forms of VEGF transcripts in varying ratios, with placental libraries containing mainly VEGF121 (Houck et al. 1991; Ferrara et al. 1992). With RT-PCR and Southern blot analysis (data not shown), we observed the expression of three alternative splice variants of VEGF-A, VEGF121, VEGF165 and VEGF189, in both placental tissues and in both treatment groups. The antibody used in our experiments recognizes the three forms of VEGF, and a predominant signal was observed at an estimated molecular weight of 18600 Mr in tissue samples. This pattern is similar to the VEGF121 standard and that reported for human 293 VEGF121 transfected cell lysates, U-251 preparations and ovine fetoplacental artery endothelial cells (Ferrara et al. 1991b; Shiraishi et al. 1996; Tsoi et al. 2002). The lack of VEGF165 detection in our Western blot analysis is puzzling. RT-PCR reactions strongly suggest the abundant presence of VEGF165 mRNA, and other investigators have made this observation for ovine placental tissues (Bogic et al. 2000). We conclude that the immunoreactive band detected in our samples represents a mixture of the short alternatively spliced form of VEGF, VEGF121, and possibly also VEGF165 decarboxylation/deglycosylation products.
The sheep cotyledon consists of the fused syncytium and the villous tree, the latter being analogous to the human placental villous tree (Leiser et al. 1997). As a percentage of the total placenta (caruncle and cotyledon), it represents approximately 80 % of the tissue in both TN and HT placentae (authors' unpublished data). In the HT or FGR placenta, this tissue is perfused by hypoxic fetal blood when compared to the TN placenta (TN vs. HT fetal arterial PO2, 18.65 vs. 12.79 mmHg). Under hypoxic conditions, placental expression of VEGF is up-regulated (Taylor et al. 1997; Sharkey et al. 2000). However, we observed significant decreases in cotyledonary VEGF mRNA and protein. We propose that in the cotyledon, despite a hypoxic perfusion (the result of a decreased diffusing capacity), the majority of the cotyledon tissue is not hypoxic, as evidenced by decreased VEGF levels and increased PlGF at the fetomaternal interface. In addition to changes in oxygen tension within the cotyledon, VEGF expression is influenced by the acquisition of steroidogenic activity and the presence of steroids such as progesterone (Shweiki et al. 1993; Sone et al. 1996). In human and sheep FGR pregnancies placental steroid levels are reduced (Nieto-Diaz et al. 1996; Regnault et al. 1999), possibly influencing growth factor expression in the cotyledon.
The tyrosine receptors VEGFR-1 and VEGFR-2 are found in the placental vasculature, and are expressed on both endothelial and non-endothelial cells (Vuorela et al. 1997; Dunk & Ahmed, 2001). Similar to PlGF and VEGF, they are differentially expressed throughout pregnancy, VEGFR-2 early in gestation and VEGFR-1 during the later part. This differential pattern of expression, and the specific binding relationships that exist between the ligands and receptors, may promote specific periods of PlGF- and VEGF-induced placental angiogenesis. During early and mid-gestation, the interactions of VEGF with VEGFR-1 promote endothelial tube formation, while its interactions with VEGFR-2 stimulate cell proliferation (Breier, 2000). These two events are associated with increased branching angiogenesis (Kingdom et al. 2000). An increase in PlGF levels, together with its exclusive binding to VEGFR-1 (Barleon et al. 1994; Vuorela et al. 1997), promotes tube formation (Wilting et al. 1993) and terminal villi development, supporting a change from branching to non-branching angiogenesis (Kingdom et al. 2000). The switch between these two forms of angiogenesis may occur as early as towards the end of the first third of gestation. Studies examining the expression of VEGF positive cells and capillary development in human placentae highlight that at 16 weeks, the VEGF/capillary area ratio changes significantly (Shiraishi et al. 1996), suggesting that the role of VEGF and its receptor in capillary area development declines, giving way to increasing amounts of PlGF and VEGFR-1.
VEGFR-1 and VEGFR-2 are reported to be up-regulated by hypoxia (Tuder et al. 1995; Brogi et al. 1996; Waltenberger et al. 1996), similar to VEGF. Previously we have reported declines in both receptors in the sheep FGR placenta towards the end of the 2nd third of pregnancy (Regnault et al. 2002b). As a result of reduced VEGFR-1 and VEGFR-2 expression in the HT placenta, both migration and proliferation of vascular cells may be altered at this time, leading to alterations in fetal placental vascular development. The result of this down-regulation may be restricted angiogenic development, during mid-pregnancy in a developing FGR pregnancy, to reduce the angiogenic responsiveness of the fetal vasculature under unfavourable conditions. In the current studies in the near-term HT cotyledon, VEGFR-1 mRNA is again depressed, while the VEGFR-2 concentration is maintained. This outcome suggests that, while in other tissues both receptors respond to changing oxygen tension in a similar manner (Tuder et al. 1995), in cotyledon tissue the receptors behave differently. Therefore, the decline in cotyledon VEGFR-1 could be evidence that this receptor responds to oxygen changes in a similar manner to VEGF, being stimulated in hypoxic conditions but suppressed in conditions associated with elevated oxygen tensions. While elevated uterine PO2 increases maternal PlGF mRNA, cotyledonary VEGFR-1 expression is decreased under the increased transplacental oxygen gradient that develops across the placenta. We postulate that under this regime, expected non-branching angiogenesis would be disrupted. The decreased VEGFR-1 in late gestation is particularly important as the homozygous disruption of VEGFR-1, while allowing normal vascular endothelial differentiation and development to occur, leads to a failure to assemble normal vascular channels (Fong et al. 1995; Bernatchez et al. 1999). Of additional interest is the observation that in cultures of retinal endothelial cells, a system where only VEGFR-2 is detected, hypoxic conditions initially suppress VEGFR-2 mRNA concentrations, and this suppression is reversed by reinstitution of normoxia (Takagi et al. 1996). Thus, in the HT placenta, the stable expression of VEGFR-2 could be interpreted as indicative of an environment that is not hypoxic.
Fetal blood flow is critically dependent on the normal development of the villous tree structure and the final development of the terminal villi. In human pregnancies, AEDF in pregnancy is normal until approximately 14-16 weeks, at which time end-diastolic flow progressively increases (Hendricks et al. 1989; Adamson, 1999). The resultant decrease in the systolic/diastolic velocity ratio and pulsatility index (Reuwer et al. 1984; Trudinger et al. 1985) suggests a fall in fetoplacental vascular resistance as gestation advances, associated with a normal angiogenic development. A similar decrease in resistance in the umbilical circulation in normal sheep pregnancies has been reported (Barbera et al. 1995; Galan et al. 1998). Using stereological techniques, reduced villous development is suggested to contribute to abnormal umbilical artery blood flow in humans (Jackson et al. 1995). Reduced vascularization of the intermediate and terminal villi is postulated to lead to increased fetoplacental impedance, as measured by reduced or AEDF in the umbilical arteries of human and sheep FGR pregnancies (Giles et al. 1985; Trudinger et al. 1987). The reduced umbilical blood flow observed in HT pregnancies demonstrates a fetal placental vascular bed of disproportionately small size and high resistance. In addition, increases in the placental resistance indices all support the concept of an altered vascular bed in this model of FGR.
Progressive embolization of the sheep placenta can replicate AEDF as observed in severely growth-restricted human fetuses (Morrow et al. 1989). Embolization reportedly decreases the number of perfused villi and the area available for gas exchange, being reflected by decreased fetal arterial oxygen content, supporting the idea that a reduction in the number of small placental arteries is responsible for an increase in resistance (Morrow et al. 1989). However, further stereological studies and studies using plastic cast and scanning electron microscope techniques suggest that increased placental vascular impedance is associated with a more global reduction in vascularity (Jackson et al. 1995; Krebs et al. 1996; Macara et al. 1996). Reduced villous tree elaboration and maternal thrombosis surrounding peripheral villi could contribute to reduced substrate exchange surface areas and impeded exchange.
Perspectives
The change in conceptus oxygenation in FGR and its possible effects on growth factor expression and vascular impedance are illustrated in Fig. 8. Near term, angiogenic growth factors play a major role in the development of placental vasculature. Their activities are regulated by placental oxygen tensions, and this in turn is determined by interactions that have occurred over the course of gestation. In previous work we have demonstrated that elevated HT cotyledon VEGF mRNA early in gestation may play a direct role in the acute modulation of normal placental angiogenesis during a period of maximal placental development. Decreased cotyledon expression of VEGFR-1 and VEGFR-2 mRNA later in gestation (under continued HT conditions) may limit placental growth and/or be an adaptation to alterations that have occurred within the fetal vasculature earlier in gestation. In the present studies we document a significantly increased uterine blood flow and transplacental PO2 gradient. These changes serve to maintain fetal oxygen uptake, despite the observation of impaired placental oxygen diffusing capacity and possibly a reduced and/or disorganized fetal vascular arrangement. Furthermore, the development of the increased transplacental oxygen gradient in FGR may cause a switch to early and sustained PlGF dominance over VEGF in the placenta tissues. This, together with changes in VEGFR-1, could result in a decrease in branching angiogenesis within the terminal villi of the cotyledon, leading to increased placental vascular resistance. These alterations, together with conceptus adaptations, may constitute an underlying component of placental insufficiency and FGR near term.
Figure 8.

Schematic representation of fetal and uteroplacental oxygenation and blood flows in TN (Control) and HT (FGR) pregnancies at 135 dGA, together with the observed changes in PlGF, VEGF and VEGFR-1 mRNA concentrations. The PO2 values (mmHg) for maternal artery (MA), uterine vein (UtV), fetal pedal artery (Fa) and umbilical vein (Umbv) are presented, as are uterine and umbilical blood flows per 100 g of placenta. P determined by unpaired Student's t test, * P < 0.01 and *** P < 0.005, between-treatment comparisons.
Acknowledgments
We are very grateful to Willie Jones, David Caprio and his laboratory staff and to I-Da and Yu-Ching Fan for their technical support, and we thank Dr Gary Zerbe for his assistance in statistical analysis of the data. This work was supported through NIH-NICHD HD20761 and the Ter Meulen Fund, Royal Dutch Academy of Arts and Sciences supported Dr Barbra de Vrijer. We are also very grateful to Dr Giacomo Meschia for helpful and insightful discussions and to Dr Thomas Parker for review of this manuscript.
REFERENCES
- Adamson SL. Arterial pressure, vascular input impedance, and resistance as determinants of pulsatile blood flow in the umbilical artery. Eur J Obstet Gynecol Reprod Biol. 1999;84:119–125. doi: 10.1016/s0301-2115(98)00320-0. [DOI] [PubMed] [Google Scholar]
- Ahmed A, Dunk C, Ahmad S, Khaliq A. Regulation of placental vascular endothelial growth factor (VEGF) and placenta growth factor (PIGF) and soluble Flt-1 by oxygen-a review. Placenta. 2000;21(suppl A):S16–S24. doi: 10.1053/plac.1999.0524. [DOI] [PubMed] [Google Scholar]
- Ahmed A, Perkins J. Angiogenesis and intrauterine growth restriction. Best Pract Res Clin Obstet Gynaecol. 2000;14:981–998. doi: 10.1053/beog.2000.0139. [DOI] [PubMed] [Google Scholar]
- Ali KZ, Burton GJ, Morad N, Ali ME. Does hypercapillarization influence the branching pattern of terminal villi in the human placenta at high altitude. Placenta. 1996;17:677–682. doi: 10.1016/s0143-4004(96)80018-x. [DOI] [PubMed] [Google Scholar]
- Barbera A, Jones OW, Zerbe GO, Hobbins JC, Battaglia PC, Meschia G. Early ultrasonographic detection of fetal retardation in an ovine model of placental insufficiency. Am J Obstet Gynecol. 1995;173:1071–1074. doi: 10.1016/0002-9378(95)91328-9. [DOI] [PubMed] [Google Scholar]
- Barleon B, Hauser S, Schollmann C, Weindel K, Marme D, Yayon A, Weich HA. Differential expression of the two VEGF receptors flt and KDR in placenta and vascular endothelial cells. J Cell Biochem. 1994;54:56–66. doi: 10.1002/jcb.240540107. [DOI] [PubMed] [Google Scholar]
- Bell AW, Wilkening RB, Meschia G. Some aspects of placental function in chronically heat-stressed ewes. J Dev Physiol. 1987;9:17–29. [PubMed] [Google Scholar]
- Benirschke K, Kaufmann P. Pathology of the Human Placenta. London: Springer Verlag; 2000. Architecture of normal villous trees; pp. 116–154. [Google Scholar]
- Bernatchez PN, Soker S, Sirois MG. Vascular endothelial growth factor effect on endothelial cell proliferation, migration, and platelet-activating factor synthesis is Flk-1-dependent. J Biol Chem. 1999;274:31047–31054. doi: 10.1074/jbc.274.43.31047. [DOI] [PubMed] [Google Scholar]
- Bogic LV, Brace RA, Cheung CY. Cellular localization of vascular endothelial growth factor in ovine placenta and fetal membranes. Placenta. 2000;21:203–209. doi: 10.1053/plac.1999.0467. [DOI] [PubMed] [Google Scholar]
- Bonds DR, Anderson S, Meschia G. Transplacental diffusion of ethanol under steady state conditions. J Dev Physiol. 1980;2:409–416. [PubMed] [Google Scholar]
- Breier G. Angiogenesis in embryonic development-a review. Placenta. 2000;21(suppl A):S11–S15. doi: 10.1053/plac.1999.0525. [DOI] [PubMed] [Google Scholar]
- Brogi E, Schatteman G, Wu T, Kim EA, Varticovski L, Keyt B, Isner JM. Hypoxia-induced paracrine regulation of vascular endothelial growth factor receptor expression. J Clin Invest. 1996;97:469–476. doi: 10.1172/JCI118437. [DOI] [PMC free article] [PubMed] [Google Scholar]
- Cao Y, Ji WR, Qi P, Rosin A. Placenta growth factor: identification and characterization of a novel isoform generated by RNA alternative splicing. Biochem Biophys Res Commun. 1997;235:493–498. doi: 10.1006/bbrc.1997.6813. [DOI] [PubMed] [Google Scholar]
- Castellucci M, Scheper M, Scheffen I, Celona A, Kaufmann P. The development of the human placental villous tree. Anat Embryol. 1990;181:117–128. doi: 10.1007/BF00198951. [DOI] [PubMed] [Google Scholar]
- Clark DE, Smith SK, Sharkey AM, Charnock-Jones DS. Localization of VEGF and expression of its receptors FLT and KDR in human placenta throughout pregnancy. Hum Reprod. 1996;11:1090–1098. doi: 10.1093/oxfordjournals.humrep.a019303. [DOI] [PubMed] [Google Scholar]
- Dunk C, Ahmed A. Vascular endothelial growth factor receptor-2-mediated mitogenesis is negatively regulated by vascular endothelial growth factor receptor-1 in tumor epithelial cells. Am J Pathol. 2001;158:265–273. doi: 10.1016/S0002-9440(10)63965-X. [DOI] [PMC free article] [PubMed] [Google Scholar]
- Ferrara N, Houck K, Jakeman L, Leung DW. Molecular and biological properties of the vascular endothelial growth factor family of proteins. Endocr Rev. 1992;13:18–32. doi: 10.1210/edrv-13-1-18. [DOI] [PubMed] [Google Scholar]
- Ferrara N, Houck KA, Jakeman LB, Winer J, Leung DW. The vascular endothelial growth factor family of polypeptides. J Cell Biochem. 1991a;47:211–218. doi: 10.1002/jcb.240470305. [DOI] [PubMed] [Google Scholar]
- Ferrara N, Winer J, Burton T. Aortic smooth muscle cells express and secrete vascular endothelial growth factor. Growth Factors. 1991b;5:141–148. doi: 10.3109/08977199109000278. [DOI] [PubMed] [Google Scholar]
- Folkman J, Klagsburn M. Angiogenic factors. Science. 1987;235:442–447. doi: 10.1126/science.2432664. [DOI] [PubMed] [Google Scholar]
- Fong GH, Rossant J, Gertsenstein M, Breitman ML. Role of the Flt-1 receptor tyrosine kinase in regulating the assembly of vascular endothelium. Nature. 1995;376:66–70. doi: 10.1038/376066a0. [DOI] [PubMed] [Google Scholar]
- Galan HL, Hussey MJ, Chung M, Chyu JK, Hobbins JC, Battaglia FC. Doppler velocimetry of growth-restricted fetuses in an ovine model of placental insufficiency. Am J Obstet Gynecol. 1998;178:451–456. doi: 10.1016/s0002-9378(98)70419-3. [DOI] [PubMed] [Google Scholar]
- Giles WB, Trudinger BJ, Baird PJ. Fetal umbilical artery flow velocity waveforms and placental resistance: pathological correlation. Br J Obstet Gynaecol. 1985;92:31–38. doi: 10.1111/j.1471-0528.1985.tb01045.x. [DOI] [PubMed] [Google Scholar]
- Hames BD. One-dimensional polyacrylamide gel electrophoresis. In: Hames BD, Rickwood D, editors. Gel Electrophoresis of Proteins: a Practical Approach. London, UK: IRL Press Limited; 1990. pp. 13–15. [Google Scholar]
- Hauser S, Weich HA. A heparin-binding form of placenta growth factor (PlGF-2) is expressed in human umbilical vein endothelial cells and in placenta. Growth Factors. 1993;9:259–268. doi: 10.3109/08977199308991586. [DOI] [PubMed] [Google Scholar]
- Hendricks SK, Sorensen TK, Wang KY, Bushnell JM, Seguin EM, Zingheim RW. Doppler umbilical artery waveform indices—normal values from fourteen to forty-two weeks. Am J Obstet Gynecol. 1989;161:761–765. doi: 10.1016/0002-9378(89)90397-9. [DOI] [PubMed] [Google Scholar]
- Houck KA, Ferrara N, Winer J, Cachianes G, Li B, Leun G & DW. The vascular endothelial growth factor family: identification of a fourth molecular species and characterization of alternative splicing of RNA. Mol Endocrinol. 1991;5:1806–1814. doi: 10.1210/mend-5-12-1806. [DOI] [PubMed] [Google Scholar]
- Iruela-Arispe ML, Dvorak HF. Angiogenesis: a dynamic balance of stimulators and inhibitors. Thromb Haemost. 1997;78:672–677. [PubMed] [Google Scholar]
- Jackson MR, Walsh AJ, Morrow RJ, Mullen JB, Lye SJ, Ritchie JW. Reduced placental villous tree elaboration in small-for-gestational-age pregnancies: relationship with umbilical artery Doppler waveforms. Am J Obstet Gynecol. 1995;172:518–525. doi: 10.1016/0002-9378(95)90566-9. [DOI] [PubMed] [Google Scholar]
- Kappes SM, Warren WC, Pratt SL, Liang R, Anthony RV. Quantification and cellular localization of ovine placental lactogen messenger ribonucleic acid expression during mid- and late gestation. Endocrinology. 1992;131:2829–2838. doi: 10.1210/endo.131.6.1446621. [DOI] [PubMed] [Google Scholar]
- Khaliq A, Dunk C, Jiang J, Shams M, Li XF, Acevedo C, Weich H, Whittle M, Ahmed A. Hypoxia down-regulates placenta growth factor, whereas fetal growth restriction up-regulates placenta growth factor expression: molecular evidence for ‘placental hyperoxia’ in intrauterine growth restriction. Lab Invest. 1999;79:151–170. [PubMed] [Google Scholar]
- Kingdom J, Huppertz B, Seaward G, Kaufmann P. Development of the placental villous tree and its consequences for fetal growth. Eur J Obstet Bynecol Reprod Biol. 2000;92:35–43. doi: 10.1016/s0301-2115(00)00423-1. [DOI] [PubMed] [Google Scholar]
- Kingdom JCP, Kaufmann P. Oxygen and placental villous development-origins of fetal hypoxia. Placenta. 1997;18:613–621. doi: 10.1016/s0143-4004(97)90000-x. [DOI] [PubMed] [Google Scholar]
- Krebs C, Macara LM, Leiser R, Bowman AW, Greer IA, Kingdom JC. Intrauterine growth restriction with absent end-diastolic flow velocity in the umbilical artery is associated with maldevelopment of the placental terminal villous tree. Am J Obstet Gynecol. 1996;175:1534–1542. doi: 10.1016/s0002-9378(96)70103-5. [DOI] [PubMed] [Google Scholar]
- Leiser R, Krebs C, Ebert B, Dantzer V. Placental vascular corrosion cast studies: a comparison between ruminants and humans. Microsc Res Tech. 1997;38:76–87. doi: 10.1002/(SICI)1097-0029(19970701/15)38:1/2<76::AID-JEMT9>3.0.CO;2-S. [DOI] [PubMed] [Google Scholar]
- Macara L, Kingdom JCP, Kaufmann P, Kohnen G, Hair J, More IAR, Lyall F, Greer IA, Kingdom JC, More IA. Structural analysis of placental terminal villi from growth-restricted pregnancies with abnormal umbilical artery doppler waveforms. Placenta. 1996;17:37–48. doi: 10.1016/s0143-4004(05)80642-3. [DOI] [PubMed] [Google Scholar]
- Macara L, Kingdom JC, Kohnen G, Bowman AW, Greer IA, Kaufmann P. Elaboration of stem villous vessels in growth restricted pregnancies with abnormal umbilical artery Doppler waveforms. B J Obstet Gynaecol. 1995;102:807–812. doi: 10.1111/j.1471-0528.1995.tb10847.x. [DOI] [PubMed] [Google Scholar]
- Matsumoto LC, Bogic L, Brace RA, Cheung CY. Prolonged hypoxia upregulates vascular endothelial growth factor messenger RNA expression in ovine fetal membranes and placenta. Am J Obstet Gynecol. 2002;186:303–310. doi: 10.1067/mob.2002.119806. [DOI] [PubMed] [Google Scholar]
- Mellor DJ, Matheson IC. Daily changes in the curved crown-rump length of individual sheep fetuses during the last 60 days of pregnancy and effects of different levels of maternal nutrition. Q J Exp Physiol Cogn Med Sci. 1979;64:119–131. doi: 10.1113/expphysiol.1979.sp002462. [DOI] [PubMed] [Google Scholar]
- Meschia G, Battaglia FC, Hay WW, Sparks JW. Utilization of substrates by the ovine placenta in vivo. Federation Proc. 1980;39:245–249. [PubMed] [Google Scholar]
- Morrow RJ, Adamson SL, Bull SB, Ritchie JW. Effect of placental embolization on the umbilical arterial velocity waveform in fetal sheep. Am J Obstet Gynecol. 1989;161:1055–1060. doi: 10.1016/0002-9378(89)90783-7. [DOI] [PubMed] [Google Scholar]
- National Research Council-Subcommittee on Sheep Nutrition. Nutirents Requirments of Sheep. 6. Washington, DC: National Academy Press; 1985. [Google Scholar]
- Nieto-Diaz A, Villar J, Matorras-Weinig R, Valenzuela-Ruiz P. Intrauterine growth retardation at term: association between anthropometric and endocrine parameters. Acta Obstet Gynecol Scand. 1996;75:127–131. doi: 10.3109/00016349609033303. [DOI] [PubMed] [Google Scholar]
- Ong S, Lash G, Baker PN. Angiogenesis and placental growth in normal and compromised pregnancies. Best Pract Res Clin Obstet Bynaecol. 2000;14:969–980. doi: 10.1053/beog.2000.0138. [DOI] [PubMed] [Google Scholar]
- Pardi G, Cetin I, Marconi AM, Bozzetti P, Buscaglia M, Makowski EL, Battaglia FC. Venous drainage of the human uterus: respiratory gas studies in normal and fetal growth-retarded pregnancies. Am J Obstet Gynecol. 1992;166:699–706. doi: 10.1016/0002-9378(92)91700-k. [DOI] [PubMed] [Google Scholar]
- Park JE, Chen HH, Winer J, Houck KA, Ferrara N. Placenta growth factor. Potentiation of vascular endothelial growth factor bioactivity, in vitro and in vivo, and high affinity binding to Flt-1 but not to Flk-1/KDR. J Biol Chem. 1994;269:25646–25654. [PubMed] [Google Scholar]
- Redmer DA, Dai Y, Li J, Charnock-Jones DS, Smith SK, Reynolds LP, Moor RM. Characterization and expression of vascular endothelial growth factor (VEGF) in the ovine corpus luteum. J Reprod Fertil. 1996;108:157–165. doi: 10.1530/jrf.0.1080157. [DOI] [PubMed] [Google Scholar]
- Regnault TRH, Galan HL, Parker TA, Anthony RV. Placental development in normal and compromised pregnancies-A review. Placenta. 2002a;23:S119–S129. doi: 10.1053/plac.2002.0792. [DOI] [PubMed] [Google Scholar]
- Regnault TRH, Orbus RJ, Battaglia FC, Wilkening RB, Anthony RV. Altered arterial concentrations of placental hormones during maximal placental growth in a model of placental insufficiency. J Endocrinol. 1999;162:433–442. doi: 10.1677/joe.0.1620433. [DOI] [PubMed] [Google Scholar]
- Regnault TRH, Orbus RJ, De Vrijer B, Davidsen ML, Galan HL, Wilkening RB, Anthony RV. Placental expression of VEGF, PlGF and their receptors in a model of placental insufficiency-intrauterine growth restriction (PI-IUGR) Placenta. 2002b;23:132–144. doi: 10.1053/plac.2001.0757. [DOI] [PubMed] [Google Scholar]
- Reuwer PJ, Bruinse HW, Stoutenbeek P, Haspels AA. Doppler assessment of the fetoplacental circulation in normal and growth-retarded fetuses. Eur J Obstet Gynecol Reprod Biol. 1984;18:199–205. doi: 10.1016/0028-2243(84)90117-5. [DOI] [PubMed] [Google Scholar]
- Rodesch F, Simon P, Donner C, JauniauX E. Oxygen measurements in endometrial and trophoblastic tissues during early pregnancy. Obstet Gynecol. 1992;80:283–285. [PubMed] [Google Scholar]
- SAS. SAS/STAT User's Guide. 4. Cary, NC, USA: SAS Institute Inc; 1989. version 6. [Google Scholar]
- Sawano A, Takahashi T, Yamaguchi S, Aonuma M, Shibuya M. Flt-1 but not KDR/Flk-1 tyrosine kinase is a receptor for placenta growth factor, which is related to vascular endothelial growth factor. Cell Growth Differ. 1996;7:213–221. [PubMed] [Google Scholar]
- Sharkey AM, Day K, Mcpherson A, Malik S, Licence D, Smith SK, Charnock-Jones DS. Vascular endothelial growth factor expression in human endometrium is regulated by hypoxia. J Clin Endocrinol Metab. 2000;85:402–409. doi: 10.1210/jcem.85.1.6229. [DOI] [PubMed] [Google Scholar]
- Shiraishi S, Nakagawa K, Kinukawa N, Nakano H, Sueishi K. Immunohistochemical localization of vascular endothelial growth factor in the human placenta. Placenta. 1996;17:111–121. doi: 10.1016/s0143-4004(96)80004-x. [DOI] [PubMed] [Google Scholar]
- Shore VH, Wang TH, Wang CL, Torry RJ, Caudle MR, Torry DS. Vascular endothelial growth factor, placental growth factor and their receptors in isolated human trophoblast. Placenta. 1997;18:657–665. doi: 10.1016/s0143-4004(97)90007-2. [DOI] [PubMed] [Google Scholar]
- Shweiki D, Itin A, Neufeld G, Gitay-Goren H, Keshet E. Patterns of expression of vascular endothelial growth factor (VEGF) and VEGF receptors in mice suggest a role in hormonally regulated angiogenesis. J Clin Invest. 1993;91:2235–2243. doi: 10.1172/JCI116450. [DOI] [PMC free article] [PubMed] [Google Scholar]
- Sone H, Okuda Y, Kawakami Y, Kondo S, Hanatani M, Matsuo K, Suzuki H, Yamashita K. Progesterone induces vascular endothelial growth factor on retinal pigment epithelial cells in culture. Life Sci. 1996;59:21–25. doi: 10.1016/0024-3205(96)00253-6. [DOI] [PubMed] [Google Scholar]
- Takagi H, King GL, Ferrara N, Aiello LP. Hypoxia regulates vascular endothelial growth factor receptor KDR/Flk gene expression through adenosine A2 receptors in retinal capillary endothelial cells. Invest Ophthalmol Vis Sci. 1996;37:1311–1321. [PubMed] [Google Scholar]
- Taylor CM, Stevens H, Anthony FW, Wheeler T. Influence of hypoxia on vascular endothelial growth factor and chorionic gonadotrophin production in the trophoblast-derived cell lines: JEG, JAr and BeWo. Placenta. 1997;18:451–458. doi: 10.1016/s0143-4004(97)80047-1. [DOI] [PubMed] [Google Scholar]
- Terman B, Khandke L, Dougher-Vermazan M, Maglione D, Lassam NJ, Gospodarowicz D, Persico MG, Bohlen P, Eisinger M. VEGF receptor subtypes KDR and FLT1 show different sensitivities to heparin and placenta growth factor. Growth Factors. 1994;11:187–195. doi: 10.3109/08977199409046916. [DOI] [PubMed] [Google Scholar]
- Thureen PJ, Trembler KA, Meschia G, Makowski EL, Wilkening RB. Placental glucose transport in heat-induced fetal growth retardation. Am J Physiol. 1992;263:R578–585. doi: 10.1152/ajpregu.1992.263.3.R578. [DOI] [PubMed] [Google Scholar]
- Trudinger BJ, Giles WB, Cook CM, Bombardieri J, Collin S. Fetal umbilical artery flow velocity waveforms and placental resistance: clinical significance. Br J Obstet Gynaecol. 1985;92:23–30. doi: 10.1111/j.1471-0528.1985.tb01044.x. [DOI] [PubMed] [Google Scholar]
- Trudinger BJ, Stevens D, Connelly A, Hales JR, Alexander Bradley L, Fawcett A, Thompson RS. Umbilical artery flow velocity waveforms and placental resistance: the effects of embolization of the umbilical circulation. Am J Obstet Gynecol. 1987;157:1443–1448. doi: 10.1016/s0002-9378(87)80241-7. [DOI] [PubMed] [Google Scholar]
- Tsoi SCM, Wen Y, Chung J, Chen D, Magness RR, Zheng J. Co-expression of vascular endothelial growth factor and neuropilin-1 in ovine feto-placental artery endothelial cells. Mol Cell Endocrinol. 2002;196:95–106. doi: 10.1016/s0303-7207(02)00190-9. [DOI] [PubMed] [Google Scholar]
- Tuder RM, Flook BE, Voelkel NF. Increased gene expression for VEGF and the VEGF receptors KDR/Flk and Flt in lungs exposed to acute or to chronic hypoxia. Modulation of gene expression by nitric oxide. J Clin Invest. 1995;95:1798–1807. doi: 10.1172/JCI117858. [DOI] [PMC free article] [PubMed] [Google Scholar]
- Vuorela P, Hatva E, Lymboussaki A, Kaipainen A, Joukov V, Persico MG, Alitalo K, Halmesmaki E. Expression of vascular endothelial growth factor and placental growth factor in human placenta. Biol Reprod. 1997;56:489–494. doi: 10.1095/biolreprod56.2.489. [DOI] [PubMed] [Google Scholar]
- Waltenberger J, Claesson-Welsh L, Siegbahn A, Shibuya M, Heldin CH. Different signal transduction properties of KDR and Flt1, two receptors for vascular endothelial growth factor. J Biol Chem. 1994;269:26988–26995. [PubMed] [Google Scholar]
- Waltenberger J, Mayr U, Pentz S, Hombach V. Functional upregulation of the vascular endothelial growth factor receptor KDR by hypoxia. Functional upregulation of the vascular endothelial growth factor receptor KDR by hypoxia. Circulation. 1996;94:1647–1654. doi: 10.1161/01.cir.94.7.1647. [DOI] [PubMed] [Google Scholar]
- Wilkening RB, Meschia G. Effect of occluding one umbilical artery on placental oxygen transport. Am J Physiol. 1991;260:H1319–25. doi: 10.1152/ajpheart.1991.260.4.H1319. [DOI] [PubMed] [Google Scholar]
- Wilkening RB, Molina RD, Meschia G. Placental oxygen transport in sheep with different hemoglobin types. Am J Physiol. 1988;254:R585–589. doi: 10.1152/ajpregu.1988.254.4.R585. [DOI] [PubMed] [Google Scholar]
- Wilting J, Christ B, Bokeloh M, Weich HA. In vivo effects of vascular endothelial growth factor on the chicken chorioallantoic membrane. Cell Tissue Res. 1993;274:163–172. doi: 10.1007/BF00327997. [DOI] [PubMed] [Google Scholar]