

Abstract
The interaction between skeletal muscle contraction and sympathetic nerve activation (SNA) on blood flow during exercise has remained ambiguous due to indirect estimates of vasomotor control. In the hamster retractor muscle (n = 54), interactions between three levels of SNA (∼3, 6 and 12 Hz) and of contractile activity (2.5, 10 and 20 % duty cycle) were studied in feed arteries (FA) and first- (1A), second- (2A), and third-order (3A) arterioles using intravital microscopy. During functional dilatation with rhythmic muscle contractions, sympathetic vasoconstriction was sustained in FA and 1A but impaired in 2A and 3A (P < 0.05), where vessels ‘escaped’ from responding to SNA. To account for changes in baseline diameter and blood flow during contractions, vasodilatation was induced passively (2–3 levels) in resting muscles with papaverine or sodium nitroprusside. Compared to functional dilatation, the range of passive dilatation was similar in 3A and progressively greater in 2A, 1A and FA. With passive dilatation, SNA responses were sustained in 2A and increased with baseline diameter in 3A. Blood flow through FA (rest, ∼20 nl s−1) increased ∼5-fold during contractile activity and ∼10-fold during passive dilatation. Absolute flow reductions (nl s−1) with SNA increased during contractile activity and during passive dilatation; relative flow reductions were impaired during functional dilatation (P < 0.05) and remained constant during passive dilatation. Thus, SNA can restrict blood flow to exercising muscle by constricting FA and 1A while dilatation prevails in 2A and 3A. Such concerted interaction will promote oxygen extraction when blood flow is restricted to maintain arterial pressure.
Competition between vasodilatation and vasoconstriction in skeletal muscle reflects a dynamic interaction between the local regulation of tissue blood flow and the autonomic neural regulation of arterial perfusion pressure (Folkow et al. 1971; Rowell, 1974). At rest, vasomotor tone is high throughout the resistance network. In response to muscle contraction, vasodilatation increases local blood flow and the supply of oxygen to active fibres (Gorczynski et al. 1978; Marshall & Tandon, 1984; VanTeeffelen & Segal, 2000). Initially, dilatation of distal arterioles augments capillary perfusion (Sweeney & Sarelius, 1989) and diffusional exchange between blood and tissue (Mellander, 1971). As the intensity of contractile activity and metabolic demand increase, greater total flow into the muscle is achieved through vasodilatation ascending progressively into the proximal arterioles and feed arteries (Folkow et al. 1971; Welsh & Segal, 1997; Segal & Jacobs, 2001).
Sympathetic nerve activation (SNA) increases as a function of exercise intensity and with the mass of muscle engaged in contractile activity (Alam & Smirk, 1937; Seals, 1989). The interaction between functional vasodilatation and sympathetic vasoconstriction has long driven studies of blood flow control (Bulbring & Burn, 1939; Cobbold et al. 1963; Rowell, 1974; Granger et al. 1976), with controversial findings. On one hand, sympathetic vasoconstriction can restrict the increase in blood flow to exercising muscle (Strandell & Shepherd, 1967; Thompson & Mohrman, 1983; Buckwalter et al. 1997; O'Leary et al. 1997). On the other hand, vasoconstriction in response to SNA is impaired during muscle contractions (Remensnyder et al. 1962; Kjellmer, 1965; Burcher & Garlick, 1973; Richardson et al. 1995; Thomas et al. 1997). The controversy surrounding the ability of the vascular supply of skeletal muscle to undergo ‘functional sympatholysis' during exercise (Remensnyder et al. 1962) is underscored by variations in experimental design, data analyses and graphical presentation (Strandell & Shepherd, 1967; Thompson & Mohrman, 1983; O'Leary, 1991). Furthermore, the outcome of an experimental manipulation can be determined by changes in the initial baseline from which a response is evaluated (Myers & Honig, 1969). Therefore, to resolve how contractile activity can influence sympathetic vasoconstriction requires that responses to SNA also be evaluated when blood flow is elevated in resting muscle (Rowlands & Donald, 1968).
Vasomotor responses to SNA have been well characterised in arterioles of resting skeletal muscle using intravital microscopy (Marshall, 1982; Fleming et al. 1987; Boegehold & Johnson, 1988b; Ohyanagi et al. 1991; Kurjiaka & Segal, 1995; Welsh & Segal, 1996). In contrast, few studies have investigated how arteriolar responses to SNA are influenced by muscle contraction (Dodd & Johnson, 1991, 1993). Moreover, there are no direct observations of how feed arteries (FA), which can present nearly half of the total resistance to muscle blood flow (Williams & Segal, 1993; Welsh & Segal, 1996), respond during interactions between muscle fibre contraction and SNA. Because blood flow through FA reflects the concerted response of the entire resistance network, observing the behaviour of these proximal vessels may provide key insight as to how SNA and muscle fibre contraction interact to determine the magnitude of muscle blood flow.
Our goal in the present study was to evaluate the interaction of SNA and muscle fibre contraction on vasomotor responses of proximal though distal branches of the resistance network of skeletal muscle. The hamster retractor muscle preparation was used as model to enable direct observation of FA and arterioles under defined levels of tension production and SNA (Welsh & Segal, 1997; Jacobs & Segal, 2000; VanTeeffelen & Segal, 2000). We tested two hypotheses: (1) responses to SNA during muscle contraction would vary with vessel branch order; and (2) the interaction between SNA and muscle contraction would be influenced by respective levels of SNA and contractile activity. To evaluate how concerted network responses determined total flow into the muscle, red blood cell velocity (Vrbc) was measured together with diameter in FA. In complimentary experiments, vasodilators were administered to resting muscle to determine how a change in baseline per se can influence vasomotor responses to SNA, independently of muscle contraction.
METHODS
Animal care and preliminary surgery
All procedures were approved by the Institutional Animal Care and Use Committee of The John B. Pierce Laboratory and were performed in accordance with the Guide for the Care and Use of Laboratory Animals of the National Research Council (USA). Male golden hamsters (n = 54; 85-115 g; Charles River Breeding Laboratories, Kingston, NY, USA) were maintained at 24 ° C on a 14 h-10 h (light-dark) cycle and provided rodent chow and water ad libitum. Surgical procedures required ∼3 h and were performed using a stereo microscope. Hamsters were anaesthetised with pentobarbital sodium (60 mg kg−1 I.P.) and tracheotomised with polyethylene tubing (PE-90) to maintain airway patency. Cannulae (PE-50) were secured (4-0 silk suture) in the left femoral vein to maintain anaesthesia and fluid balance during experiments (10 mg ml−1 pentobarbital sodium in sterile saline; infused at 410 μl h−1) and in the right carotid artery to monitor blood pressure. Depth of anaesthesia was monitored and maintained according to stability of blood pressure and lack of withdrawal to toe pinch. Oesophageal temperature was monitored with a thermocouple wire and maintained at ∼37 ° C using conducted and radiant heat. At the end of experimental procedures (∼3 h duration), the hamster was given an overdose of pentobarbital intravenously.
Retractor muscle preparation
Following preliminary surgery, the hamster was positioned on a transparent acrylic platform and the right retractor muscle was prepared for study as described (VanTeeffelen & Segal, 2000). Briefly, an incision was made through the overlying skin. Taking great care to minimise trauma, the muscle was cleared of connective tissue, severed from its origin and insertion, secured between clamps, and reflected in a chamber while maintaining the integrity of the vascular supply (Fig. 1). The muscle was superfused continuously with a bicarbonate-buffered physiological saline solution (PSS; pH 7.4) of the following composition: (mM): NaCl, 131.9; KCl, 4.7; CaCl2, 2.0; MgSO4, 1.2; NaHCO3, 18; equilibrated with 95 % N2 and 5 % CO2. The completed preparation was secured to the stage of an intravital microscope (ACM, Zeiss; Thornwood, NY, USA) and equilibrated for ∼60 min. Feed arteries (FA), which control total blood flow into the muscle, were studied along with first- (1A), second- (2A) and third-order (3A) arterioles, which govern the magnitude and distribution of blood flow within the muscle. To minimise any influence of damaged ends of muscle fibres, arterioles located in the central region of the muscle were studied. Vessels were observed using bright-field illumination (Zeiss ACH/APL condensor, numerical aperture (NA) = 0.32; Leitz UM 32 objective, NA = 0.20); total magnification on the video monitor face was × 860. Internal vessel diameter (D) was measured with a video calliper at the widest point of the vessel lumen or column of red blood cells (resolution: ≤ 2 μm). Centreline red blood cell velocity (Vrbc) in FA was monitored (Jacobs & Segal, 2000) using an optical Doppler velocimeter (Cardiovascular Research Institute; College Station, TX, USA).
Figure 1. Hamster retractor muscle preparation for intravital microscopy.
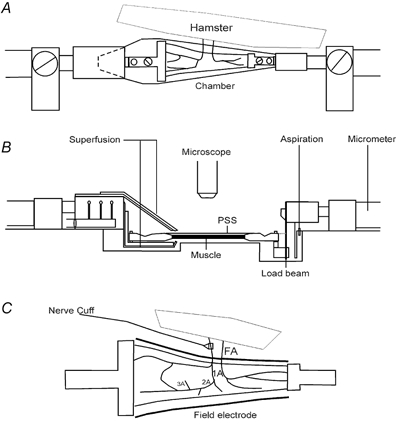
A (top view), the muscle is reflected away from the anaesthetised hamster, immersed in a chamber (10 ml volume) integral to the acrylic platform, and secured in clamps connected to micrometer spindles at each end to control muscle length. Fresh bicarbonate-buffered physiological salt solution (PSS; pH 7.4, 35 °C) is introduced at the proximal end (10 ml min−1) and aspirated at the distal end to maintain constant fluid level with superfusion along the muscle. B (side view), the PSS is introduced through ports positioned above and below the muscle to minimise unstirred layers. A load beam (LCL-1136, Omega; Stamford, CT, USA; resolution: ±0.1 g) is mounted in series with the muscle records tension. C (enlarged top view), platinum electrodes are positioned (within the chamber shown in A) along both sides of the muscle for activating skeletal muscle fibres through field stimulation. Perivascular sympathetic nerve activation is via a nerve cuff positioned around a FA. Two FA are illustrated, each giving rise to first-, second- and third-order arterioles (1A, 2A and 3A, respectively); associated veins, venules and capillaries omitted for clarity.
Stimulation of muscle fibres and sympathetic nerves
Platinum electrodes (50 mm × 3 mm × 0.2 mm) were positioned along either side of the muscle (Fig. 1C). Muscle contractions were evoked using field stimulation to depolarise motor end plates (0.1 ms at 140 V (∼120 mA), SIU-5 with S48 monopolar square-wave stimulator, Grass Instruments, Quincy, MA, USA). Field stimulation activated muscle fibres through acetylcholine release at motor end plates, as verified by the inhibition of muscle contraction following addition of d-tubocurarine chloride (10 μM; Sigma) to the PSS (Jacobs & Segal, 2000). Further, the absence of vasomotor responses during the inhibition of muscle contraction verified that sympathetic nerves were not activated during field stimulation. Optimal muscle length (Lo) for twitch tension was determined and all further manoeuvres were done at Lo. Rhythmic muscle contractions were evoked once every 2 s at 40 Hz for 2 min periods using train durations of 50, 200 and 400 ms to obtain low (2.5 %), intermediate (10 %), and high (20 %) levels of duty cycle (DC), respectively. Stimulation at 40 Hz evokes ∼40 % of maximum tetanic tension (Po) and was used for all DCs (Welsh & Segal, 1997; Jacobs & Segal, 2000; VanTeeffelen & Segal, 2000).
For SNA, a perivascular cuff electrode was prepared from a pair of platinum-iridium wires (no. 10Ir9/49T; Medwire-Sigmund Cohn, Mt. Vernon, NY, USA) positioned ∼1 mm apart within a piece of Silastic tubing (length, ∼2.5 mm; internal diameter, 0.6 mm) and secured with methacrylate adhesive. The tubing was cut along the opposite side for positioning around a FA without obstructing blood flow (Fig. 1C), as confirmed by visual inspection. Electrode leads were taped to the platform and connected to a second stimulator. At the end of the equilibration period, SNA at defined frequencies (1, 2, 4, 8 and 16 Hz at ∼25 V, 1 ms) was performed to empirically define values producing low, intermediate and high levels of vasoconstriction (∼5, 10 and 15 μm in a 1A, respectively), which were used for experiments that day. Durations of SNA (30 or 40 s) were based upon obtaining reproducible and reversible responses during steady-state conditions of contractile activity, diameter and blood flow. In this manner, SNA initiated from a FA produced vasoconstriction throughout the arteriolar network, attributable to noradrenaline release from perivascular sympathetic nerves activating α-adrenoreceptors on smooth muscle (Kurjiaka & Segal, 1995; Welsh & Segal, 1996).
Experimental approach
Interactions between skeletal muscle contraction and SNA on vasomotor control were investigated using Protocols 1 and 2. Interactions between passive dilatation and SNA were investigated using Protocol 3. One vessel was studied per hamster. Branch orders were randomised across experiments, as were the sequences for respective levels of SNA, muscle contraction and passive dilatation. Maximum vessel diameters and Vrbc in FA were determined during addition of sodium nitroprusside (SNP, 10 μM; Sigma) to the superfusion solution.
Protocol 1. Effect of muscle contractions on vasoconstriction to SNA
We tested the hypothesis that muscular activity would impair sympathetic vasoconstriction. This interaction was evaluated for low, intermediate and high levels of SNA initiated at 2.5, 10 and 20 % DC levels and compared to SNA at rest. Thus, SNA was performed for 30 s in resting muscle, vessel diameter was allowed to recover (2-3 min), and a 2 min period of rhythmic contractions was initiated. With steady-state vasodilatation established in ≤ 60 s (Jacobs & Segal, 2000; VanTeeffelen & Segal, 2000), SNA was repeated for 30 s after the first minute of activity. Following contractions, resting diameter was allowed to recover (5-7 min) and the vasomotor response to SNA was re-evaluated with the muscle at rest. The next combination of SNA and contractile activity was evaluated in similar fashion. Diameter was recorded before, during and after stimulation of sympathetic nerves and muscle fibres. In ∼60 % of these experiments, the effect of muscle contractions on the diameter response to SNA was evaluated for all three levels of SNA and DC (i.e. a total of 9 periods of contraction). In the remaining experiments, only one or two levels of SNA (across DC levels) or of DC (across SNA levels) were evaluated due to loss of vasomotor tone or a continuous decrease of active tension (to < 50 % of initial) during the 2 min period of contractile activity. The extent of muscle fatigue was evaluated by comparing Po at 100 Hz (200 ms train) at the beginning and at the end of experimental procedures (Jacobs & Segal, 2000; VanTeeffelen & Segal, 2000). To evaluate the reproducibility of SNA during muscle contractions, the same combination of SNA and DC was evaluated near the beginning and end of 15 experiments (n = 3-5 each of 1A, 2A, 3A and FA).
Protocol 2. Effect of muscle contractions on blood flow responses to SNA
These experiments investigated the effect of contractile activity on FA blood flow responses to SNA. Thus, Vrbc was measured together with diameter prior to and at the end of SNA in resting and contracting muscle. Because FA displacement occurred with each contraction, Vrbc was averaged between ∼5 contractions while recognising that blood flow between contractions is likely to overestimate mean flow during the period of activity (Anrep & Von Saalfeld, 1935). For these experiments, the duration of SNA was extended to 40 s to ensure reliable measurements of Vrbc during a steady-state response. Further, only 10 and 20 % DC were studied across all three levels of SNA. Complete protocols (consisting of 6 periods of muscle contractions) were performed in 5 of 8 experiments.
Protocol 3. Effect of passive vasodilatation on responses to SNA
To account for the affect of a change in baseline vessel diameter and blood flow on the SNA response during contractile activity (Rowlands & Donald, 1968; Myers & Honig, 1969; Thomas et al. 1997; Tschakovsky et al. 2002), experiments were performed in additional muscles at rest before and during exposure to vasodilator agents (i.e. with ‘passive’ vasodilatation). Preparations were equilibrated for ∼15 min with incremental concentrations of papaverine (10 to 100 μM; n = 18) or SNP (1 nM to 1 μM; n = 4) added to the superfusion solution. Three levels of dilatation were studied in FA and in 3A (i.e. the most proximal and distal branches observed) and two levels were studied for the intermediate 1A and 2A; similar ranges of vasodilator concentrations were used across vessel branches. Diameter responses to each level of SNA (for 30 s) were evaluated with resting tone and at each level of vasodilatation. In FA, steady-state Vrbc was also recorded prior to and at the end of SNA (for 40 s) in order to calculate blood flow.
Data analysis
Data were acquired at 100 Hz using a MacLab system coupled to a Macintosh IIVX computer. To provide an index of exercise intensity during each 2 min period, the tension × time integral (TTI) was summed for all contractions (VanTeeffelen & Segal, 2000). To calculate specific tension production (mN mm−2), muscle length (± 0.1 mm) and weight (± 0.1 mg) were measured at the end of an experiment.
Diameter responses to SNA were evaluated in three ways (see Figs 2–4), where Do is the baseline diameter from which SNA is initiated, De is the diameter at the end of SNA and Dm is the minimum diameter recorded during SNA: first, by comparing the diameter change (ΔD) at the end of SNA to the baseline diameter in both absolute (i.e. ΔD = De - Do) and relative (%ΔD = ((De - Do)/Do)100) terms; second, by comparing the total diameter × time integral (DTIt) during vasoconstriction below Do, which is the sum of DTI during SNA (DTIs) plus that during recovery to Do (see Fig. 2); third, in the case of sympathetic ‘escape’ (i.e. diminution of vasoconstriction during SNA), by calculating an escape index, equal to (De - Dm)/(Do - Dm) (Boegehold & Johnson, 1988a).
Figure 2. Sympathetic vasoconstriction in resting skeletal muscle.
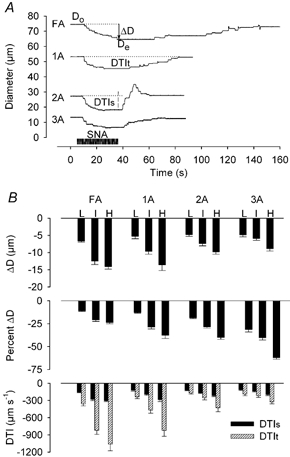
A, representative diameter recordings during intermediate SNA for 30 s (period indicated by dark horizontal bar) in FA, 1A, 2A and 3A. B, summary data. Vessel branch orders are indicated across horizontal axis, each with respective levels of SNA (L, low; I, intermediate; H, high). Diameter change (ΔD), %ΔD and diameter × time integrals (during SNA, DTIs; total, DTIt; see A) are indicated along respective vertical axes for each branch order. Values for n and diameter of vessels are given in the first paragraph of Results.
Figure 4. Differential effects of passive vasodilatation on sympathetic vasoconstriction in proximal and distal vessels.
Representative diameter recordings in response to intermediate SNA. Baseline diameter (Do) was increased (vertical arrow) with papaverine. A, in FA, constriction at the end of SNA was similar at rest (bottom trace) and during submaximum levels of dilatation yet diminished during maximum dilatation (top trace). B, in 3A, constriction at the end of SNA increased with Do across levels of dilatation. Note difference in ordinate scales for FA and 3A.
Blood flow (Q) and wall shear rate (WSR) were calculated as being equal to (π(D/2)2Vm) and 8Vm/D, respectively, with Vm (mean red blood cell velocity) calculated as Vrbc/1.6. Blood flow responses were evaluated by considering flow at the end of SNA (Qe) with respect to the preceding baseline flow (Qo) and calculating responses as both absolute values (i.e. ΔQ = Qe - Qo; in nl s−1) and in relative terms (%ΔQ = ((Qe - Qo)/Qo)100). Changes in Vrbc and WSR in response to SNA were evaluated by subtracting values during baseline diameter from respective values recorded at the end of SNA (i.e. (ΔVrbc = Ve - Vo) and (ΔWSR = WSRe - WSRo)).
In resting muscle with spontaneous tone, the effect of SNA level on vessel diameter was determined for each branch order using repeated measures analysis of variance (RMANOVA); differences between branch orders were determined using analysis of variance (ANOVA). To evaluate the effect of contractile activity on sympathetic vasoconstriction, SNA responses initiated during muscle contractions were compared to those at rest using paired t tests; responses at rest were averaged before and after each period of activity. The main effects of SNA level and baseline diameter or flow were evaluated with RMANOVA. When significant main effects were obtained, post hoc comparisons were performed using Tukey tests; other comparisons are stated. Results were considered statistically significant with P ≤ 0.05. Summary data are reported as means ± s.e.m., with n referring to the number of vessels studied in as many hamsters.
RESULTS
Mean arterial pressure remained between 90 and 110 mmHg and did not change during muscle contractions or SNA (n = 9). Across all three experimental protocols, levels of spontaneous resting tone (measured as a percentage of maximum vessel diameter) in respective vessel branch orders were: FA: 67 ± 2 % (n = 20), 1A: 59 ± 4 % (n = 11), 2A: 55 ± 4 % (n = 11), and 3A: 46 ± 3 % (n = 12). For Protocols 1 and 2, resting vasomotor tone increased during the course of an experiment by ∼15 % (P < 0.05) in all branches and resting blood flow decreased (P < 0.05) from 23 ± 5 to 17 ± 4 nl s−1 while Vrbc was unchanged (9-10 mm s−1). Respective mean resting diameters were: FA: 60 ± 4 μm (n = 13: n = 5 from Protocol 1, n = 8 from Protocol 2); 1A: 37 ± 8 μm (n = 6); 2A: 26 ± 2 μm (n = 6); and 3A: 16 ± 2 μm (n = 7). Excised muscles weighed 74.9 ± 1.9 mg and were 28.9 ± 0.3 mm long (across all experiments; n = 54). Maximum tetanic tensions at 100 Hz were 156 ± 7 and 77 ± 6 mN mm−2 (P < 0.05, n = 16) at the beginning and end of experiments, respectively. When a given combination of SNA and DC was repeated near the beginning and end of experiments, the vasoconstrictor response was preserved (ΔD = −7 ± 2 vs. −6 ± 2 μm), with a 32 ± 5 % decrease in TTI (n = 15). Randomising DC and SNA combinations across experiments resulted in TTI values for each DC that were not significantly different between SNA levels or vessel branch orders (TTI values for 2.5, 10 and 20 % DC, respectively: 150 ± 20, 493 ± 38 and 1162 ± 59 mN mm−2 s).
Vasomotor responses to SNA
The mean frequencies for low, intermediate and high SNA were 3, 6 and 12 Hz, respectively, and did not differ between vessel branches. In 22 experiments, low, intermediate and high frequencies were 4, 8, 16 Hz. In 28 experiments these frequencies were 2, 4 and 8 Hz. In the remaining four experiments, 1, 2 and 8 Hz were used, respectively.
Resting muscle with spontaneous tone
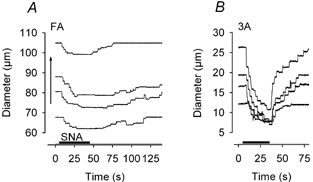
In all vessels, vasoconstriction began 2-3 s after the onset of SNA; vessel diameter decreased exponentially and remained steady after ∼20 s (Fig. 2A). For muscles at rest, there was no evidence of sympathetic escape in any vessel branch. For each level of SNA, absolute responses (ΔD, DTIs, DTIt) were constant throughout an experiment and were averaged for the entire experiment. Vasoconstriction increased with SNA level in each vessel (P < 0.001; Fig. 2B). Across levels of SNA, the diameter change during sympathetic vasoconstriction (ΔD) was greatest in FA and decreased from 1A to 2A to 3A (P < 0.05). In contrast, when expressed as %ΔD, vasoconstriction increased (P < 0.01) from proximal to distal branches (Fig. 2B). Upon cessation of SNA, vessel diameter recovered sooner in 3A and 2A than in 1A or FA (Fig. 2A) and took longer as the level of SNA increased (not illustrated). Thus, relative to the total vasoconstrictor response (i.e. DTIt, which includes recovery; Fig. 2A), the proportion occurring during SNA (i.e. DTIs) increased from proximal to distal branches (P < 0.05, Fig. 2B). Upon cessation of SNA, vessel diameter increased transiently above the initial resting value in ∼25 % of 2A and 3A (Fig. 2A) but not in FA or 1A.
Contracting muscle
During muscle contractions, functional vasodilatation increased with DC and a new steady state in baseline diameter was attained consistently during the first minute. The effect of contractile activity on vasomotor responses to SNA varied with location in the resistance network. In FA, vasoconstriction during SNA was preserved or even increased as baseline diameter (Do) increased with DC (Fig. 3A). In contrast, vasoconstriction of 3A in response to SNA was attenuated as Do increased and this effect was manifested in two ways: (1) the initial vasoconstriction waned as ‘escape’ occurred (Fig. 3B, middle panel); or (2) vasoconstriction was effectively suppressed (Fig. 3B, top panel). The incidence of escape and inhibition of vasoconstriction during SNA increased from proximal to distal vessels (Table 1). When escape was observed, most cases occurred with intermediate and high SNA (30/38; Table 1) and during 10 and 20 % DC (31/38). When inhibition was observed, most cases occurred with low SNA and 20 % DC (15/22). Upon cessation of SNA, all vessels recovered to baseline diameter faster during contractions than at rest (Fig. 3). Therefore, the ratio of DTIs/DTIt at each DC was greater (P < 0.001) during contractions (0.75 ± 0.06 at 2.5 % DC, 0.81 ± 0.02 at 10 % DC and 0.76 ± 0.04 at 20 % DC, respectively) than at rest (0.55 ± 0.07). The incidence of after-dilatation upon cessation of SNA was greater during muscle contractions than at rest (P < 0.001) and manifested predominantly in 2A and 3A (Table 1).
Figure 3. Differential effects of muscle contractions on sympathetic vasoconstriction in FA and 3A.
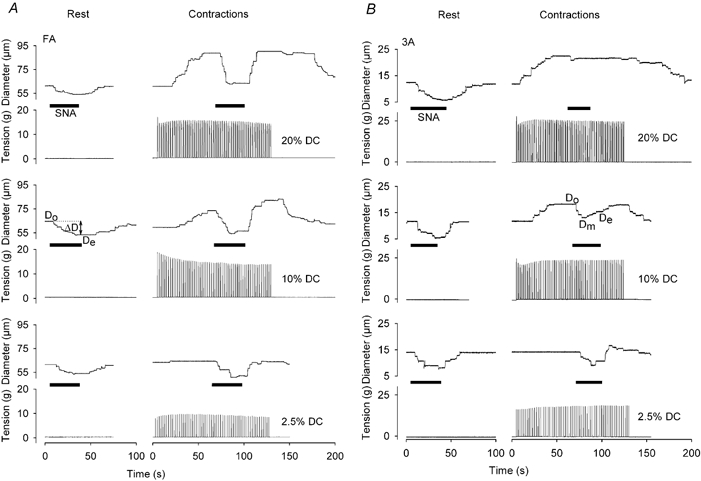
Representative traces for diameter (Do, baseline; Dm, minimum during SNA; De, at end of SNA; notations on respective tracings apply to all) and tension development before, during and after intermediate SNA at rest and during rhythmic muscle contractions of 2.5, 10 and 20 % DC. A, constriction of FA in response to SNA during functional vasodilatation at 2.5 % DC (bottom record) was similar to that at rest and increased with DC (middle and top records). B, constriction of 3A in response to SNA during functional vasodilatation decreased as DC increased. During 10 % DC, vasoconstriction subsided during SNA (i.e. ‘escape’ occurred, with Dm < De). At 20 % DC, vasoconstriction during SNA was completely inhibited. Maximum diameters: FA, 105 μm; 3A, 22 μm. Note consistency of SNA responses at rest.
Table 1.
Incidence of escape from vasoconstriction, inhibition of vasoconstriction, and after-dilatation in response to SNA during skeletal muscle contractions
| Number of observations | Escape | Inhibition | After-dilatation | ||
|---|---|---|---|---|---|
| Branch order | FA | 44 | 3 | 3 | 5 |
| 1A | 43 | 2 | 6 | 8 | |
| 2A | 43 | 12 | 3 | 19 | |
| 3A | 49 | 21 | 10 | 14 | |
| SNA level | L | 58 | 8 | 15 | 10 |
| I | 63 | 17 | 6 | 20 | |
| H | 58 | 13 | 1 | 16 | |
| Duty cycl | 2.5% | 53 | 7 | 6 | 22 |
| 10% | 65 | 18 | 6 | 22 | |
| 20% | 61 | 13 | 15 | 13 |
Abbreviations: FA, feed artery; 1A, 2A, 3A: first-, second- and third-order arterioles; number of vessels and resting diameters are given in th first paragraph of Results. Up to 9 observations were made per vessel during a complete experimental protocol (see Methods). ‘Escape’ from sympathetic vasoconstriction was defined as having an escape index ≥0.5. Inhibition of sympathetic vasoconstriction was defined as Do–Dm≤ 3 μm (see Fig. 3). After-dilatation upon cessation of SNA (see Fig. 2) was defined as a response > 5 μm above Do. χ2 analyses indicated that the incidence of escape or inhibition of vasoconstriction during SNA increased with branch order (P < 0.001) and with duty cycle (P < 0.001), while after-dilatation increased with branch order (P < 0.001).
Passive vasodilatation of resting muscle
With passive dilatation, the constrictor response during SNA also varied with vessel branch order but in a manner that differed from what was observed during muscle contractions. In FA, constrictions at submaximum levels of dilatation were not different from responses observed with resting tone; however, during maximum dilatation, the response to SNA was significantly diminished (Fig. 4A). In contrast, constriction of 3A in response to SNA increased with baseline diameter through the entire range of dilatation (Fig. 4B). Neither sympathetic escape nor inhibition of vasoconstriction was observed at any level of vasomotor tone during passive vasodilatation. Responses with SNP did not differ from those with papaverine and were pooled.
Functional vs. passive vasodilatation
During either functional or passive vasodilatation, vasoconstriction increased with the level of SNA (P < 0.001; Fig. 5). In each branch order, the baseline diameter from which SNA was initiated (Do) increased with DC or with the concentration of vasodilator (P < 0.001; Fig. 5). Passive dilatation increased Do to a similar extent as functional dilatation in 3A and progressively exceeded the level of functional vasodilatation in 2A, 1A and FA, respectively (B vs. A, Fig. 5).
Figure 5. Sympathetic vasoconstriction during muscle contractions and during passive vasodilatation.
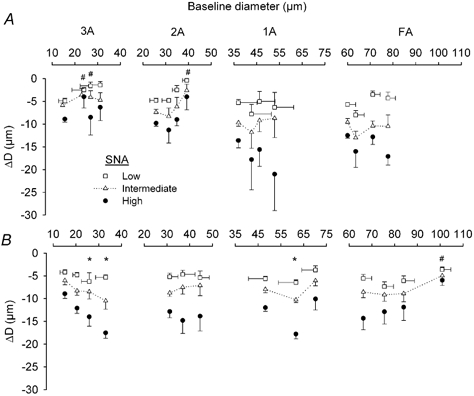
Horizontal axes indicate baseline diameters from which SNA was initiated in respective branch orders. Vertical axes indicate magnitude of vasoconstriction (ΔD) at the end of SNA. A, muscle contractions. Baseline diameter recorded during rest (symbols at left in each panel); 2.5, 10 and 20 % DC increase to the right in each panel. Data for arterioles are from same vessels as in Fig. 2B. Data for FA are pooled for vessels in Figs 2 and 6. B, passive vasodilatation. Baseline diameter recorded during spontaneous tone (symbols at left in each panel) and progressive dilatation increases to the right for each branch order (n = 7 FA; n = 5 each for 1A, 2A and 3A). Error bars (s.e.m.) are representative; those not shown are omitted for clarity. * Enhanced response compared to response at initial resting diameter, P < 0.05. # Impaired response compared to response at initial resting diameter, P < 0.05.
For distal vessels, ΔD was diminished in 3A and 2A during muscle contractions when compared to SNA responses obtained with muscles at rest (Fig. 5A; P < 0.05). This behaviour is consistent with the high incidence of sympathetic escape and the inhibition of vasoconstriction in these branches (Table 1). Across levels of SNA, ΔD decreased as Do increased during muscle contractions (P < 0.01). This effect was significant at 2.5 and 10 % DC in 3A and at 20 % DC in 2A. Across DC, ΔD was diminished at low and intermediate SNA in 3A (P < 0.05) and at low SNA in 2A (P = 0.088). With passive dilatation, the constrictor response to SNA increased progressively (P < 0.001) through the range of Do in 3A, with a significant interaction between Do and the level of SNA (Fig. 5B). In 2A, sympathetic vasoconstriction was effectively constant across levels of Do.
For proximal vessels, ΔD in 1A and FA during muscle contractions were not significantly different from ΔD recorded at rest (Fig. 5A). Across DC, constriction of 1A increased (P < 0.05) during high SNA. With papaverine or SNP (Fig. 5B), ΔD in 1A was significantly greater during submaximum dilatation than with spontaneous resting tone or during maximum dilatation. In FA, sympathetic vasoconstriction during submaximum levels of dilatation was not different from ΔD recorded during resting tone but was impaired (P < 0.01) during maximal dilatation. In 1A and FA, passive dilatation exceeded functional dilatation observed during muscle contractions.
Haemodynamic responses in feed arteries
In response to muscle contractions, baseline blood flow (Qo) from which SNA was initiated increased progressively with DC (Fig. 6A; P < 0.001). With passive dilatation, the maximal increase in blood flow was ∼2-fold greater than that recorded for functional hyperaemia (Fig. 6B). Absolute blood flow was reduced as the level of SNA increased (P < 0.01) during both functional and passive vasodilatation (Fig. 6, left panels) and the magnitude of this effect increased with Qo under both conditions (P < 0.01). However, when expressed relative to respective baseline values (i.e. as %ΔQ), flow reductions during SNA were less (P < 0.05) during muscle contractions than during resting tone (Fig. 6A, right panel). In contrast, during passive vasodilatation, the relative reduction in flow during SNA was maintained as baseline values increased (Fig. 6B, right panel). During muscle contractions, baseline red blood cell velocity (Vo) increased progressively with 10 and 20 % DC (P < 0.01) while baseline wall shear rate (WSRo) increased (P < 0.01) to the same extent with both DCs (Fig. 7A). Respective changes in velocity and WSR during SNA were not different from those obtained at rest (Fig. 7A). During passive dilatation (Fig. 7B), Vo and WSRo increased to a greater extent than during muscle contractions. In addition, both ΔVrbc and ΔWSR increased with their respective baseline values (P < 0.001; Fig. 7B).
Figure 6. Blood flow responses to SNA in feed arteries during muscle contractions and during passive vasodilatation.
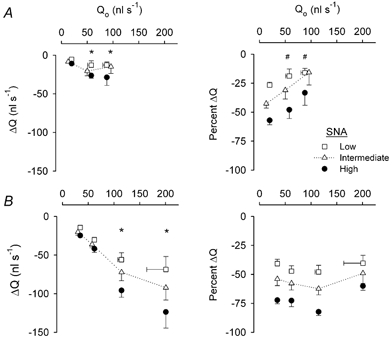
Horizontal axes indicate baseline blood flow from which SNA was initiated (Qo). From each baseline, absolute changes in blood flow (ΔQ) at the end of SNA are indicated along the vertical axes of the left panels; relative changes in blood flow (%ΔQ) are indicated along the vertical axes of the right panels. Error bars are as in Fig. 5. A, muscle contractions. Summary data (n = 8) at rest (symbols at left in each panel) and during contractions (10 and 20 % DC increase to the right in each panel). Maximum FA diameter and blood flow (with 10 μM SNP): 90 ± 5 μm and 137 ± 22 nl s−1, respectively. Vasomotor responses of these FA are shown in Fig. 5A. B, passive vasodilatation. Summary data (n = 5) from FA with spontaneous resting tone (symbols at left in each panel) and during 3 levels of dilatation (incrementing to maximum). Vasomotor responses of these FA are shown in Fig. 5B. The greater resting and maximum diameters (102 ± 3 μm) of FA in B compared to A account for, respectively, the greater resting and maximum Qo values. *Enhanced response compared to response with spontaneous resting flow, P < 0.05. # Impaired response compared to response with spontaneous resting flow, P < 0.05.
Figure 7. Responses of Vrbc and WSR to SNA in feed arteries during muscle contractions and during passive vasodilatation.
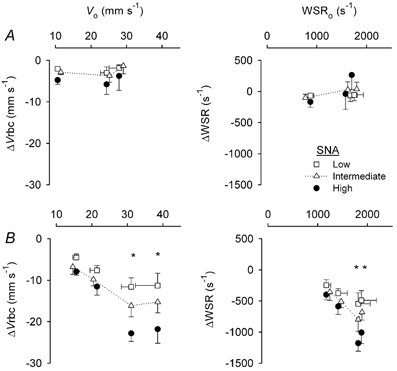
Horizontal axes indicate baseline values (Vo and WSRo) from which SNA was initiated. Changes in Vrbc (ΔVrbc) and WSR (ΔWSR) at the end of SNA are shown by the symbols below respective baseline values. Error bars are as in Fig. 5. A, muscle contractions. Summary data (from same vessels as Fig. 6A) at rest with spontaneous vasomotor tone (symbols at left in each panel) and during contractions (10 and 20 % DC increase to the right in each panel). Maximum Vrbc and WSR (with 10 μM SNP): 32 ± 3 mm s−1 and 1842 ± 151 s−1, respectively. B, passive vasodilatation. Summary data (from same vessels as in Fig. 6B) are from FA with spontaneous tone (symbols at left in each panel) and during 3 levels of dilatation (incrementing to maximum). *Enhanced response compared to response with spontaneous resting tone, P < 0.05.
DISCUSSION
The ability of contractile activity to antagonise the restriction of blood flow by sympathetic neurotransmission is well documented (Remensnyder et al. 1962; Burcher & Garlick, 1973; Richardson et al. 1995; Thomas et al. 1997; Tschakovsky et al. 2002). However, little is known concerning the behaviour of individual branches of the resistance network during exposure to both metabolic demands from muscle fibres and perivascular release of noradrenaline. Proximal arteries have been implicated as a locus of sympathetic vasoconstriction during muscle contractions (Folkow et al. 1971; Thompson & Mohrman, 1983), but have not been observed during such interactions. Therefore, using intravital microscopy, the goal of the present study was to ascertain how each branch of the vascular resistance network, from proximal feed arteries to distal arterioles, responds to SNA during rhythmic contractile activity. In the hamster retractor muscle, selective stimulation of perivascular nerves and of muscle fibres enabled the interaction between sympathetic vasoconstriction and functional vasodilation to be evaluated in defined branches of resistance networks during constant arterial pressure. Our findings illustrate that, as levels of muscle contraction and functional hyperaemia increase, sympathetic vasoconstriction is manifest in feed arteries and proximal arterioles while dilatation prevails in distal arterioles. During exercise, this concerted interaction can promote oxygen extraction when muscle blood flow is constrained to maintain arterial perfusion pressure. In contrast, during passive dilatation in resting muscle, sympathetic vasoconstriction prevails throughout the resistance network.
Sympathetic nerve activation
For the retractor muscle at rest, stimulation through the perivascular cuff electrode evoked a frequency-dependent vasoconstriction that extended from FA throughout arteriolar networks. The magnitude of vasoconstriction in response to a given stimulus frequency varied by several micrometres between preparations with similar levels of spontaneous vasomotor tone, attributable to differences in the density of sympathetic nerves, the amount of fat and connective tissue associated with vessels and to stray current in the superfusion fluid. Our goal was to induce reproducible vasoconstrictions across preparations at each level of SNA. Therefore, stimulation frequencies were defined (1-16 Hz) at the beginning of each experiment based upon the actual change in diameter observed during SNA. The actual values determined here are consistent with previous findings (Marshall, 1982; Fleming et al. 1987; Ohyanagi et al. 1991; Kurjiaka & Segal, 1995).
Resting diameters of feed arteries and arterioles of the retractor muscle preparation typically remain stable throughout experiments lasting 3-4 h (Welsh & Segal, 1997; Jacobs & Segal, 2000; VanTeeffelen & Segal, 2000). In contrast, resting tone increased in all vessel branches during Protocols 1and 2 of the present experiments and may be explained by the augmentation of myogenic tone through noradrenaline released during SNA (Meininger & Faber, 1991). Nevertheless, control responses to SNA at rest remained constant for each vessel branch. The durations used for SNA were based upon obtaining multiple, reproducible responses throughout an experiment. For example, in resting muscles, vasoconstriction consistently stabilised within ∼20 s across vessel branches. Thus, the 30 s period of SNA used for diameter measurements ensured reliable measurements during stable vasomotor responses. For evaluating blood flow, the period of SNA was extended to 40 s in order to also obtain reliable measurements of Vrbc in FA during steady-state responses. Although no differences were found for diameter changes of FA in which SNA was evoked for 30 vs. 40 s, the ability of contractile activity to antagonise sympathetic vasoconstriction in distal arterioles (see Muscle contractions) may have been more pronounced with SNA of longer duration.
Muscle contractions
Muscle fibres were activated during field stimulation using parameters that were confirmed to have no effect on sympathetic nerves. The 2 min period of rhythmic contractions was based upon data showing that ∼60 s is required to consistently establish steady-state dilatation and hyperaemia in the retractor muscle (VanTeeffelen & Segal, 2000), with another ∼60 s needed to evaluate and recover from SNA during contractions (e.g. Fig. 3). Longer duty cycles and higher levels of active tension were avoided in order to preserve the integrity of the retractor muscle (Jacobs & Segal, 2000), which enabled up to nine periods of interaction between contractile activity and SNA to be evaluated in a given experiment. To control for the fall in TTI with repeated bouts of activity, levels of SNA and DC were randomised across experiments, which resulted in TTI for each DC that was not significantly different between SNA levels or vessel branch orders.
Vasodilatation increased from proximal to distal vessel branches and with the intensity of muscle contractions, confirming previous observations (Gorczynski et al. 1978; Marshall & Tandon; 1984; Dodd & Johnson, 1991; Welsh & Segal, 1997; VanTeeffelen & Segal, 2000). During contractions, escape from and avoidance of sympathetic vasoconstriction were most apparent in 2A and 3A branches (Table 1 and Fig. 5). Greater sensitivity of adrenergic constriction of arterioles to inhibition by muscle contractions in smaller distal branches as compared to the larger proximal branches may be explained by the differential distribution of α1- and α2-adrenoreceptors, respectively, with the α2 subtype being located predominantly in distal branches (Faber, 1988; Ohyanagi et al. 1991) and being more sensitive to inhibition with an increase in metabolic demand (Anderson & Faber, 1991; Thomas et al. 1997). In the cat sartorius muscle, 3A branches were the primary site of arteriolar dilatation during muscle contractions and of vasoconstriction during SNA (Dodd & Johnson, 1991). Such robust reactivity was attributed to their role, as transverse arterioles, in governing the distribution of blood flow into capillary networks. In the retractor muscle, 3A are positioned in a similar manner (Emerson & Segal, 1997; G. Lomas & S. Segal, unpublished observations).
Across experiments, the antagonism of sympathetic vasoconstriction in distal arterioles increased with the level of muscle contractions, particularly during low SNA (Fig. 5A). Nevertheless, vasoconstriction persisted throughout networks and was most apparent during high SNA (Fig. 5A). The after-dilatation observed in nearly half of 2A and a third of 3A branches upon withdrawal of SNA (Table 1) may therefore be attributed to inadequate local perfusion and vasodilator accumulation during the period of blood flow restriction. In resting muscle, a similar mechanism may explain the after-dilatation observed in ∼25 % of 2A and 3A upon cessation of SNA. In previous studies of muscle at rest, periods of SNA lasting ≥ 1 min were found to result in sympathetic escape, with the incidence of dilatation also increasing from proximal to distal arterioles (Marshall, 1982; Fleming et al. 1987; Boegehold & Johnson, 1988a). The lack of escape observed here for muscles at rest can be explained by our using shorter (30 or 40 s) durations of SNA and by superfusing all surfaces of the retractor muscle, which would reduce the tendency for vasodilator accumulation.
Passive versus functional vasodilatation
Changes in baseline blood flow and/or perfusion pressure are inherent to evaluating the effect of muscle contraction on vasomotor responses to SNA (Bulbring & Burn, 1939; Remensnyder et al. 1962; Strandell & Shepherd, 1967; Rowlands & Donald, 1968; Thompson & Mohrman, 1983; Thomas et al. 1997; Tschakovsky et al. 2002). Although passive dilatation differs substantively from functional dilatation, where multiple substances and forces are in effect, it provides a reference for evaluating how changes in baseline diameter and flow can influence vasomotor responses to SNA (Rowlands & Donald, 1968; Thomas et al. 1997; Tschakovsky et al. 2002). In most (18/22) of the present experiments, papaverine (a non-specific phophodiesterase inhibitor) was administered to relax vascular smooth muscle; the remaining four experiments used SNP, a NO donor. With either agent, all vessel branches dilated progressively through the same range of concentrations. In 3A, passive dilatation increased baseline diameter to values similar to those obtained during muscle contractions. However, resting diameters progressively exceeded those during functional dilatation in 2A, 1A and FA (Fig. 5). As a result, increases in Vrbc, wall shear rate and blood flow (Fig. 6 and Fig. 7) were greater with passive dilatation than during muscle contractions. Because SNA consistently produced vasoconstriction in resting muscle throughout the ranges of diameter and blood flow recorded during contractions, neither papaverine nor SNP appeared to interfere with sympathetic neuroeffector mechanisms. Thus, for the hamster retractor muscle, the response to SNA was impaired only when FA were dilated passively to diameters which exceeded those measured during muscle contractions (Fig. 5). This behaviour is consistent with observations in human forearms, where SNP blunted sympathetic vasoconstriction only at the highest dose studied (Tschakovsky et al. 2002). Nevertheless, NO has been implicated as a mediator of functional sympatholysis during contractile activity (Thomas & Victor, 1998).
Network integration of responses to muscle contraction and SNA
Blood flow through FA reflects the integrated behaviour of the entire resistance network. During passive dilatation, the reduction in blood flow during SNA increased with baseline flow and the intensity of SNA (Fig. 6). As a result, the relative reductions in blood flow for each level of SNA were nearly constant throughout the range of flow that corresponded to levels that were manifest during contractile activity. In contrast, during functional hyperaemia, relative flow reductions diminished as baseline flow increased with DC. The present data thus demonstrate that contractile activity effectively impaired flow restriction during SNA (Fig. 6). This conclusion is supported by findings in the rat hindlimb (Thomas et al. 1997) and human forearm (Tschakovsky et al. 2002), where the reduction in vascular conductance during SNA was impeded during muscle contractions, yet persisted and even increased when conductance was raised to similar levels through passive dilatation. Thus, the inhibition of flow reduction during SNA is associated with the metabolic demand of contracting muscle fibres and not with flow restriction per se (Alam & Smirk, 1937; Dodd & Johnson, 1991; Hansen et al. 2000).
During muscle contractions, SNA had little effect on WSR, indicating that diameter changes throughout the network maintained luminal shear stress (the product of WSR × blood viscosity) in FA. In contrast, with passive dilatation, WSR was reduced progressively during SNA as baseline diameter and the intensity of SNA increased (Fig. 7). Because FA diameter responses to SNA were not different between active and passive vasodilatation throughout submaximal ranges of blood flow (Fig. 5, right panels), the reduction in WSR (and Vrbc) with SNA during passive dilatation can be explained by constriction of 2A and 3A in a manner that did not occur during muscle contractions (Fig. 5). Further, the prevalence of dilatation in the distal arterioles of contracting muscle also explains the ability of metabolic demand to attenuate the reduction of FA blood flow during SNA (Fig. 6).
Summary and conclusion
Rhythmic contractions of skeletal muscle promote the extraction of oxygen and nutrients from the blood at the same time as total blood flow is restricted by SNA. This behaviour has been interpreted to indicate that sympathetic vasoconstriction is manifest in proximal arteries and attenuated in distal branches of the resistance network (Cobbold et al. 1963; Folkow et al. 1971; Mellander, 1971). The present data are the first to test and substantiate these predictions by direct observation of proximal and distal resistance vessels during multiple levels of contractile activity and SNA. Because we used local stimulation of muscle fibres and sympathetic nerves, the responses reported here reflect those responses intrinsic to the vascular supply of skeletal muscle, independently of changes in systemic blood pressure. Our findings uniquely illustrate the interaction between muscle fibre contraction and SNA in governing vessel diameters throughout the resistance network, which thereby determines the distribution and magnitude of muscle blood flow. As contractile activity and SNA increase, total blood flow into the muscle is restricted progressively through constriction of feed arteries and primary arterioles; proximal branches thereby serve as key sites for regulating the distribution of cardiac output and the maintenance of arterial pressure. In distal arterioles, sympathetic vasoconstriction is antagonised by muscle contractions, though dilatation and perfusion remain less than maximal. Variability in the time course and magnitude of sympathetic escape within the muscle may serve to actively distribute blood flow according to the local requirements of contracting muscle fibres.
Acknowledgments
This research was supported by grants RO1-HL-56786 and RO1-HL-41026 from the Heart, Lung, and Blood Institute of the National Institutes of Health, United States Public Health Service.
REFERENCES
- Alam M, Smirk FH. Observations in man upon a blood pressure raising reflex arising from the voluntary muscles. J Physiol. 1937;89:372–383. doi: 10.1113/jphysiol.1937.sp003485. [DOI] [PMC free article] [PubMed] [Google Scholar]
- Anderson KM, Faber JE. Differential sensitivity of arteriolar alpha 1- and alpha 2-adrenoceptor constriction to metabolic inhibition during rat skeletal muscle contraction. Circ Res. 1991;69:174–184. doi: 10.1161/01.res.69.1.174. [DOI] [PubMed] [Google Scholar]
- Anrep GV, Von Saalfeld E. The blood flow through the skeletal muscle in relation to its contraction. J Physiol. 1935;85:375–399. doi: 10.1113/jphysiol.1935.sp003326. [DOI] [PMC free article] [PubMed] [Google Scholar]
- Boegehold MA, Johnson PC. Periarteriolar and tissue PO2 during sympathetic escape in skeletal muscle. Am J Physiol. 1988a;254:H929–936. doi: 10.1152/ajpheart.1988.254.5.H929. [DOI] [PubMed] [Google Scholar]
- Boegehold MA, Johnson PC. Response of arteriolar network of skeletal muscle to sympathetic nerve stimulation. Am J Physiol. 1988b;254:H919–928. doi: 10.1152/ajpheart.1988.254.5.H919. [DOI] [PubMed] [Google Scholar]
- Buckwalter JB, Mueller PJ, Clifford PS. Sympathetic vasoconstriction in active skeletal muscles during dynamic exercise. J Appl Physiol. 1997;83:1575–1580. doi: 10.1152/jappl.1997.83.5.1575. [DOI] [PubMed] [Google Scholar]
- Bulbring E, Burn JH. Blood flow during muscle contraction and the Orbeli phenomenon in the dog. J Physiol. 1939;95:203–225. doi: 10.1113/jphysiol.1939.sp003720. [DOI] [PMC free article] [PubMed] [Google Scholar]
- Burcher E, Garlick D. Antagonism of vasoconstrictor responses by exercise in the gracilis muscle of the dog. J Pharmacol Exp Ther. 1973;187:78–85. [PubMed] [Google Scholar]
- Cobbold A, Folkow B, Kjellmer I, Mellander S. Nervous and local chemical control of pre-capillary sphincters in skeletal muscle as measured by changes in filtration coefficient. Acta Physiol Scand. 1963;57:180–192. doi: 10.1111/j.1748-1716.1963.tb02584.x. [DOI] [PubMed] [Google Scholar]
- Dodd LR, Johnson PC. Diameter changes in arteriolar networks of contracting skeletal muscle. Am J Physiol. 1991;260:H662–670. doi: 10.1152/ajpheart.1991.260.3.H662. [DOI] [PubMed] [Google Scholar]
- Dodd LR, Johnson PC. Antagonism of vasoconstriction by muscle contraction differs with alpha-adrenergic subtype. Am J Physiol. 1993;264:H892–900. doi: 10.1152/ajpheart.1993.264.3.H892. [DOI] [PubMed] [Google Scholar]
- Emerson GG, Segal SS. Alignment of microvascular units along skeletal muscle fibers of hamster retractor. J Appl Physiol. 1997;82:42–48. doi: 10.1152/jappl.1997.82.1.42. [DOI] [PubMed] [Google Scholar]
- Faber JE. In situ analysis of alpha-adrenoceptors on arteriolar and venular smooth muscle in rat skeletal muscle microcirculation. Circ Res. 1988;62:37–50. doi: 10.1161/01.res.62.1.37. [DOI] [PubMed] [Google Scholar]
- Fleming BP, Barron KW, Howes TW, Smith JK. Response of the microcirculation in rat cremaster muscle to peripheral and central sympathetic stimulation. Circ Res. 1987;61:1126–1131. [PubMed] [Google Scholar]
- Folkow B, Sonnenschein RR, Wright DL. Loci of neurogenic and metabolic effects on precapillary vessels of skeletal muscle. Acta Physiol Scand. 1971;81:459–471. doi: 10.1111/j.1748-1716.1971.tb04924.x. [DOI] [PubMed] [Google Scholar]
- Gorczynski RJ, Klitzman B, Duling BR. Interrelations between contracting striated muscle and precapillary microvessels. Am J Physiol. 1978;235:H494–504. doi: 10.1152/ajpheart.1978.235.5.H494. [DOI] [PubMed] [Google Scholar]
- Granger HJ, Goodman AH, Granger DN. Role of resistance and exchange vessels in local microvascular control of skeletal muscle oxygenation in the dog. Circ Res. 1976;38:379–385. doi: 10.1161/01.res.38.5.379. [DOI] [PubMed] [Google Scholar]
- Hansen J, Sander M, Hald CF, Victor RG, Thomas GD. Metabolic modulation of sympathetic vasoconstriction in human skeletal muscle: role of tissue hypoxia. J Physiol. 2000;527:387–396. doi: 10.1111/j.1469-7793.2000.00387.x. [DOI] [PMC free article] [PubMed] [Google Scholar]
- Jacobs TL, Segal SS. Attenuation of vasodilatation with skeletal muscle fatigue in hamster retractor. J Physiol. 2000;524:929–941. doi: 10.1111/j.1469-7793.2000.00929.x. [DOI] [PMC free article] [PubMed] [Google Scholar]
- Kjellmer I. On the competition between metabolic vasodilatation and neurogenic vasoconstriction in skeletal muscle. Acta Physiol Scand. 1965;63:450–459. doi: 10.1111/j.1748-1716.1965.tb04088.x. [DOI] [PubMed] [Google Scholar]
- Kurjiaka DT, Segal SS. Interaction between conducted vasodilation and sympathetic nerve activation in arterioles of hamster striated muscle. Circ Res. 1995;76:885–891. doi: 10.1161/01.res.76.5.885. [DOI] [PubMed] [Google Scholar]
- Marshall JM. The influence of the sympathetic nervous system on individual vessels of the microcirculation of skeletal muscle of the rat. J Physiol. 1982;332:169–186. doi: 10.1113/jphysiol.1982.sp014408. [DOI] [PMC free article] [PubMed] [Google Scholar]
- Marshall JM, Tandon HC. Direct observations of muscle arterioles and venules following contraction of skeletal muscle fibres in the rat. J Physiol. 1984;350:447–459. doi: 10.1113/jphysiol.1984.sp015211. [DOI] [PMC free article] [PubMed] [Google Scholar]
- Meininger GA, Faber JE. Adrenergic facilitation of myogenic response in skeletal muscle arterioles. Am J Physiol. 1991;260:H1424–1432. doi: 10.1152/ajpheart.1991.260.5.H1424. [DOI] [PubMed] [Google Scholar]
- Mellander S. Interaction of local and nervous factors in vascular control. Angiologica. 1971;8:187–201. doi: 10.1159/000157894. [DOI] [PubMed] [Google Scholar]
- Myers HA, Honig CR. Influence of initial resistance on magnitude of response to vasomotor stimuli. Am J Physiol. 1969;216:1429–1436. doi: 10.1152/ajplegacy.1969.216.6.1429. [DOI] [PubMed] [Google Scholar]
- Ohyanagi M, Faber JE, Nishigaki K. Differential activation of alpha 1- and alpha 2-adrenoceptors on microvascular smooth muscle during sympathetic nerve stimulation. Circ Res. 1991;68:232–244. doi: 10.1161/01.res.68.1.232. [DOI] [PubMed] [Google Scholar]
- O'Leary DS. Regional vascular resistance vs. conductance: which index for baroreflex responses. Am J Physiol. 1991;260:H632–637. doi: 10.1152/ajpheart.1991.260.2.H632. [DOI] [PubMed] [Google Scholar]
- O'Leary DS, Robinson ED, Butler JL. Is active skeletal muscle functionally vasoconstricted during dynamic exercise in conscious dogs. Am J Physiol. 1997;272:R386–391. doi: 10.1152/ajpregu.1997.272.1.R386. [DOI] [PubMed] [Google Scholar]
- Richardson RS, Kennedy B, Knight DR, Wagner PD. High muscle blood flows are not attenuated by recruitment of additional muscle mass. Am J Physiol. 1995;269:H1545–1552. doi: 10.1152/ajpheart.1995.269.5.H1545. [DOI] [PubMed] [Google Scholar]
- Rowell LB. Human cardiovascular adjustments to exercise and thermal stress. Physiol Rev. 1974;54:75–159. doi: 10.1152/physrev.1974.54.1.75. [DOI] [PubMed] [Google Scholar]
- Rowlands DJ, Donald DE. Sympathetic vasoconstrictive responses during exercise- or drug-induced vasodilatation. A time-dependent response. Circ Res. 1968;23:45–60. doi: 10.1161/01.res.23.1.45. [DOI] [PubMed] [Google Scholar]
- Seals DR. Influence of muscle mass on sympathetic neural activation during isometric exercise. J Appl Physiol. 1989;67:1801–1806. doi: 10.1152/jappl.1989.67.5.1801. [DOI] [PubMed] [Google Scholar]
- Segal SS, Jacobs TL. Role for endothelial cell conduction in ascending vasodilatation and exercise hyperaemia in hamster skeletal muscle. J Physiol. 2001;536:937–946. doi: 10.1111/j.1469-7793.2001.00937.x. [DOI] [PMC free article] [PubMed] [Google Scholar]
- Strandell T, Shepherd JT. The effect in humans of increased sympathetic activity on the blood flow to active muscles. Acta Med Scand Suppl. 1967;472:146–167. doi: 10.1111/j.0954-6820.1967.tb12622.x. [DOI] [PubMed] [Google Scholar]
- Sweeney TE, Sarelius IH. Arteriolar control of capillary cell flow in striated muscle. Circ Res. 1989;64:112–120. doi: 10.1161/01.res.64.1.112. [DOI] [PubMed] [Google Scholar]
- Thomas GD, Hansen J, Victor RG. ATP-sensitive potassium channels mediate contraction-induced attenuation of sympathetic vasoconstriction in rat skeletal muscle. J Clin Invest. 1997;99:2602–2609. doi: 10.1172/JCI119448. [DOI] [PMC free article] [PubMed] [Google Scholar]
- Thomas GD, Victor RG. Nitric oxide mediates contraction-induced attenuation of sympathetic vasoconstriction in rat skeletal muscle. J Physiol. 1998;506:817–826. doi: 10.1111/j.1469-7793.1998.817bv.x. [DOI] [PMC free article] [PubMed] [Google Scholar]
- Thompson LP, Mohrman DE. Blood flow and oxygen consumption in skeletal muscle during sympathetic stimulation. Am J Physiol. 1983;245:H66–71. doi: 10.1152/ajpheart.1983.245.1.H66. [DOI] [PubMed] [Google Scholar]
- Tschakovsky ME, Sujirattanawimol K, Ruble SB, Valic Z, Joyner MJ. Is sympathetic neural vasoconstriction blunted in the vascular bed of exercising human muscle. J Physiol. 2002;541:623–635. doi: 10.1113/jphysiol.2001.014431. [DOI] [PMC free article] [PubMed] [Google Scholar]
- VanTeeffelen JW, Segal SS. Effect of motor unit recruitment on functional vasodilatation in hamster retractor muscle. J Physiol. 2000;524:267–278. doi: 10.1111/j.1469-7793.2000.t01-1-00267.x. [DOI] [PMC free article] [PubMed] [Google Scholar]
- Welsh DG, Segal SS. Muscle length directs sympathetic nerve activity and vasomotor tone in resistance vessels of hamster retractor. Circ Res. 1996;79:551–559. doi: 10.1161/01.res.79.3.551. [DOI] [PubMed] [Google Scholar]
- Welsh DG, Segal SS. Coactivation of resistance vessels and muscle fibers with acetylcholine release from motor nerves. Am J Physiol. 1997;273:H156–163. doi: 10.1152/ajpheart.1997.273.1.H156. [DOI] [PubMed] [Google Scholar]
- Williams DA, Segal SS. Feed artery role in blood flow control to rat hindlimb skeletal muscles. J Physiol. 1993;463:631–646. doi: 10.1113/jphysiol.1993.sp019614. [DOI] [PMC free article] [PubMed] [Google Scholar]