Abstract
Previous studies on single fast-twitch fibres from mouse toe muscles have shown marked fatigue-induced changes in the free myoplasmic [Ca2+] ([Ca2+]i), while mitochondrial [Ca2+] remained unchanged. We have now investigated whether muscle fibres from the legs of mice respond in a similar way. Intact, single fibres were dissected from the soleus and extensor digitorum longus (EDL) muscles of adult mice. To measure [Ca2+]i, indo-1 was injected into the isolated fibres. Mitochondrial [Ca2+] was measured using Rhod-2 and confocal laser microscopy. Fatigue was induced by up to 1000 tetanic contractions (70 Hz) given at 2 s intervals. In soleus fibres, there was no significant decrease in tetanic [Ca2+]i at the end of the fatiguing stimulation, whereas tetanic force was significantly reduced by about 30 %. In 10 out of 14 soleus fibres loaded with Rhod-2 and subjected to fatigue, mitochondrial [Ca2+] increased to a maximum after about 50 tetani; this increase was fully reversed within 20 min after the end of stimulation. The force-frequency curve of the non-responding soleus fibres was shifted to higher frequencies compared to that of the responding fibres. In addition, eight out of nine Rhod-2-loaded EDL fibres showed similar changes in mitochondrial [Ca2+] during and after a period of fatiguing stimulation. The stimulation-induced increase in mitochondrial [Ca2+] was reduced when mitochondria were depolarised by application of carbonyl cyanide 4-(trifluoromethoxy)phenylhydrazone, whereas it was increased by application of an inhibitor of the mitochondrial Na+/Ca2+ exchange (CGP-37157). In conclusion, isolated slow-twitch muscle fibres show only modest changes in tetanic force and [Ca2+]i during repeated contractions. The increase in mitochondrial Ca2+ does not appear to be essential for activation of mitochondrial ATP production, nor does it cause muscle damage.
Mammalian skeletal muscle fibres are generally rich in mitochondria, which make up about 10-15 % of a fibre's volume (Eisenberg, 1983; Chen et al. 2001). Mitochondria are distributed differentially in skeletal muscle, with a higher density being found close to the sarcolemma than deeper in the fibre (Eisenberg, 1983; Nakae et al. 1999). The key function of mitochondria has always been thought to be that of an energy supplier that adapts readily to the changing demands of the working muscle. Energy production by the mitochondria increases during exercise. It is generally accepted that increases in metabolites such as ADP and inorganic phosphate act as potent stimuli to increase ATP generation by the mitochondria (e.g. Vendelin et al. 2000). The nature of Ca2+ involvement in the increased metabolic activity of the mitochondria is not entirely understood. Several mitochondrial dehydrogenases involved in the tricarboxylic acid cycle are known to be sensitive to Ca2+ (Denton & McCormack, 1990; McCormack et al. 1990) and recent experiments suggest that Ca2+ directly stimulates mitochondrial respiration (Kavanagh et al. 2000).
Aside from their important role as energy suppliers, mitochondria may play a further role, which is to modulate the cytosolic free [Ca2+] ([Ca2+]i), as has been demonstrated to occur in neurones (David et al. 1998), cardiac myocytes (Duchen et al. 1998) and in frog muscle fibres (Lännergren et al. 2001). Sembrowich et al. (1985) demonstrated that mitochondria isolated from fast- and slow-twitch mammalian skeletal muscle have the capacity to take up Ca2+, and the kinetic characteristics of that Ca2+ uptake suggested that, in the intact fibre, mitochondria could play a significant role in lowering [Ca2+]i in slow-twitch muscle. Gillis (1997) demonstrated that pharmacological inhibition of mitochondrial Ca2+ uptake with ruthenium red results in slowed force relaxation in skinned fibres. In addition, several groups have reported that mitochondria isolated from skeletal muscle after exhaustive exercise contain more Ca2+ than those isolated from non-exercised muscle (Duan et al. 1990; Madsen et al. 1996), although such accumulation appeared to depend on the mode of exhaustive exercise (Tate et al. 1980). One factor that may contribute to the decline in force during a bout of activity is that the associated rise in energy demand leads to increased generation of reactive oxygen species (ROS). Ca2+ uptake into the mitochondria and the resultant mitochondrial Ca2+ loading are also implicated in increased ROS production (Dykens, 1994; Grijalba et al. 1999). Increased ROS accumulation could lead to impaired crossbridge function as well as a reduction in sarcoplasmic reticulum (SR) Ca2+ release and uptake (see Reid & Durham, 2002 and references therein; Andrade et al. 1998; Posterino et al. 2003).
Based on these findings, we predicted that mitochondria in adult mammalian skeletal muscle fibres would take up Ca2+. However, we were surprised to find in an earlier study that while mitochondria in frog fibres took up Ca2+, mitochondria in mouse fast-twitch toe muscle fibres did not, even when active uptake of Ca2+ into the SR was inhibited (Lännergren et al. 2001). We postulated that this reflects the fact that the fast-twitch fibres of the toe muscles rely more heavily on glycolysis as a source of energy during a bout of activity than on increased mitochondrial respiration. The aims of the present study were firstly to determine whether mitochondrial Ca2+ uptake occurs in fibres from a mouse slow-twitch muscle and whether accumulation of Ca2+ in the mitochondria is associated with a reduction in contractile force, and secondly to confirm that mitochondrial Ca2+ uptake does not occur in a muscle composed overwhelmingly of fast-twitch fibres.
METHODS
Young (3-5 months) NMRI male mice were supplied by B & K Universal (Sollentuna, Sweden). The studies were approved by the Stockholm North local ethical committee. Mice were killed by cervical dislocation, and either the soleus or the extensor digitorum longus (EDL) muscles were removed. The soleus muscle in this strain of mice is composed of type I and type IIa fibres (Maréchal & Becker-Bleukx, 1993), while the EDL is composed predominantly of type IIb fibres (Maréchal et al. 1995). Single fibres were isolated from the muscles in the following manner. A pair of jeweller's forceps and micro-iris scissors were used to split the soleus muscle longitudinally into two halves, whilst the EDL was split into four bundles. In each segment, a small group of fibres lying on the outer margin of the bundle was selected and all other fibres were cut midway along their length and then dissected away to leave only a small bundle of fibres. A single fibre in the remaining group of 10 or so fibres was isolated by removing the other fibres and the connective material that holds the fibres together. Care was taken to remove all cut fibre segments, especially those near the tendons, since in preliminary experiments it was found that some fibre segments appeared to seal and subsequently contract in response to electrical stimulation. Finally, platinum clips were attached to the tendons. Fibres were suspended horizontally between an adjustable hook and an Akers AE801 force transducer in the perfusion channel of a muscle bath that was placed on the stage of an inverted microscope. Fibres were stretched to the length at which maximum tetanic force was obtained. The bottom of the perfusion channel consisted of a thin glass cover slip (< 0.12 mm thick) and the fibre was mounted as close as possible to this. The fibre was flanked by platinum electrodes, which were used for stimulation.
Contractions were evoked using 1-100 Hz stimulus trains with a duration of 500 ms in the case of the soleus and 200 ms in the case of the EDL. A control force-frequency curve was obtained and then, 15 min later, fibres were stimulated with up to 1000 tetani (70 Hz, 500 ms) in the case of the soleus or 500 tetani (70 Hz, 200 ms) in the case of the EDL, given at 2 s intervals. Stimulation was stopped if force fell to 40 % of the initial force. In separate sets of experiments, which were designed to investigate mitochondrial Ca2+ uptake and release mechanisms, fibres were subjected to two sets of 25 tetani that were separated by 45-60 min, first in the absence and then in the presence of drugs acting on the mitochondria. Each fibre was used in only one experiment.
Solutions
Muscle fibres were superfused with a solution containing (mM): NaCl 121, KCl 5, MgCl2 0.5, Na2HPO4 0.4, CaCl2 1.8, EDTA 0.1, NaHCO3 24 and glucose 5.5, and fetal calf serum (0.2 %, Gibco). This solution was bubbled with 95 % O2 : 5 % CO2 (pH 7.4). All experiments were performed at room temperature (24-26 °C). The following stock solutions were prepared and used during the subsequent month: 10 mM carbonyl cyanide 4-(trifluoromethoxy)phenylhydrazone (FCCP) in ethanol, 10 mM CGP-37157 (CGP) in DMSO and 1 mM cyclosporin A (CyA) in ethanol. In order to depolarise mitochondria, 0.2-0.5 μM FCCP was applied for 5 min before the start of experiments. CGP (10 μM) was applied for 10 min to block mitochondrial Na+/Ca2+ exchange. CyA (4 μM) was added for 20 min in order to inhibit opening of the mitochondrial permeability transition pore.
Measurement of myoplasmic [Ca2+]i
A total of seven soleus fibres were pressure-injected with the fluorescent indicator indo-1 in order to measure simultaneously [Ca2+]i and force. Following injection of the dye, fibres were left for a further 45 min before any measurements were made. The dye was excited with light at 360 ± 5 nm, and the light emitted at 405 ± 5 and 495 ± 5 nm was measured with two photomultiplier tubes. The ratio (R) of the light emitted at 405 nm to that emitted at 495 nm was translated to [Ca2+]i using the equation:
| (1) |
where KD is the apparent dissociation constant of the dye, β is the ratio of the 495 nm signals at very low and saturating [Ca2+], and Rmin and Rmax are the ratios at very low and at saturating [Ca2+], respectively. Values for KD and β were assumed to be similar to those established previously in mouse toe fibres, whilst Rmin and Rmax were established intracellularly, as described previously (Andrade et al. 1998). In six of the seven fibres, force-[Ca2+] curves were produced by plotting the force measured during the last 100 ms of stimulation in tetani at each frequency against the [Ca2+]i measured during the same time period. These data were then fitted with the following Hill equation:
| (2) |
where P is the tetanic force, Pmax the peak tetanic force, Ca50 is the [Ca2+]i that gives 50 % of Pmax and N is a measure of the slope of the relationship.
Basal [Ca2+]i was defined as the [Ca2+]i in the final 100 ms before the start of electrical tetanic stimulation. Tetanic [Ca2+]i was defined as the [Ca2+]i during the final 100 ms of electrical tetanic stimulation when the [Ca2+]i was at a plateau value. Changes in the removal of Ca2+ by the SR were monitored by measuring the mean [Ca2+]i over a 100 ms period (50-150 ms) during the decay phase of the tetanic Ca2+ transient (Westerblad & Allen, 1996). The force rise time was measured as the time taken for tetanic force to develop to 90 % of its maximum value, and the half-relaxation time was defined as the time taken for force to decay to 50 % after the end of electrical stimulation.
Mitochondrial dyes and laser confocal microscopy
Soleus and EDL fibres were incubated in 5 μM rhod-2 AM (Rhod-2; Molecular Probes) for 90-120 min at room temperature. Rhod-2 is a positively charged molecule that preferentially loads into mitochondria, leaving relatively little in the myoplasm (see Babcock et al. 1997). In a separate series of experiments, four soleus fibres were incubated for 10 min at room temperature with 1 μg ml−1 rhodamine 123 (R123; Molecular Probes), which is a mitochondrial-specific dye used to monitor the mitochondrial membrane potential. In a further series of experiments, three soleus fibres were loaded with both Rhod-2 (5 μM for 120 min) and R123 (1 μg ml−1 for 10 min). Following loading with the mitochondrial dyes, fibres were washed for at least 30 min. The general format of experiments with the confocal microscope was as follows. First a confocal image of the rested fibre was obtained. Next, a confocal image was taken after a single 100 Hz tetanus. After 15 min, a control confocal image was obtained and then the fibre was fatigued by a series of tetani. In order to obtain confocal images, a 10 s pause was imposed after 10, 25, 50, 100, 200, 300 and 500 tetani. Confocal images were also obtained at the end of fatigue and then at 1, 2, 3, 5 and 10 min, and at regular intervals thereafter until the appearance of fibres had returned to that observed before induction of fatigue.
In experiments on soleus fibres in which the effects of FCCP, CGP or CyA on mitochondrial Ca2+ uptake were tested, fibres were subjected to two series of 25 tetani at 2 s intervals: first in the absence of the drug and then 45-60 min later in the presence of the drug. In these experiments, confocal images were obtained at rest, after 10 and 25 tetani and then at 1, 2, 3 and 5 min after the end of the series.
We used a BioRad MRC 1024 unit with a krypton-argon mixed-gas laser run at 15 mW (BioRad Microscopy Division, Hemel Hempstead, UK) attached to a Nikon Diaphot 200 inverted microscope. In the majority of experiments, a Nikon Plan Apo × 40 oil-immersion objective lens (NA 1.3) was used. Rhod-2 was excited with 568 nm light and the emitted light was collected through a 585 nm long-pass filter; R123 was excited with 488 nm light and emitted light was collected through a 522 nm band-pass filter. The minimum laser power required for acceptable images was 3 % of the maximum, although up to 10 % power was used. Images were stored and analysed afterwards with ImageJ (NIH, USA; http://rsb.info.nih.gov/ij/). The average pixel intensity in an area containing mitochondria was defined as the Rhod-2 mitochondrial intensity, while a measurement made in a nearby area devoid of distinctly visible mitochondria was defined as the myoplasmic or background intensity. During the series of repeated tetanic contractions, mitochondria in soleus fibres showed marked increases in intensity, while the myoplasm or background intensity showed little change (see below). At each time point, the myoplasmic intensity was subtracted from the mitochondrial Rhod-2 intensity. Changes in mitochondrial Rhod-2 intensity at each time point (F) are expressed as a ratio of that measured in the rested fibre (F0). This procedure allowed comparison of the mitochondrial Rhod-2 signal in different fibres.
Methodological issues
Several sets of experiments were undertaken to establish that Rhod-2 loaded into the mitochondria and responded only to changes in mitochondrial [Ca2+]. In the first set of experiments, the changes in fluorescence in a single soleus muscle fibre labelled with both R123 and Rhod-2 were monitored during and after a series of 10 tetani (70 Hz, 500 ms) applied at 2 s intervals. Figure 1A shows that the R123 fluorescence was unchanged, while that of Rhod-2 was increased immediately after the series of 10 tetani and then declined back to the control level after 3 min. It is clear that dark regions corresponding to areas with no mitochondria and bright horizontal rows corresponding to labelled mitochondria that can be identified in the R123 images are identical to those seen in the Rhod-2 images. Similar results were obtained in another two fibres. Thus, Rhod-2 is localised to the mitochondria. In the second set of experiments, it was necessary to demonstrate that the increase in Rhod-2 fluorescence as a result of tetanic stimulation originated overwhelmingly in the mitochondria. Figure 1B shows a transverse line scan (every 6 ms) of a line at a depth of about 5 μm in a Rhod-2-loaded soleus muscle fibre before, during and after a 4.4 s long tetanus. The fibre was subjected to five tetani just before the start of the image in order to give a detectable level of mitochondrial fluorescence, and it can be seen that only mitochondria located just below the sarcolemma showed an increase in Rhod-2 fluorescence (upper edge of the fibre). At the start of the contraction, the fibre twisted slightly, but then returned to its original position when stimulation was stopped. During the period of contraction there was no change in the level of fluorescence in the middle of the fibre at a time when there was a dramatic increase in [Ca2+]i (see Fig. 2). Only close to the sarcolemma was there an increased fluorescence. Similar results were obtained in a further three fibres. These results strongly suggest that Rhod-2 loads almost exclusively into the mitochondria and that little remains in the myoplasm. In the third and final set of experiments it was necessary to demonstrate that, in at least some of the Rhod-2-loaded mouse fibres that showed no change in fluorescence as a result of repeated tetanic stimulation, the mitochondria actually contained Rhod-2 and were able to accumulate Ca2+ under certain circumstances. Localised damage to the sarcolemma was induced by repeatedly scanning a small area close to the sarcolemma with maximum laser power. Figure 1C shows the area before and 15 min after localised damage was induced. Similar findings were obtained in a further two muscle fibres examined. Increased fluorescence was observed only in the bands of mitochondria, indicating that mitochondria that normally do not accumulate Ca2+ can be forced to take up Ca2+. These results show that Rhod-2 could be loaded into the mitochondria of muscle fibres that showed no increase in mitochondrial fluorescence in response to tetanic stimulation.
Figure 1. Typical examples of dual labelling of mitochondria in mouse skeletal muscle fibres (A), the changes in mitochondrial [Ca2+] reported by Rhod-2 during a long tetanus (B) and the increase in mitochondrial [Ca2+] following localised damage to the sarcolemma (C).
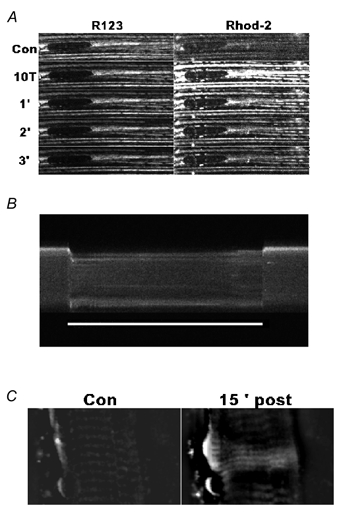
A, R123 (left) and Rhod-2 (right) staining of the subsarcolemmal mitochondria in a soleus fibre before (Con), at the end of 10 tetani (10T) and at 1, 2 and 3 min afterwards (1′, 2′ and 3′, respectively). Mitochondria are observed organised in rows parallel to the long axis of the fibre; the dark oval at the left is a nucleus (length along the major axis 27 mm). B, transverse line scan in a 38 mm diameter soleus fibre before, during and after a 4.4 s, 70 Hz tetanus (indicated by the white bar below the fibre). Time runs from left to right. For ease of identification, the fibre was stimulated with five tetani 30 s before in order to cause a measurable signal in the mitochondria. It can be seen that there was no generalised rise in the myoplasmic fluorescence during the tetanus. C, the same area of a 40 mm soleus fibre loaded with Rhod-2 that did not take up Ca2+ in response to tetanic stimulation in images obtained before (Con) and 15 min after (15′ post) local damage was induced. Intense fluorescence can be seen in the damaged area, while less intense fluorescence occurred in the bands of mitochondria that are located more centrally.
Figure 2. Tetanic [Ca2+]i and force changes before, during and after fatigue.
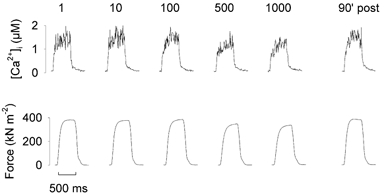
Typical [Ca2+]i and force transients recorded from a single soleus fibre injected with indo-1 during stimulation with 1000 tetani at 2 s intervals. The numbers above the traces refer to the number of that tetanus in the series. Note that the [Ca2+]i and force records show little change over the series of tetani.
Statistics
Values are expressed as means ± S.E.M. Student's t test (unpaired or paired as necessary) and a significance level of P < 0.05 were used to check for statistical significance.
RESULTS
Alterations in [Ca2+]i and force during repeated tetanic stimulation
Typical tetanic [Ca2+]i and force transients recorded in a single soleus fibre during a series of 1000 tetani are shown in Fig. 2. In this fibre, tetanic [Ca2+]i increased slightly in the early part of the series, while force fell 10 % (compare tetani 10 and 100 with the first tetanus). Thereafter, [Ca2+]i and tetanic force declined slightly, but even in the last tetanus of the series of 1000, while both [Ca2+]i and force were reduced, they were not strikingly different from their starting values. A graph of the mean values shows that [Ca2+]i was not significantly reduced over the series (P > 0.05, paired t test), being 1.61 ± 0.21 μM in the first tetanus and 1.34 ± 0.16 μM in the final tetanus of the series (Fig. 3A). However, there was a significant decline in force over the same period (P < 0.05, n = 7, paired t test), with peak tetanic force being 324 ± 26 kN m−2 in the first tetanus and 238 ± 25 kN m−2 in the final tetanus (Fig. 3B). For six of the seven fibres, the parameters Pmax, Ca50, and N from eqn (2) were calculated individually and the mean values in the unfatigued state were: Pmax, 387 ± 30 kN m−2; Ca50, 0.69 ± 0.11 μM; N, 3.91 ± 0.32. These mean values were used to calculate the mean force-[Ca2+] curve shown in Fig. 3C. It can be seen that while the mean value for the first tetanus of the fatigue series lies on the calculated curve, the mean value for the last tetanus is displaced below and to the right of the curve, reflecting a reduced sensitivity to Ca2+ of the contractile apparatus and/or a decreased maximum force production.
Figure 3. Plateau [Ca2+]i and peak force during a series of 1000 tetanic contractions.
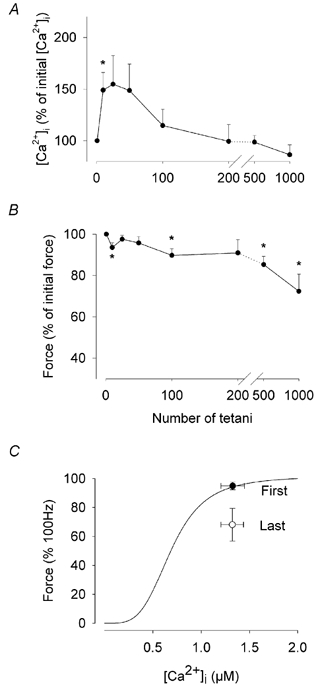
Mean values (± S.E.M.) for tetanic [Ca2+]i (A) and relative force (B) from seven fibres during a series of 1000 tetani. Note the break in the axis between the values for 200 and 500 tetani. *Significantly different from value at time 0, P < 0.05. C, the mean force-[Ca2+] curve from six fibres together with the mean data points measured during the first (First) and the last (Last) tetani.
There was no evidence of slowing of relaxation of the [Ca2+]i or force transients in the last tetanus compared to the first tetanus (Fig. 4), indicating that Ca2+ removal into the sarcoplasmic reticulum was not changed. There was no significant change in the time taken for force to decrease to 50 % of its peak value (P > 0.05, paired t test), being 67 ± 7 and 61 ± 6 ms in the first and last tetanus, respectively. Basal [Ca2+]i did not change significantly (P > 0.05, paired t test, n = 7) over the series of 1000 tetani, and was 71 ± 15 and 89 ± 16 nM before the first and last tetanus, respectively. The average increase in the individual fibres was 18 ± 9 nM. However, there was a marked difference in the rate of force development in the last tetanus compared to the first. Thus, the time taken for force to develop to 90 % of its maximum was 172 ± 24 ms in the last tetanus of the series, which was significantly greater (P < 0.05, n = 7, paired t test) than the value of 107 ± 12 ms measured in the first tetanus.
Figure 4. The rates of relaxation of [Ca2+]i and force transients are similar in the first and last tetani.
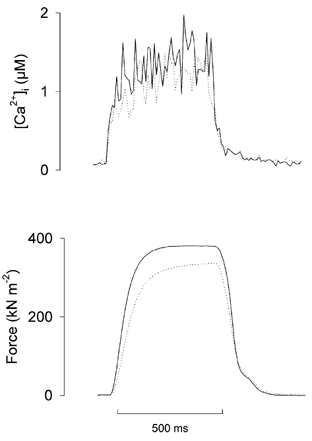
Typical examples of the first (continuous line) and the last (dotted line) tetanic [Ca2+]i (top) and force transients (bottom) in a series of 1000 tetani, superimposed to allow comparison. Note that the decay of [Ca2+]i showed no slowing in the last tetanus. Note also that the last force transient showed a slower rate of force development than the control, while the rate of force relaxation was virtually unchanged in the last compared to the first tetanus.
Changes in mitochondrial [Ca2+] during and after repeated tetanic stimulation
Soleus fibres
A total of 14 soleus fibres loaded with Rhod-2 were subjected to a full fatiguing run (i.e. stimulated with 1000 tetani or until force had fallen to 40 % of the starting value). In 10 of these fibres, mitochondrial [Ca2+] increased even after a single tetanus. A typical example of the changes in mitochondrial [Ca2+] that occurred during and after a series of 1000 tetani is shown in Fig. 5. The increase in mitochondrial Ca2+ was characteristically observed in those mitochondria that lay close to the sarcolemma. The mean data from the 10 fibres whose mitochondria took up Ca2+ is shown in Fig. 6. The mitochondrial Rhod-2 F/F0 reached its maximum value of 9.1 ± 1.7 after 50 tetani (Fig. 6A). Thereafter, mitochondrial [Ca2+] declined slightly throughout the rest of the series. At the end of the stimulation period, the mitochondrial Rhod-2 F/F0 was 62 ± 7 % of its maximum value and force had decreased to 61 ± 7 % of the starting value (n = 10). Within 5 min after the series of tetani ended, the mitochondrial Rhod-2 F/F0 had decreased to 50 % of the value recorded at the end of stimulation and was almost completely restored to its resting value within 20 min (Fig. 6B). At this time, tetanic force was 88 ± 8 %, which was not significantly different from the pre-fatigue force (P > 0.05, paired t test).
Figure 5. Typical example of the changes in mitochondrial [Ca2+] in a soleus fibre during and after a series of repeated tetani.
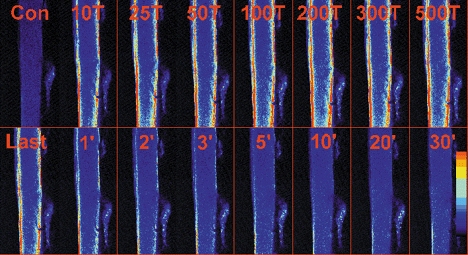
Image of the mitochondrial Rhod-2 fluorescence before (Con), during a series of 1000 tetani (10T to Last) and for 30 min after (1′ to 30′). The mitochondrial [Ca2+] is clearly increased after 10 tetani and reaches its maximum at 50 or 100 tetani. The mitochondrial [Ca2+] falls rapidly after the end of stimulation. Fibre diameter is 45 μm. The coloured bar at the bottom right indicates the level of Ca2+, with blue representing low [Ca2+] and red high [Ca2+].
Figure 6. Mean change in mitochondrial [Ca2+] before, during and after a series of repeated tetani.
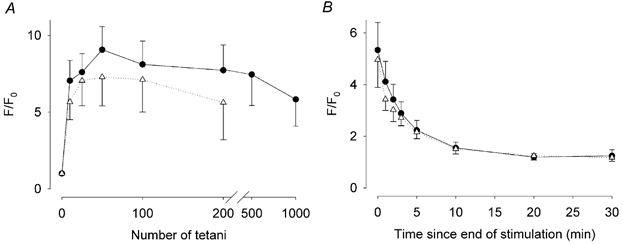
A, mean data (± S.E.M.) from 10 soleus fibres (•) and eight EDL fibres (▵) showing the changes in the mitochondrial Rhod-2 F/F0 during and for 30 min after a series of up to 1000 tetani. The mitochondrial [Ca2+] is clearly increased after 10 tetani, reaches its maximum at 50 tetani, and thereafter falls steadily during the remaining period of stimulation. B, after stimulation was stopped, the mitochondrial [Ca2+] falls relatively rapidly, with a decline to 50 % of its final value within 3 min.
The remaining four soleus fibres showed no change in mitochondrial [Ca2+] even when stimulated with as many as 1000 tetani. The force-frequency curves of this group of soleus fibres (non-responders) and the group of soleus fibres whose mitochondria took up Ca2+ (responders) were plotted (Fig. 7). It can be seen that the curve of the non-responders was shifted to higher frequencies compared to that of the responders. The frequency needed to produce 50 % of maximal force was 17.2 ± 2.1 and 26.8 ± 3.4 Hz for the responders and non-responders, respectively, and these values are significantly different (P < 0.05). These results indicate that in soleus fibres with a force-frequency curve approaching that of fast-twitch fibres, mitochondria were unable to take up Ca2+, in contrast to those fibres with a force-frequency curve typical of slow-twitch fibres.
Figure 7. Force-frequency curves of soleus and EDL fibres.
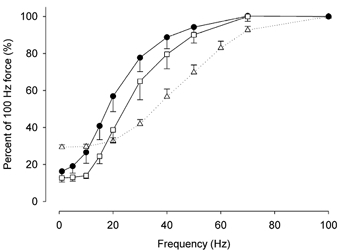
Force-frequency curves for those soleus fibres in which mitochondrial [Ca2+] increased as a result of tetanic stimulation (•, n = 10) and those that did not (□, n = 4) are shown together with the force-frequency curve of the EDL fibres in which mitochondria took up Ca2+ (▵, n = 8). Values shown are means ± S.E.M.
EDL fibres
As noted in the previous paragraph, soleus fibres that did not take up Ca2+ had a force-frequency curve approaching that of fast-twitch fibres, and so mitochondrial Ca2+ uptake in single fibres from the fast-twitch EDL muscle was investigated. Nine EDL fibres were loaded with Rhod-2 and eight of these fibres showed an elevation in mitochondrial [Ca2+] during a series of up to 500 tetani. It is noteworthy that the force-frequency curve of these eight EDL fibres was shifted to higher frequencies compared to the soleus data (Fig. 7) and the frequency required to produce 50 % of maximum force in the EDL fibres, 36.6 ± 2.3 Hz, was significantly higher (P < 0.05) than that needed in either group of soleus fibres. A typical example of the changes in mitochondrial [Ca2+] in an EDL fibre during and after a series of tetani is shown in Fig. 8. As for the soleus fibres, the increase in mitochondrial [Ca2+] was detected only in those mitochondria located close to the sarcolemma. Mean data from the eight fibres in which mitochondrial [Ca2+] increased are plotted in Fig. 6A. The peak mitochondrial Rhod-2 F/F0 value of 7.3 ± 1.9 occurred after 50 tetani and declined thereafter over the remainder of the series of tetani. At the end of the stimulation period, mitochondrial [Ca2+] was 68 ± 7 % of its peak value and force had decreased to 41 ± 2 % of the initial value. Within 5 min after the tetanic stimulation was stopped, mitochondrial [Ca2+] declined to 50 % of its value and was almost completely restored to its original value within 20 min (Fig. 6B). At this time, tetanic force had recovered to 74 ± 6 % of the pre-fatigue value, which is significantly different from the pre-fatigue value (P < 0.05, paired t test).
Figure 8. Typical example of the changes in mitochondrial [Ca2+] in an EDL fibre during and after a series of repeated tetani.
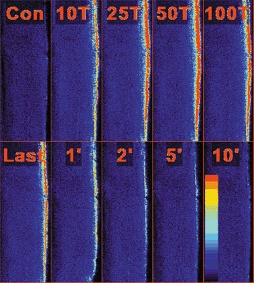
Image of the mitochondrial Rhod-2 fluorescence before (Con), during a series of 192 tetani (10T to Last) and for 10 min after (1′ to 10′). The mitochondrial [Ca2+] is clearly increased after 10 tetani and reaches its maximum after 50 tetani. The mitochondrial [Ca2+] falls rapidly after the end of stimulation. Fibre diameter is 39 μm. The coloured bar in the bottom right indicates the level of Ca2+, with blue representing low [Ca2+] and red high [Ca2+].
Data from earlier studies suggested that accumulation of Ca2+ in the mitochondria is involved in force depression (Duan et al. 1990; Madsen et al. 1996). If this is the case, then a plot of peak mitochondrial [Ca2+] and the final force would show a negative relationship between these two parameters. Figure 9 shows data from all of the soleus and EDL fibres that showed an increase in mitochondrial [Ca2+]; it is clear that there is no negative relationship between peak mitochondrial [Ca2+] and tetanic force in the last tetanus of the series. In fact, there was a significant positive correlation between peak mitochondrial [Ca2+] and final tetanic force in the soleus (P = 0.029), but not in the EDL (P = 0.866) fibres. Thus, the large sustained increases in mitochondrial [Ca2+] observed in the present study were not detrimental to the contractile performance of soleus or EDL fibres.
Figure 9. Elevated mitochondrial [Ca2+] was not associated with impaired tetanic force production.
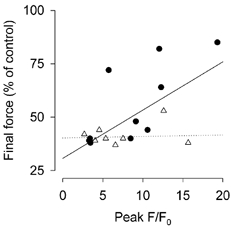
Plot of the peak mitochondrial Rhod-2 F/F0versus the final force recorded in the individual soleus (•) and EDL (▵). Each symbol represents one fibre. The continuous line is a line fitted to the soleus data by least squares regression, whilst the dotted line is a similar line fitted to the EDL data.
Mechanisms of mitochondrial Ca2+ uptake and release
The final sets of experiments undertaken in this study were designed to determine whether mechanisms that are known to be responsible for mitochondrial Ca2+ uptake and release in other tissues also operate in soleus muscle fibres. In this series of experiments, each soleus muscle fibre was subjected to two series of 25 tetani separated by a 45 min interval, which allows for paired comparisons. Figure 10A shows the mean data from three fibres subjected to the two series of tetani in the absence of any drug. It is clear that the changes in mitochondrial [Ca2+] and its time course were identical in the two series.
Figure 10. Repeated series of 25 tetani in the absence of drugs induce identical changes in mitochondrial [Ca2+].
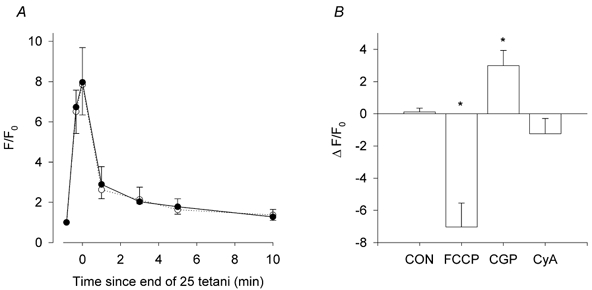
A, changes in the mitochondrial Rhod-2 fluorescence (F/F0) during a first series of 25 tetani (solid line, filled circles) and 45 min later during a second series of 25 tetani (dotted line, open circles). The two curves are virtually superimposable. Values are mean ± S.E.M. of three fibres. B, changes in mitochondrial Rhod-2 fluorescence during a second series of 25 tetani compared to the first series. Values are mean ± S.E.M. in the absence of any drug (CON, n = 3), in the presence of 0.5 μM FCCP (n = 5), 10 μM CGP (n = 5) or 4 μM CyA (n = 6). *Significantly different from the CON value, p < 0.05, paired t test.
In Fig. 10B, the mean difference in F/F0 between the first and second runs under different conditions is plotted. In five fibres, the presence of FCCP significantly reduced the increase in the mitochondrial [Ca2+] by 69.4 ± 2.6 % during the brief series of tetani (P < 0.05, paired t test). Thus, mitochondrial Ca2+ uptake is dependent on the mitochondrial potential.
In other tissues, mitochondrial Ca2+ uptake was found to be accompanied by depolarisation of the mitochondria. It was thought of interest to investigate whether this also occurs in skeletal muscle mitochondria. In four soleus fibres and one EDL fibre, we investigated whether the mitochondrial potential monitored with R123 was reduced by trains of up to 1000 tetani. In none of the fibres was there any change in the intensity of R123 fluorescence (data not shown). Three of the four soleus fibres were exposed to FCCP, which depolarises the mitochondria, and, as expected, there was a complete loss of the R123 fluorescence within 4-6 min (data not shown).
In five fibres, inhibition of the mitochondrial Na+/Ca2+ exchanger with 10 μM CGP significantly increased the mitochondrial signal during the series of 25 tetani by 56.5 ± 25.1 % (P < 0.05, paired t test; Fig. 10B). It also reduced the rate of decline of the mitochondrial Rhod-2 signal after the series had ended. In the presence of CGP, the time constant of the decline of mitochondrial [Ca2+] was 1.93 ± 0.41 min, which was significantly greater than the value of 0.64 ± 0.05 min recorded in the absence of the drug (P < 0.05, paired t test). Thus, release of Ca2+ from the mitochondria depends upon the operation of the mitochondrial Na+/Ca2+ exchanger.
Some studies have suggested that the mitochondrial permeability transition pore plays a role in the controlled release of Ca2+ from the mitochondria (e.g. He & Lemasters, 2002). CyA (4 μM) is known to block opening of the pore. However in six fibres, CyA had no significant effect on the changes in mitochondrial [Ca2+] during a series of 25 tetani (Fig. 10B). Thus, under the experimental conditions utilised in the present study, the mitochondrial permeability transition pore does not play any role in the extrusion of Ca2+ from the mitochondria.
DISCUSSION
The major results of this study are: (i) in mouse soleus fibres, neither basal nor tetanic [Ca2+]i showed significant changes during extended periods of stimulation; (ii) mitochondrial [Ca2+] increased in many, but not all of the soleus and EDL muscle fibres examined; (iii) the rise in mitochondrial [Ca2+] was dependent on normal polarisation of the mitochondria, while the extrusion of mitochondrial [Ca2+] was dependent on the mitochondrial Na+/Ca2+ exchanger; and (iv) the accumulation of mitochondrial [Ca2+] was not correlated with impaired contractile performance.
[Ca2+]i and force transients in soleus muscle fibres during extended periods of stimulation
At the end of a period of prolonged stimulation, neither the amplitude nor the time course of the tetanic [Ca2+]i transients were significantly different from the starting value. Similarly, while tetanic force was slightly but significantly reduced (cf. González & Delbono, 2001), the rate of relaxation of force was unchanged in the last compared to the first tetanus. In whole soleus or EDL muscles that are subjected to a fatiguing protocol similar to that employed here, tetanic force declines more rapidly than observed in single muscle fibres (e.g. Dahlstedt et al. 2000). The explanation for this may reflect the difference in milieu. In the single fibres used here, the fibre is continuously superfused so that there is no build-up of metabolites or ions around the fibre, whereas in whole muscles, repeated contractions may lead to the accumulation of metabolites around the more deeply located muscle fibres.
One conspicuous feature noted in all soleus fibres subjected to extended periods of intermittent tetanic contractions was the slowing of the rate of force development (Fig. 4). This finding was not seen in the EDL fibres (data not shown). The slowing was not due to any irreversible stretching of an elastic component, because the time course returned to its initial value afterwards. It could reflect a slower release of Ca2+ from the SR, possibly arising from localised depletion of ATP in the triadic region, or impaired strong crossbridge formation, which fits with the change in the force-[Ca2+]i relationship shown in Fig. 3C.
Characteristics of Ca2+ accumulation in mouse skeletal muscle mitochondria
It is interesting to note that the fastest increase in the Rhod-2 mitochondrial signal occurs rather early in a bout of repeated tetani. The time course of the reversal of the mitochondrial Rhod-2 signal after the end of stimulation was also rather fast. Uptake of Ca2+ from the cytosol into the mitochondria appears to occur by two pathways. The first and best known of these is the Ca2+ uniporter. In mitochondria isolated from rabbit soleus muscle, the uniporter is half-maximally activated at about 2.5 μM Ca2+ and has a maximum velocity of about 2.6 nmol (mg protein)−1 s−1, whilst in mitochondria isolated from rat fast-twitch muscles these values are 0.9-1.0 μM Ca2+ and 0.6-0.9 nmol (mg protein)−1 s−1, respectively (Sembrowich et al. 1985). The activity of the mitochondrial Ca2+ uniporter can be modulated by nucleotides, inorganic phosphate and divalent cations (Litsky & Pfeiffer, 1997). A second and more controversial rapid mode of Ca2+ uptake (RaM) has been described in mitochondria from the liver (Sparagna et al. 1995) and heart (Butinas et al. 2001). In mitochondria isolated from cardiac muscle, RaM is suggested to mediate very rapid uptake at the start of a Ca2+ pulse, which, after bath [Ca2+] is reduced to 100 nM or less, takes 1 min or longer to reset (Butinas et al. 2001). This mode of uptake has not been demonstrated in intact cells and it may represent just a particular form of operation of the mitochondrial Ca2+ uniporter (Litsky & Pfeiffer, 1997). Indeed, in our experiments, this type of uptake would be active only for the first tetanus during fatigue, and thereafter would be inactive since the interval between tetani was only 2 s, which is insufficient for the RaM to reset.
In cardiac muscle, efflux of Ca2+ from the mitochondria is accomplished predominantly by a Na+/Ca2+ exchanger that is at least 10 times slower than the uniporter-mediated uptake in skeletal muscle (Sembrovitch et al. 1985; Rizzuto et al. 1999). These data suggest that significant mitochondrial Ca2+ accumulation can occur during the intermittent stimulation protocol used in the present study, due to the high [Ca2+]i (> 1 μM) resulting from each tetanus and the relatively slow extrusion of Ca2+ from the mitochondria. However, it is difficult to explain the slow decline in mitochondrial [Ca2+] after the first 100 tetani of the series. At least in the soleus, this cannot be due to reduced [Ca2+]i, as the amplitude of the Ca2+ transients is not significantly different from that at the start of the stimulation period. The decline could reflect significant amounts of Ca2+ binding to Ca2+-binding proteins such as calmitine, which are found in the mitochondrial matrix (Lestienne et al. 1995; Lucas-Heron et al. 1995), or to cardiolipin, a negatively charged phospholipid found on the inner mitochondrial membrane (Grijabla et al. 1999). It cannot be ruled out that Ca2+ precipitated out in the form of phosphate compounds, as has been postulated to explain the ceiling on mitochondrial [Ca2+] in neuronal mitochondria that are subjected to repetitive activity (David et al. 1998). However, the relatively rapid reversal of the mitochondrial Rhod-2 signal in soleus and EDL fibres immediately after the end of stimulation suggests that the majority of the Ca2+ exists in the free form in the matrix of the mitochondria. The decline could reflect increased Na+/Ca2+ exchange in response to the Na+ accumulation that occurs during repeated tetani (Juel, 1986). Little is known about the nature of the Na+/Ca2+ exchanger in the mitochondria of skeletal muscle, and the possibility that this exchanger becomes activated at lower levels of Ca2+ than in other tissues cannot be ruled out. Indeed, such a possibility is supported by the current finding (Fig. 10B) that CGP, which inhibits the mitochondrial Na+/Ca2+ exchanger, caused both an increase in the peak mitochondrial [Ca2+] during a series of repeated tetani and a delay in the rate of extrusion of Ca2+. Finally, it cannot be ruled out that the decline in the Rhod-2 signal truly reflects a decline in mitochondrial free [Ca2+].
Intriguingly, Madsen et al. (1996) reported that in human muscle, the elevations in mitochondrial [Ca2+] induced by exhaustive exercise persisted for at least 60 min after the end of exercise. We could not find any evidence of this in any fibre, as mitochondrial [Ca2+] was essentially back to control levels within 20 min. However, in their study, Madsen et al. (1996) measured total mitochondrial [Ca2+], whilst the fluorescent indicator used in the present study can only report the presence of free Ca2+ and not Ca2+ that is complexed with ions such as phosphate. Thus, the difference might reflect the different exercise protocols used and the amount of Ca2+ in the mitochondria, which would influence the development of Ca2+ precipitates there.
Entry of Ca2+ into the mitochondria depends upon the mitochondrial potential (e.g. Duchen et al. 1998; Lännergren et al. 2001). In line with this, exposure of the fibres to the protonophore FCCP greatly reduced the stimulation-induced rise in the mitochondrial Rhod-2 signal. Accumulation of Ca2+ in the mitochondria might be expected to result in some degree of depolarisation. However, the R123 signal showed little change during the course of repetitive stimulation, suggesting that the mitochondrial potential changed little. This lack of change suggests that Ca2+ entry into the mitochondria is accompanied by anion influx (Harris, 1978; Ligeti & Lukacs, 1984) or possibly cation efflux.
What is the reason for the variability in mitochondrial Ca2+ uptake?
We identified two groups of soleus fibres, those whose mitochondria could accumulate Ca2+ and those whose mitochondria could not. In addition, in the majority of EDL muscle fibres examined, the mitochondria took up Ca2+. In NMRI mice, which were used in the present study, the fibre composition of the EDL is almost exclusively fast-twitch glycolytic and oxidative-glycolytic fibres (Maréchal & Beckers-Bleukx, 1993; Maréchal et al. 1995). We reported previously that fast-twitch mouse toe muscle fibres were unable to take up Ca2+ (Lännergren et al. 2001) and suggested that this was associated with their reliance on glycolysis as a source of energy during a period of repeated tetanic contractions. Clearly, such a simple explanation based on fibre type cannot explain these differences. It is likely that the mitochondrial uniporter is subjected to rather sophisticated control, which could range from the state of the mitochondrial potential to the levels of ADP or inorganic phosphate. It is of interest to note that mitochondrial uptake and release of Ca2+ follows essentially similar time courses in soleus and EDL fibres, suggesting that the molecular mechanisms by which this is accomplished are rather similar.
Why do mitochondria take up Ca2+?
Uptake of Ca2+ by the mitochondria could play a role in at least four processes that would have profound effects on muscle performance. First, it is widely believed that a rise in mitochondrial [Ca2+] is important for activation of the Ca2+-activated dehydrogenases present there (Denton & McCormack, 1990), and indeed Jouaville et al. (1999) demonstrated that depolarisation of myotubes increased both mitochondrial [Ca2+] and [ATP]. Furthermore, Ca2+ was reported to directly stimulate oxidative phosphorylation in rat skeletal muscle mitochondria (Kavanagh et al. 2000). However, the absence of any rise in [Ca2+] in about 30 % of the soleus fibres examined here suggests that a rise in [Ca2+] may not always be required in order to increase mitochondrial metabolism during an extended bout of activity. It may indicate that alterations in other indices of muscle activity, such as ADP, inorganic phosphate or phosphorylcreatine, act as adequate stimulants of mitochondrial metabolism (Walsh et al. 2001). Second, an increase in mitochondrial [Ca2+] may be important in the modulation of mitochondrial protein turnover. Mammalian mitochondria contain their own DNA, which is transcribed and translated into integral proteins of the respiratory chain, and this process of mitochondrial protein synthesis has been shown to require Ca2+ (Joyal et al. 1995). Thus, it is conceivable that contractile activity and the ensuing mitochondrial Ca2+ pulses are involved in mitochondrial adaptations such as protein turnover in the mitochondria (Hood, 2001; Wu et al. 2002). Third, mitochondrial Ca2+ uptake may provoke an increase in ROS production. Excessive mitochondrial Ca2+ loading is implicated in augmented ROS production (Dykens, 1994; Grijalba et al. 1999). In general, excessive production of ROS is believed to exert deleterious effects on cellular function. However, moderate rises in ROS production may actually be physiologically advantageous (Andrade et al. 1998; Reid & Durham, 2002; Posterino et al. 2003). Finally, mitochondrial Ca2+ may help to buffer [Ca2+]i, as happens in neurones (David et al. 1998; David, 1999) and in frog skeletal muscle fibres (Lännergren et al. 2001). However, several lines of evidence suggest that the extent of this type of buffering is limited. In the first instance, FCCP, which greatly inhibited mitochondrial Ca2+ uptake (Fig. 10), did not cause any slowing of the [Ca2+]i or force transients (data not shown), unlike the situation in frog skeletal muscle fibres (Lännergren et al. 2001). Furthermore, in the soleus muscle fibres, there was no decline in tetanic [Ca2+]i at times when mitochondrial [Ca2+] was at or near its maximal value. Fryer & Stephenson (1996) reported that in skinned soleus fibres, virtually all of the SR Ca2+ is released in response to maximal stimulation. If a similar event happens in intact soleus fibres, accumulation of significant amounts of Ca2+ in the mitochondria during repetitive stimulation would be expected to result in a decline in the amplitude of the [Ca2+]i transient.
Conclusions
Over extended periods of contractile activity in soleus fibres, both [Ca2+]i and mitochondrial [Ca2+] are tightly regulated. The dual findings that not all mitochondria took up Ca2+ and that those fibres in which mitochondrial [Ca2+] increased did not show a significant impairment of force production suggests that an increase in mitochondrial [Ca2+] is not essential for increasing mitochondrial respiration. Furthermore, the accumulation of Ca2+ in the mitochondria does not result in skeletal muscle fibre damage, as judged by maintained force production.
Acknowledgments
This work was funded by the Swedish MRC (Project no. 3642), the Swedish National Centre for Sports Research, the Knut and Alice Wallenbergs Foundation and funds from the Karolinska Institutet. We thank two anonymous reviewers for helpful comments on the manuscript.
REFERENCES
- Andrade FH, Reid MB, Allen DG, Westerblad H. Effect of hydrogen peroxide and dithiothreitol on contractile function of single skeletal muscle fibres from the mouse. J Physiol. 1998;509:565–575. doi: 10.1111/j.1469-7793.1998.565bn.x. [DOI] [PMC free article] [PubMed] [Google Scholar]
- Babcock DF, Herrington J, Goodwin PC, Park YB, Hille B. Mitochondrial participation in the intracellular Ca2+ network. J Cell Biol. 1997;136:833–844. doi: 10.1083/jcb.136.4.833. [DOI] [PMC free article] [PubMed] [Google Scholar]
- Butinas L, Gunter KL, Sparagna GC, Gunter TE. The rapid mode of calcium uptake into heart mitochondria (RaM): comparison to RaM in liver mitochondria. Biochim Biophys Acta. 2001;1504:248–261. doi: 10.1016/s0005-2728(00)00254-1. [DOI] [PubMed] [Google Scholar]
- Chen G, Carroll S, Racay P, Dick J, Pette D, Traub I, Vrbova G, Eggli P, Celio M, Schwaller B. Deficiency in parvalbumin increases fatigue resistance in fast-twitch muscle and upregulates mitochondria. Am J Physiol Cell Physiol. 2001;281:C114–122. doi: 10.1152/ajpcell.2001.281.1.C114. [DOI] [PubMed] [Google Scholar]
- Dahlstedt AJ, Katz A, Wieringa B, Westerblad H. Is creatine kinase responsible for fatigue? Studies of isolated skeletal muscle deficient in creatine kinase. FASEB J. 2000;14:982–990. doi: 10.1096/fasebj.14.7.982. [DOI] [PubMed] [Google Scholar]
- David G. Mitochondrial clearance of cytosolic Ca2+ in stimulated lizard motor nerve terminals proceeds without progressive elevation of mitochondrial matrix [Ca2+] J Neurosci. 1999;19:7495–7506. doi: 10.1523/JNEUROSCI.19-17-07495.1999. [DOI] [PMC free article] [PubMed] [Google Scholar]
- David G, Barrett JN, Barrett EF. Evidence that mitochondria buffer physiological Ca2+ loads in lizard motor nerve terminals. J Physiol. 1998;509:59–65. doi: 10.1111/j.1469-7793.1998.059bo.x. [DOI] [PMC free article] [PubMed] [Google Scholar]
- Denton RM, McCormack JG. Ca2+ as a second messenger within mitochondria of the heart and other tissue. Ann Rev Physiol. 1990;52:451–466. doi: 10.1146/annurev.ph.52.030190.002315. [DOI] [PubMed] [Google Scholar]
- Duan C, Delp MD, Hayes DA, Delp PD, Armstrong RB. Rat skeletal muscle mitochondrial [Ca2+] and injury from downhill walking. J Appl Physiol. 1990;68:1241–1251. doi: 10.1152/jappl.1990.68.3.1241. [DOI] [PubMed] [Google Scholar]
- Duchen MR, Leyssens A, Crompton M. Transient mitochondrial depolarizations reflect focal sarcoplasmic reticular calcium release in single rat cardiomyocytes. J Cell Biol. 1998;142:975–988. doi: 10.1083/jcb.142.4.975. [DOI] [PMC free article] [PubMed] [Google Scholar]
- Dykens JA. Isolated cerebral and cerebellar mitochondria produce free radicals when exposed to elevated Ca2+ and Na+: implications for neurodegeneration. J Neurochem. 1994;63:584–591. doi: 10.1046/j.1471-4159.1994.63020584.x. [DOI] [PubMed] [Google Scholar]
- Eisenberg BA. Quantitative ultrastructure of mammalian skeletal muscle. In: Peachey LD, editor. Handbook of Physiology, section 10, Skeletal Muscle. Bethseda, MD, USA: American Physiological Society; 1983. pp. 73–112. [Google Scholar]
- Fryer MW, Stephenson DG. Total and sarcoplasmic reticulum calcium contents of skinned fibres from rat skeletal muscle. J Physiol. 1996;493:357–370. doi: 10.1113/jphysiol.1996.sp021388. [DOI] [PMC free article] [PubMed] [Google Scholar]
- Gillis JM. Inhibition of mitochondrial calcium uptake slows down relaxation in mitochondria-rich skeletal muscles. J Muscle Res Cell Motil. 1997;18:473–483. doi: 10.1023/a:1018603032590. [DOI] [PubMed] [Google Scholar]
- González E, Delbono O. Age-dependent fatigue in single intact fast and slow fibers from mouse EDL and soleus skeletal muscles. Mech Ageing Dev. 2001;122:1019–1032. doi: 10.1016/s0047-6374(01)00229-9. [DOI] [PubMed] [Google Scholar]
- Grijalba MT, Vercesi AE, Schreier S. Ca2+-induced increased lipid packing and domain formation in submitochondrial particles. A possible early step in the mechanism of Ca2+-stimulated generation of reactive oxygen species by the respiratory chain. Biochemistry. 1999;38:13279–13287. doi: 10.1021/bi9828674. [DOI] [PubMed] [Google Scholar]
- Harris EJ. Anion/calcium ion ratios and proton production in some mitochondrial calcium ion uptakes. Biochem J. 1978;176:983–991. doi: 10.1042/bj1760983. [DOI] [PMC free article] [PubMed] [Google Scholar]
- He L, Lemasters JJ. Regulated and unregulated mitochondrial permeability transition pores: a new paradigm of pore structure and function? FEBS Lett. 2002;512:1–7. doi: 10.1016/s0014-5793(01)03314-2. [DOI] [PubMed] [Google Scholar]
- Jouaville LS, Pinton P, Bastianutto C, Rutter GA, Rizzuto R. Regulation of mitochondrial ATP synthesis by calcium: evidence for a long-term metabolic priming. Proc Natl Acad Sci U S A. 1999;96:13807–13812. doi: 10.1073/pnas.96.24.13807. [DOI] [PMC free article] [PubMed] [Google Scholar]
- Joyal JL, Hagen T, Aprille JR. Intramitochondrial protein synthesis is regulated by matrix adenine nucleotide content and requires calcium. Arch Biochem Biophys. 1995;319:322–330. doi: 10.1006/abbi.1995.1300. [DOI] [PubMed] [Google Scholar]
- Juel C. Potassium and sodium shifts during in vitro isometric muscle contraction, and the time course of the ion-gradient recovery. Pflugers Arch. 1986;406:458–463. doi: 10.1007/BF00583367. [DOI] [PubMed] [Google Scholar]
- Kavanagh NI, Ainscow E, Brand MD. Calcium regulation of oxidative phosphorylation in rat skeletal muscle mitochondria. Biochim Biophys Acta. 2000;1457:57–70. doi: 10.1016/s0005-2728(00)00054-2. [DOI] [PubMed] [Google Scholar]
- Lännergren J, Westerblad H, Bruton JD. Changes in mitochondrial Ca2+ detected with Rhod-2 in single frog and mouse skeletal muscle fibres during and after repeated tetanic contractions. J Muscle Res Cell Motil. 2001;22:265–275. doi: 10.1023/a:1012227009544. [DOI] [PubMed] [Google Scholar]
- Lestienne P, Bataille N, Lucas-Heron B. Role of the mitochondrial DNA and calmitine in myopathies. Biochim Biophys Acta. 1995;1271:159–163. doi: 10.1016/0925-4439(95)00023-w. [DOI] [PubMed] [Google Scholar]
- Ligeti E, Lukacs GL. Phosphate transport, membrane potential, and movements of calcium in rat liver mitochondria. J Bioenerg Biomembr. 1984;16:101–113. doi: 10.1007/BF00743043. [DOI] [PubMed] [Google Scholar]
- Litsky ML, Pfeiffer DR. Regulation of the mitochondrial Ca2+ uniporter by external adenine nucleotides: the uniporter behaves like a gated channel which is regulated by nucleotides and divalent cations. Biochemistry. 1997;36:7071–7080. doi: 10.1021/bi970180y. [DOI] [PubMed] [Google Scholar]
- Lucas-Heron B, Le Ray B, Schmitt N. Does calmitine, a protein specific for the mitochondrial matrix of skeletal muscle, play a key role in mitochondrial function? FEBS Lett. 1995;374:309–311. doi: 10.1016/0014-5793(95)01122-u. [DOI] [PubMed] [Google Scholar]
- Madsen K, Ertbjerg P, Djurhuus MS, Pedersen PK. Calcium content and respiratory control index of skeletal muscle mitochondria during exercise and recovery. Am J Physiol. 1996;271:E1044–1050. doi: 10.1152/ajpendo.1996.271.6.E1044. [DOI] [PubMed] [Google Scholar]
- Maréchal G, Beckers-Bleukx G. Force-velocity relation and isomyosins in soleus muscles from two strains of mice (C57 and NMRI) Pflugers Arch. 1993;424:478–487. doi: 10.1007/BF00374911. [DOI] [PubMed] [Google Scholar]
- Maréchal G, Coulton GR, Beckers-Bleukx G. Mechanical power and myosin composition of soleus and extensor digitorum longus muscles of ky mice. Am J Physiol. 1995;268:C513–519. doi: 10.1152/ajpcell.1995.268.2.C513. [DOI] [PubMed] [Google Scholar]
- Nakae Y, Stoward PJ, Shono M, Matsuzaki T. Localisation and quantification of dehydrogenase activities in single muscle fibers of mdx gastrocnemius. Histochem Cell Biol. 1999;112:427–436. doi: 10.1007/pl00007906. [DOI] [PubMed] [Google Scholar]
- Posterino GS, Cellini MA, Lamb GD. Effects of oxidation and cytosolic redox conditions on excitation-contraction coupling in rat skeletal muscle. J Physiol. 2003;547:807–823. doi: 10.1113/jphysiol.2002.035204. [DOI] [PMC free article] [PubMed] [Google Scholar]
- Reid MB, Durham WJ. Generation of reactive oxygen and nitrogen species in contracting skeletal muscle. Ann N Y Acad Sci. 2002;959:108–116. doi: 10.1111/j.1749-6632.2002.tb02087.x. [DOI] [PubMed] [Google Scholar]
- Rizzuto R, Pinton P, Brini M, Chiesa A, Filippin L, Pozzan T. Mitochondria as biosensors of calcium microdomains. Cell Calcium. 1999;26:193–199. doi: 10.1054/ceca.1999.0076. [DOI] [PubMed] [Google Scholar]
- Sembrowich WL, Quintinskie JJ, Li G. Calcium uptake in mitochondria from different skeletal muscle types. J Appl Physiol. 1985;59:137–141. doi: 10.1152/jappl.1985.59.1.137. [DOI] [PubMed] [Google Scholar]
- Sparagna GC, Gunter KK, Sheu SS, Gunter TE. Mitochondrial calcium uptake from physiological-type pulses of calcium: a description of the rapid uptake mode. J Biol Chem. 1995;270:27510–27515. doi: 10.1074/jbc.270.46.27510. [DOI] [PubMed] [Google Scholar]
- Tate CA, McMurray RG, Riggs CE, Setaro F, Horvath SM. Exercise and mitochondrial calcium transport in the BIO 14. 6 hamster. Eur J Appl Physiol. 1980;43:167–172. doi: 10.1007/BF00422447. [DOI] [PubMed] [Google Scholar]
- Vendelin M, Kongas O, Saks V. Regulation of mitochondrial respiration in heart cells analyzed by reaction-diffusion model of energy transfer. Am J Physiol Cell Physiol. 2000;278:C747–764. doi: 10.1152/ajpcell.2000.278.4.C747. [DOI] [PubMed] [Google Scholar]
- Walsh B, Tonkonogi M, Soderlund K, Hultman E, Saks V, Sahlin K. The role of phosphorylcreatine and creatine in the regulation of mitochondrial respiration in human skeletal muscle. J Physiol. 2001;537:971–978. doi: 10.1111/j.1469-7793.2001.00971.x. [DOI] [PMC free article] [PubMed] [Google Scholar]
- Westerblad H, Allen DG. Mechanisms underlying changes of tetanic [Ca2+]i and force in skeletal muscle. Acta Physiol Scand. 1996;156:407–416. doi: 10.1046/j.1365-201X.1996.196000.x. [DOI] [PubMed] [Google Scholar]
- Wu H, Kanatous SB, Thurmond FA, Gallardo T, Isotani E, Bassel-Duby R, Williams RS. Regulation of mitochondrial biogenesis in skeletal muscle by CaMK. Science. 2002;296:349–352. doi: 10.1126/science.1071163. [DOI] [PubMed] [Google Scholar]


