

Abstract
This study examined the relationship between the level of Ca2+ loading in the sarcoplasmic reticulum (SR) and the amount of Ca2+ released by an action potential (AP) in fast-twitch skeletal muscle fibres of the rat. Single muscle fibres were mechanically skinned and electric field stimulation was used to induce an AP in the transverse-tubular system and a resulting twitch response. Responses were elicited in the presence of known amounts (0–0.38 mM) of BAPTA, a fast Ca2+ buffer, with the SR Ca2+ pump either functional or blocked by 50 μM 2,5-di-tert-butyl-1,4-hydroquinone (TBQ). When Ca2+ reuptake was blocked, an estimate of the amount of Ca2+ released by an AP could be derived from the size of the force response. In a fibre with the SR loaded with Ca2+ at the endogenous level (≈1.2 mM, expressed as total Ca2+ per litre fibre volume; approximately one-third of maximal loading), a single AP triggered the release of ≈230 μM Ca2+. If a second AP was elicited 10 ms after the first, only a further ≈60 μM Ca2+ was released, the reduction probably being due to Ca2+ inactivation of Ca2+ release. When Ca2+ reuptake was blocked, APs applied 15 s apart elicited similar amounts of Ca2+ release (≈230 μM) on the first two or three occasions and then progressively less Ca2+ was released until the SR was fully depleted after a total of approximately eight APs. When the SR was loaded to near-maximal capacity (≈3–4 mM), each AP (or pair of APs 10 ms apart) still only released approximately the same amount of Ca2+ as that released when the fibre was endogenously loaded. Consistent with this, successive APs (15 s apart) elicited similar amounts of Ca2+ release ≈10–16 times before the amount released declined, and the SR was fully depleted of Ca2+ after a total release calculated to be ≈3–4 mM. When the SR was loaded maximally, increasing the [BAPTA] above 280 μM resulted in an increase in the amount of Ca2+ released per AP, probably because the greater level of cytoplasmic Ca2+ buffering prevented Ca2+ inactivation from adequately limiting Ca2+ release. These results show that the amount of Ca2+ released by AP stimulation in rat fast-twitch fibres normally stays virtually constant over a wide range of SR Ca2+ content, in spite of the likely large change in the electrochemical gradient for Ca2+. This was also found to be the case in toad twitch fibres. This constancy in Ca2+ release should help ensure precise regulation of force production in fast-twitch muscle in a range of circumstances.
An action potential (AP) elicits contraction in a vertebrate skeletal muscle fibre in a sequence of events known as excitation-contraction (E-C) coupling (Melzer et al. 1995). The AP depolarises the transverse tubular (T-) system, activating voltage sensors (dihydropyridine receptors, DHPRs) in the T-system membrane, which in turn somehow open the Ca2+ release channels (ryanodine receptors) in the adjacent sarcoplasmic reticulum (SR), allowing Ca2+ to flow into the cytoplasm and activate the contractile apparatus by binding to troponin-C (TnC). Though the overall sequence is clear, many important aspects of the process are not well understood. In particular, it is not known exactly what happens when the DHPRs open the Ca2+ release channels, and what processes reinforce, inhibit or terminate the Ca2+ release. It seems that the sequence starts with a physical interaction between some of the DHPRs and some of the Ca2+ release channels (Tanabe et al. 1990; Protasi et al. 2002), but it is unclear what role, if any, Ca2+ and other factors then play. One possibility is that the Ca2+ released through a channel further stimulates the same channel or activates other nearby channels, both situations referred to as ‘Ca2+-induced Ca2+ release’ (Endo, 1985), though this may only occur to a significant extent under physiological conditions if the DHPRs are simultaneously stimulating the release channels in what might be described as ‘voltage sensor-controlled Ca2+-induced Ca2+ release’ (Lamb & Stephenson, 1990, 1991; Lamb, 2000, 2002). The situation may be more complex in amphibian skeletal muscle than in adult mammalian skeletal muscle, as there are two distinctly different types of Ca2+ release channel in the former, whereas in the latter nearly all channels are of a single type (Ogawa et al. 1999). It has also been suggested that the release channels partially or fully ‘inactivate’ after opening, either caused by the rise in cytoplasmic [Ca2+] (Schneider & Simon, 1988; Jong et al. 1993; Tripathy & Meissner, 1996), or following in a deterministic manner from channel opening (Pizarro et al. 1997; Laver & Lamb, 1998; Szentesi et al. 2000).
An important factor that may affect the coupling is the amount of Ca2+ in the SR, which might directly stimulate the Ca2+ release channels by acting at a site within the SR lumen (Sitsapesan & Williams, 1997; Beard et al. 2002), or could influence Ca2+ activation and/or Ca2+ inactivation of the release channels at cytoplasmic sites by affecting the amount and rate of Ca2+ influx into the cytoplasm (Herrmann-Frank & Lehmann-Horn, 1996; Tripathy & Meissner, 1996). Nevertheless, there has been no study to date in mammalian muscle showing whether or in what way SR Ca2+ content affects the amount of Ca2+ released by AP stimulation. The SR in rat fast-twitch fibres is normally loaded at only ≈35 % of maximal capacity (Fryer & Stephenson, 1996). Chronic low-frequency stimulation in rat fast-twitch fibres can increase the total fibre Ca2+ content by twofold or more (with the majority of this Ca2+ presumably taken into the SR) (Gissel & Clausen, 1999), raising the question of what happens to Ca2+ release in such circumstances. It is also important to understand in what way Ca2+ release changes when the SR is progressively depleted of Ca2+ during a stimulation train, or when the amount of readily releasable Ca2+ in the SR declines owing to Ca2+ precipitation with inorganic phosphate, as may occur with intense muscular activity (Fryer et al. 1995; Allen & Westerblad, 2001).
Here, we used mechanically skinned fibres from rat fast-twitch muscle in which it is possible to readily vary the amount of Ca2+ in the SR above and below its normal endogenous level and yet still trigger Ca2+ release by AP stimulation (Posterino et al. 2000). By using TBQ to block Ca2+ binding and re-uptake by the SR Ca2+ pump, and adding set levels of a fast Ca2+ buffer (BAPTA), we were able to use the size of the twitch force response to estimate the amount of Ca2+ released by a single AP or a pair of closely spaced APs at various levels of SR Ca2+ content. We made the surprising finding that, despite the large change in driving force, the total amount of Ca2+ released by an AP stays virtually constant over a very wide range of SR Ca2+ content, from near-maximal capacity to somewhat below the normal endogenous content level. We also confirm the results of Hollingworth et al. (1996) that in mammalian muscle the amount of Ca2+ released by the second of a pair of closely spaced APs is much smaller than that released by the first, probably due to Ca2+ inactivation of Ca2+ release, and further show that this effect remains unchanged even when increasing SR Ca2+ content threefold. These findings are important as they show the overall behaviour of the normal Ca2+ release mechanism in mammalian muscle under various physiologically relevant conditions and give further insight into the processes influencing such Ca2+ release. Some of these results have been reported briefly (Posterino & Lamb, 2002).
METHODS
Skinned fibre preparation and force recording
With the approval of the Animal Ethics Committee of La Trobe University, male rats (Long Evans hooded; 4-6 months old) were killed by halothane overdose and cane toads were killed by double pithing. The extensor digitorum longus (EDL) muscle of the rat and the iliofibularis muscle of the toad were dissected free, blot-dried on filter paper and then pinned out at resting length in a Petri dish, covered in a layer of paraffin oil and kept on ice. As described previously (Lamb & Stephenson, 1994), single fibres were mechanically skinned, and a 2-3 mm long segment was connected to a force transducer (AME801, SensoNor, Norway; resonance frequency > 2 kHz) and then stretched to 120 % of the resting length (final sarcomere length ≈3.1-3.2 μm in rat fibres and ≈2.2-2.4 μm in toad fibres). They were then placed in a Perspex bath containing 2 ml of the standard potassium hexamethylene-diamine-tetraacetate (K-HDTA) solution (see below) with 50 μM total EGTA for 2 min, to equilibrate. Force responses were amplified with a Bioamp pod (ADInstruments, Sydney, Australia) attached to a 400 series Powerlab and simultaneously recorded on both chart recorder and computer using Chart software (version 3.14). All experiments were carried out at 23 ± 2 °C.
Solutions
All chemicals were obtained from Sigma (St Louis, MO, USA), unless specified otherwise. The standard K-HDTA solution contained (mM): 126 K+, 37 Na+, 50 HDTA2- (Fluka, Buchs, Switzerland), 8 total ATP, 8.6 total Mg2+, 10 creatine phosphate, 0.05 total EGTA, 90 Hepes and 1 N3−, pH 7.10 ± 0.01, and pCa (= -log10 [Ca2+]) 7.0; the free [Mg2+] was 1 mM. The solution with a free [Mg2+] of 0.05 mM was similar to the standard K-HDTA solution except that it contained 2.1 mM total [Mg2+]. Maximum Ca2+ activation of skinned fibres was ascertained using a solution similar to the K-HDTA solution but with all HDTA replaced with 50 mM Ca-EGTA (20 μM free [Ca2+]) and the total [Mg2+] reduced to 8.3 mM to maintain 1 mM free [Mg2+]. All solutions had an osmolality of 295 ± 10 mosmol kg−1. Free [Ca2+] (for pCa < 7.3) was determined with a Ca2+-sensitive electrode (Orion Research, Boston, MA, USA).
Where required, additional EGTA or BAPTA (up to 380 μM) was added from stock solutions similar to the standard HDTA solution but with all HDTA replaced with 50 mM EGTA or 40-50 mM BAPTA. Stock solutions made with BAPTA from different sources (free acid, Sigma; Na+ and K+ salts, Molecular Probes, OR, USA) were individually titrated with Ca2+ using the Ca2+ electode in order to establish the exact amount of Ca2+ buffer present in each, with the apparent purity of the BAPTA ranging from 80 to 97 %. The effects of the different BAPTA stocks on the twitch response were compared in the same fibre; when matched by the apparent amount of Ca2+ buffer present, all BAPTA stocks caused exactly the same reduction in twitch size and none had any effect on the duration of the AP refractory period (compared to that measured without BAPTA). TBQ was made as a 50, 10 or 1 mM stock in DMSO and was diluted 1000-fold in the final solution, with an equal amount of DMSO added to all matching control solutions. It was found that TBQ could be removed from the fibre by transferring the fibre back to paraffin oil (two 1 min periods separated by 30 s in K-HDTA solution) (see also Bakker et al. 1996).
In some experiments the relative amount of Ca2+ present in the SR was assayed by fully depleting the SR by exposing the fibre to a K-HDTA (‘full release’) solution with 30 mM caffeine and low free [Mg2+] (0.05 mM), and with 0.5 mM free EGTA present to chelate the released Ca2+ (in toad fibres the [Mg2+] was kept at 1 mM). This stimulus fully depletes the SR of Ca2+ (Fryer & Stephenson, 1996; Owen et al. 1997) and the area (i.e. time integral) of the resulting force response is indicative of the relative amount of Ca2+ released and hence of the amount of Ca2+ that had been present in the SR (see Bakker et al. 1996; Lamb et al. 2001). Where required, the SR was loaded with Ca2+ by exposing the fibre for a set period (usually 20 s, 1 min or 3 min) to the standard K-HDTA solution at pCa 6.7, buffered with 1 mM total EGTA. Under the conditions here, a 20 s load period resulted in the SR of the skinned EDL fibres reloading from empty to approximately the original endogenous Ca2+ content (≈35 % of maximal; Fryer & Stephenson, 1996), and a 3 min load period increased the Ca2+ content to near maximal (see Bakker et al. 1996; Lamb et al. 2001).
Electrical stimulation of skinned fibres
The skinned fibre segment (mounted on the transducer) was moved to a small Perspex chamber (≈400 μl) containing the standard K-HDTA solution (50 μM EGTA, pCa 7.0) and centred between two platinum wire electrodes, 4 mm apart, running parallel to the fibre axis. The fibre segment was stimulated with single (or pairs of) brief electrical field pulses (70 V cm−1, 2 ms), eliciting twitch responses (Posterino et al. 2000). Twitches were generated at a rate of one every 30 s until they reached a steady level (generally ≈2-3 min). Where appropriate, fibres were then transferred to a second electrode bath containing a matching solution with additional Ca2+ buffering and/or TBQ.
Statistical analysis
Data are presented as the mean ± S.E.M. and were statistically analysed using Student's paired or unpaired t test as appropriate, or (for data in the top panel of Table 3) a one-way ANOVA with Bonferroni's multiple comparison test. Values were considered significant if P < 0.05.
Table 3.
Effect of SR Ca2+ content on the amount of Ca2+ released with single or paired APs
| Single in TBQ only | Single in TBQ + 160 μm BAPTA | Single in TBQ + 200 μm BAPTA | Single in TBQ + 240 μm BAPTA | Single in TBQ + 280 μm BAPTA | Single in TBQ + 380 μm BAPTA | |
|---|---|---|---|---|---|---|
| Endogenous Ca2+ content | > 180 μm (n = 10) | 234 ± 13 μm (n = 14) | 226 ± 9 μm (n = 17) | − | 233 ± 11 μm (n = 6) | < 258 μm (n = 5) |
| Maximal Ca2+ content | − | − | 229 ± 16 μm (n = 6) | 252 ± 12 μm (n = l2) | 267 ± 11 μm (n = 13) | 309 ± 7 μm* (n = 8) |
| Single (all data) | Single | Pair | Difference | Difference (%) | |
|---|---|---|---|---|---|
| Endogenous Ca2+ content | 226 ± 11 μma (n = 13) | 239 ± 19 μmb (n = 6) | 299 ± 30 μmc | 60 ± 15 μmd | 24 ± 6%e |
| Maximal Ca2+ content | 242 ± 11 μma (n = 13) | 247 ± 9 μmb (n = 24) | 310 ± 12 μmc | 63 ± 6 μmd | 26 ± 2%e |
The upper part of the table shows the mean (± s.e.m.) amount of Ca2+ released from the SR by a single AP when the fibre had the endogenous or maximal Ca2+ content, calculated (see Methods) from the size of the force response to the first stimulus in the presence of 50 μm TBQ and the indicated amount of BAPTA (e.g. Fig. 6). Only a lower limit could be determined when there was no BAPTA with the TBQ (TBQ only) because the force response saturated in some fibres, and only an upper limit could be determined with 380 μM BAPTA at endogenous content because no force was elicited in many fibres.
Mean is significantly different from other estimates (one-way ANOVA, P < 0.05, see text). The lower part of the table shows (with [BAPTA] ≫ 280 μm) (1) the mean Ca2+ release in response to a single AP in all fibres examined with both the endogenous and maximal Ca2+ content (left column, n = 13) and (2) the mean Ca2+ release in response to a single AP or pair of APs (10 ms apart) measured in the same fibre at endogenous Ca2+ content (n = 6) or maximal content (n = 24). The right-most two columns show the difference in Ca2+ release between a single AP and a pair of APs in absolute and percentage terms.
Superscripts indicate mean values are not significantly different.
Calculation of Ca2+ release from force response
Estimation of cytoplasmic [Ca2+] at the peak of the force response
When Ca2+ re-uptake and binding by the SR pump was blocked with 50 μM TBQ (see below), the force response to AP stimulation typically rose to a peak with a time constant of < 50 ms and declined comparatively slowly (time constant ≈250-800 ms; e.g. Fig. 8 and Fig. 9). It was evident that the slow decline in force was reflecting a slow decline in cytoplasmic [Ca2+] (dictated primarily by the diffusion of Ca2+/Ca2+ buffer out of the skinned fibre) as other experiments showed that force declined much more rapidly if the cytoplasmic [Ca2+] was decreased quickly (force drops from the maximum Ca2+-activated level to zero with a time constant of < 70 ms if the intra-fibre [Ca2+] is rapidly lowered by transferring the fibre from a weakly Ca2+-buffered solution (100 μM EGTA, pCa 5) to a solution with 50 mM free [EGTA] (pCa > 10); Dutka & Lamb, 2002; and see Moisescu & Thieleczek, 1978). This meant that the peak of the force response should have approximately indicated the cytoplasmic free [Ca2+] prevailing in the fibre at that time; that is, ≈120 ms after the AP. (Responses elicited in TBQ without any BAPTA reached 90-100 % of maximum Ca2+-activated force and were slower to peak, but such responses were only used to give a minimum estimate of total Ca2+ release.) Hence the approximate [Ca2+] prevailing at the peak of the response could be derived from the known steady-state relationship between force and [Ca2+] in these fibres, which on average is described by a Hill curve with pCa50 of 5.94 and a Hill coefficient of 4.0 (Posterino & Lamb, 1996; Lamb & Posterino, 2003). That is, if [Ca2+] is expressed in molar units and F is the peak of the force response as a percentage of maximum Ca2+-activated force:
| (1) |
Figure 8. Twitch response to a single AP or a pair of APs when initially loaded to maximal SR Ca2+ content.
After the SR had been loaded to maximal capacity this skinned EDL fibre was stimulated by a single AP (first, second and fourth responses) or a pair of APs 10 ms apart (double stimulus; third response) in the presence of 50 μM TBQ and 200 μM BAPTA. As was the case in all 24 fibres examined in this way, the pair of APs elicited a substantially larger force response than a single AP, demonstrating that the force response under these conditions was indeed sensitive to the amount of Ca2+ released. The force response to the pair of APs was also less than the maximum Ca2+-activated force (Max) in this and all fibres examined. The response became smaller after ≈12 stimuli (not shown).
Figure 9. Force responses in a fibre stimulated by two APs at different intervals.

Force responses in a rat EDL skinned fibre loaded to maximal capacity and stimulated in the presence of TBQ and 280 μM BAPTA by a single AP (S) or a pair of APs 10 ms, 80 ms or 440 ms apart (labelled D10, D80 and D440). Force responses are expressed relative to the maximum Ca2+-activated force and are shown superimposed, aligned with the first (or only) AP positioned at 0 ms. The vertical ticks indicate the timing of the APs. The various stimuli were applied at least 15 s apart (in the order D440, S, D10, D80). The fibre was first stimulated with the pair of APs spaced 440 ms apart (dashed line); the force response to the first AP of this pair elicited a slightly smaller force response (≈1 % of maximum) than did a single AP applied subsequently (≈2 % of maximum force, thin line S), but the peak force reached after the second AP of the pair was substantially higher than that reached with a pair of APs 10 ms apart (D10). When a pair of APs spaced 80 ms apart was applied, the peak force reached was even higher (D80). The total amount of Ca2+ released by the single or paired stimuli (calculated from the peak of the response) was 203 μM (S), 288 μM (D10), 311 μM (D80) and 301 μM (D440), though the latter two estimates are considerable underestimates owing to the evident loss of Ca2+ from the fibre (and binding to Ca2+-Mg2+ sites on TnC - see Methods) occurring over the interval between the first and second AP. If two APs applied in rapid succession (e.g. 10 ms apart) had released twice the amount of Ca2+ released by a single AP (i.e. 406 μM) it would have produced a force response between ≈85 and 95 % of maximum. The force responses in the figure can be reasonably accounted for by a model in which (1) Ca2+ is lost from the fibre with an exponential time constant of ≈600 ms, and (2) the amount of Ca2+ released by the second AP in a pair is reduced to ≈38 % of that released by the first for very short intervals (< 10 ms) and recovers with a time constant of ≈120 ms. Thus, if Δt is the time interval (in ms) between the two APs, the released Ca2+ (CaT) present in the fibre at the peak of the response to the second AP is calculated as CaT = 203 μM (e-Δt/600 + 0.38 + 0.62(1 - e-Δt/120)), which gives values of 287, 316 and 298 μM for the D10, D80 and D440 cases, respectively.
Thus, when TBQ was present, it was possible to get a rough estimate of the total amount of Ca2+ released by a single AP (or pair of APs) from the peak size of the force response by taking into consideration the number and properties of the fixed and diffusible Ca2+-binding sites present, principally BAPTA, TnC, ATP and a HDTA contaminant. Parvalbumin and any other endogenous diffusible buffers would have been lost from the skinned fibres (Stephenson et al. 1999). The total Ca2+ released was calculated as the sum of all the bound Ca2+ (and the very small amount of free Ca2+), as set out below and shown in Fig. 1. Note that throughout this study, as in Fryer & Stephenson (1996) and Owen et al. (1997), all concentrations are expressed relative to total intact fibre volume; values can be expressed relative to cytoplasmic water volume (e.g. Baylor et al. 1983) by multiplying by ≈1.4.
Figure 1. Relationship between force and Ca2+ binding used in calculations.
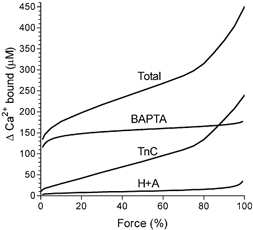
The figure shows the relationship between the peak size of the force response to AP stimulation of a rat EDL fibre in the presence of 50 μM TBQ and 200 μM BAPTA (resting pCa 7.8) plotted against the increase in Ca2+ binding to various sites, calculated as described in Methods. The force response is expressed as a percentage of the maximum Ca2+-activated force in the same fibre. H+A denotes the curve giving the sum of the free [Ca2+] and the Ca2+ binding to ATP and a HDTA contaminant. The curve labelled Total shows the sum of the values indicated on the three lower curves. The increase in binding to BAPTA for other concentrations of BAPTA can be derived by appropriate scaling of the curve shown, taking into account that ≈25 μM of the BAPTA already has Ca2+ bound (see Methods).
Ca2+ binding to BAPTA and EGTA
The apparent affinity constants for Ca2+ binding to EGTA and BAPTA at pH 7.10 are very similar (5 × 10⁶ M−1 and 5.5 × 10⁶ M−1, respectively; Fink et al. 1986; Harrison & Bers, 1987), but Ca2+ binds and unbinds to BAPTA very much more rapidly than to EGTA (kon and koff ≈2 × 10⁸ M−1 s−1 and ≈36 s−1, respectively, for BAPTA and ≈1.3 × 10⁶ M−1 s−1 and 0.26 s−1, respectively, for EGTA). Thus, the BAPTA will rapidly buffer the released Ca2+, and at the peak of the force response (≈120 ms after the AP) will be approximately in equilibrium with the prevailing cytoplasmic free [Ca2+]. In contrast, the EGTA should have bound comparatively little Ca2+ at that time (< 25 % of free [EGTA] if the time average of [Ca2+] is ≤ 1.5 μM (pCa 5.82), equating to < 7 and < 42 μM Ca2+ for a free [EGTA] of 25 and 175 μM, respectively). Based on the above apparent affinity constant for BAPTA (106.74 M−1) and the relationship between force (F) and [Ca2+] given in eqn (1), the percentage of the total BAPTA within the skinned fibre that has bound Ca2+ (% Ca-BAPTA) is given by:
| (2) |
The relationship between the concentration of BAPTA (or EGTA) in the bathing solution and that within the skinned fibre depends on the amount of swelling of the skinned fibre, the partitioning of the charged molecule into the myofibrillar space and the rest of the sarcoplasm, and the volume occupied by the SR, T-system, nuclei etc., as described by Fryer & Stephenson (1996). As set out in Owen et al. (1997), taking these factors into account, the mean [BAPTA] within a rat skinned EDL fibre, expressed relative to the intact fibre volume, is 1.06 times the [BAPTA] in the bathing solution (and 1.17 times for toad fibres). It was also necessary to take into account the fact that the standard solutions had a total of ≈25 μM contaminating Ca2+ present (determined with a Ca2+ electrode); in the standard solution this was mostly bound to EGTA (50 μM total), but in the solutions with added BAPTA (160-380 μM), the majority of the contaminating Ca2+ would have been bound to BAPTA. Consequently, this amount of Ca2+ (25 μM) was subtracted from the total amount calculated to be bound to BAPTA at the peak of the force response, so as to give the amount of additional Ca2+ bound to BAPTA following the AP stimulation. Figure 1 shows the relationship between the peak of the force response and the calculated increase in the amount of Ca2+ bound to BAPTA for a bath [BAPTA] of 200 μM (i.e. 212 μM BAPTA in the skinned fibre). It can be seen that when BAPTA is present at the levels used here (160-380 μM), it binds the majority of the released Ca2+, and the absolute amount bound to BAPTA changes relatively little with changes in peak force, owing to the relatively high affinity of the BAPTA.
Ca2+ binding to TnC
Ca2+ binds rapidly to sites on TnC, regulating force development (Robertson et al. 1981; Baylor et al. 1983; Fuchs, 1985; Hollingworth et al. 1996). The relationship between force and the total amount of Ca2+ bound to TnC in fast-twitch mammalian fibres used here (plotted in Fig. 1) was derived from the data of Fuchs (1985), which shows the relationships between free [Ca2+] and steady-state force, and between free [Ca2+] and total bound Ca2+ (Fig. 3 and Fig. 4, respectively, in Fuchs 1985). The total possible increase in Ca2+ binding to TnC was taken here as 240 μM (see Fryer & Stephenson, 1996); this value does not include ≈40 μM Ca2+ that, judged by extrapolation of the Ca2+-binding data in Fig. 4 of Fuchs (1985), is already bound at the lower limit of [Ca2+] examined in that study (pCa ≈7.4). Each TnC molecule has two Ca2+-specific sites and two Ca2+-Mg2+ sites (≈140 μM in total of each), and based on the data of Robertson et al. (1981) ≈20 % of the Ca2+-specific sites (i.e. ≈28 μM) should already have Ca2+ bound at pCa 7.4 (and ≈8 % or 11 μM at pCa 7.8). The steep increase in Ca2+ binding to TnC seen in Fig. 1 at forces > 75 % probably represents Ca2+ binding to the Ca2+-Mg2+ sites, which in the experiments of Fuchs (1985) probably occurred at relatively high [Ca2+] because of the presence of 5 mM free Mg2+. In the experiments here with 1 mM free Mg2+ (and pCa 7.4-7.8), these Ca2+-Mg2+ sites would initially have been largely occupied (72-86 %) by Mg2+ and < 21 % of such Mg2+-occupied sites should have bound Ca2+ (i.e. < 25 μM Ca2+) at the peak of the force response, owing to the relatively slow off rate of Mg2+ (2.0 s−1, Robertson et al. 1981). There was no adjustment in the calculations presented here to take into account this extra Ca2+ binding (to the Ca2+-Mg2+ sites) that would have occurred in the present experiments at 1 mM Mg2+. As indicated in Fig. 1, the total Ca2+ binding to TnC used in the calculations here rose in a graded manner from ≈15 to 120 μM for twitch forces in the range quantified (≈2-80 % of maximum Ca2+-activated force). Although there is doubt about the precise relationship between the peak of the transient force response and Ca2+ binding to TnC, this range is reasonable given the likely maximum total amount of Ca2+ binding (< 154 μM) to the Ca2+-specific (140 μM - 11 μM = 129 μM) and the Ca2+-Mg2+ sites (< 25 μM) at 100 % force.
Figure 3. Effect on twitch response of increasing SR Ca2+ content above endogenous level.

The twitch response in a skinned EDL fibre to a single AP was measured when the SR initially contained only its endogenous Ca2+ level (control twitch, first trace). When the SR Ca2+ content was subsequently increased to ≈80-100 % of its maximal level (by loading the fibre for 1 min in a solution at pCa 6.7 with 1 mM total EGTA), the same stimulus elicited a force response that rose more rapidly than the control twitch (superimposed as dashed line) and reached maximal Ca2+-activated force (Max) before declining at a relatively slow rate. After the SR had been depleted of all Ca2+ (in the 30 mM caffeine-low [Mg2+] full release solution, see Methods) and then reloaded to approximately its endogenous level (by 20 s loading in pCa 6.7 solution), the twitch response was restored to near its initial level. All responses were elicited in standard solution (50 μM total EGTA, pCa 7.0).
Figure 4. Effect on twitch response of blocking the SR Ca2+ pump with TBQ.
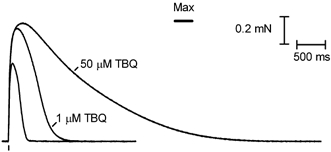
Superimposed twitch responses to a single AP stimulus when a fibre was bathed in the standard solution (50 μM total EGTA, pCa 7.0; smallest trace) or in the same solution with 1 μM TBQ (response shown is the sixth in TBQ, when the response had stabilised after 90 s exposure) or subsequently with 50 μM TBQ (applied for 30 s). The twitch response in 50 μM TBQ reached maximum Ca2+-activated force (Max) and took several seconds to decline.
Ca2+ binding to the SR Ca2+ pump
Ca2+ binding to the SR Ca2+ pump is likely to be of major importance to the normal twitch response, there being ≈100 μM sites in fast-twitch mammalian muscle (see Baylor et al. 1983). However, the Ca2+ pump was fully blocked by TBQ, which, like thapsigargin, shifts the Ca2+ pump into a state that does not bind Ca2+ (Inesi & Sagara, 1994), so Ca2+ binding to the pump was assumed to be negligible when TBQ was present.
Ca2+ binding to ATP and the HDTA contaminant
Ca2+ binds rapidly to ATP and for the conditions here (8 mM total ATP, 1 mM free Mg2+), the amount of Ca2+ bound to ATP should be ≈3.6 times the free [Ca2+] (Baylor & Hollingworth, 1998), which was assessed from the peak of the force response (eqn (1)). Furthermore, Ca2+ electrode measurements showed that the HDTA used here had a contaminating compound (probably a smaller diamine-tetra-acetic acid), present at ≈0.5 mM, which bound Ca2+ (but not Mg2+) with an apparent affinity constant of 104 M−1, so that the amount of Ca2+ bound to this compound was ≈5 times the free [Ca2+]. The amount of Ca2+ binding to creatine phosphate and HDTA was much smaller than that to ATP and was not taken into account. The relationship between force and the sum of the free [Ca2+] and the Ca2+ bound to ATP and the HDTA contaminant (the total being 9.6 times the free [Ca2+]) is shown in Fig. 1 (labelled H+A).
RESULTS
Twitch responses with different levels of cytoplasmic Ca2+ buffering
As the fibres were skinned under paraffin oil, they retained the endogenous amount of Ca2+ in the SR and they were initially maintained in such a state by using bathing solutions with little total Ca2+ and just sufficient EGTA (50 μM total) to weakly buffer the free [Ca2+] at close to the level normally present in the cytoplasm (pCa ≈7.0). In the case of rat EDL fibres, the endogenous amount of Ca2+ in the SR is only ≈35 % of the maximum SR content (Fryer & Stephenson, 1996). The twitch response in a freshly skinned EDL fibre retaining its endogenous SR Ca2+ content was examined by applying a single electrical field pulse and inducing an AP in the (sealed) T-system (see Methods, and Posterino et al. 2000), as shown in Fig. 2. The response showed ‘all-or-none’ behaviour and was completely blocked by tetrodotoxin in the T-system (see Posterino et al. 2000), indicating that it was indeed triggered by an AP. In the standard bathing solution (50 μM EGTA, pCa 7.0), the twitch response in rat EDL skinned fibres typically peaked within ≈60-100 ms at ≈50-70 % of maximum Ca2+-activated force and declined to baseline within a total of ≈250 ms (e.g. Fig. 2 and Fig. 3). (Application of a 50 Hz stimulus for ≈200-300 ms induced a force response reaching the maximum Ca2+-activated level measured in the same fibre; e.g. see Fig. 3 in Posterino et al. (2003).) When 80 or 160 μM of the fast Ca2+ buffer BAPTA was added to the solution, the peak of the force response to a single AP stimulus was greatly reduced, to ≈29 % and 12 % of maximum Ca2+-activated force, respectively (e.g. Fig. 2; see Table 1). This reduction was almost certainly due to the Ca2+-buffering properties of the BAPTA and not to failure or substantial reduction of the AP in the presence of BAPTA, because (1) BAPTA did not detectably inhibit the amount of Ca2+ released in response to an AP even when present at 380 μM (see later) and (2) the ‘all-or none’ and refractory behaviour of the AP was completely unaltered by BAPTA. As described in Posterino et al. (2003), if the fibre was stimulated by a second electrical stimulus within 4 ms of the first, there was no change in the force response, consistent with the second stimulus failing to induce another AP owing to the fibre being in the refractory state. If the delay to the second stimulus was progressively increased from 4 to 8 ms, the twitch force increased over approximately a 2 ms range to a substantially higher level (usually ≈20-25 % increase; see example for 10 ms in Fig. 2) and then remained virtually constant if the delay was increased further (e.g. over the range 8-12 ms; even if the duration was increased to 20 ms, the twitch force increased by < 10 % more). In any given fibre the stimulus separation at which the twitch response suddenly increased (e.g. 6 ms), which we consider to be a measure of the AP refractory period, remained unchanged (within 1 ms) over tens of minutes and was unaffected by the order in which the various stimulus pairs were tested. This value was also unaffected when BAPTA (100 μM) was repeatedly applied and washed out in each of the three EDL fibres examined (and also when 280 μM BAPTA was present with TBQ - see later).
Figure 2. Effect of Ca2+ buffering on the force response to single and paired APs.

A mechanically skinned fibre from a rat EDL muscle was stimulated by either a single transverse electrical field pulse (70 V cm−1, 2 ms) or a pair of such pulses 10 ms apart (double stimulus) in the presence of various concentrations of Ca2+ buffers, and the resulting twitch force recorded. The bathing solution in the control conditions was the standard K-HDTA solution containing 50 μM total EGTA (pCa 7.0) and the SR contained its endogenous level of Ca2+. Where indicated, the fibre was transferred to a solution with either 200 μM additional EGTA (pCa ≈7.8) or 160 μM additional BAPTA (pCa ≈7.7) for 15 s and subjected to a single or double stimulus once before being returned to the standard solution. The level of maximum Ca2+-activated force (measured in 50 mM Ca-EGTA, pCa 4.7; see Methods) is indicated as Max. The timing of the stimuli is indicated by small ticks under the force responses.
Table 1.
Effect of Ca2+ buffering on twitch size
| Control (%) | 100 μm EGTA (%) | 200 μm EGTA (%) | 80 μm BAPTA (%) | 160 μm BAPTA (%) | |
|---|---|---|---|---|---|
| Single | 70 ± 7 | — | 43 ± 6 | — | 12 ± 4 |
| Pair | 84 ± 4 | — | 62 ± 4 | — | 29 ± 8 |
| Single | 66 ± 10 | 48 ± 14 | — | 29 ± 11 | — |
| Pair | 83 ± 6 | 63 ± 10 | — | 46 ± 12 | — |
The twitch response to a single stimulus (one AP) or a double stimulus (pair of APs 10 ms apart) was examined in each skinned fibre in the standard conditions (50 μm EGTA, pCa 7.0; Control) and also in the presence of the indicated additional amount of EGTA or BAPTA, as shown in Fig. 1. The response in each fibre is expressed as a percentage of maximum Ca2+ -activated force. Values are the mean (±s.e.m.) relative response in four fibres. Every condition in the upper data set was examined in each of the same four fibres, and similarly every condition in the lower data set was examined in each of four fibres, with one fibre being common to the two data sets. The pCa in the solutions with the additional 80 μm BAPTA or 200 μm EGTA was ∼7.4 and 7.5, respectively, and that in the solutions with the additional 160 μm BAPTA or 200 μm EGTA was ∼7.7 and 7.8, respectively.
The reduction in peak force with BAPTA seen in Fig. 2 could have been due not only to the BAPTA binding a substantial amount of the Ca2+ released by the AP but also because of Ca2+ binding to additional fixed sites within the fibre (e.g. on the SR Ca2+ pump and Ca2+-specific sites on TnC, see Methods) that became available because the initial free [Ca2+] was considerably lower in the presence of the 80 and 160 μM BAPTA (pCa ≈7.4 and 7.7, respectively) than in the control case (pCa 7.0). To get further information about this, we also examined the effect of adding 100 or 200 μM of the much slower Ca2+ buffer EGTA, which lowered the resting free [Ca2+] to an extent comparable to the BAPTA (pCa ≈7.5 and 7.8, respectively), but should have had considerably less effect at directly buffering the transient rise in [Ca2+] following the AP (see Methods). As seen in Fig. 2 and Table 1, the presence of 200 μM EGTA (additional to the standard 50 μM) caused much less attenuation of the force response than did the presence of 160 μM BAPTA, and this was also the case with 100 μM EGTA compared to 80 μM BAPTA. Thus, a large part of the reduction in the twitch size occurring with added BAPTA was evidently due to the BAPTA rapidly chelating a proportion of the released Ca2+, as it would indeed be expected to do (see Methods). When the fibre was stimulated by a pair of APs 10 ms apart, the twitch force increased at all of the different concentrations of EGTA and BAPTA examined (Fig. 2 and Table 1), the increase on average being ≈15-20 % of maximum Ca2+-activated force in each case. As shown later, in agreement with the findings of Hollingworth et al. (1996), it appears that when a rat EDL fibre is stimulated by a pair of APs 10 ms apart, the second AP elicits much less Ca2+ release than the first AP (only ≈25 % as much). The fact that the extra Ca2+ released by the second AP caused a similar increase in the peak of the force response under each of the various conditions (with no TBQ and the SR pumps functional) is possibly largely fortuitous.
Effect of increased SR Ca2+ content on the twitch response
The Ca2+ content of the SR could be increased above the endogenous level by bathing the skinned fibre in a solution with elevated [Ca2+] (see Methods). As described previously (Lamb et al. 2001), the relative SR Ca2+ content could be assessed from the area (i.e. time integral) of the force response when fully depleting the SR of Ca2+ by exposure to a 30 mM caffeine-low [Mg2+] solution (see Methods and Fig. 5). As shown in Fig. 3, when the Ca2+ content of the SR of a rat EDL fibre was increased from the endogenous level to ≈80-100 % of maximum, the twitch response (to a single AP) rose faster and reached close to the maximum Ca2+-activated force, and took ≈1 s to decline to baseline. Similar results were found in each of the four fibres examined in this way (Table 2). Reducing the amount of Ca2+ in the SR to approximately the endogenous level restored the twitch response to close to its original form (Fig. 3). These results, however, do not mean that the AP released more Ca2+ when the SR Ca2+ content was raised, as shown in the following experiments.
Figure 5. Repeated stimulation in TBQ fully depletes the SR of Ca2+.
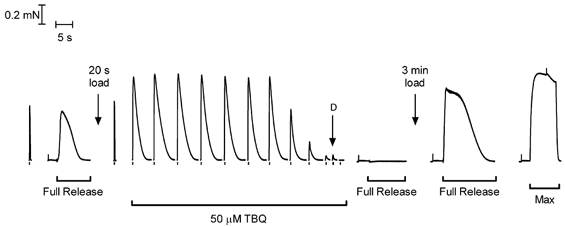
After ascertaining the twitch response in a rat EDL fibre under the standard conditions (50 μM EGTA, pCa 7.0, no TBQ; left-most response), a relative measure of SR Ca2+ content was obtained from the area of the force response when fully depleting the SR of Ca2+ by exposing the fibre to a caffeine-low [Mg2+] solution (full release solution, see Methods). The SR was then reloaded with Ca2+ to approximately the same level (by 20 s in a solution at pCa 6.7, 1 mM EGTA) and the twitch response (in standard conditions) was similar to the initial such response. The fibre was then equilibrated in a matching solution with 50 μM TBQ for 30 s and stimulated every ≈15 s (single stimuli; note breaks in time axis) until the twitch response declined to < 10 % of its initial level. Stimulating the fibre with a double pulse (‘D’, pulses 10 ms apart) elicited a response similar to that with a single stimulus, and exposing the fibre immediately afterwards to the full release solution did not evoke any force response, indicating the SR contained little if any releasable Ca2+. After removal of TBQ and reloading the SR for 3 min, exposure to the full release solution evoked a large, prolonged response, showing the SR had been loaded well above the endogenous level. Lastly, maximum Ca2+-activated force was determined by exposing the fibre to the 50 mM Ca-EGTA solution (pCa 4.7, Max).
Table 2.
Effect on twitch response of increasing SR Ca2+ content or blocking SR uptake with TBQ
| Peak size (%) | Rise time (ms) | Half-width (ms) | Decay constant (s−1) | |
|---|---|---|---|---|
| Control (n = 4) | 61 ± 13 | 26 ± 5 | 144 ± 20 | 27 ± 4 |
| Increased SR content | 92 ± 7 | 18 ± 3 | 558 ± 142 | 4 ± 1 |
| Control (n = 4) | 55 ± 12 | 28 ± 7 | 171 ± 31 | 24 ± 5 |
| 1 μm TBQ | 79 ± 10 | 18 ± 6 | 398 ± 88 | 10 ± 3 |
| Control (n = 10) | 44 ± 5 | 32 ± 4 | 158 ± 30 | 32 ± 5 |
| 50 μm TBQ | 88 ± 4 | 20 ± 4 | 1537 ± 203 | 1 ± 0.2 |
The values are the mean (±s.e.m.) of the indicated twitch parameter in response to single AP stimulation under the standard conditions (see Methods) before and after increasing the SR Ca2+ content to ∼80–100% of maximal or adding 1 or 50 μm TBQ, with n being the number of fibres. Peak size is the peak force of the twitch response expressed relative to maximum Ca2+ -activated force, rise time is the time taken for the force to rise from the 20% to the 80% level of the control twitch, half-width is the duration measured at 50% of peak, and decay constant is obtained from an exponential fit to the final 50% of the force response. Mean values shown are for the fifth AP in 1 μm TBQ, when the response had stabilised, and for the first AP in 50 μm TBQ. In every case, the mean value after treatment was significantly different from the corresponding control (paired t test, P < 0.05).
Effect of blocking the SR Ca2+ pump with TBQ
We have previously shown that 20 μM TBQ virtually fully blocks the SR Ca2+ pump in rat skinned EDL fibres without any detectable effects on the contractile apparatus or the Ca2+ release channels, with half-maximal block at ≈1-2 μM TBQ (Bakker et al. 1996). As shown in Fig. 4, blocking the Ca2+ pump with TBQ had effects similar to those observed with increased SR Ca2+ content (i.e. Fig. 3). When 1 μM TBQ was added to a fibre with an endogenous SR Ca2+ content, the twitch response to single AP stimulation became progressively bigger over the following five to six APs (at 15 s intervals) before stabilising. The mean effects on twitch response at this point are shown in Table 2. When 50 μM TBQ was added (with an initial 30 s equilibration period), the twitch response became even larger and more prolonged (e.g. Fig. 4), with the effect being close to maximal on the first stimulus (e.g. compare second and subsequent responses in 50 μM TBQ in Fig. 5); the mean data are presented in Table 2.
The very slow decay of the twitch response in the presence of 50 μM TBQ is to be expected if all Ca2+ re-uptake is indeed stopped and the decline in the [Ca2+] within the ‘cytoplasmic space’ of the skinned fibre depends entirely on the time taken for the Ca2+ to diffuse out of the fibre (see Discussion and Makabe et al. 1996). This should also mean that the Ca2+ released by each AP should be lost from the fibre and the SR should become progressively depleted with each successive stimulation. In accord with this, in the eight fibres that started with the endogenous Ca2+ load and were given repeated stimulation with single APs (at 15 s intervals) in the presence of 50 μM TBQ, the force response initially stayed the same for the first two to four responses but then decreased progressively, dropping to less than 10 % of maximum Ca2+-activated force after a mean of 8.6 ± 1.2 stimuli. (Figure 5 shows a related example for a fibre in which the SR was emptied and then reloaded to near or above the original endogenous content, and in this case the first seven responses all reached maximum Ca2+-activated force.) When the twitch force had dropped to less than 10 % of maximum Ca2+-activated force, applying a pair of APs 10 ms apart gave a response virtually no different from that to a single AP (mean response to a single AP, to a pair of APs and again to a single AP: 3.7 ± 0.9 %, 3.7 ± 0.9 % and 1.4 ± 0.4 % of maximum force, respectively, in 7 fibres; e.g. Fig. 5), possibly indicating that the SR was largely depleted of Ca2+. This was confirmed by exposing the fibre immediately afterwards to the 30 mM caffeine-low [Mg2+] ‘full release’ solution, which did not elicit any force response whatsoever (Fig. 5), indicating that the SR was indeed virtually fully depleted of Ca2+ (see Bakker et al. 1996; Lamb et al. 2001), particularly given that the SR Ca2+ pumps would still have been completely blocked by the TBQ and would not have acted as fast Ca2+-binding sites (see Methods; Inesi & Sagara, 1994). Similar results to those shown in Fig. 5 were seen in all three fibres examined in this way.
Twitch responses and Ca2+ release ascertained with TBQ and BAPTA present
In fibres with uptake blocked with 50 μM TBQ, a single AP stimulus elicited maximal or near-maximal force on the first few repetitions in every case (e.g. Fig. 5). It was clear that the AP must have triggered the release of a considerable amount of SR Ca2+, but because the force response was saturated in most cases (often remaining close to that level for several hundred milliseconds), it was only possible to give a minimum estimate of the amount of release (> 180 μM, see Table 3 and Methods). In order to obtain a better estimate of the amount of Ca2+ released by each AP, fibres were stimulated with various amounts (160-280 μM) of BAPTA present in a solution with 50 μM TBQ. In every case, the presence of BAPTA prevented the twitch force from saturating, with the mean peak force of the first twitch in fibres with an endogenous Ca2+ content being 59 ± 6 % (n = 14), 36 ± 4 % (n = 17) and 13 ± 5 % (n = 6) of maximum Ca2+-activated force in the presence of 160, 200 and 280 μM BAPTA, respectively. An example with 200 μM BAPTA is shown in the left part of Fig. 6. Under these circumstances, with the SR Ca2+ pump blocked and unable to bind Ca2+, it is possible to get an estimate of the amount of Ca2+ released by each AP from the size of the force response and the amount of BAPTA present, as described in Methods. Such analysis of fibres with endogenous SR loading yielded a similar value (≈230 μM) for the amount of Ca2+ released by the first AP in the TBQ-BAPTA solution, irrespective of the exact amount of BAPTA used or the particular peak force reached (see top row in Table 3). In five additional fibres with an even higher amount of BAPTA (380 μM) present with the TBQ, single AP stimulation elicited no response at all in three cases and a barely detectable response (≈1 % of maximum Ca2+-activated force) in the other two cases; for this situation it can only be said that the mean amount of Ca2+ released by an AP was < 258 μM.
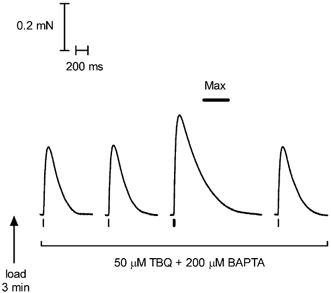
Figure 6. Repeated twitch responses in TBQ-BAPTA when starting with endogenous or maximal SR Ca2+ content.

A twitch response was elicited under standard conditions (left-most trace) in a skinned EDL fibre initially containing only the endogenous SR Ca2+ content, and then the fibre was equilibrated for 30 s in a matching solution with 200 μM BAPTA and 50 μM TBQ and stimulated by single pulses every 15 s, eliciting progressively smaller responses, with the fourth being barely detectable. No response was elicited when exposing the fibre to a solution with low free [Mg2+] (0.05 mM, 50 μM EGTA, pCa 7.0; BAPTA removed beforehand by 10 s wash in standard solution), indicating the SR was relatively depleted of Ca2+. Following removal of TBQ and loading of the SR to maximal capacity (3 min in pCa 6.7 solution), many similar twitch responses could be elicited in the presence of the TBQ-BAPTA solution before the response size decreased. Note that despite loading the SR to maximal capacity, the twitch responses in TBQ-BAPTA (i.e. first 12) were similar in size to the first twitch response in TBQ-BAPTA with endogenous SR Ca2+ content. Finally, when the SR was reloaded with Ca2+ (to approximately the endogenous level; 20 s load in pCa 6.7 solution) the twitch response under standard conditions was restored to close to its initial level, showing that coupling was still functional and the SR contained Ca2+, and then lowering the [Mg2+] did elicit a large force response. Max indicates maximum Ca2+-activated force.
In fibres that started with only their endogenous Ca2+ content, repeated AP stimulation in TBQ with BAPTA (160 or 200 μM) produced similar size force responses on up to the first three stimuli (e.g. left of Fig. 7), and then the peak response dropped sharply over several subsequent stimuli until no response could be detected. For the cases with 160 and 200 μM BAPTA present, the peak of the twitch response decreased to < 10 % of the initial level after a total of 6 ± 1 (n = 14) and 4 ± 1 (n = 6) responses, respectively. This is entirely consistent with the data obtained with TBQ and no BAPTA, with the decrease in the total number of responses here simply reflecting the amount of Ca2+ that must be released to reach a free [Ca2+] sufficient to generate some force in the presence of the particular concentration of BAPTA. As can be seen from Fig. 1, the minimum detectable Ca2+ release with 160 and 200 μM BAPTA is ≈100 and 135 μM, respectively. If these values are applied to Fig. 10B, which shows the amount of release per AP for the final six responses measured with TBQ and no BAPTA (≈9 responses in total - see earlier), it is apparent that the final three responses would not be detected with 160 μM BAPTA (i.e. only ≈6 would be measured) and the final five responses would not be detected with 200 μM BAPTA (i.e. only ≈4 would be measured), as found. In the fibre shown in Fig. 6, the SR was quite depleted of Ca2+ after the fourth stimulus (total content remaining after this stimulus estimated as ≈360 μM Ca2+ - see Fig. 10B); at this level of SR loading, lowering the free [Mg2+] to 0.05 mM was unable to cause further release. This is consistent with our previous findings that in rat EDL fibres the free [Mg2+] has to be lowered even further (to 0.015 mM) to fully empty the SR (Lamb & Stephenson, 1994; Lamb et al. 2001) or caffeine also added (as in Fig. 5).
Figure 7. Summary of twitch responses in TBQ-BAPTA for endogenous and maximal Ca2+ content.
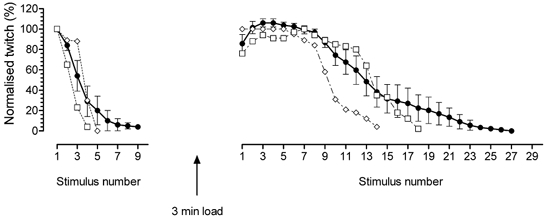
The relative twitch responses in 50 μM TBQ-200 μM BAPTA for the fibre in Fig. 6 are shown (□), together with those of another fibre (⋄) that was also examined with both the endogenous (left panel) and maximal SR Ca2+ content (right panel). Responses in each fibre were normalised to the first response in TBQ-BAPTA with the endogenous Ca2+ content. Also shown is the mean (± S.E.M.) response (•) in all six fibres that initially had the endogenous Ca2+ content and were stimulated repetitively by a single AP in 50 μM TBQ-200 μM BAPTA until fully depleted, and all seven fibres that were loaded to maximal Ca2+ content and similarly stimulated until fully depleted. In the latter, the matching response with endogenous Ca2+ content was not obtained in every case, and so the responses in each fibre were expressed relative to the peak response and then the overall mean response across fibres was re-scaled so that the peak was of the same relative size as that found in the 13 fibres where both the first response with endogenous SR content and the peak response with maximal content were measured (see Table 2). All stimuli were single pulses. When starting with the SR loaded to maximum capacity, ≈8-16 similar responses could be elicited in each fibre before the response substantially decreased. Note that one effect of averaging across fibres is that the mean response declines less steeply on successive stimuli than was the case in individual fibres.
Figure 10. Amount of Ca2+ released by an AP over the full range of SR Ca2+ content.

A, EDL fibres that were fully depleted of SR Ca2+ by repeated single AP stimuli in the presence of TBQ only (no BAPTA; e.g. Fig. 5) were used to examine the amount of Ca2+ released by an AP at low Ca2+ content. In each fibre the stimulus where the force response first failed to reach 10 % of maximum Ca2+-activated force was determined (defined as ‘1′), and used to align responses in the different fibres (n = 8). The mean (± S.E.M.) across the fibres for this response and for each of the preceding five responses (numbered 2-6) is shown. B, amount of Ca2+ released by the AP on each of the last six repetitions, calculated from the mean force responses in A (see Methods), and plotted against the cumulative total of released Ca2+ plus 20 μM (the latter added to take into account Ca2+ released by stimuli producing less than 10 % of maximum force). This abscissa scale can also be taken as the SR Ca2+ content at the time of each response. C, amount of Ca2+ released by each AP versus SR Ca2+ content for the fibre shown in Fig. 6. The SR content is calculated as the sum of the Ca2+ released by all subsequent stimuli plus the amount indicated in B as present in the SR (≈500 μM) when the release per AP had fallen to the minimum detectable level (≈135 μM) with 200 μM BAPTA present (see Fig. 1). ○, starting with maximal SR content; □, starting with endogenous SR content; *data from B.
Ca2+ release at maximal SR Ca2+ content
We also examined how much Ca2+ was released by an AP when the SR of rat EDL fibres was loaded to its maximal content. Figure 6 shows a fibre that was depleted of SR Ca2+ by repeated single AP stimulation, firstly when it started with only its endogenous SR Ca2+ content, and then again after reloading the SR to its maximal capacity (3 min load at pCa 6.7). The most striking features of the response sequence in the latter case are that (1) many more twitch responses (in TBQ-BAPTA) could be elicited, and (2) the first 12 responses were all quite similar to each other and were approximately the same size as the first twitch response in TBQ-BAPTA when the fibre started with the endogenous Ca2+ content (see Discussion concerning the smaller first response when maximally loaded). Very similar behaviour was observed in the two other fibres that were repeatedly stimulated until empty after starting at both endogenous and maximal SR Ca2+ content (one in 200 μM BAPTA, which is shown in Fig. 7 with the above fibre, and one in 160 μM BAPTA). In a much larger sample of fibres, results were obtained for the full sequence until depletion starting with only one or other Ca2+ content (not both), or only the first few responses were obtained in a given fibre for both SR content conditions. For cases where the [BAPTA] was in the range 160-280 μM, it was consistently observed that when starting with maximal SR content, the biggest twitch response in TBQ-BAPTA (usually the second or third in the sequence; see mean data in Fig. 7) was very similar to the first such response when starting with endogenous SR content; in 11 of the 13 fibres examined in that way, the peak of the twitch force with maximal content was not significantly different from that for the first response with endogenous content (difference 2 ± 2 % of maximum Ca2+-activated force). Only two fibres showed a large increase in twitch response (in TBQ-BAPTA) when increasing from endogenous to maximal SR Ca2+ content (response increasing from 3 % to 43 %, and from 17 % to 41 %, of maximum Ca2+-activated force, in fibres with 200 and 280 μM BAPTA, respectively; the former, which indicates a 58 % increase in Ca2+ release, possibly simply reflects the fact that the endogenous SR content was unusually low in that fibre; the latter indicates only a 20 % increase in Ca2+ release). As might be expected from the similarity in peak size of the force responses, the mean estimate of the amount of Ca2+ released by an AP was not significantly different when fibres were endogenously loaded or maximally loaded (226 ± 11 and 242 ± 11 μM, respectively, for paired measurements in the same fibre, n = 13; P > 0.05, paired t test; Table 3) for these conditions where the [BAPTA] was ≤ 280 μM.
However, when BAPTA was present at a higher concentration (380 μM) in maximally loaded fibres, the amount of Ca2+ released by a single AP was significantly increased (to 309 ± 7 μM; Table 3). A one-way ANOVA of all the data on the amount of Ca2+ released per AP for conditions where exact values could be obtained (i.e. top two rows of Table 3 excluding the cases with no BAPTA or 380 μM BAPTA at endogenous Ca2+ content), indicated a significant difference only for the case with maximal Ca2+ content and 380 μM BAPTA. (Similar analysis of the data separated into the two content groups also gave the same result.) This effect of raising the [BAPTA] was also apparent in individual fibres. In the four fibres examined with maximal Ca2+ content at both 240 and 380 μM BAPTA, the amount of Ca2+ released by an AP increased from 264 ± 14 to 315 ± 13 μM (difference: 52 ± 15 μM, P < 0.05, paired t test). Likewise, in the two fibres that were examined with 380 μM BAPTA present, first with the endogenous content and then with maximal content, the estimate of Ca2+ released by an AP increased from < 258 to 282 μM in one case and from 258 to 311 μM in the other. These data indicate that the amount of Ca2+ released by an AP can be increased by raising the amount of BAPTA present in the cytoplasm above a certain level, at least in the case where the SR Ca2+ content is maximal.
In other experiments it was verified that (1) the amount of Ca2+ loaded into the SR by the 3 min loading at pCa 6.7 was not increased by additional loading at pCa 6.4 (30-60 s; 4 fibres), and (2) that the amount of Ca2+ released by an AP was not increased by such a loading regime (226 ± 13 and 244 ± 7 μM Ca2+ released for endogenous and extra loading cases in four EDL fibres with 200 μM BAPTA; P > 0.05, paired t test). It was also verified that the presence of TBQ and BAPTA (240 or 280 μM) did not alter the refractory behaviour of the AP, and that a 50 Hz stimulus (< 300 ms in duration) in the presence of TBQ-BAPTA typically elicited a force response reaching the maximum Ca2+-activated level in the same fibre (4 EDL fibres). In addition it was found that the mean number of twitch responses that could be elicited in TBQ-BAPTA before the response dropped to < 10 % of the initial level was on average greatly increased in fibres loaded to maximal content: 15 ± 2 in 7 fibres with 200 μM BAPTA and 20 ± 2 in 2 fibres with 160 μM BAPTA (versus 4 ± 1 and 6 ± 1, respectively, with endogenous Ca2+ load - see earlier).
Ca2+ released by the second AP in a pair
The twitch response in TBQ-BAPTA to a pair of APs 10 ms apart was also measured and compared to the response to a single AP, as shown in Fig. 8. In every case, both with endogenous and maximal SR Ca2+ content, the response to the pair of APs was greater than to a single AP under the same conditions in the same EDL fibre, and none of the responses reached maximum Ca2+-activated force. Calculations from force responses obtained with [BAPTA] ≤ 280 μM indicated that the pair of APs only released ≈60 μM (or ≈24 %) more Ca2+ than did a single AP in fibres with the endogenous SR Ca2+ content, and ≈63 μM (or ≈26 %) more Ca2+ in fibres with maximal SR Ca2+ content (Table 3); these values are not significantly different (P > 0.05, two-tailed, unpaired t test). This was also confirmed in three cases in which all measurements were made in the same fibres, where it was found that the amount of Ca2+ released by the second AP was 30 ± 7 % and 29 ± 2 % of that released by the first AP at endogenous and maximal content respectively. In the one fibre examined with maximal SR Ca2+ content and 380 μM BAPTA present, the Ca2+ release in response to a pair of APs was 34 % higher than for a single AP under the same conditions (423 versus 316 μM Ca2+); this indicates that the second AP of the pair released a comparatively large amount of Ca2+ (107 μM), possibly because BAPTA was present at a relatively high concentration.
We also examined the effect of increasing the interval between the two APs, as shown in Fig. 9. These data were consistent with the second AP in a pair eliciting considerably less Ca2+ release than the first, and with recovery from this depression occurring with an exponential time constant of ≈120 ms. When the two APs in a pair are spaced a relatively long time apart (e.g. > 50 ms), there is considerable uncertainty about how much Ca2+ is lost from the fibre between the two stimuli, which could confound the calculation about the extent of recovery of Ca2+ release elicited by the second AP. To reduce this problem, we compared in each of six EDL fibres how much Ca2+ was released by a pair of APs 10 ms apart and a pair 20 ms apart (all with 240 μM BAPTA). The mean estimates of Ca2+ release for these two types of stimuli were 131 ± 4 % and 139 ± 5 %, respectively, of the Ca2+ released by a single AP in the same fibre; that is, the average amount of Ca2+ released by the second AP in a pair increased from ≈31 % to 39 % of that released by the first AP when the interval between the APs was increased from 10 ms to 20 ms. An exponential fit applied to the two values obtained in each individual fibre indicated that the Ca2+ released by the second AP was reduced to a mean of 20 ± 4 % of the single AP release (n = 6) and recovered with a time constant of 37-68 ms in four of the fibres and 170 ms in the fifth fibre, with no apparent recovery occurring in the sixth fibre (i.e. the two stimulus pairs induced similar size force responses).
Ca2+ release at low SR Ca2+ content
We also examined the data to consider how much Ca2+ was released by an AP when the SR Ca2+ content was low. For this analysis we considered the final responses in fibres stimulated to depletion in the presence of TBQ with no BAPTA (as in Fig. 5), because under such conditions the force response should have been highly sensitive to any Ca2+ release. Figure 10A presents the mean force data from the eight fibres that were fully depleted by single AP stimuli in TBQ; the responses in the different fibres were aligned to the stimulus where the response first dropped below 10 % of maximum Ca2+-activated force. Figure 10B shows the calculated amount of Ca2+ released by each of these APs plotted against the total amount of Ca2+ in the SR at the time of release. The latter was simply calculated as the total Ca2+ released by all of the stimuli, summing in reverse order to the stimulation sequence, starting from a total of 20 μM Ca2+, which was chosen to take into account the small amount of Ca2+ in the SR that was responsible for the very small responses (<< 10 % of maximum force) that could be elicited in some cases. The data in Fig. 10B suggest that when the SR is quite depleted (Ca2+ content < 200 μM), the amount of Ca2+ released by an AP declines in an approximately linear manner with the total amount of Ca2+ present in the SR. When the total SR Ca2+ content is at the endogenous level or higher (i.e. ≈1 mM or greater), the amount of Ca2+ released per AP reaches a plateau level of ≈230 μM, as shown in Fig. 10C, which is derived from the data in Fig. 6 for a fibre stimulated in TBQ-BAPTA starting at both the endogenous and maximal SR load levels.
AP-induced Ca2+ release in toad fibres
Finally, we briefly examined the effect of SR loading in skinned fibres from the iliofibularis muscle of the cane toad. In these experiments we used only 10 μM TBQ because this is enough to largely or fully block the SR pump (Bakker et al. 1996) and at much higher concentration (50 μM) application of TBQ led to self-reinforcing Ca2+ release. It was found that a detectable force response could only be elicited in TBQ-BAPTA when the [BAPTA] was substantially lower than that used in the experiments with rat EDL fibres (and this was not accounted for by differences in the amount of BAPTA per unit fibre volume in the two types of muscle fibre - see Methods). In the five toad fibres reported here, which initially contained only the endogenous SR Ca2+, single AP stimulation in the standard solution (50 μM total EGTA, pCa 7.0) without TBQ or BAPTA present, elicited twitch responses peaking at 52 ± 10 % of maximum Ca2+-activated force. These fibres were then stimulated by a single AP in the presence of TBQ and 120 μM BAPTA, with the resulting mean force response being 21 ± 11 % of maximum Ca2+-activated force, which indicated a mean release of 148 ± 10 μM Ca2+. When the same fibres were loaded to maximal or near-maximal SR content (by 3 min loading at pCa 6.7), the response in TBQ-BAPTA was 28 ± 5 % of maximum force; this indicated release of 162 ± 10 μM Ca2+, which was not significantly different from that with the endogenous Ca2+ content (10 ± 7 % increase in Ca2+ release, n = 5, P > 0.05, paired t test). In three of these fibres, the extent of SR loading achieved with the loading protocol was subsequently verified using caffeine-induced Ca2+ release (see Methods). Thus, the amount of Ca2+ release per AP was lower in the toad fibres than in the rat EDL fibres, but showed similar constancy when the SR content was increased from the endogenous level to near maximum (approximately a threefold increase in content).
DISCUSSION
This study used mechanically skinned skeletal muscle fibres with functional E-C coupling, where it was possible to rapidly vary the amount of Ca2+ in the SR and examine its effect on the amount of Ca2+ released by an AP. The principal finding was that in both rat fast-twitch fibres and toad twitch fibres, the amount of Ca2+ released by an AP stays virtually constant over a wide range of SR Ca2+ content, which gives important insight into the physiological processes involved in Ca2+ release in skeletal muscle.
Ca2+ movements and force responses
When a skinned EDL fibre was bathed in the standard solution (pCa 7.0, 50 μM total EGTA) an AP induced a brief twitch response lasting ≈200 ms (Fig. 1, Table 2). It was evident that the peak size and duration of the twitch response was markedly influenced by Ca2+ binding to, and translocation by, the SR Ca2+ pump, because blocking such Ca2+ binding and pump function with TBQ (Inesi & Sagara, 1994) increased the rate of rise and peak level of the force response and greatly slowed the subsequent decline of force (Fig. 4, Table 2). The very slow decline in force when the pump was blocked with 50 μM TBQ (exponential decay time constant ≈1 s−1) appears to be well explained if the change in cytoplasmic [Ca2+] were dictated predominantly by the diffusion of Ca2+ bound to buffer (e.g. Ca-EGTA) out of, and Ca2+-free buffer (EGTA) into, the skinned fibre (diameter ≈40-50 μm; see Moisescu & Thieleczek, 1978). It also demonstrates that the net diffusional loss of Ca2+ from the fibre is comparatively slow. Consequently, the skinned fibre can effectively be viewed as a closed system during the relatively brief period between release of Ca2+ in response to an AP and the development of peak force (typically < 120 ms, except when force approached the maximum Ca2+-activated level). Thus, the peak of the force response could be used to obtain a rough estimate of the total amount of Ca2+ that must have bound to various types of site within the fibre, in particular TnC, BAPTA (when present), ATP and a HDTA contaminant (see Methods).
Amount of Ca2+ released by a single AP at endogenous and maximal SR Ca2+ content
When the SR was loaded to near-maximum capacity with Ca2+, the twitch response was greatly increased and prolonged (Fig. 3). It appears that this was not the result of an increase in the amount of Ca2+ released by an AP (see below), and that the effects instead were entirely due to a reduction in the amount of Ca2+ binding to, and being translocated by, the SR Ca2+ pump. When the SR Ca2+ content is near maximal, most of the Ca2+ pumps at any given instant will have SR luminal Ca2+ already bound and hence they cannot act as fast Ca2+-binding sites nor contribute to net uptake of Ca2+ by the SR. As a result, the twitch response in a fibre with maximal SR content could be expected to look much the same as the response in a fibre with endogenous SR Ca2+ content when the pump was blocked, as was indeed observed (compare Fig. 3 and Fig. 4, and see Table 2).
When a single AP stimulus was applied to a fibre with TBQ and BAPTA present, the force response was not saturated and was entirely responsive to increased amounts of Ca2+ release (see Fig. 8 and Fig. 9). Most importantly, the first such response when the SR was loaded at the endogenous level (≈35 % of maximum capacity) was virtually the same as on each of the first 12 or so responses in the same fibre when the SR started with maximal Ca2+ content (Fig. 6 and Fig. 7 and Table 3). Thus it is clear, without making any calculations, that the amount of Ca2+ released by the AP was virtually identical in these cases. In 12 out of 19 fibres examined, the first response to AP stimulation in TBQ-BAPTA at the maximal SR Ca2+ content was ≈20 % smaller than the following responses (see Fig. 6 and Fig. 7). This force difference (< 10 % of maximum Ca2+-activated force) corresponds to a difference of < 18 μM, or < 8 %, in the estimated amount of total Ca2+ release (see Fig. 1). One possible reason for this effect is that the TBQ may not have fully inhibited Ca2+ binding to all the SR Ca2+ pumps at the time of the first stimulus because TBQ only binds to the pump when it is in the Ca2+-free state (Inesi & Sagara, 1994) and so the high [Ca2+] in the SR lumen would have slowed the ability of TBQ to draw off all the pumps into the non-functional, TBQ-bound state. Irrespective of this, it is apparent from the constancy in the force responses in Fig. 6 and Fig. 7 that the Ca2+ release per AP stayed virtually constant as the SR Ca2+ content decreased from the maximal to the endogenous level, and even to below that level, the latter being shown by the similar size force responses seen on the first two or three stimulations in TBQ when starting with the endogenous content (e.g. left side of Fig. 7).
Calculated amount of Ca2+ release per AP
The estimate of the amount of Ca2+ release by a single AP was ≈230 μM in rat EDL fibres and ≈150 μM in toad iliofibularis fibres at the endogenous level of SR Ca2+ content, and ≈240 and ≈160 μM, respectively, at maximal or near-maximal SR Ca2+ content (for measurements obtained with [BAPTA] ≤ 280 μM). There are a number of uncertainties involved in deriving these estimates, primarily relating to the amount of Ca2+ binding to TnC (see Methods). We believe, however, that the values give a reasonable indication of the minimum amount of Ca2+ release because they depend primarily on the estimate of the amount of Ca2+ rapidly binding to BAPTA (and to ATP and HDTA; see Fig. 1), which is more firmly based, and because there must have been some appreciable amount of Ca2+ binding to the Ca2+-specific sites on TnC to elicit the force responses observed. The estimate for rat fast-twitch muscle found here is broadly similar to that found by Hollingworth et al. (1996) in intact fast-twitch fibres of the mouse (at 28 °C) using Ca2+ indicators, which we judge from their Fig. 6 to be ≈190 μM in the units used here (estimated from the approximately ‘triangular’ Ca2+ release waveform with a peak rate of 330 μmol (l cytoplasmic water)−1 ms−1 and a base of ≈1.6 ms). Similarly, the estimate of AP-induced Ca2+ release found here in toad muscle fibres is relatively close to that estimated by Baylor et al. (1983) in intact fibres of frog muscle at 17 °C (≈140-210 μM in the units here).
It is also important to note that there was good accordance here between the amount of Ca2+ thought to be present in the SR and the estimated total amount of Ca2+ released when fully depleting the SR by a series of APs. It was found when a fibre started with its endogenous amount of SR Ca2+, and TBQ was present to block the SR pump (no BAPTA present), that on average it took a total of ≈8.6 APs to fully deplete the SR. The total amount of Ca2+ released by the last six APs was estimated to be ≈580 μM (see Fig. 10B) and so if ≈230-200 μM was released on the first two to three responses (see text and Fig. 7 and Fig. 10C), this means that the total amount of Ca2+ released was ≈1050-1250 μM, which is very similar to the estimate of the endogenous SR Ca2+ content (≈1100-1300 μM) found in the same type of fibres with a different method (Fryer & Stephenson, 1996; Owen et al. 1997). Similarly, in the experiments where BAPTA was present with the TBQ, and hence where force responses could only be evoked when the amount of Ca2+ released was sufficient to bind most of the BAPTA (e.g. ≈135 μM Ca2+ released at 200 μM BAPTA; see Fig. 1), it was found that the responses were initially constant and then declined to near or below the force threshold after ≈4 stimuli and ≈15 stimuli when starting with endogenous and maximal SR Ca2+ contents, respectively. Taking into account the Ca2+ still present in the SR when the force response declined to zero (≈500 μM, when Ca2+ release was ≈135 μM with 200 μM BAPTA present; Fig. 10B), this gives values of ≈1400 and ≈3900 μM, respectively, the former being close to the normal endogenous content (see above) and the latter being comparable with the estimate of maximal SR Ca2+ content (≈3100 μM, Fryer & Stephenson, 1996). Thus, in all the situations examined in this study there is good quantitative consistency between the calculated total amount of Ca2+ released from the SR and published estimates of the amount of Ca2+ in the SR available for release.
Reduced Ca2+ release to the second AP in a pair
It was also apparent from the experiments in rat EDL fibres here that when a second AP was applied 10 ms after the first, the amount of Ca2+ released was much smaller than in response to the first AP (≈25 % or ≈60 μM Ca2+; Table 3). This estimate (obtained at ≈23 °C) is quite similar to those calculated by Hollingworth et al. (1996) from fluorescence measurements of Ca2+ transients in mouse intact fast-twitch fibres (≈26 % and 37 % at 16 °C and 28 °C, respectively, for APs 10 ms apart). It was further found here that when the SR Ca2+ content was increased to maximal, the relative and absolute amounts of Ca2+ released by the second AP in a pair (≈26 % and 63 μM) were not significantly different from that released in fibres with endogenous SR Ca2+ content (Table 3; with [BAPTA] ≤ 280 μM). By varying the inter-pulse interval between the APs from 10 to 20 ms, it was estimated that the amount of Ca2+ released by the second AP was reduced to ≈20 % of that released by the first AP at brief intervals and recovered with a time constant of ≈40-70 ms in the majority of fibres examined (with recovery seemingly being much slower in some fibres). The data sets obtained were very limited and the values calculated here should be viewed as only rough estimates. Nevertheless, they are in reasonable accord with the extent of ‘inactivation’ of AP-induced Ca2+ release (reduction to ≈35 %) and time constant of recovery (≈36 ms) reported recently for intact fibres from mouse skeletal muscle (Caputo & Bolanos, 2002). The cause of the reduction in Ca2+ release to the second AP in the fibres observed here was not established. However, given that (1) a similar phenomenon occurring in frog fibres (Baylor et al. 1983) is evidently due to Ca2+ inactivation of Ca2+ release (Schneider & Simon, 1988; Pape et al. 1993, 1995, 1998), and (2) the amount of Ca2+ released per AP could be increased by raising the [BAPTA] in the cytoplasm (Table 3), it seems likely that the reduction in Ca2+ release on the second AP was caused at least in large part by Ca2+ inactivation of Ca2+ release.
Mechanisms involved in maintaining constant Ca2+ release
It was found here that an AP triggers only a limited amount of Ca2+ release, with the release terminating even though there may be a very large amount of Ca2+ remaining in the SR (e.g. Fig. 10C). Thus, it is clear that under the conditions here the released Ca2+ did not cause any appreciable level of sustained Ca2+-induced Ca2+ release even though the cytoplasmic [Ca2+] remained elevated for a second or more in some circumstances (Fig. 5). This is consistent with such ‘uncontrolled’ calcium-induced calcium release being greatly depressed in skeletal muscle under physiological conditions, principally due to the presence of Mg2+ in the cytoplasm (Endo, 1985; Meissner et al. 1986; Lamb & Stephenson, 1991, 1994). It is also in accord with our recent finding that even when the sensitivity of the rat EDL fibres to calcium-induced calcium release is up-modulated by oxidising the calcium release channels, the amount of Ca2+ released by an AP remains unchanged (Posterino et al. 2003). It appears that all the Ca2+ release channels are fully activated by the AP stimulus (see Mejia-Alvarez et al. 1999; Posterino et al. 2003) and that the Ca2+ release terminates when an approximately constant amount of Ca2+ has been released. This constancy persists even when the SR is loaded to maximum capacity with Ca2+ and the gradient for Ca2+ efflux is greatly increased (Fig. 10C).
One explanation for the constancy in the amount of Ca2+ release is that it is caused by the flux through the release channel saturating at relatively low SR Ca2+ content levels. However, this seems unlikely because, based on the single-channel measurements of Mejia-Alvarez et al. (1999), such saturation apparently does not occur until the free [Ca2+] in the SR lumen is much higher (> 5 mM) than that present at the endogenous content level (probably ≤ 1 mM free Ca2+; Donoso et al. 1995; Kurebayashi & Ogawa, 1998). Instead, it seems likely that the constancy in Ca2+ release is due at least in part to an intrinsic Ca2+-dependent inactivation mechanism present in each release channel that closes the channel after it has passed a set amount of Ca2+, as modelled and discussed with respect to frog muscle by Jong et al. (1993). This is suggested most strongly by our finding that when the [BAPTA] in the cytoplasm was raised to 380 μM in fibres with maximal SR Ca2+ content, the amount of Ca2+ released increased by ≈35 % (Table 3). The fact that an increase in the amount of fast-Ca2+ buffer in the cytoplasm resulted in an increase in the amount of Ca2+ release, indicates that the release in those circumstances was terminated or reduced by a rise in cytoplasmic [Ca2+], as occurs with Ca2+ inactivation of Ca2+ release. The effect of the 380 μM BAPTA is also quantitatively similar to that occurring in amphibian fibres when Ca2+ inactivation is suppressed by buffering cytoplasmic [Ca2+] with fura-2 (Pape et al. 1993; ≈35 % increase in AP-induced Ca2+ release with 0.5 mM fura-2). It is possible that the constancy in AP-induced Ca2+ release observed here could also be caused at least in part by a mechanism whereby a faster initial rate of Ca2+ release shortens the duration of the AP (and hence Ca2+ release) by activating Ca2+-dependent potassium channels in the T-system membrane (see Pape et al. 1998). An additional mechanism that may also contribute to some degree to the limitation of Ca2+ release is the development of a transient potential across the SR (negative inside) resulting from inadequate charge compensation during the extremely rapid Ca2+ efflux; some evidence for such a mechanism comes from the inhibition of caffeine-induced Ca2+ efflux seen with acute increases in cytoplasmic chloride concentration (Coonan & Lamb, 1998).
Increasing the [BAPTA] to 380 μM perturbed the constancy in Ca2+ release when the Ca2+ content was maximal but had less or no effect at the endogenous Ca2+ content (Table 3). It is possible that when the SR was loaded at only the endogenous level, the limitation on the amount of Ca2+ release was determined to a large extent by deactivation of the voltage sensors at the end of the depolarising phase of the AP, with Ca2+ inactivation of Ca2+ release playing a relatively small part late in the process (but nevertheless causing substantial depression of Ca2+ release in response to another AP 10 ms later - see above). When the Ca2+ content was near maximal, the initial rate of Ca2+ efflux should be much greater, and hence Ca2+ release has to be reduced or terminated more rapidly in order to keep the total amount of Ca2+ release constant. Under such circumstances, any hindering of the Ca2+ inactivation of the Ca2+ release process by Ca2+ buffering with BAPTA could be expected to cause an appreciable increase in the total amount of Ca2+ release.
In previous work with amphibian twitch fibres, with 20 mM EGTA buffering Ca2+ release, the fraction of the total SR Ca2+ released by a single AP decreased by less than 20 % in fibres when the SR Ca2+ content increased approximately fourfold (possibly to near-maximal capacity; Fig. 10B in Pape et al. 1995); in other words, the amount of Ca2+ released by an AP increased almost linearly with SR Ca2+ content over that range. The difference from the present results is quite possibly due simply to the fact that the presence of 20 mM EGTA in the experiments of Pape et al. (1995) greatly reduced Ca2+ inactivation of Ca2+ release, which would have prevented this mechanism from keeping the total amount of Ca2+ efflux constant (as observed in the present study). In a subsequent study at lower levels of SR Ca2+ content, Pape et al. (1998) found that the fractional Ca2+ release in frog fibres decreased in inverse proportion as the Ca2+ content of the SR was increased from 300 to 600 μM total Ca2+ (in their units, which perhaps corresponds to ≈20-40 % of the endogenous Ca2+ content; Owen et al. 1997), which means that despite the presence of 20 mM EGTA, the amount of Ca2+ released by each AP remained relatively constant over that Ca2+ content range. Thus, these two studies can be seen as consistent with the proposal that the amount of Ca2+ released per AP normally stays constant over a wide range of SR Ca2+ content except under conditions where the Ca2+ inactivation mechanism is depressed (e.g. with 20 mM EGTA) and the SR is loaded to a substantial extent with Ca2+.
Ca2+ release at low SR Ca2+ content
Voltage-sensor activation is clearly a very potent stimulus to the Ca2+ release channels. It was shown here that the SR could be fully emptied of Ca2+ by a relatively small number of APs, provided that the APs were spaced long enough apart (e.g. Fig. 4 and Fig. 5). When the SR started with its endogenous Ca2+ content, ≈20 % of the total content (i.e. ≈200-230 μM) could be released by a single AP. As the associated phase of Ca2+ release probably lasted < 2 ms (given that the refractory period for the AP was ≈4-6 ms; see also Hollingworth et al. 1996), this gives an average release rate of > 100 mM Ca2+ s−1. This is similar to one estimate, but appreciably faster than another, obtained in isolated mammalian SR when stimulating Ca2+ release by applying Ca2+ and ATP in the absence of Mg2+ (Meissner et al. 1986; Donoso et al. 1995, respectively). Even when the SR of the fibres here was quite depleted (e.g. < 200 μM or < 7 % of maximum capacity), each AP could still release ≈50 % or more of the remaining Ca2+ (Fig. 10B). This is quantitatively very similar to that found in frog fibres depleted of Ca2+ (Pape et al. 1998). It is also clear that the voltage sensors remain effective at inducing Ca2+ release even when the SR is largely depleted of Ca2+, which is not the case with calcium-induced calcium release (Lamb et al. 2001).
Physiological relevance
The principal finding here, that the amount of Ca2+ released per AP is virtually constant over a wide range of SR Ca2+ content in fast-twitch mammalian muscle fibres, is of considerable importance for understanding the control of contraction in such muscle. Although there is relatively little Ca2+ influx into adult mammalian muscle fibres during the normal E-C coupling process itself (Melzer et al. 1995), the total SR Ca2+ content may rise with prolonged stimulation from its level in a rested EDL fibre (≈35 % of maximum capacity) to twice that level (Gissel & Clausen, 1999). The constancy in Ca2+ release per AP found here would mean that a pre-learned pattern of neural stimulation would lead to similar muscle contraction despite there being a substantial increase in SR Ca2+ content. This mechanism, however, would not prevail in the extreme case where the SR became loaded too close to maximum capacity; in that case (which may not occur physiologically in fast-twitch fibres) the force response to each AP could increase owing to reduced binding and uptake by the SR Ca2+ pump (Fig. 3). Perhaps of even more physiological importance, the results here indicate that if the amount of readily releasable Ca2+ in the SR were to decrease up to ≈20 % or more below the normal level (i.e. decrease from ≈1200 to 950 μM), it would cause relatively little decrease in the initial rate of Ca2+ release in repsonse to AP stimulation. Thus, if inorganic phosphate (Pi) generated during vigorous stimulation precipitates with some of the luminal Ca2+ (Fryer et al. 1995; Allen & Westerblad, 2001), a fast-twitch muscle would not show any decrease in performance, or fatigue, until an appreciable amount of precipitate had formed. This could help to explain why the decline of tetanic [Ca2+] generally occurs quite late during fatiguing stimulation even though the [Pi] in the cytoplasm increases relatively early (Allen & Westerblad, 2001).
In conclusion, the finding here that the amount of Ca2+ release in response to AP stimulation in fast-twitch muscle stays virtually constant over a wide range of SR Ca2+ content helps elucidate the characteristics and mechanisms underlying normal muscle performance.
Acknowledgments
We thank Aida Yousef for technical assistance, Professor George Stephenson for helpful discussions and comments, and the National Health & Medical Research Council of Australia for financial support (grant 991496).
REFERENCES
- Allen DG, Westerblad H. Role of phosphate and calcium stores in muscle fatigue. J Physiol. 2001;536:657–665. doi: 10.1111/j.1469-7793.2001.t01-1-00657.x. [DOI] [PMC free article] [PubMed] [Google Scholar]
- Bakker AJ, Lamb GD, Stephenson DG. The effect of 2,5-di-(tert-butyl)-1,4-hydroquinone on force responses and the contractile apparatus in mechanically skinned muscle fibres of the rat and toad. J Muscle Res Cell Motil. 1996;17:55–67. doi: 10.1007/BF00140324. [DOI] [PubMed] [Google Scholar]
- Baylor SM, Chandler WK, Marshall MW. Sarcoplasmic reticulum calcium release in frog skeletal muscle fibres from Arzenazo III calcium transients. J Physiol. 1983;344:625–666. doi: 10.1113/jphysiol.1983.sp014959. [DOI] [PMC free article] [PubMed] [Google Scholar]
- Baylor SM, Hollingworth S. Model of sarcoplasmic Ca2+ movements, including ATP Ca2+ binding and diffusion, during activation of frog skeletal muscle. J Gen Physiol. 1998;112:297–316. doi: 10.1085/jgp.112.3.297. [DOI] [PMC free article] [PubMed] [Google Scholar]
- Beard NA, Sakowska MM, Dulhunty AF, Laver DR. Calsequestrin is an inhibitor of skeletal muscle ryanodine receptor calcium release channels. Biophys J. 2002;82:310–320. doi: 10.1016/S0006-3495(02)75396-4. [DOI] [PMC free article] [PubMed] [Google Scholar]
- Caputo C, Bolanos P. Inactivation of Ca2+ release in amphibian and mammalian skeletal muscle fibers. Biophys J. 2002;82:641a. [Google Scholar]
- Coonan JR, Lamb GD. Effect of chloride on Ca2+ release from the sarcoplasmic reticulum of mechanically skinned skeletal muscle fibres. Pflugers Arch. 1998;435:720–730. doi: 10.1007/s004240050574. [DOI] [PubMed] [Google Scholar]
- Donoso P, Prieto H, Hidalgo C. Luminal calcium regulates release in triads isolated from frog and rabbit skeletal muscle. Biophys J. 1995;68:507–515. doi: 10.1016/S0006-3495(95)80212-2. [DOI] [PMC free article] [PubMed] [Google Scholar]
- Dutka TL, Lamb GD. Effect of low ATP concentrations on force relaxation in rat EDL muscle fibres; Proceedings of the Australian Health and Medical Research Congress; 2002. pp. 1447–6010. poster 2402 ISSN. [Google Scholar]
- Endo M. Calcium release from sarcoplasmic reticulum. Curr Top Membr Transp. 1985;25:181–230. [Google Scholar]
- Fink RHA, Stephenson DG, Williams DA. Potassium and ionic strength effects on the isometric force of skinned twitch muscle fibres of the rat and toad. J Physiol. 1986;370:317–337. doi: 10.1113/jphysiol.1986.sp015937. [DOI] [PMC free article] [PubMed] [Google Scholar]
- Fryer MW, Owen VJ, Lamb GD, Stephenson DG. Effects of creatine phosphate and Pi on Ca2+ movements and tension development in reticulum calcium skinned skeletal muscle fibres. J Physiol. 1995;482:123–140. doi: 10.1113/jphysiol.1995.sp020504. [DOI] [PMC free article] [PubMed] [Google Scholar]
- Fryer MW, Stephenson DG. Total and sarcoplasmic reticulum calcium contents of skinned fibres rat skeletal muscle. J Physiol. 1996;493:357–370. doi: 10.1113/jphysiol.1996.sp021388. [DOI] [PMC free article] [PubMed] [Google Scholar]
- Fuchs F. The binding of calcium to detergent-extracted rabbit psoas muscle fibres during relaxation and force generation. J Musc Res Cell Motil. 1985;6:477–486. doi: 10.1007/BF00712584. [DOI] [PubMed] [Google Scholar]
- Gissel H, Clausen T. Excitation-induced Ca2+ uptake in rat skeletal muscle. Am J Physiol. 1999;276:R331–339. doi: 10.1152/ajpregu.1999.276.2.R331. [DOI] [PubMed] [Google Scholar]
- Harrison SM, Bers DM. The effect of temperature and ionic strength on the apparent Ca-affinity of EGTA and the analogous Ca-chelators BAPTA and dibromo-BAPTA. Biochim Biophys Acta. 1987;925:133–143. doi: 10.1016/0304-4165(87)90102-4. [DOI] [PubMed] [Google Scholar]
- Herrmann-Frank A, Lehmann-Horn F. Regulation of the purified Ca2+ release channel/ryanodine receptor complex of skeletal muscle sarcoplasmic reticulum by luminal calcium. Pflugers Arch. 1996;432:155–157. doi: 10.1007/s004240050117. [DOI] [PubMed] [Google Scholar]
- Hollingworth S, Zhao M, Baylor SM. The amplitude and time course of the myoplasmic free [Ca2+] transient in fast-twitch fibers of mouse muscle. J Gen Physiol. 1996;108:455–465. doi: 10.1085/jgp.108.5.455. [DOI] [PMC free article] [PubMed] [Google Scholar]
- Inesi G, Sagara Y. Topical review: specific inhibitors of intracellular Ca2+ transport ATPases. J Membr Biol. 1994;141:1–6. doi: 10.1007/BF00232868. [DOI] [PubMed] [Google Scholar]
- Jong D-S, Pape PC, Chandler WK, Baylor SM. Reduction of calcium inactivation of sarcoplasmic reticulum calcium release by Fura-2 in voltage-clamped cut twitch fibers from frog muscle. J Gen Physiol. 1993;102:333–370. doi: 10.1085/jgp.102.2.333. [DOI] [PMC free article] [PubMed] [Google Scholar]
- Kurebayashi N, Ogawa Y. Effect of luminal calcium on Ca2+ release channel activity of sarcoplasmic reticulum in situ. Biophys J. 1998;74:1795–1807. doi: 10.1016/S0006-3495(98)77890-7. [DOI] [PMC free article] [PubMed] [Google Scholar]
- Lamb GD. Excitation-contraction coupling in skeletal muscle: comparisons with cardiac muscle. Clin Exp Pharmacol Physiol. 2000;27:216–224. doi: 10.1046/j.1440-1681.2000.03224.x. [DOI] [PubMed] [Google Scholar]
- Lamb GD. Voltage-sensor control of Ca2+ release in skeletal muscle: insights from skinned fibers. Front Biosci. 2002;7:d834–842. doi: 10.2741/A815. http://www.bioscience.org/2002/v7/d/lamb/list.htm. [DOI] [PubMed] [Google Scholar]
- Lamb GD, Cellini MA, Stephenson DG. Different Ca2+ releasing actions of caffeine and depolarization in skeletal muscle fibres of the rat. J Physiol. 2001;531:715–728. doi: 10.1111/j.1469-7793.2001.0715h.x. [DOI] [PMC free article] [PubMed] [Google Scholar]
- Lamb GD, Posterino GS. Effects of oxidation and reduction on contractile function in skeletal muscle fibres of the rat. J Physiol. 2003;546:149–163. doi: 10.1113/jphysiol.2002.027896. [DOI] [PMC free article] [PubMed] [Google Scholar]
- Lamb GD, Stephenson DG. Control of calcium release and the effects of ryanodine in skinned muscle fibres of the toad. J Physiol. 1990;423:519–542. doi: 10.1113/jphysiol.1990.sp018037. [DOI] [PMC free article] [PubMed] [Google Scholar]
- Lamb GD, Stephenson DG. Effect of Mg2+ on the control of Ca2+ release in skeletal muscle fibres of the toad. J Physiol. 1991;434:507–528. doi: 10.1113/jphysiol.1991.sp018483. [DOI] [PMC free article] [PubMed] [Google Scholar]
- Lamb GD, Stephenson DG. Effects of intracellular pH and [Mg2+] on excitation-contraction coupling in skeletal muscle fibres of the rat. J Physiol. 1994;478:331–339. doi: 10.1113/jphysiol.1994.sp020253. [DOI] [PMC free article] [PubMed] [Google Scholar]
- Laver DR, Lamb GD. Inactivation of Ca2+ release channels (ryanodine receptors RyR1 and RyR2) with rapid steps in [Ca2+] and voltage. Biophys J. 1998;74:2352–2364. doi: 10.1016/S0006-3495(98)77944-5. [DOI] [PMC free article] [PubMed] [Google Scholar]
- Makabe M, Werner O, Fink RHA. The contribution of the sarcoplasmic reticulum Ca2+-transport ATPase to caffeine-induced Ca2+ transients of murine skinned skeletal muscle fibres. Pflugers Arch. 1996;432:717–726. doi: 10.1007/s004240050190. [DOI] [PubMed] [Google Scholar]
- Meissner G, Darling E, Eveleth J. Kinetics of rapid Ca2+ release by sarcoplasmic reticulum. Effects of Ca2+, Mg2+, and adenine nucleotides. Biochemistry. 1986;25:236–244. doi: 10.1021/bi00349a033. [DOI] [PubMed] [Google Scholar]
- Mejia-Alvarez R, Kettlum C, Rios E, Stern M, Fill M. Unitary Ca2+ current through cardiac ryanodine receptor channels under quasi-physiological ionic conditions. J Gen Physiol. 1999;113:177–186. doi: 10.1085/jgp.113.2.177. [DOI] [PMC free article] [PubMed] [Google Scholar]
- Melzer W, Herrmann-Frank A, Lüttgau HC. The role of Ca2+ ions in excitation-contraction coupling of skeletal muscle fibres. Biochim Biophys Acta. 1995;1241:59–116. doi: 10.1016/0304-4157(94)00014-5. [DOI] [PubMed] [Google Scholar]
- Moisescu DG, Thieleczek R. Calcium and strontium concentration changes wiithin skinned muscle preparations following a change in the external bathing solution. J Physiol. 1978;275:241–262. doi: 10.1113/jphysiol.1978.sp012188. [DOI] [PMC free article] [PubMed] [Google Scholar]
- Ogawa Y, Kurebayashi N, Murayama T. Ryanodine receptor isoforms in excitation-contraction coupling. Adv Biophys. 1999;36:27–64. doi: 10.1016/s0065-227x(99)80004-5. [DOI] [PubMed] [Google Scholar]
- Owen VJ, Lamb GD, Stephenson DG, Fryer MW. Relationship between depolarization-induced force responses and Ca2+ content in skeletal muscle fibres of rat and toad. J Physiol. 1997;498:571–586. doi: 10.1113/jphysiol.1997.sp021884. [DOI] [PMC free article] [PubMed] [Google Scholar]
- Pape PC, Jong D-S, Chandler WK. Calcium release and its voltage dependence in frog cut muscle fibres equilibrated with 20 mM EGTA. J Gen Physiol. 1995;106:259–336. doi: 10.1085/jgp.106.2.259. [DOI] [PMC free article] [PubMed] [Google Scholar]
- Pape PC, Jong D-S, Chandler WK. Effect of partial sarcoplasmic reticulum calcium release in frog cut muscle fibres equilibrated with 20 mM EGTA. J Gen Physiol. 1998;112:263–295. doi: 10.1085/jgp.112.3.263. [DOI] [PMC free article] [PubMed] [Google Scholar]
- Pape PC, Jong D-S, Chandler WK, Baylor SM. Effect of fura-2 on action potential-stimulated calcium release in cut twitch fibers from frog muscle. J Gen Physiol. 1993;102:295–332. doi: 10.1085/jgp.102.2.295. [DOI] [PMC free article] [PubMed] [Google Scholar]
- Pizarro G, Shirokova N, Tsugorka A, Rios E. ‘Quantal’ calcium release operated by membrane voltage in frog skeletal muscle. J Physiol. 1997;501:289–303. doi: 10.1111/j.1469-7793.1997.289bn.x. [DOI] [PMC free article] [PubMed] [Google Scholar]
- Posterino GS, Cellini MA, Lamb GD. Effect of oxidation and redox conditions on excitation-contraction coupling in rat skeletal muscle. J Physiol. 2003;547:807–823. doi: 10.1113/jphysiol.2002.035204. [DOI] [PMC free article] [PubMed] [Google Scholar]
- Posterino GS, Lamb GD. Effects of reducing agents and oxidants on excitation-contraction coupling in skeletal muscle fibres of rat and toad. J Physiol. 1996;496:809–825. doi: 10.1113/jphysiol.1996.sp021729. [DOI] [PMC free article] [PubMed] [Google Scholar]
- Posterino GS, Lamb GD. Effects of sarcoplasmic reticulum Ca2+ content on the total amount of Ca2+ released during a single twitch; Proceedings of the Australian Health and Medical Research Congress; 2002. 1358 (ISSN 1447–6010) [Google Scholar]
- Posterino GS, Lamb GD, Stephenson DG. Twitch and tetanic force responses and longitudinal propagation of action potentials in skinned skeletal muscle fibres of the rat. J Physiol. 2000;527:131–137. doi: 10.1111/j.1469-7793.2000.t01-2-00131.x. [DOI] [PMC free article] [PubMed] [Google Scholar]
- Protasi F, Paolini C, Nakai J, Beam KG, Franzini-Armstrong C, Allen PD. Multiple regions of RyR1 mediate functional and structural interactions with alpha(1S)-dihydropyridine receptors in skeletal muscle. Biophys J. 2002;83:3230–3244. doi: 10.1016/S0006-3495(02)75325-3. [DOI] [PMC free article] [PubMed] [Google Scholar]
- Robertson SP, Johnson JD, Potter JD. The time-course of Ca2+ exchange with calmodulin, troponin, parvalbumin, and myosin in response to transient increases in Ca2+ Biophys J. 1981;34:559–569. doi: 10.1016/S0006-3495(81)84868-0. [DOI] [PMC free article] [PubMed] [Google Scholar]
- Schneider MF, Simon BJ. Inactivation of calcium release from the sarcoplasmic reticulum in frog skeletal muscle. J Physiol. 1988;405:727–745. doi: 10.1113/jphysiol.1988.sp017358. [DOI] [PMC free article] [PubMed] [Google Scholar]
- Sitsapesan R, Williams AJ. Regulation of current flow through ryanodine receptors by luminal Ca2+ J Membr Biol. 1997;159:179–185. doi: 10.1007/s002329900281. [DOI] [PubMed] [Google Scholar]
- Stephenson DG, Nguyen LT, Stephenson GM. Glycogen content and excitation-contraction coupling in mechanically skinned muscle fibres of the cane toad. J Physiol. 1999;519:177–187. doi: 10.1111/j.1469-7793.1999.0177o.x. [DOI] [PMC free article] [PubMed] [Google Scholar]
- Szentesi P, Kovacs L, Csernoch L. Deterministic inactivation of calcium release channels in mammalian skeletal muscle. J Physiol. 2000;528:447–456. doi: 10.1111/j.1469-7793.2000.00447.x. [DOI] [PMC free article] [PubMed] [Google Scholar]
- Tanabe T, Beam KG, Powell JA, Numa S. Regions of the skeletal muscle dihydropyridine receptor critical for excitation-contraction coupling. Nature. 1990;344:451–453. doi: 10.1038/346567a0. [DOI] [PubMed] [Google Scholar]
- Tripathy A, Meissner G. Sarcoplasmic reticulum lumenal Ca2+ has access to cytosolic activation and inactivation sites of skeletal muscle Ca2+ release channel. Biophys J. 1996;70:2600–2615. doi: 10.1016/S0006-3495(96)79831-4. [DOI] [PMC free article] [PubMed] [Google Scholar]