Abstract
Measurement of fluorescent lifetimes of dye-tagged DNA molecules reveal the existence of different conformations. Conformational fluctuations observed by fluorescence correlation spectroscopy give rise to a relaxation behavior that is described by “stretched” exponentials and indicates the presence of a distribution of transition rates between two conformations. Whether this is an inhomogeneous distribution, where each molecule contributes with its own reaction rate to the overall distribution, or a homogeneous distribution, where the reaction rate of each molecule is time-dependent, is not yet known. We used a tetramethylrhodamine-linked 217-bp DNA oligonucleotide as a probe for conformational fluctuations. Fluorescence fluctuations from single DNA molecules attached to a streptavidin-coated surface directly show the transitions between two conformational states. The conformational fluctuations typical for single molecules are similar to those seen in single ion channels in cell membranes.
Fluorescence correlation spectroscopy (FCS) allows the analysis of single-molecule events and their time correlations in solution (1–6). Since the introduction of confocal excitation in extremely small volume elements (2), single molecules can be detected almost background-free in solution (3, 4). FCS has opened the possibility to analyze the behavior of single molecules in relation to their ensemble averages. In particular information can be obtained from the analysis of single molecules that cannot be obtained from the ensemble average alone.
As has been pointed out by Wang and Wolynes (7), properties found for the molecular ensemble such as the distribution of states can also be a property of a single molecule (the homogenous case). Alternatively, the ensemble behavior can be caused by a collection of individual molecules, each representing a different state (the inhomogeneous case). Such situations are likely to be found in biological systems as has been put forward recently by Frauenfelder (8).
We have earlier been able to demonstrate the existence of different conformational states in single molecules of M13 phage DNA (9) from the analysis of the exited state of tetramethylrhodamine (TMR) linked to the DNA by a 6-atom carbon linker and serving as a sensor for different conformational states of the DNA molecule. The redox potential between aromatic dye molecules and purine as well as pyrimidine bases (10) leads in the case of rhodamine dyes to an electron transfer from guanine to the dye that competes with the photon emission from the excited singlet state of TMR (11, 12). The electron transfer is characteristic for guanine and indicates that in one conformation electron transfer takes place but not in the other. The time range of the observed conformational transitions is in the millisecond region, pointing to the involvement of intercalative processes (13, 14). The rates as measured in a molecular ensemble by FCS exhibited a nonexponential behavior that could be best represented by a “stretch” parameter (β = 0.44) and indicates a distribution of rates (9).
We show herein the results obtained by the measurement of conformational transitions in a single DNA molecule that is attached to a surface by a biotin–streptavidin interaction and carries the TMR sensor. For this purpose a 217-bp DNA piece was prepared by PCR. We are able to show fluorescence intensity fluctuations in single DNA molecules in the range of hundreds of milliseconds that are due to conformational fluctuations. They are analogous to the single ion channel fluctuations that have been observed by Neher and Sakmann (15).
We have been able to analyze the transition rates for individual DNA molecules and compare their calculated relaxation rates with the situation found for the ensemble. Within the time limit of observation set by the photochemical lifetime of the TMR sensor (a few seconds), we find different relaxation rates for different DNA molecules, supporting the existence of an inhomogeneous distribution. An important result of this study is the demonstration that molecular transitions in single biomolecules can be observed by optical spectroscopy, in particular by FCS.
MATERIALS AND METHODS
Sample Molecule.
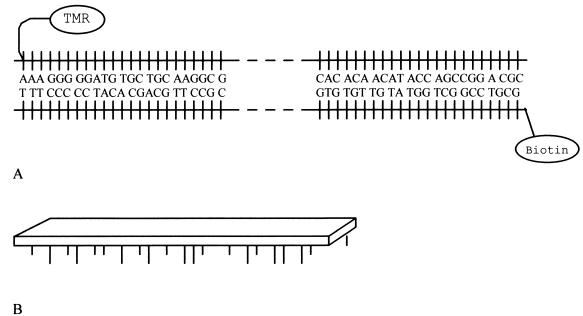
By amplification with the PCR, a 217-bp DNA product was obtained labeled with a tethered TMR molecule on one end and a Biotin molecule at the other end. In the PCR M13 mp18(+) strand DNA (7,250 bases) was used as template. The primers used were 5′-(TMR)-AAAGGGGGATCTGCTGCAAGGCG as forward primer (TMR linked to the primer through a 6-carbon-atom linker) and biotin-labeled 5′-(Bi)GCTTCCGGCTCGTATGTTGTGTG as reversed primer. PCR buffer and PCR conditions were as follows: The buffer contained 21.7 mM Tris⋅HCl (pH 8.3), 41.7 mM KCl, 1.7 mM MgCl2, all four dNTPs (each at 166.7 μM), 5 units of Taq DNA polymerase, and 83 nM TMR- and biotin-labeled primers. Denaturation was at 96°C for 30 s, annealing was at 65°C for 60 s, and elongation was at 72°C for 120 s. Twenty-five cycles were run. (GenAmp PCR System 2400, Perkin–Elmor). After PCR, nucleotides and primers were removed by centrifugation (Microspin s-200 columns, Pharmacia).
Preparation of Streptavidin-Coated Coverslips.
Coverslips, 170 μm thick, were first incubated in 10% solution of 3-glycidyloxypropyl-trimethoxysilane in toluene for 24 h and then in a streptavidin solution (50 mg/l) in carbonate buffer (pH 9) for 72 h. Groups not occupied by streptavidin were inactivated in 0.5 M Tris for 12 h (Fig. 1).
Figure 1.
(A) Final 217-bp PCR product. TMR is attached to the forward primer through a 6-carbon-atom linker and biotin is attached to the reversed primer. (B) Schematic diagram of DNA attached to the coverslip.
Fluorescence Decay (FD) and FCS Measurements.
FD measurements were carried out by time-correlated single photon counting using a mode-locked and synchronously pumped dye laser (Coherent 200 Ar-Ion pump and Coherent 702 dye laser with cavity dumper) and a microchannel plate photo multiplier (R1564U Hamamatsu) as detector (16).
The experimental setup for the FD and FCS measurements has been described (2). A Zeiss ×40 numerical aperature 0.9 objective was used providing the volume element with a 1-μm diameter and 4-μm length. For the FCS measurements, some complementations of the experimental setup were made. A scanning table (ITK, Lahnau, Germany; MC-2000) was used to move the coverslip relative to the volume element. The table was moveable in three dimensions with 1-μm steps. FCS measurements were taken with a digital correlator (ALV, Langer, Germany; model ALV-5000). To reduce the bleaching rate of the fluorophore, a reduced laser intensity in which the average count rate of a TMR molecule did not exceed 1,500 Hz was used.
To estimate the appropriate PCR product concentration to be used during incubation on the surface and the probability of a single molecule detection, 100 × 100 μm scans were performed with the use of the scanning table and a multichannel scaler (Tennelec/Nucleus, MCS-II version 2.091). The scanning speed of the table was 7.8 ms per channel.
Analysis of PCR Product by FCS and Binding of DNA to Coverslips.
By FCS we estimated the DNA to free primer ratio of the PCR product solution to >10:1 and the concentration of DNA to 0.1 μM. By letting a 0.5 M NaCl solution of the PCR product incubate with the coverslips for 20–60 min in a vapor-saturated chamber, the sample molecules were attached to the streptavidin surface through the biotin. DNA molecules not bound to the surface were removed through washing in the 0.5 M NaCl buffer.
Single Molecule Measurements.
In search for single molecule fluctuations on the streptavidin-coated surface, a computer program was written to control the table so that a large number of measurements were carried out automatically. The table moved one point on the surface into the volume element after which correlation measurement was immediately started. When the measurement was finished the table moved the next point into the volume element and so on.
Data Analysis and Theoretical Models.
In FCS, molecules in a small open volume (0.2–2 fl) are excited by a green HeNe laser (543.5 nm). From the fluorescence intensity, the autocorrelation function (ACF) is calculated. Normally, FCS is measured as the three-dimensional diffusion of molecules through the volume element. In our measurements however, the molecules were attached to a surface so all fluorescence fluctuations originate from the change in fluorescence from TMR when the conformational state of the molecule was changed, and no fluctuations are due to diffusion of the molecules. In the ACF, the fluorescence intensity at time t, I(t), is correlated with the fluorescence intensity at time t + τ. In general the normalized ACF can be written as G(τ) = 〈I(t)I(t + τ)〉/〈I〉2, where 〈 〉 indicates the time average. In the experiments of Edman et al. (9), ACF data from measurement of diffusing molecules undergoing conformational changes were fitted to
 |
1 |
where N is the average number of molecules in the volume element, τd is the characteristic diffusion time of one molecule through the volume element, ω1 and ω2 are the distances from the center of the laser beam focus in the radial and axial directions, respectively, at which the collected fluorescence intensity has dropped by a factor of e2 compared with its peak value, k is the reaction relaxation parameter defined as k = k1 + k−1, where k1 and k−1 are the reaction rates in each direction, β is the “stretch” parameter, and finally A = K[(1 − Q)/(1 + QK)]2, where K is the equilibrium constant between the two states and Q is the quantum yield ratio of the two states. For the measurements where the DNA molecules are fixed on the streptavidin surface and hence are unable to undergo lateral diffusion, the proper model is
 |
2 |
In the case that the background intensity is not negligible as in a situation where the fluorescence is measured close to a glass surface, 1/N has to be substituted with N/(N + NB)2 (17), where NB is the number of molecules that would equal the background fluorescence.
To analyze the distribution of relaxation rates behind the stretch parameter β found in the earlier ensemble experiment in solution (9), we derived the expression
 |
3 |
 |
where N is the average number of molecules in the volume element, ki is the relaxation rate, and pi is the average contribution from the relaxation rate ki. For this analysis the contin algorithm (18) was used. contin uses a constraint regularization for parametrizing discrete elements (pi) of the distribution function ∑ pi.
The fluorescence decay measurements were modeled as a superposition of exponential terms,
 |
4 |
The decay model was convoluted with the instrumental response function, and the Marquardt–Levenberg nonlinear least-squares algorithm (19) was applied for data analysis.
RESULTS
Single Molecule Detection of DNA.
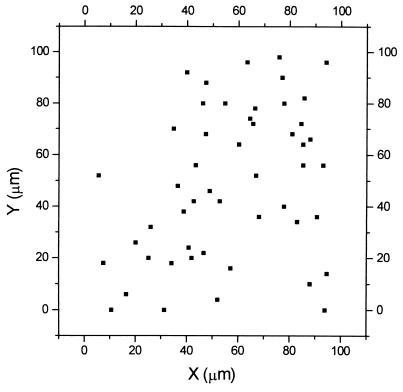
After applying a 0.01 pM solution of the TMR- and biotin-labeled DNA on the streptavidin-coated surface a 100 × 100 μm scan (20) for DNA was performed (Fig. 2). The background intensity was 140 counts per channel, and points exceeding 280 counts per channel were selected.
Figure 2.
Scan (100 × 100 μm) for single DNA molecules. A solution containing 0.01 pM PCR product was used during incubation. Points that exceed 280 counts per channel were selected from a background intensity of 140 counts per channel.
To achieve single-molecule detection, we measured repeatedly on different spots on the surface. The results from the 100 × 100 μm scan were used to estimate the probability of a single-molecule detection. Because of the Gaussian distribution of the intensity of the volume element, the effective width of the trace covered by the volume element was 0.8 μm. The spacing between each trace was 1 μm so the scan covered 30% of the 100 × 100 μm area. The actual amount of molecules on that area was, therefore, ≥150. With an effective measuring area of the volume element of 0.5 μm2 and a total area of 10,000 μm2, the possibility of finding a single molecule was 1 in 120.
Photo Decomposition of Single DNA Molecules.
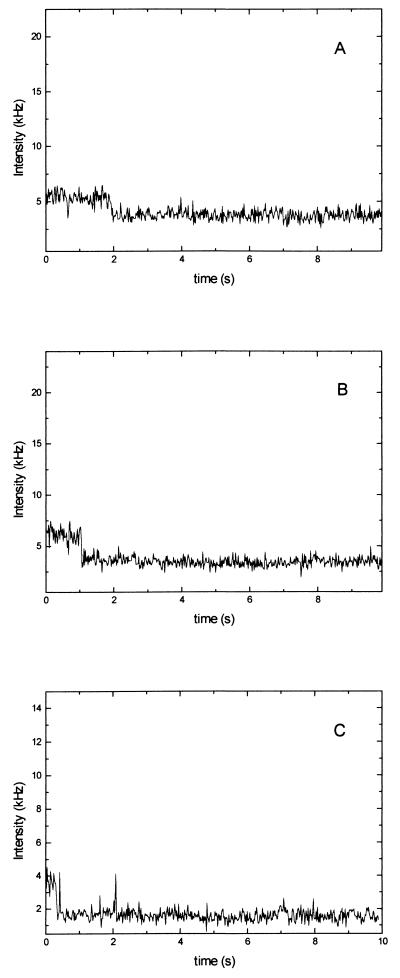
We analyzed in 17 cases the photo decomposition of single DNA molecules. With the reduced laser intensity used, the fluorescence intensity of a single molecule was 1–4 kHz above background level. During a single-molecule measurement, the fluorescence intensity stays on a constant level for a few seconds and then drops instantaneously to background level when the molecule is bleached (Fig. 3).
Figure 3.
Three examples of single molecule bleachings. The fluorescence intensity is constant until it instantaneously drops to background level due to bleaching.
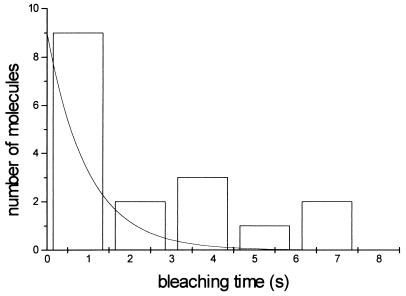
A histogram of the observation time of individual molecules (Fig. 4) shows that the majority of molecules can be observed during a time window of 1.5 s before bleaching occurs. However, there are cases where observations are possible up to 7 s. Since the observation time of single molecules is related to the ensemble average of many molecules, the photo decomposition of many molecules attached to the surface at a nanomolar concentration was measured. Instead of single-molecule traces, an exponential decay is obtained with a time constant of 1.0 s at every spot on the surface (Fig. 4).
Figure 4.
Histogram of the 17 single-molecule bleachings. Exponential curve with decay time of 1.0 s is also shown.
Conformational Fluctuations.
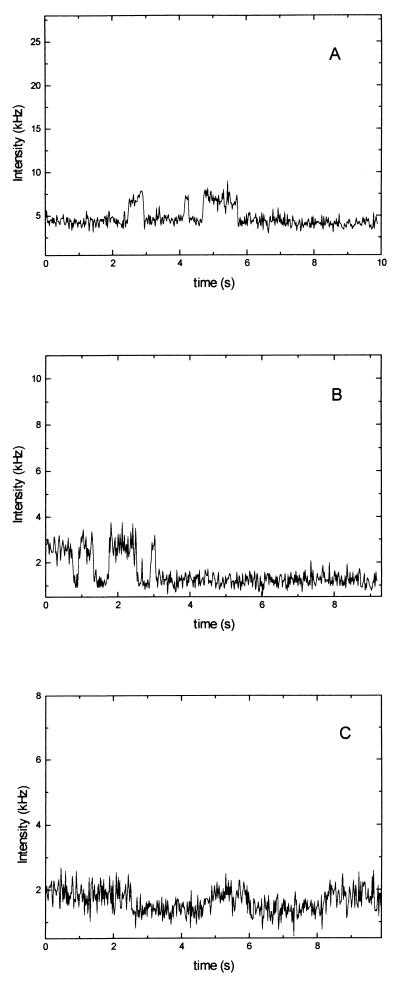
From the analysis of single-molecule bleachings, it was clear that some molecules lived long enough to enable detection of conformational fluctuations. We measured clear cases of single-molecule fluctuations of which three examples are shown (Fig. 5). In Fig. 5A, the molecule is situated in the low-fluorescent conformation for 2 s and then makes a transition to the high-fluorescent conformation, where it stays for 0.6 s, until it makes another transition back to the low-fluorescent conformation and so on. After a total of 6 s, the molecule is bleached.
Figure 5.
Three cases of conformational fluctuations in single DNA molecules. For example in B, the molecule starts out in the high-fluorescent state (TMR is far from guanosine), switches after 0.6 s to the low-fluorescent state (TMR close to guanosine), and after another 0.2 s switches back to the high-fluorescent state. The fluctuations continues until bleaching occurs.
In the experiments presented in ref. 9, the reaction rates between the two states were measured as the contribution of a chemical relaxation term to the autocorrelation function. Because k = k1 + k−1 and the rate is equal to the inverse of the time spent in one state before transiting to the other, the relaxation rates for the three cases of single-molecule fluctuations can be calculated. The results are
 |
 |
where the errors are standard deviation of the mean.
In the case of the M13 DNA, the existence of two conformational states could be demonstrated by the observation of two lifetimes for the TMR sensor of 3.7 ns and 0.86 ns (9). Similarly in the present case of the 217-bp DNA piece, the two lifetimes evident in the FD measurement were τ1 = 1.36 ns and τ2 = 4.06 ns. Their relative amplitudes were 0.22 and 0.78, respectively. Models with one exponential term failed to apply to the data, and models with three or more exponentials did not improve the fit. The two lifetimes result in a quantum yield ratio Q = τ1/τ2 of approximately 1/3 so the difference in fluorescence of the two states should be a factor of 3.
Ensemble and Single Molecule Relaxation.
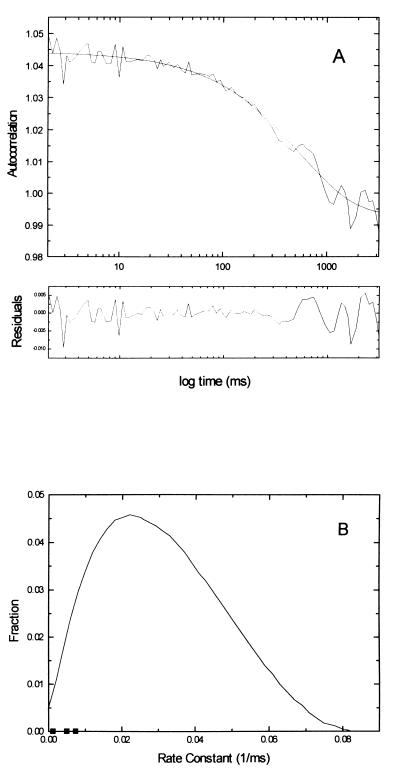
In the experiments presented in ref. 9, the conformational relaxation had to be described by a stretch parameter, β = 0.44, indicating processes in complex systems with a broad distribution of rates (21, 22). In a fit of a single DNA molecule experiment to Eq. 2, we found for β a value of 0.83 ± 0.09 (Fig. 6A), indicating a narrow distribution that for β = 1 is of Dirac type. The distribution of relaxation rates from the ensemble experiment (9) has been evaluated according to Eq. 3 and shows a maximum k value of around 20 s−1 and is skewed toward higher rates (Fig. 6B). As a comparison, the relaxation rates of three cases of conformational fluctuations are inserted. They are found within the distribution of relaxation rates at about the half value of the maximal relaxation rate found in solution studies. In this comparison, it should be noted that the sample used in ref. 9, where a molecular ensemble was measured, had a somewhat different primer than the one we used. Also, our molecules were attached to a surface whereas theirs were diffusing freely.
Figure 6.
(A) Autocorrelation of the fluorescence intensity of the single-molecule measurement seen in Fig. 5A and theoretical stretched exponential curve of β = 0.83. (B) Distribution of pi from a fit of the stretched exponential data from ref. 1 to Eq. 3 with the relaxation rates of the three cases of conformational fluctuations seen in Fig. 5 inserted.
DISCUSSION
A prerequisite for the observation of single molecule phenomena is a sufficiently photochemical stability of the fluorescent tag used to sense the conformational transition. The photochemical lifetime during which a molecule still can emit photons is determined by its photophysical properties and environmental conditions (23, 24). In the case of single TMR molecules, the molecule emits photons until it is suddenly destroyed (bleached). We have been able to detect several clear cases of single-molecule bleachings that occur with a single-step transition (25). The data from the many molecule measurements were used to estimate the probability of finding a long-lived molecule.
The exponential decay of many molecules can be described as
 |
5 |
where n is the number of excitations per molecule and ν is a characteristic number of excitations after which e−1 of the population still exists. Since the number of excitations n is proportional to the time t and excitation rate ke, n = ket, the time dependent intensity is given by
 |
6 |
with the bleaching time τ = ν/ke.
Using the normalized exponential decay with an average decay time of 1.0 s for estimating the possibility of finding a long-lived molecule gives that 64% of all molecules should fluoresce less than 1 s and 95% less than 3 s. Thirty percent of our single-molecule detections lie outside this range, indicating the existence of molecules with different photo stability. In certain experiments involving many molecules, a long-lifetime (5.0 s) population was found in addition to the short one (1.0 s).
Our measurements directly show fluctuations between two conformational states of a single DNA as sensed by a fluorescent dye on a linker. Aromatic dyes have been shown to accept electrons from other aromatic ring systems with an appropriate redox potential (8). For TMR and related rhodamine dyes such as Rh6G, this is only the case with guanine (10–12). In the case of a stack between Rh6G and guanosine in aqueous solution the lifetime of Rh6G has been reduced from about 3.9 ns to 200 ps (12). Depending on its distance and relative position to TMR, the guanine base will compete for the emission of photons from the excited state of TMR reducing its singlet lifetime.
In the present case, the TMR on its 6-carbon linker can experience the vicinity of several guanines in the sequence of the forward primer. In the analysis of fluorescence lifetimes, we find two components with 4 and 1.3 ns that must be explained by the TMR far away from the guanine bases and by the TMR close to them. Although we have not observed the 200-ps component observed with Rh6G–guanine stacking in water, we are not able to exclude faster components below 50 ps. From the results reported earlier (9), we concluded from the time range of the transition between the two states (30 ms) that intercalation of TMR between nucleotide bases including the guanine might occur (13, 14). We cannot exclude even other modes of unstacking of bases combined with partial stacking with TMR as a result of hydrogen bond breakage, base flipping, and exposure during the breathing of a DNA duplex (26, 27).
To estimate the fluorescence intensity of a single molecule, we measured the three-dimensional diffusion in a hanging droplet (2). The fluorescence intensity of a molecule at a certain instant depends on its conformational state and its position and excitation in the volume element with a Gaussian intensity distribution. Therefore, the maximum fluorescence intensity is about three times higher than the average. Also, the fluorescence intensity of the two conformational states differ by a factor of three. We measured an average fluorescence intensity per molecule of 1 kHz. Due to these considerations, the fluorescence intensity for a molecule in the high-fluorescent state positioned at the center of the volume element should be approximately 4 kHz. This is in agreement with the measured single molecule fluctuations where the intensity differences are 3, 2, and 1 kHz, respectively, between the high- and the low-fluorescent states. In three-dimensional diffusion measurements, the signal-to-background ratio is usually 1,000:1 (3, 4). In our measurements, however, the molecules are attached to a surface so the volume element needs to be at the surface. This reduces the high signal-to-background ratio to the order of 1:1 and makes a discrimination of the intensity of the lower-fluorescent state from the background radiation difficult.
It has to be considered whether the intensity fluctuations could originate from something other than conformational fluctuations. Alternative processes relevant in this case are the translational, rotational, and bending motions of the DNA molecule. Since the characteristic diffusion time of the DNA through the volume element is 400 μs, the result of an occasional diffusing molecule would be a narrow intensity peak (2). Rotational diffusion of the DNA molecule and of the TMR on its linker would occur in the nanosecond and subnanosecond time domain. The length of the DNA molecule (65 nm) is below the mean statistical length (persistence length) of a DNA molecule (28). Bending motion occurs, moreover, in the microsecond time scale (29). We therefore exclude the possibility that the observed fluctuations are caused by known hydrodynamic properties of DNA.
Fluorescence fluctuations on different time scales in single dye molecules on surfaces such as glass or polymethylmethacrylate have been observed by near and far field microscopy (30–33). These are spectral fluctuations of which the origins are still under debate (34). In our case the dye tethered on a 1-nm linker to the isolated DNA molecule is more than 60 nm away from the surface to which the DNA molecule is bound.
The fluorescence fluctuations in Fig. 5 exhibit large similarities with those measured for current fluctuations in single ion channels (15). In these measurements carried out with the patch-clamp technique the conductance switches suddenly between two states, an open and a closed one. Channels with different opening and closing rates and channels operating in different modes have been observed (35). A large body of data regarding ensemble averages and single channel noise exists (36) and the question of homogeneous or inhomogeneous operation can be addressed.
Proteins undergo complex folding reactions starting from a linear polypeptide chain to reach the final low energy state of a folded protein via innumerable intermediates. It is thus likely that the folding pathway for different protein molecules is different and leads to an end product with differences in their performance. In terms of Frauenfelder’s substate model (8, 22), the energy surface is due to the existence of different activation barriers in different protein molecules. Indications in this direction are also studies on the enzymatic turnover of single enzyme molecules (37).
In our DNA molecules, a distribution of molecular configurations including unpaired loops, unstacked bases after hydrogen bond breakage, local B–Z transitions, A and B configurations, etc., can be envisaged (26). It is thus not surprising that different transition rates between the states that the TMR can sense are found.
Given the present time window of observation, our data indicate that each DNA molecule does not have the same nonexponential relaxation as was found for the ensemble. One possible explanation is that each molecule has a characteristic relaxation rate that for a large population results in the distribution found for the ensemble. The other explanation is that the reaction takes place in a very rough energy landscape so that local transitions will yield exponential or slightly nonexponential relaxations. Given enough time, the molecule will in this case, however, experience different relaxation modes, and the time average from a single molecule will be identical to the ensemble average collected from many molecules (ergodicity). A final decision will depend on the ability to analyze single molecules during time intervals of sufficient lengths.
We summarize our present results as follows. (i) We demonstrate that with fluorescence techniques, it is possible to monitor conformational fluctuations in a single DNA molecule in the same manner as single ion-channel fluctuations can be measured. (ii) The method is of general nature and will make it possible to do the same kind of measurements on a large number of systems. (iii) Inhomogeneity is likely to arise in a complex system such as the present system, which is also the indication of our experimental data.
Acknowledgments
We thank Dr. I. Zelikman (Pharmacia Diagnostics AB) for help with the streptavidin coating, Dr. Per Thyberg for valuable help regarding data collection, and Dr. Jerker Widengren and Johan Holm for discussions. This study was supported by grants from the Swedish Natural Science Research Council and Swedish Research Council for Engineering Sciences.
ABBREVIATIONS
- FCS
fluorescence correlation spectroscopy
- TMR
tetramethylrhodamine
- FD
fluorescence decay
- ACF
autocorrelation function
References
- 1.Rigler R, Widengren J, Mets Ü. In: Fluorescence Spectroscopy: New Methods and Applications. Wolfbeis O S, editor. Berlin: Springer; 1992. pp. 13–24. [Google Scholar]
- 2.Rigler R, Mets Ü, Widengren J, Kask P. Eur Biophys J. 1993;22:169–175. [Google Scholar]
- 3.Rigler R, Mets Ü. SPIE Laser Spectrosc Biomol. 1992;1921:239–248. [Google Scholar]
- 4.Mets Ü, Rigler R. J Fluoresc. 1994;4:259–264. doi: 10.1007/BF01878461. [DOI] [PubMed] [Google Scholar]
- 5.Nie S, Chiu D T, Zare R N. Science. 1994;266:1018–1021. doi: 10.1126/science.7973650. [DOI] [PubMed] [Google Scholar]
- 6.Keller R A, Ambrose W P, Goodwin P M, Jett J H, Martin J C, Wu M. Appl Spectrosc. 1996;50:12A–32A. [Google Scholar]
- 7.Wang J, Wolynes P. Phys Rev Lett. 1995;74:4317–4320. doi: 10.1103/PhysRevLett.74.4317. [DOI] [PubMed] [Google Scholar]
- 8.Frauenfelder H. In: Glasses and Glass Formers. Ngai K L, editor. Material Research Society; 1997. , in press. [Google Scholar]
- 9.Edman L, Mets Ü, Rigler R. Proc Natl Acad Sci USA. 1996;93:6710–6715. doi: 10.1073/pnas.93.13.6710. [DOI] [PMC free article] [PubMed] [Google Scholar]
- 10.Seidel C A M, Schulz A, Sauer M H M. J Phys Chem. 1996;100:5541–5553. [Google Scholar]
- 11.Sauer M, Han K-T, Muller R, Nord S, Schulz A, Seeger S, Wolfrum J, Arden-Jacobi J, Deltau G, Marx N J, Zander C, Drexhage K H. J Fluoresc. 1995;5:247–261. doi: 10.1007/BF00723896. [DOI] [PubMed] [Google Scholar]
- 12.Widengren J, Dapprich J, Rigler R. Chem Phys. 1997;216:417–426. [Google Scholar]
- 13.Li H J, Crothers D. J Mol Biol. 1969;39:461–477. doi: 10.1016/0022-2836(69)90138-7. [DOI] [PubMed] [Google Scholar]
- 14.Ramstein J, Ehrenberg M, Rigler R. Biochemistry. 1980;19:3938–3948. doi: 10.1021/bi00558a008. [DOI] [PubMed] [Google Scholar]
- 15.Neher E, Sakmann B. Nature (London) 1976;260:799–802. doi: 10.1038/260799a0. [DOI] [PubMed] [Google Scholar]
- 16.Rigler R, Claesens F, Kristensen O. Anal Instrum. 1985;14:525–546. [Google Scholar]
- 17.Koppel D E. Phys Rev A. 1974;10:1938–1945. [Google Scholar]
- 18.Provencher S W. Comput Phys Commun. 1981;27:229–242. [Google Scholar]
- 19.Marquardt D. J Soc Ind Appl Math. 1963;11:431–441. [Google Scholar]
- 20.Dapprich J, Mets Ü, Simm W, Eigen M, Rigler R. Exp Tech Phys. 1995;46:259–264. [Google Scholar]
- 21.Palmer R G, Stein D L, Abrahams E, Anderson P W. Phys Rev Lett. 1984;54:958–961. [Google Scholar]
- 22.Frauenfelder H, Sligar S G, Wolynes P G. Science. 1991;254:1598–1603. doi: 10.1126/science.1749933. [DOI] [PubMed] [Google Scholar]
- 23.Widengren J, Mets Ü, Rigler R. J Phys Chem. 1995;99:13368–13379. [Google Scholar]
- 24.Widengren J, Rigler R. Bioimaging. 1996;4:149–157. [Google Scholar]
- 25.Schmidt T, Schutz G J, Baumgartner W, Gruber H J, Schindler H. Proc Natl Acad Sci USA. 1996;93:2926–2929. doi: 10.1073/pnas.93.7.2926. [DOI] [PMC free article] [PubMed] [Google Scholar]
- 26.Saenger W. Principles of Nucleic Acid Structure. Berlin: Springer; 1984. [Google Scholar]
- 27.McCammon J A, Harvey S C. Dynamics of Proteins and Nucleic acids. New York: Cambridge Univ. Press; 1987. [Google Scholar]
- 28.Reinert K E. In: Physical Chemical Properties of Nucleic Acids. Duchesne J, editor. Vol. 2. New York: Academic; 1973. pp. 319–356. [Google Scholar]
- 29.Schurr J M, Fujimoto B S, Wu P, Som L. In: Topics in Fluorescence Spectroscopy. Lakowicz J R, editor. Vol. 3. New York: Plenum; 1992. pp. 137–229. [Google Scholar]
- 30.Xie X S, Dunn R C. Science. 1994;265:361–364. doi: 10.1126/science.265.5170.361. [DOI] [PubMed] [Google Scholar]
- 31.Trautman J K, Macklin J J, Brus L E, Betzig E. Nature (London) 1994;369:40–42. [Google Scholar]
- 32.Ambrose W P, Goodwin P M, Martin J C, Keller R A. Science. 1994;265:364–367. doi: 10.1126/science.265.5170.364. [DOI] [PubMed] [Google Scholar]
- 33.Macklin J J, Trautman T D, Brus L E. Science. 1996;272:255–258. [Google Scholar]
- 34.Xie S X. Acc Chem Res. 1996;29:598–606. [Google Scholar]
- 35.Patlak J. Physiol Rev. 1991;71(2):1047–1080. doi: 10.1152/physrev.1991.71.4.1047. [DOI] [PubMed] [Google Scholar]
- 36.Heinemann S H, Sigworth F J. Biophys J. 1990;57(3):499–514. doi: 10.1016/S0006-3495(90)82566-2. [DOI] [PMC free article] [PubMed] [Google Scholar]
- 37.Xue Q, Yeung E S. Nature (London) 1995;373:681–683. doi: 10.1038/373681a0. [DOI] [PubMed] [Google Scholar]


