

Abstract
Low amplitude muscle vibration (0.5 ms; 80 Hz; duration 1.5 s) was applied in turn to each of three different intrinsic hand muscles (first dorsal interosseus, FDI; abductor pollicis brevis, APB; and abductor digiti minimi, ADM) in order to test its effect on the EMG responses evoked by transcranial magnetic stimulation (TMS). Recordings were also taken from flexor and extensor carpi radialis (FCR and ECR, respectively). We evaluated the amplitude of motor evoked potentials (MEPs) produced by a single TMS pulse, short interval intracortical inhibition and facilitation (SICI and ICF) and long interval intracortical inhibition (LICI). TMS pulses were applied 1 s after the start of vibration with subjects relaxed throughout. Vibration increased the amplitude of MEPs evoked in the vibrated muscle (162 ± 6 % of MEP with no vibration; mean ± s.e.m.), but suppressed MEPs in the two non-vibrated hand muscles (72 ± 9 %). Compared with no vibration (test response reduced to 51 ± 5 % of control), there was less SICI in the vibrated muscle (test response reduced to 92 ± 28 % of control) and more in the non-vibrated hand muscles (test response reduced to 27 ± 5 % of control). The opposite occurred for LICI: compared with the no vibration condition (test response reduced to 33 ± 6 % control), there was more LICI in the vibrated muscle (test response reduced to 17 ± 3 % control) than in the non-vibrated hand muscles (test response reduced to 80 ± 11 % control) even when the intensity of the test stimulus was adjusted to compensate for the changes in baseline MEP. There was no effect on ICF. Cutaneous stimulation of the index finger (80 Hz, 1.5 s duration, twice sensory threshold) had no consistent differential effect on any of the parameters. We conclude that vibratory input from muscle can differentially modulate excitability in motor cortical circuits.
A large number of studies have used transcranial magnetic stimulation (TMS) methods to examine the effect of afferent sensory input from the hand on the excitability of human motor cortex. Motor evoked potentials (MEPs) are affected by a preceding electrical stimulus to mixed nerve (Deuschl et al. 1991; Bertolasi et al. 1998; Tokimura et al. 2000) or cutaneous nerves (Maertens de Noordhout et al. 1992; Palmer & Ashby, 1992; Rossini et al. 1996; Ridding & Rothwell, 1999). In many cases, the effects appear to have a somatotopical organization in which the largest changes in MEPs are seen in muscles nearest the site of stimulation (Classen et al. 2000; Tamburin et al. 2001). Since the peripheral nerve stimuli have no effect (at the same latencies) on responses evoked by transcranial electrical stimulation or on F-waves (Chen et al. 1999a; Classen et al. 2000; Tamburin et al. 2001) they are generally presumed to be due to interactions at a cortical level.
A smaller number of studies have examined the effect of afferent input on short latency intracortical inhibition (SICI) as evaluated in a paired-pulse protocol (Kujirai et al. 1993). The main effect is a reduction of SICI following digital and mixed nerve stimulation (Ridding & Rothwell, 1999; Sailer et al. 2002) although the somatotopy of the effect has not been investigated.
In all these previous studies electrical stimulation has been used to activate afferent input in a rather non-physiological manner. The work in the present paper explores the possibility of using a more natural form of afferent stimulation to test whether the effects might be more robust than using single electrical stimuli. The method we employed was to give very low amplitude vibration to the muscle belly of individual hand muscles through a small probe. The vibration was insufficient to produce a tonic vibration reflex, or to give rise to any sensations of movement in fingers. In previous experiments we have shown that such vibration, applied to forearm muscles, can increase the amplitude of MEPs evoked in the vibrated muscle and decrease the level of SICI in the same muscle without producing any effects on cortical excitability in antagonist forearm muscles or on distant hand muscles (Rosenkranz et al. 2003).
Here we explored the pattern of effects on MEPs and SICI in three different intrinsic hand muscles after vibration of each muscle in turn. In addition, we also tested long interval intracortical inhibition (LICI) with a paired-pulse TMS protocol. This form of inhibition is thought to employ a GABAA circuit in the cortex that interacts with the GABAB circuit studied with SICI. Finally we compared the effect of vibration with that evoked by electrical cutaneous stimulation.
METHODS
Subjects
Fourteen healthy subjects (six female and eight male) aged 26 to 48 years were studied. All subjects gave informed consent to the study, which was approved by the Research Ethics Committee of the Institute of Neurology. All experiments conformed to the Declaration of Helsinki. Subjects were comfortably seated in an armchair with their right forearm positioned on a moulded armrest in a pronate position while forearm and hand muscles were relaxed.
Transcranial magnetic stimulation (TMS)
TMS was performed using two MAGSTIM 200 stimulators connected by a Y-cable to a figure-of-eight-shaped coil with an internal wing diameter of 7 cm (Magstim, Dyfed, UK). The coil was held with the handle pointing backwards and laterally approximately 45 deg to the interhemispheric line, to evoke anteriorly directed current in the brain, and was optimally positioned to obtain MEPs in the target muscle. Stimulation intensities are quoted in the text as a percentage of maximal stimulator output. Single and paired TMS pulses were applied as described in the study design (see below).
EMG recording
Surface electromyographic (EMG) recordings in a belly-to-tendon montage were made from the abductor pollicis brevis (APB), the first dorsal interosseus (FDI), the abductor digiti minimi (ADM), the flexor carpi radialis (FCR) and the extensor carpi radialis (ECR) muscles. The APB or FDI was chosen as the target muscle (see study design). The raw signal was amplified and filtered with a band-pass filter of 30 Hz to 1 kHz (Digitimer Ltd). Signals were digitized at 2 kHz (CED Power1401, Cambridge Electronic Design, Cambridge, UK) and stored on a laboratory computer for off-line analysis.
Muscle vibration
Trains of muscle vibration (MV; frequency 80 Hz) of 1.5 s duration with intertrial intervals of 3.5 s were applied to the muscle belly of the relaxed target muscle using an electromagnetic mechanical stimulator (Ling Dynamics System Ltd, UK) with a 0.7 cm diameter probe. The amplitude of the vibration was adjusted individually to be just below the threshold for perceiving an illusory movement (Gilhodes et al. 1986; Roll et al. 1989; Roll & Gilhodes, 1995; Grunewald et al. 1997), which was in all subjects within a range of 0. 2–0.5 mm. During vibration of the muscle we monitored the EMG for any muscle contraction indicating, besides possible voluntary activation, the occurrence of the tonic vibration reflex (TVR; Lance et al. 1966; Hagbarth & Eklund, 1968; Marsden et al. 1969). TMS stimuli were given 1 s after the start of MV.
Digital nerve stimulation
Ring electrodes around the proximal phalanx (cathode proximal) were used to stimulate the digital nerves of the right index finger. Individual perceptual thresholds were determined with single stimuli (width 200 μs). Then, as with the vibration stimulus, the digital nerve stimulation was applied as a train of stimuli, lasting for 1.5 s at a frequency of 80 Hz and an intensity of 200 % perceptual threshold. With these stimulation parameters, subjects were unable to perceive single stimuli and described a continuous non-painful tingling. Subjects were instructed to keep their hand relaxed during the stimulation. As in the vibration experiment, TMS stimuli were applied 1 s after the start of the cutaneous stimulation.
Study design
Experiment 1. Effect of muscle vibration on test MEPs, short latency intracortical inhibition (SICI) and intracortical facilitation (ICF)
Intracortical excitability was investigated in eight subjects (three female; age 26–41 years) using the paired-pulse protocol described by Kujirai et al. (1993) with a subthreshold conditioning magnetic stimulus preceding a suprathreshold test stimulus. Five different interstimulus intervals (ISI) were tested: ISIs of 2, 3 and 4 ms were measured to evaluate SICI, and ISIs of 10 and 15 ms for ICF. The experiment was performed under four different experimental conditions: rest, during vibration of the target muscle, and during vibration of one of the two other hand muscles in turn. The intensity of the conditioning stimulus was always set to 5 % of stimulator output below active motor threshold (AMT) as determined in the target muscle. The stimulus intensity (SI) of the test pulse was adjusted so as to produce an MEP of approximately 1 mV in the target muscle in the appropriate resting (SI 1 mV) and vibration (ADJ-SI 1 mV) conditions. The experiments were also repeated using a stimulus intensity of SI 1 mV in the vibration condition. For each experimental condition, six randomly intermixed conditions (the five different double-pulse conditions and the test stimulus alone) were presented 10 times each. The interval between each consecutive trial was 5 s.
Experiment 2. Effect of muscle vibration on long latency intracortical inhibition (LICI)
LICI was tested with a suprathreshold conditioning stimulus delivered 100 ms before the test stimulus, as described in previous studies (Fuhr et al. 1991; Nakamura et al. 1997; Chen et al. 1999b). The intensities of the conditioning and test stimuli were the same and were adjusted to produce an MEP of 0.5–1.5 mV peak-to-peak amplitude at rest. The same intensity was used to evaluate LICI during vibration. However, since vibration changed the amplitude of MEPs evoked by the stimuli, we also performed the same experiment with the stimulus intensity adjusted so that the MEP amplitude was the same as at rest.
For each experimental condition, LICI was investigated in a single block of trials consisting of the two randomly intermixed conditions (test stimulus alone or preceded by the conditioning stimulus) presented 10 times each. The time between two consecutive trials was 5 s. Eight subjects (two female: age 26–48 years) participated in this experiment. The right FDI was the target muscle for the TMS parameters.
Experiment 3. Effect of digital nerve stimulation on test MEPs, SICI and ICF
The effect of cutaneous stimulation on SICI and ICF was tested with the paired-pulse protocol as described above for Experiment 1. The two different conditions, at rest and during cutaneous stimulation, were tested in two different blocks. In addition, in order to compensate for the effect of cutaneous stimulation on the amplitude of the test MEP, each block was repeated using an adjusted SI which produced an MEP of 0.5–1.5 mV peak-to-peak amplitude during cutaneous stimulation (ADJ-SI 1 mV). Six subjects (four female; age 26–42 years) participated in this experiment. The right APB was the target muscle for the TMS parameters. In three subjects (one female; age 26–32 years) the experiment was performed with the right FDI as the target muscle.
Data analysis and statistics
The amplitudes of single pulse MEPs during vibration or index finger stimulation were expressed as percentages of the mean value obtained without sensory stimulation. For SICI and ICF, single trial peak-to-peak MEP amplitudes were measured and averaged for each ISI separately and their size expressed as a percentage of the mean test MEP. Statistical analysis was performed either on the individual ISIs or after grouping them to give a single value for SICI (ISIs of 2, 3 and 4 ms) and ICF (ISIs of 10 and 15 ms).
For the single pulse MEP data of Experiment 1, a multivariate ANOVA was performed with the factors ‘site of MV’, and ‘handmuscle’. Furthermore, within each muscle (including forearm muscles) data obtained during vibration was compared to those obtained without by means of paired t tests.
For the SICI/ICF data of Experiment 1, a multivariate ANOVA was performed with the factors ‘site of MV’, ‘test pulse intensity’, and ISI. Post-hoc Student's t tests were used with the Bonferroni correction for multiple comparisons. Since the factor ‘test pulse intensity’ had no significant influence, data obtained with SI 1 mV and ADJ-SI 1 mV were pooled for further analysis. An ANOVA was then performed with the factors ‘site of MV’ and the data obtained at different ISIs pooled for SICI (ISIs of 2, 3 and 4 ms) and ICF (ISIs of 10 and 15 ms). Effects on SICI and ICF were then tested separately by univariate ANOVA. Data obtained in hand and forearm muscles were tested separately.
For Experiment 2, LICI was expressed as the ratio of test/conditioned MEP size within a trial. Multivariate ANOVA was then performed with the factors ‘site of MV’, ‘handmuscle’ and ‘test pulse intensity’. Within the muscles, LICI without and during vibration were compared by use of two-tailed paired t tests. Statistics were calculated separately for data obtained in the forearm muscles.
For Experiment 3, ANOVAs with the factor ‘muscle’ and ‘digital nerve stimulation’ were calculated on single MEPs and SICI/ICF data of hand and forearm muscles separately. Further analysis was performed with ANOVA on SICI and ICF data separately.
RESULTS
The description of the results, as well as the statistical analysis and illustrations, will focus on the data obtained in the hand muscles, since they were the ones that received vibration in these experiments. However, where available we will also give a descriptive account of changes in forearm extensor and flexor muscles.
The amplitude of muscle vibration was very small. During vibration there was no evidence of a tonic vibration reflex in the EMG of any of the subjects. In addition, none of them reported any perception of illusory movements during vibration.
Experiment 1: test MEPs and SICI/ICF during muscle vibration
In eight subjects (three females; age 26–41 years) SICI and ICF during vibration was examined with the right FDI as the target muscle for the TMS parameters.
MEP amplitudes during muscle vibration
The coil was held in a constant position and MEPs were evoked simultaneously in all three relaxed hand muscles. The intensity was adjusted in baseline trials to evoke an MEP in the FDI of approximately 1 mV peak-to-peak amplitude (SI 1 mV). The resting MEP amplitudes were (means ± s.e.m.): FDI, 1.08 ± 0.09 mV; APB, 0.98 ± 0.14 mV; ADM 0.59 ± 0.16 mV. Figure 1 shows the effect of vibration of each muscle on the amplitude of the MEPs. An ANOVA with ‘handmuscle’ and ‘site of MV’ of vibration as the main factors revealed a significant ‘handmuscle’בsite of MV’ interaction (ANOVA; F = 17.6; P < 0.001), indicating that the site of vibration had a significantly different effect on MEPs in each muscle. Vibration increased the amplitude of MEPs evoked in the vibrated muscle compared to that evoked at rest. The opposite occurred in non-vibrated muscles: the MEP was reduced. Vibration of these hand muscles had no effect on the amplitude of MEPs evoked in the ECR or FCR muscles (not illustrated). In FDI we also confirmed that vibration additionally decreased the resting motor threshold in the vibrated muscle (from 42.8 ± 7 % to 40.4 ± 7 %).
Figure 1. MEPs in response to single TMS stimuli (rest SI 1 mV) in all vibration conditions.
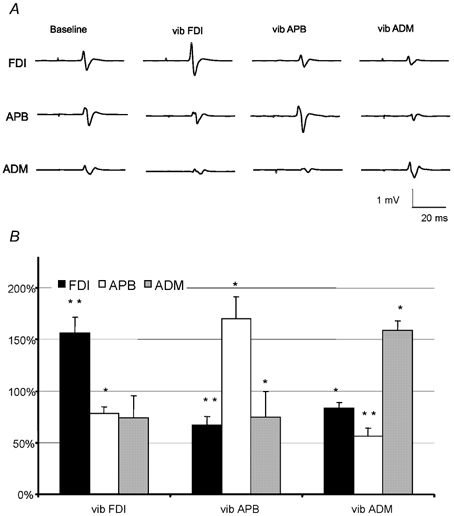
A, average MEP recordings showing the effect of vibration in three hand muscles from one representative subject. MEPs from all hand muscles are shown at rest (baseline) and during vibration of each muscle in turn. MEPs in a muscle were facilitated when the muscle itself was vibrated, but suppressed during vibration of a different hand muscle. B, mean MEP amplitudes (± s.e.m.) obtained with SI 1 mV during vibration of the FDI (vib FDI), APB (vib APB) or ADM (vib ADM) expressed as percentage of MEP size at rest. The MEPs increased in the vibrated muscle, whereas they decreased in the non-vibrated hand muscles. Asterisks indicate statistically significant differences from baseline without vibration (paired t test; *P < 0.05; **P < 0.01).
SICI/ICF in FDI during muscle vibration
The intensity of the conditioning stimulus was 95 % of the active motor threshold (mean across subjects: 36 ± 7 % stimulator output), which was significantly lower than the threshold obtained in the resting muscle during vibration (t test: P < 0.001) and therefore can be considered to be subthreshold in all experimental conditions tested. The intensity of the test stimulus was initially adjusted so that it evoked an MEP of 1 mV peak-to-peak amplitude in FDI at rest (SI 1 mV). In one block of trials, this intensity was used in all vibration conditions. However, since vibration changed the amplitude of the MEP evoked by the test shock, a second block of trials was performed in which the intensity of the test stimulus was adjusted so that it evoked a 1 mV MEP (ADJ-SI 1 mV) during vibration. The stimulus intensities and test MEP amplitudes during vibration are shown in Tables 1 and 2.
Table 1.
Stimulus intensities
| Target muscle (number of subjects) | SI 1 mV | ADJ-SI 1 mV (vibration of FDI) | ADJ-SI 1mv (vibration of APB) | ADJ-SI 1 mV (vibration of ADM) |
|---|---|---|---|---|
| FDI (n = 8) | 56.8 ± 4 | 52.5 ± 4 | 56.3 ± 4 | 56.4 ± 4 |
| APB (n = 3) | 53.7 ± 5 | 57.0 ± 5 | 52.0 ± 7 | 57.3 ± 5 |
Values are given as % stimulator output ± s.e.m.
Table 2.
MEP amplitudes
| Rest | Vibration of FDI | Vibration of APB | Vibration of ADM | ||||
|---|---|---|---|---|---|---|---|
| Target muscle | SI 1 mV | SI 1 mV | ADJ-SI 1 mV | SI 1 mV | ADJ-SI 1 mV | SI 1 mV | ADJ-SI 1 mV |
| FDI | 1.08 ± 0.09 | 1.67 ± 0.19 | 1.00 ± 0.08 | 0.74 ± 0.13 | 0.98 ± 0.11 | 0.90 ± 0.10 | 1.04 ± 0.10 |
| APB | 0.96 ± 0.10 | 0.72 ± 0.11 | 1.01 ± 0.18 | 1.19 ± 0.21 | 0.82 ± 0.08 | 0.55 ± 0.23 | 0.98 ± 0.15 |
Values are given as mV ± s.e.m.
In Fig. 2A the amplitude of the MEP in millivolts over the time course of SICI/ICF is plotted for trials in which we used a constant intensity of test stimulus (SI 1 mV). The inhibition compared to control is readily visible for ISIs of 2, 3 and 4 ms, and facilitation is evident at ISIs of 10 and 15 ms. Vibration of the FDI increased the amplitude of both control and conditioned MEPs whereas vibration of the other muscles decreased the amplitudes of MEPs. Figure 2B shows data from trials in which the intensity of the test stimulus was adjusted (ADJ-SI 1 mV) so that the amplitude of the test MEP was about 1 mV peak-to-peak with vibration. Again, SICI at ISIs of 2, 3 and 4 ms appears to be reduced by vibration of the FDI and increased by vibration of the APB or ADM. Figure 2C and D explores these effects in more detail by replotting the data so that SICI and ICF are expressed as percentages of the test response. The graphs are very similar whether the test intensity was constant (SI 1 mV; Fig. 2C) or adjusted (ADJ-SI 1 mV; Fig. 2D). SICI (ISIs 2 ms, 3 ms, 4 ms) appears to be decreased by vibration of the FDI whereas it is increased by vibration of the ADM or APB.
Figure 2. Short latency intracortical inhibition (SICI) and facilitation (ICF) in the FDI with and without vibration of FDI, APB or ADM muscles.
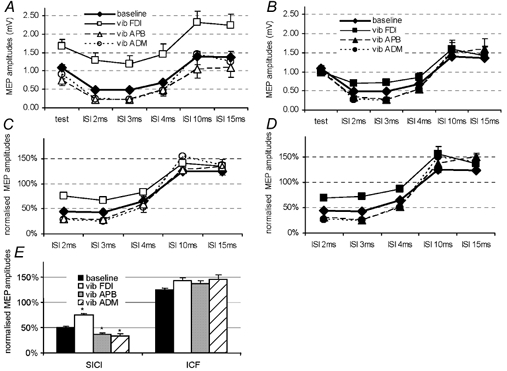
A and B show the raw data of MEP amplitude obtained with (A) constant (SI 1 mV; open symbols) and (B) adjusted (ADJ- SI 1 mV; filled symbols) test pulse intensity. The different symbols indicate data collected without vibration of any muscle (♦), with vibration of FDI (▪, ▪), with vibration of APB (▵, ▴) and with vibration of ADM (○, •). On the x-axis, ‘test’ indicates the size of response to test stimulus alone, ISI 2 ms, 3 ms, 4 ms, etc. indicates the size of responses preceded by conditioning pulses at the intervals indicated. C and D show the same data expressed as percentages of the test values. SICI (ISI 2, 3 and 4 ms) decreases with vibration of the FDI (target muscle), but increases with vibration of APB and ADM. The effect on ICF (ISI 10 and 15 ms) is not clear. E, the pooled data from C and D, with data points at ISIs of 2, 3 and 4 ms averaged to yield a mean value for SICI, and data points from ISIs of 10 and 15 ms averaged to yield a mean value for ICF. Data are means ± s.e.m. Asterisks indicate statistically significant differences from baseline without vibration (paired t test; *P < 0.001).
An ANOVA of the data in Fig. 2C and D with ISI, ‘site of MV’ of vibration and ‘test pulse intensity’ as main factors showed no significant main effect or interaction term involving ‘test pulse intensity’ (ANOVA; F = 0.272; P = 0.993) so we combined data obtained with SI 1 mV and ADJ-SI 1 mV for the final part of the analysis. Figure 2E shows the overall effect of vibration of different muscles on SICI (data averaged over ISIs of 2, 3 and 4 ms) and ICF (ISIs of 10 and 15 ms). These data were analysed by a two way ANOVA with SICI/ICF and ‘site of MV’ of vibration as main factors. A significant SICI/ICF בsite of MV’ of vibration interaction (ANOVA; F = 12.4; P < 0.001), indicated that the effect of ‘site of MV’ of vibration was different on SICI and ICF. Further one-way ANOVAs showed that there was no significant effect of vibration on ICF (ANOVA; F = 1.7; P = 0.19), but that there was a clear effect on SICI (ANOVA; F = 77.4; P < 0.001). t tests showed a significant decrease of SICI in FDI during vibration of FDI, and an increase of SICI with vibration of APB or ADM.
SICI/ICF in APB, ADM and the forearm muscles during muscle vibration
Motor thresholds for the ADM and APB are very similar to that of the FDI. Thus, at the same time as we were measuring SICI/ICF in the FDI in the experiments above, we were able to record SICI/ICF in the ADM, APB and the forearm muscles. Although the coil position may not have been optimal for evoking MEPs in these muscles, it was constant during all conditions.
Figure 3 summarizes the effects of vibration for the APB and ADM in the same way as in Fig. 2E. Two-way ANOVAs confirmed that in both muscles there was a significant ‘site of MV’× SICI/ICF interaction (ANOVA; F = 21.1; P < 0.001), and follow-up analyses showed that, as with the FDI, vibration had an effect on SICI (ANOVA; F = 3.1; P < 0.001) but no influence on ICF (ANOVA; F = 0.2; P = 0.97). t tests revealed a significant decrease of SICI in the vibrated muscle, as well an increase of SICI during vibration of other muscles. Vibration of hand muscles had no effect on SICI/ICF in the ECR or FCR (not illustrated).
Figure 3. SICI and ICF in APB and ADM with and without vibration of different hand muscles.
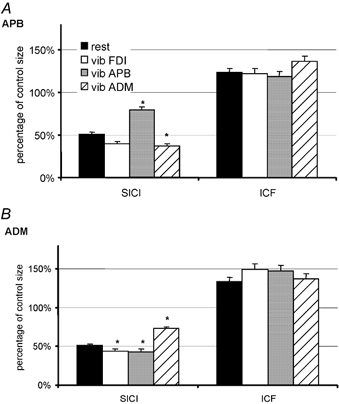
The graphs are equivalent to those in Fig. 2E and show data collected simultaneously from APB (top) and ADM (bottom). The bars plot SICI and ICF with no vibration and with vibration of FDI, APB or ADM. As in Fig. 2E, data obtained with test intensities of SI 1 mV and ADJ-SI 1 mV have been pooled since they were not significantly different. Both hand muscles show the same pattern of changes as seen in the FDI: SICI is reduced by vibration of the muscle itself, whereas it increases during vibration of another hand muscle. The effect on ICF is not clear. Data are means ± s.e.m. Asterisks indicate statistically significant differences from baseline without vibration (paired t test; *P < 0.005).
The experiment was also performed in three subjects (one female; age 26–48 years) after adjusting the intensity of the test stimulus to be appropriate for APB, evoking a constant 1 mV peak-to-peak MEP in all vibration conditions. The data of this experiment showed the same pattern of changes in SICI and ICF as described above.
Experiment 2: effects of vibration on LICI
Eight subjects (two female; age 26–48 years) participated in this experiment. As in the experiments above, test stimulus intensities were calibrated for the FDI muscle. Data were also recorded simultaneously from the APB and ADM.
The mean stimulus intensity needed to evoke 1 mV MEPs in the FDI at rest (SI 1 mV) was 54 ± 12 %. In one block of trials we used this intensity throughout all vibration conditions. In a second block of trials we adjusted the intensity of stimulation so that it evoked MEPs of 1 mV during vibration (ADJ-SI 1 mV). This meant that during vibration of the FDI, the intensity was reduced to 49 ± 10 % whereas it was increased to 55 ± 12 % with vibration of the APB and to 56 ± 12 % during ADM vibration.
Single pulse MEPs after 900 and 1000 ms of vibration
The first stimulus of the pair used to test LICI occurred 900 ms after the onset of digital nerve stimulation and the second pulse 100 ms later. Mean MEP amplitudes obtained with a single TMS pulse 900 or 1000 ms after onset of vibration were not significantly different from each other in any of the muscles. Therefore, LICI was expressed as the ratio of test/conditioned MEP size within a trial.
LICI
Figure 4A shows the percentage LICI in the three hand muscles after vibration at different sites for data obtained with the two different SIs. As with SICI/ICF above, stimulus intensity (i.e. SI 1 mV or ADJ-SI 1 mV) had no effect on the calculated percentage LICI (ANOVA (‘handmuscle’בsite of MV’× SI); F = 0.89; P = 0.56), so that we pooled the two sets of data (Fig. 4B). An ANOVA with ‘handmuscle’ and ‘site of MV’ as main factors revealed a significant ‘handmuscle’בsite of MV’ interaction (ANOVA; F = 13.18; P < 0.001) indicating that the site of vibration had a different effect on LICI in each muscle. t tests showed that vibration of a muscle increased LICI significantly in that muscle, whereas vibration of other muscles reduced the amount of LICI (statistics as indicated in Fig. 4).
Figure 4. LICI in the FDI, APB and ADM with and without hand muscle vibration.
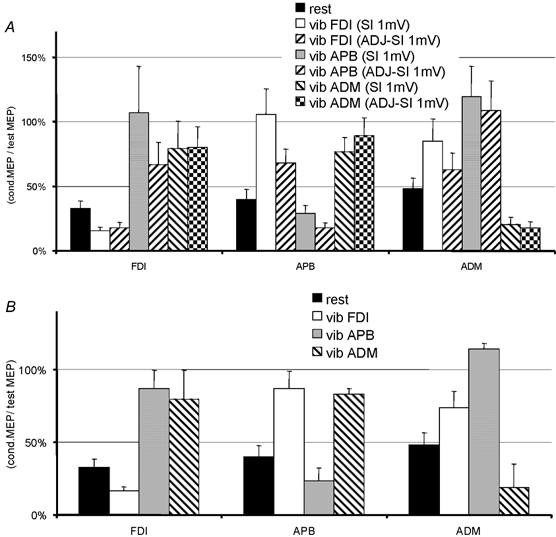
LICI is expressed as the mean (± s.e.m.) percentage of conditioned MEP amplitude/test MEP amplitude for the conditions with and without vibration. Data obtained with the two different test intensities are shown in A; since the results were not significantly different, the data were pooled as shown in B. The effect of vibration was similar in all three hand muscles: LICI increased during vibration of the muscle itself and decreased during vibration of remote hand muscles. All changes during vibration as shown in B were significantly different from the baseline obtained without vibration (paired t test; P < 0.05).
There were no effects of vibration on LICI in forearm muscles apart from a significant decrease compared to resting values (paired t test; P < 0.05) in the ECR during vibration of the FDI and APB.
Experiment 3: effect of digital nerve stimulation in the index finger on test MEPs, SICI and ICF
Six subjects (four female; age 26–42 years) participated in this experiment. The right APB was the target muscle for the TMS parameters.
One block of trials was conducted with a test stimulus intensity that evoked a 1 mV MEP in the relaxed APB (SI 1 mV). A second block was conducted in which we adjusted the test intensity to compensate for MEP changes induced by cutaneous stimulation (ADJ-SI 1 mV). As in the experiments above, this adjustment made no difference to the calculated SICI/ICF, so we combined the data from both blocks.
Figure 5A shows the effect of cutaneous stimulation on MEP amplitudes evoked by a single TMS pulse (SI 1 mV). An ANOVA revealed no significant differences between the muscles (ANOVA; F = 0.6; P = 0.60). Figure 5B illustrates the effect of digital nerve stimulation on SICI and ICF as measured in the hand muscles with the two different SIs (SI 1 mV; ADJ-SI 1 mV), Fig 5C and D summarize the results showing the data pooled for both SIs. An ANOVA with ‘handmuscle’, SICI/ICF and ‘digital nerve stimulation’ as main factors showed a significant three-way interaction (ANOVA; F = 3.1; P < 0.005). Further analysis for SICI and ICF data separately with ‘handmuscle’ and ‘digital nerve stimulation’ as main factors revealed a significant interaction term for the ICF data (ANOVA; F = 3.4; P < 0.003), showing that digital nerve stimulation had a different effect on the three hand muscles. In contrast there was no significant interaction term for the SICI data, indicating that digital nerve stimulation had the same effect on all hand muscles (ANOVA; F = 1.4; P = 0.17). Follow-up t tests indicated that digital nerve stimulation significantly decreased SICI in all hand muscles (for statistics see Fig. 5 legend). In contrast, digital nerve stimulation only increased ICF in the APB, but not in the other hand muscles. Cutaneous stimulation had no effect on SICI/ICF in forearm muscles (not illustrated).
Figure 5. Single MEPs, SICI and ICF obtained with digital nerve stimulation.
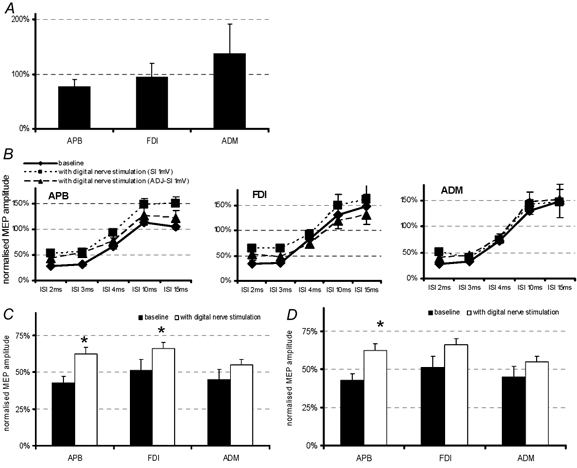
A, mean (± s.e.m.) MEPs in response to single TMS pulses during stimulation of the digital nerves of the index finger (SI 1 mV) expressed as percentages of baseline values without stimulation. Index finger stimulation had no significant effect on the size of any MEP, although there was a tendency for MEPs to be smaller in the APB and larger in the ADM. B, normalized MEP amplitudes obtained with both test pulse intensities. The different symbols indicate data collected without digital nerve stimulation (♦) and with digital nerve stimulation and test pulse intensities of SI 1 mV (▪) and ADJ-SI 1 mV (▴). C, SICI (mean of ISI 2, 3 and 4 ms as percentage of test MEP size ± s.e.m.) at rest and during index finger stimulation. Index finger stimulation reduced SICI in all three muscles to the same extent. D, ICF (mean of ISI 10 and 15 ms as percentage of test MEP size ± s.e.m.) at rest and with index finger stimulation. Stimulation increased ICF in APB, but had no effect in other muscles. C and D show pooled data obtained with test stimulus intensities of SI 1 mV and ADJ-SI 1 mV since the individual results from each intensity were not different from each other. Asterisks indicate values significantly different from the baseline without index finger stimulation (paired t test; *P < 0.01).
As in Experiment 1, we repeated this experiment in three subjects (one female; age 26–32 years) with the difference that the TMS parameters were adjusted to MEP size in the FDI rather than in the APB. The results of test MEPs, SICI and ICF were similar to those described above.
DISCUSSION
The present results confirm previous studies showing that low amplitude vibration of a muscle can increase the amplitude of MEPs evoked in that muscle whilst at the same time decreasing the effectiveness of SICI. The novel finding in the present results is that these effects have a differential distribution in the vibrated versus non-vibrated hand muscles. Thus, vibration of one muscle evoked opposite effects on MEP amplitude and SICI in the non-vibrated muscles. In addition we have shown that vibration has a differential pattern of effects on LICI, which is decreased in non-vibrated muscles and increased in the vibrated muscle. Finally the data from digital nerve stimulation indicate that electrical stimulation of cutaneous inputs produces a less complex pattern of effects, suggesting that the differential pattern of effects produced by muscle vibration may be due in part to activation of muscle spindle input.
Effects of vibratory inputs on the test MEP
Many previous reports have shown that vibration of a muscle increases the MEP evoked in that muscle in subjects at rest (Claus et al. 1988a Claus et al. 1988b; Kossev et al. 1999; Rosenkranz et al. 2000, 2003), and this was confirmed in the present results. Much of this increase is thought to be due to increased excitability of spinal mechanisms (Claus et al. 1988a Claus et al. 1988b). However, there is some evidence from experiments comparing the effect of vibration on responses to TMS and transcranial electrical stimulation that vibration may also influence the excitability of cortical mechanisms (Kossev et al. 1999). We have also reported that vibration of the forearm flexor muscles can decrease the amplitude of single MEPs recorded in the (non-vibrated) antagonist muscles (Rosenkranz et al. 2000, 2003). This is complemented by the new finding in the present results that vibration produces opposite effects on vibrated and non-vibrated intrinsic muscles of the hand. Although we cannot exclude spinal contributions to this effect, the data below on LICI and SICI are compatible with an additional action on the motor cortex.
Effects of vibratory input on SICI and ICF
We tested SICI/ ICF with the paired-pulse design first described by Kujirai et al. (1993), in which a subthreshold conditioning stimulus interacts at short latency with a suprathreshold test stimulus. There is good evidence that this interaction relies on activation of GABAA circuits in the motor cortex (Hanajima et al. 1998; Ilic et al. 2002).
The present data confirm that vibration decreases SICI in the vibrated muscle (Rosenkranz et al. 2003) and that this persists even when the intensity of the test stimulus is adjusted to compensate for vibratory effects on baseline MEP size. One possible explanation for the change in SICI is that vibration changes the pattern of recruitment of corticospinal volleys in response to the test pulse (I waves: indirect waves produced by presynaptical activation of the pyramidal tract neurones). SICI does not affect all descending volleys equally: the I3 and later volleys are inhibited much more strongly than the I2 and (particularly) the I1 volley (Nakamura et al. 1997; Hanajima et al. 1998; DiLazzaro et al. 1998). Thus, if vibration favoured recruitment of I1 and I2 volleys then SICI might be less effective in the target muscle. It is difficult to exclude this possibility entirely. Nevertheless, Rosenkranz et al. (2003) showed that if I3 volleys were preferentially recruited by rotating the test coil to produce an anterio-posterior-induced current across the central sulcus (Hanajima et al. 1998), SICI was still reduced when the target muscle was vibrated. We therefore think it more likely that vibration had a direct effect on the excitability of the circuits responsible for SICI. It should be noted that vibration may also change the order of recruitment of spinal motoneurones in the MEP. However, since this should affect both conditioning and test MEPs equally, there should be no overall effect on the calculated percentages of SICI and ICF.
The new finding in the present data is that vibration also had a strong effect on SICI in non-vibrated muscles. In the three hand muscles tested, inhibition increased during vibration of one of the other muscles whereas it decreased during vibration of the same muscle. SICI and ICF in forearm muscles were unaffected. Several studies have emphasized that SICI may be modulated to focus cortical motor command during voluntary contraction (Floeter & Rothwell, 1999). For example, SICI decreases in a muscle prior to (Reynolds & Ashby, 1999) and during contraction (Ridding et al. 1995). SICI has also been shown to increase in muscles that were held relaxed during a period of motor training in nearby muscles (Liepert et al. 1998). However, to our knowledge, our findings with vibration are the first demonstration that SICI can be increased by afferent input.
We suggest that separate populations of inhibitory neurones target cortical output zones projecting to different intrinsic muscles of the hand. Vibratory input from one hand muscle has a differential effect on these populations, increasing the excitability of those projecting to non-vibrated muscles and suppressing excitability of those projecting to the vibrated muscle. The data may also be relevant to voluntary contraction. During contraction, muscle spindle activity increases in the contracting muscle. It is interesting to speculate that this input could evoke a differential pattern of activation of cortical inhibitory circuits that would help to focus the ongoing movement onto the appropriate muscle.
There was no clear effect of vibratory input on ICF. This phenomenon seems to be mediated through a different set of interneurones to SICI (Ziemann et al. 1996). Presumably these are less influenced by vibration than those involved in SICI.
Effects of vibration on LICI
LICI, like SICI, is thought to be due to activity in cortical GABAergic circuits. Indeed there is good evidence to support the hypotheses that: (1) LICI is of cortical origin (Fuhr et al. 1991; Inghilleri et al. 1993; Nakamura et al. 1997; Chen et al. 1999b); (2) it is mediated by a different set of neurones than SICI (Sanger et al. 2001); (3) LICI involves circuits that produce long-lasting inhibition via GABAB receptors (Roick et al. 1993; Werhahn et al. 1999), whereas SICI is produced by activation of short-lasting inhibitory GABAA receptors (Hanajima et al. 1998); and (4) LICI may suppress excitability in neurones responsible for SICI, perhaps via activation of presynaptic GABAB receptors (Sanger et al. 2001).
Vibration produced a differential effect on LICI, with an increase in the vibrated muscle and a decrease in non-vibrated muscles. This was not due to an effect of vibration on the amplitude of the conditioning and test response, since the result was the same with adjusted stimulus intensities. Nevertheless, since the conditioning stimulus in the LICI protocol is suprathreshold, we cannot rule out an effect of vibration on spinal circuits. Thus some of the change in LICI could be due to vibration increasing or decreasing activity in a spinal circuit activated by the conditioning stimulus, and this could influence the amplitude of the response to the test shock given 100 ms later. However, it seems more likely, given the importance of cortical mechanisms in LICI at this interval, that the effect is cortical. Thus, like SICI, we envisage separate populations of LICI-linked inhibitory neurones projecting to cortical zones innervating different hand muscles. These then receive a differential distribution of afferent input from the vibrated hand muscle.
Why, though, are the effects of vibration on LICI opposite to those on SICI ? We speculate that this may be linked to the recent demonstration by Sanger et al. (2001) that LICI can suppress SICI. This idea is sketched in Fig. 6. Separate populations of neurones involved in SICI and LICI are seen as projecting to different cortical output zones, together with other facilitatory inputs. In our data we are suggesting that (1) afferent input can help to change patterns of excitability in SICI and LICI neurones and (2) the changes in LICI may also contribute to the pattern of excitability in the SICI neurones. Thus increasing activation of LICI neurones innervating the target output zone will decrease SICI in that zone, whereas the opposite will occur in the interaction between SICI and LICI in the non-target zone.
Figure 6. Interpretation of the main results of the present experiments.
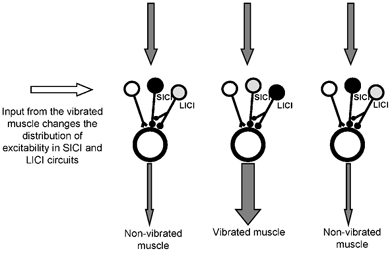
The three vertical modules represent motor cortex output zones that project to the three hand muscles studied. Each module consists of a notional output cell (the large open circle) with three different inputs: an excitatory input (open neurone) and two inhibitory inputs (grey and black neurones). The latter two represent the circuits involved in SICI and LICI. Vibratory input causes a change in the pattern of excitability in the circuits responsible for SICI and LICI. Neurones filled with black have increased excitability compared to rest whereas those filled with grey have decreased excitability compared to rest. Thus vibration increases LICI to the module that projects to the vibrated muscle and decreases SICI. It has the opposite effect on the two non-vibrated muscles. The net result of this on cortical processing is illustrated by the grey vertical arrows. The top three arrows represent equal input to the three cortical output zones. The bottom arrows show that the pattern of SICI changes would tend to increase the contrast in the final output between vibrated and non-vibrated muscle. This could contribute, for example, to explaining why MEPs are larger compared with rest in the vibrated muscle and smaller in the non-vibrated muscle.
Although this organization accounts for the present results with vibration, it is not so clear how relevant this result would be in functional terms during a voluntary contraction. The opposite effect of vibration on the LICI pathway would seem to cancel out any possible focusing effect of SICI on the target muscle. However, it may be that SICI and LICI pathways target separate populations of neurones in the output zones to each muscle. Sanger et al. (2001) suggested that SICI is more effective in inhibiting corticospinal neurones activated at high TMS intensities, whereas LICI is more effective at suppressing MEPs evoked by lower intensity TMS pulses. Alternatively, it may be that the different time courses of the GABAergic mechanisms underlying SICI and LICI are important (Davies et al. 1990; Kang et al. 1994; Deisz et al. 1999; Sanger et al. 2001). The short interval (GABAA) inhibition of SICI could be important in focusing inputs at the start of a movement, whereas the longer latency (GABAB) inhibition of the LICI pathway might be more important in later phases.
Effect of digital nerve stimulation on MEPs and SICI/ICF
Stimulation of the index finger had no significant effect on MEPs, although it tended to reduce MEPs in the two adjacent muscles, APB and FDI, and increase them in the ADM and forearm muscles. Although stimulation was given as a long train (1.5 s), our results are consistent with studies using single electrical stimuli that have described a topographic distribution of the inhibitory effect of digital nerve stimulation on MEPs in hand muscles, which was more pronounced in muscles near the stimulated finger (Classen et al. 2000; Tamburin et al. 2001).
Digital nerve stimulation of the index finger also decreased SICI in two of the three hand muscles but had no effect on ICF apart from a slight increase in the APB. This is similar to the effect reported by Ridding & Rothwell (1999) who used a single cutaneous stimulus to reduce the amount of SICI tested 40 ms later. However Kobayashi et al. (2003) (who used digital nerve stimulation) and Sailer et al. (2002) (who used median nerve stimulation) reported no effect on SICI and an increase in ICF if the interval was 200 ms. The conclusion must be that the effects we describe here with long trains of stimuli cannot be compared directly with previous work performed with single pulse conditioning.
These effects of digital nerve stimulation contrast with the differential pattern of effects evoked by muscle vibration suggesting that the effect on SICI depends on the modality of sensory stimulation. Vibration appears to be much more specific than cutaneous stimulation, having opposite rather than graded effects on the vibrated and non-vibrated muscle. Why this should be the case is unclear. It may be that vibration is a more natural input than electrical stimulation of nerves, since it activates muscle spindle receptors whereas digital nerve stimulation activates afferent fibres directly. Alternatively, it may be that the muscle spindle input activated by vibration has a more specific action on cortical circuits than cutaneous input activated by digital nerve stimulation.
The latter explanation is consistent with the different distribution of cutaneous and proprioceptive afferents to areas of the somatosensory cortex. The input from low threshold mechanoreceptors and cutaneous receptors primarily reach areas 3b and 1 (Kaas & Pons, 1988), whereas muscle vibration produces Ia afferent input that reaches both area 3a (Heath et al. 1976; Hore et al. 1976) and area 4 of the motor cortex directly (Jones & Porter, 1980). Thus muscle spindle inputs could potentially have a stronger and more selective influence on the motor cortex than those from cutaneous inputs.
In conclusion, we have shown that vibratory stimulation can produce differential changes in the excitability of populations of cortical inhibitory neurones that project to different output zones of the motor cortex. We speculate that this may be because the input from muscle spindles is important in shaping the excitability of intracortical GABAergic circuits. Whatever the mechanism, it appears that small-amplitude vibration may be a more sensitive test of the input/output relations of the cortex than electrical nerve stimulation.
Acknowledgments
We would like to thank Mr Peter Asselmann for his invaluable assistance in maintaing and building the equipment used in these experiments. K.R. was supported by a fellowship grant from ‘Deutsche Forschungsgemeinschaft’. The work was funded by the Medical Research Council.
REFERENCES
- Bertolasi L, Priori A, Tinazzi M, Bertasi V, Rothwell JC. Inhibitory action of forearm flexor muscle afferents on corticospinal outputs to antagonist muscles in humans. J Physiol. 1998;511:947–956. doi: 10.1111/j.1469-7793.1998.947bg.x. [DOI] [PMC free article] [PubMed] [Google Scholar]
- Chen R, Corwell B, Hallett M. Modulation of motor cortex excitability by median nerve and digit stimulation. Exp Brain Res. 1999a;129:77–86. doi: 10.1007/s002210050938. [DOI] [PubMed] [Google Scholar]
- Chen R, Lozano AM, Ashby P. Mechanisms of the silent period following transcranial magnetic stimulation. Evidence from epidural recordings. Exp Brain Res. 1999b;128:539–542. doi: 10.1007/s002210050878. [DOI] [PubMed] [Google Scholar]
- Classen J, Steinfelder B, Liepert J, Stefan K, Celnik P, Cohen LG, Hess A, Kunesch E, Chen R, Benecke R, Hallett M. Cutaneomotor integration in humans is somatotopically organized at various levels of the nervous system and is task dependent. Exp Brain Res. 2000;130:48–59. doi: 10.1007/s002210050005. [DOI] [PubMed] [Google Scholar]
- Claus D, Mills KR, Murray NMF. The influence of vibration on the excitability of alpha motoneurones. Electroencephalogr Clin Neurophysiol. 1988a;69:431–436. doi: 10.1016/0013-4694(88)90065-x. [DOI] [PubMed] [Google Scholar]
- Claus D, Mills KR, Murray NMF. Facilitation of muscle responses to magnetic brain stimulation by mechanical stimuli in man. Exp Brain Res. 1988b;71:273–278. doi: 10.1007/BF00247487. [DOI] [PubMed] [Google Scholar]
- Davies CH, Davies SN, Collingridge GL. Paired-pulse depression of monosynaptic GABA-mediated inhibitory postsynaptic responses in rat hippocampus. J Physiol. 1990;424:513–531. doi: 10.1113/jphysiol.1990.sp018080. [DOI] [PMC free article] [PubMed] [Google Scholar]
- Deisz RA. GABA (B) receptor-mediated effects in human and rat neocortical neurons in vitro. Neuropharmacology. 1999;38:1755–1766. doi: 10.1016/s0028-3908(99)00136-7. [DOI] [PubMed] [Google Scholar]
- Deuschl G, Michels R, Berardelli A, Schenck E, Inghilleri M, Lucking CH. Effects of electric and magnetic transcranial stimulation on long latency reflexes. Exp Brain Res. 1991;83:403–410. doi: 10.1007/BF00231165. [DOI] [PubMed] [Google Scholar]
- DiLazzaro V, Restuccia D, Oliviero A, Profice P, Ferrara L, Insola A, Mazzone P, Tonali P, Rothwell JC. Magnetic transcranial stimulation at intensites below active motor threshold activates intracortical inhibitory circuits. Exp Brain Res. 1998;119:265–268. doi: 10.1007/s002210050341. [DOI] [PubMed] [Google Scholar]
- Floeter MK, Rothwell JC. Releasing the brake before pressing the gas pedal. Neurology. 1999;53:664–665. doi: 10.1212/wnl.53.4.664. [DOI] [PubMed] [Google Scholar]
- Fuhr P, Agostino R, Hallett M. Spinal motor neuron excitability during the silent period after cortical stimulation. Electroencephalogr Clin Neurophysiol. 1991;81:257–262. doi: 10.1016/0168-5597(91)90011-l. [DOI] [PubMed] [Google Scholar]
- Gilhodes JC, Roll JP, Tardy-Gervet MF. Perceptual and motor effects of agonist-antagonist muscle vibration in man. Exp Brain Res. 1986;61:395–402. doi: 10.1007/BF00239528. [DOI] [PubMed] [Google Scholar]
- Grunewald RA, Yoneda Y, Shipman JM, Sagar HJ. Idiopathic focal dystonia: a disorder of muscle spindle afferent processing. Brain. 1997;120:2179–2185. doi: 10.1093/brain/120.12.2179. [DOI] [PubMed] [Google Scholar]
- Hanajima R, Ugawa Y, Terao Y, Sakai K, Furubyashi T, Machii K, Kanazawa I. Paired-pulse magnetic stimulation of the human motor cortex: differences among I waves. J Physiol. 1998;509:607–618. doi: 10.1111/j.1469-7793.1998.607bn.x. [DOI] [PMC free article] [PubMed] [Google Scholar]
- Heath CJ, Hore J, Philips CG. Inputs from low threshold muscle and cutaneous afferents of hand and forearm to areas 3a and 3b of baboon's cerebral cortex. J Physiol. 1976;257:199–227. doi: 10.1113/jphysiol.1976.sp011364. [DOI] [PMC free article] [PubMed] [Google Scholar]
- Hore J, Preston JB, Cheney PD. Responses of cortical neurons (areas 3a and 4) to ramp stretch of hindlimb muscles in the baboon. J Neurophysiol. 1976;39:484–500. doi: 10.1152/jn.1976.39.3.484. [DOI] [PubMed] [Google Scholar]
- Ilic TV, Meintzschel F, Cleff U, Ruge D, Kessler KR, Ziemann U. Short-interval paired-pulse inhibition and facilitation of human motor cortex: the dimension of stimulus intensity. J Physiol. 2002;545:153–167. doi: 10.1113/jphysiol.2002.030122. [DOI] [PMC free article] [PubMed] [Google Scholar]
- Inghilleri M, Berardelli A, Cruccu G, Manfredi M. Silent period evoked by transcranial stimulation of the human motor cortex and cervicomedullary junction. J Physiol. 1993;466:521–534. [PMC free article] [PubMed] [Google Scholar]
- Jones EG, Porter R. What is area 3a. Brain Res Rev. 1980;2:1–43. doi: 10.1016/0165-0173(80)90002-8. [DOI] [PubMed] [Google Scholar]
- Kaas JH, Pons TP. The somatosensory system of primates. Comp Primate Biol. 1988;4:421–468. [Google Scholar]
- Kang Y, Kaneko T, Ohishi H, Endo K, Araki T. Spatiotemporally differential inhibition of pyramidal cells in the cat motor cortex. J Neurophysiol. 1994;71:280–293. doi: 10.1152/jn.1994.71.1.280. [DOI] [PubMed] [Google Scholar]
- Kobayashi M, Ng J, Theoret H, Pascual-Leone A. Modulation of intracortical neuronal circuits in human motor area by digit stimulation. Exp Brain Res. 2003;149:1–8. doi: 10.1007/s00221-002-1329-9. [DOI] [PubMed] [Google Scholar]
- Kossev A, Siggelkow S, Schubert M, Wohlfahrt K, Dengler R. Muscle vibration: Different effects on transcranial magnetic and electrical stimulation. Muscle and Nerve. 1999;22:946–948. doi: 10.1002/(sici)1097-4598(199907)22:7<946::aid-mus22>3.0.co;2-o. [DOI] [PubMed] [Google Scholar]
- Kujirai T, Caramia MD, Rothwell JC, Day BL, Thompson PD, Ferbert A, Wroe S, Asselman P, Marsden CD. Corticocortical inhibition in human motor cortex. J Physiol. 1993;471:501–519. doi: 10.1113/jphysiol.1993.sp019912. [DOI] [PMC free article] [PubMed] [Google Scholar]
- Lance JW, De Gail P, Neilson PD. Tonic and phasic spinal cord mechanisms in man. J Neurol Neurosurg Psychiatry. 1966;29:535–544. doi: 10.1136/jnnp.29.1.1. [DOI] [PMC free article] [PubMed] [Google Scholar]
- Liepert J, Classen J, Cohen LG, Hallett M. Task-dependent changes of intracortical inhibition. Exp Brain Res. 1998;118:421–426. doi: 10.1007/s002210050296. [DOI] [PubMed] [Google Scholar]
- Maertens de Noordhout A, Rothwell JC, Day BL, Dressler D, Nakashima K, Thompson PD, Marsden CD. Effects of digital nerve stimuli on responses to electrical or magnetic stimulation of the human brain. J Physiol. 1992;447:535–548. doi: 10.1113/jphysiol.1992.sp019016. [DOI] [PMC free article] [PubMed] [Google Scholar]
- Marsden CD, Meadows JC, Hodgson HJF. Observations on the reflex response to muscle vibration in man and its voluntary control. Brain. 1969;92:829–846. doi: 10.1093/brain/92.4.829. [DOI] [PubMed] [Google Scholar]
- Nakamura H, Kitagawa H, Kawaguchi Y, Tsuji H. Intracortical facilitation and inhibition after transcranial magnetic stimulation in conscious humans. J Physiol. 1997;498:817–823. doi: 10.1113/jphysiol.1997.sp021905. [DOI] [PMC free article] [PubMed] [Google Scholar]
- Palmer C, Ashby P. The transcortical nature of the late reflex responses in human small hand muscle to digital nerve stimulation. Exp Brain Res. 1992;91:320–326. doi: 10.1007/BF00231665. [DOI] [PubMed] [Google Scholar]
- Reynolds C, Ashby P. Inhibition in the human motor cortex is reduced just before a voluntary contraction. Neurology. 1999;53:730–735. doi: 10.1212/wnl.53.4.730. [DOI] [PubMed] [Google Scholar]
- Ridding M, Rothwell JC. Afferent input and cortical organisation: a study with magnetic stimulation. Exp Brain Res. 1999;126:536–544. doi: 10.1007/s002210050762. [DOI] [PubMed] [Google Scholar]
- Ridding MC, Taylor JL, Rothwell JC. The effect of voluntary contraction on cortico-cortical inhibition in human motor cortex. J Physiol. 1995;487:541–548. doi: 10.1113/jphysiol.1995.sp020898. [DOI] [PMC free article] [PubMed] [Google Scholar]
- Roick H, Von Giesen R, Benecke R. On the origin of the postexcitatory inhibition seen after transcranial magnetic brain stimulation in awake human subjects. Exp Brain Res. 1993;94:489–498. doi: 10.1007/BF00230207. [DOI] [PubMed] [Google Scholar]
- Roll JP, Gilhodes JC. Proprioceptive sensory codes mediating movement trajectory perception. Human hand vibration/induced drawing illusions. Can J Physiol Pharmacol. 1995;73:295–304. doi: 10.1139/y95-040. [DOI] [PubMed] [Google Scholar]
- Roll JP, Vedel JP, Ribot E. Alteration of proprioceptive messages induced by tendon vibration in man: a microneurographic study. Exp Brain Res. 1989;76:213–222. doi: 10.1007/BF00253639. [DOI] [PubMed] [Google Scholar]
- Rosenkranz K, Altenmüller E, Siggelkow S, Dengler R. Alteration of sensorimotor integration in musician's cramp: impaired focusing of proprioception. Clin Neurophysiol. 2000;111:2036–2041. doi: 10.1016/s1388-2457(00)00460-0. [DOI] [PubMed] [Google Scholar]
- Rosenkranz K, Pesenti A, Paulus W, Tergau F. Focal reduction of intracortical inhibition in the motor cortex by selective proprioceptive stimulation. Exp Brain Res. 2003;149:9–16. doi: 10.1007/s00221-002-1330-3. [DOI] [PubMed] [Google Scholar]
- Rossini PM, Tecchio F, Sabato A, Finazzi AA, Pasqualetti P, Rossi S. The role of cutaneous inputs during magnetic transcranial stimulation. Muscle and Nerve. 1996;19:1302–1309. doi: 10.1002/(SICI)1097-4598(199610)19:10<1302::AID-MUS7>3.0.CO;2-I. [DOI] [PubMed] [Google Scholar]
- Sailer A, Molnar GF, Cunic DI, Chen R. Effects of peripheral sensory input on cortical inhibition in humans. J Physiol. 2002;544:617–629. doi: 10.1113/jphysiol.2002.028670. [DOI] [PMC free article] [PubMed] [Google Scholar]
- Sanger TD, Garg RR, Chen R. Interactions between two different inhibitory systems in the human motor cortex. J Physiol. 2001;530:307–317. doi: 10.1111/j.1469-7793.2001.0307l.x. [DOI] [PMC free article] [PubMed] [Google Scholar]
- Tamburin S, Manganotti P, Zanette G, Fiaschi A. Cutaneomotor integration in human hand motor areas: somatotopic effect and interaction of afferents. Exp Brain Res. 2001;141:232–241. doi: 10.1007/s002210100859. [DOI] [PubMed] [Google Scholar]
- Tokimura H, DiLazzaro V, Tokimura Y, Oliviero A, Profice P, Insola A, Mazzone P, Tonali P, Rothwell JC. Short latency inhibition of human hand motor cortex by somatosensory input from the hand. J Physiol. 2000;523:503–513. doi: 10.1111/j.1469-7793.2000.t01-1-00503.x. [DOI] [PMC free article] [PubMed] [Google Scholar]
- Werhahn KJ, Kunesch E, Noachtar S, Benecke R, Classen J. Differential effects on motorcortical inhibition induced by blockade of GABA uptake in humans. J Physiol. 1999;517:591–597. doi: 10.1111/j.1469-7793.1999.0591t.x. [DOI] [PMC free article] [PubMed] [Google Scholar]
- Ziemann U, Rothwell JC, Ridding MC. Interaction between intracortical inhibition and facilitation in human motor cortex. J Physiol. 1996;496:873–881. doi: 10.1113/jphysiol.1996.sp021734. [DOI] [PMC free article] [PubMed] [Google Scholar]