

Abstract
Classical techniques for estimating postsynaptic potentials in motoneurones include spike-triggered averages of rectified surface and multiunit electromyographic recordings (SEMG and MU-EMG), as well as the compilation of peristimulus time histograms (PSTH) based on the discharge of single motor units (SMU). These techniques rely on the probability of spike occurrence in relation to the stimulus and can be contaminated by count- and synchronization-related errors, arising from postspike refractoriness and the discharge statistics of motoneurones. On the other hand, since these probability-based techniques are easy to use and require only inexpensive equipment, it is very likely that they will continue to be used in clinical and laboratory settings for the foreseeable future. One aim of the present study was to develop a modification of these probability-based analyses in order to provide a better estimate of the initial phase of postsynaptic potentials. An additional aim was to combine probability-based analyses with frequency-based analyses to provide a more reliable estimate of later phases of postsynaptic potentials. To achieve these aims, we have injected simple as well as complex current transients into regularly discharging hypoglossal motoneurones recorded in vitro from rat brainstem slices. We examined the discharge output of these cells using both probability- and frequency-based analyses to identify which of the two represented the profile of the postsynaptic potential more closely. This protocol was designed to obtain PSTHs of the responses of single motor units to repeated application of the same afferent input. We have also simulated multiunit responses to afferent input by replacing the times of spike occurrence in individual trials with a representation of either an intramuscular or surface-recording single motor unit waveform and summing many of these trials to obtain either a simulated SEMG or MU-EMG. We found that in a regularly discharging motoneurone, the rising phase of an EPSP moves the occurrence of spikes forward and hence induces a substantial peak in all probability-based records. This peak is followed immediately by a period of reduced activity (‘silent period’) due to the phase advancement of spikes that were to occur at this period. Similarly, the falling phase of an IPSP delays spikes so that they occur during the rising phase of the IPSP. During the delay, the probability-based analyses display gaps and during the occurrence of the delayed spikes they generate peaks. We found that all the probability-based analyses (SEMG, MU-EMG and PSTH) can be made useful for illustrating the underlying initial PSP by a special use of the cumulative sum (CUSUM) calculation. We have illustrated that, in most cases, the CUSUM of probability-based analyses can overcome the delay- or advance-related (i.e. the count-related) errors of the classical methods associated with the first PSP only. The probability-based records also induce secondary and tertiary peaks and troughs due to synchronization of the spikes in relation to the stimulus (i.e. the synchronization-related errors) by the first PSP to occur at fixed times from the stimulus. Special CUSUM analyses cannot overcome these synchronization-related errors. Frequency-based analysis (PSFreq) of individual and summed trials gave comparable and often better indications of the underlying PSPs than the probability-based analyses. When used in combination, these analyses compliment each other so that a more accurate estimation of the underlying PSP is possible. Since the correct identification of the connections in the central nervous system is of utmost importance in order to understand the operation of the system, we suggest that as well as the using the special CUSUM approach on probability-based records, researchers should seriously consider the use of frequency-based analyses in their indirect estimation of stimulus-induced compound synaptic potentials in human motoneurones.
Since it is not possible to record directly from human motoneurones, indirect methods have been developed to study the membrane and synaptic potentials in these cells. An indirect estimate of a synaptic potential can be obtained by recording the activity developed in motor nerves or muscles in response to stimulating a set of afferent fibres. Most of these indirect estimates use surface or intramuscular electromyography (SEMG or IM-EMG) or single motor unit (SMU) recordings to represent the responses of motoneurones to stimuli. There are several techniques for quantifying these responses. The most common are full-wave rectification and averaging of the EMG record around the time of stimulation and compiling peristimulus time histograms (PSTHs) from the SMU records (Ellaway, 1978; Jenner & Stephens, 1982).
It has long been recognized that peaks and troughs in the response to an afferent stimulus, which represent increases and decreases in spike probability, can reflect not only direct synaptic effects, but also secondary effects arising from the discharge statistics of the pre- and postsynaptic cells (Moore et al. 1970). Nonetheless, it is still commonly assumed that peaks and troughs in an averaged response to a stimulus indicate synaptic excitation and inhibition, respectively (Brooke et al. 1999; Okdeh et al. 1999; Sonnenborg et al. 2000). However, direct synaptic effects on spike probability lead to subsequent changes in probability from phase-advanced or -delayed spikes (count-related errors), followed by secondary and tertiary peaks and troughs due to synchronization of the spikes in relation to the stimulus (i.e. the synchronization-related errors). We have previously claimed that cumulative sums (CUSUMs; Ellaway, 1978) calculated from probability-based responses can be interpreted in a way that avoids the initial count-related errors and hence can be used to illustrate the sign and the size of the initial postsynaptic potential (PSP) correctly. However, this claim was not based on any direct evidence other than some observations using human SMU rasters and instantaneous frequency records (Türker et al. 1994, 1997b).
In the present study, we recorded the responses of rat hypoglossal motoneurones to injected current waveforms designed to simulate various simple and complex PSPs. Our first aim was to directly test the hypothesis that special interpretation of CUSUM records can overcome the initial count-related errors by accounting for phase-advanced or -delayed spikes. We also summed spike trains from various trials that used the same PSP train to study whether the CUSUM of multiunit responses could also be used to predict the underlying PSP. We replaced the discharge times in each of the summed trains by a surface representation of human motor units to obtain a simulation of SEMG records. We then calculated a spike-triggered average (STA) of these simulated SEMG records as well as the CUSUMs of the average SEMG responses. We have also tested the usefulness of a recently developed analysis technique, the error box, for determining the occurrence of significant CUSUM deflection in the poststimulus period indicating the underlying postsynaptic potential.
The second major aim of this study was to determine whether a frequency-based analysis (instantaneous frequency plots or peristimulus frequencygram, PSFreq) can illustrate the profile of any simple or complex PSP more precisely than any of the probability-based methods. Using single large PSPs, we have already shown that the PSFreq can provide a better representation of the underlying synaptic potential profile than the PSTH (Türker & Powers, 1999). Although there have been a number of studies of the relation between the profile of monophasic PSPs and their effects on firing probability (Kirkwood & Sears 1982; Fetz & Gustafsson 1983; Gustafsson & McCrea 1984; Cope et al. 1987), there has been relatively little study of the effects of more complex PSPs. In the present study, we have examined the effects of double and complex PSPs on measures of both single and multiunit firing rate and probability.
METHODS
We have measured the effects of injected current transients on the discharge characteristics of repetitively discharging rat hypoglossal motoneurones recorded in vitro. The basic surgical and experimental procedures have recently been described in detail (Sawczuk et al. 1995; Poliakov et al. 1996, 1997). Experiments were carried out in accordance with the animal welfare guidelines in place at the University of Washington School of Medicine. Rat hypoglossal motoneurones were studied in 400 μm thick brainstem slices obtained from 18- to 24-day-old Sprague-Dawley rats. Following the induction of anaesthesia with an intramuscular injection of a mixture of ketamine (68 mg kg−1) and xylazine (4 mg kg−1), the animal was killed by decapitation. Repetitive discharge was elicited by injected current steps with superimposed noise in order to mimic the noisy synaptic drive likely to occur during physiological activation of motoneurones (Poliakov et al. 1997). The time course and amplitude of the injected current transients were chosen to mimic the postsynaptic potentials that are induced in motoneurones by activation of large numbers of afferent fibres (simulating compound excitatory and inhibitory postsynaptic potentials; EPSPs and IPSPs), and are used to estimate the wiring diagram of the human motor system. We have also used several combinations of PSPs to simulate a number of complex synaptic potentials that are thought to underlie the responses of human motoneurones to certain types of afferent input.
Stimulus waveforms
Motoneurones were initially accepted for study if they exhibited resting potentials more negative than −60 mV and action potentials with positive overshoots. Long epochs of repetitive discharge (termed ‘trials’) were elicited by 42 s injected current waveforms consisting of four components: (1) a 35 s suprathreshold step, (2) a 26.2 s zero-mean random noise waveform starting 5 s after step onset, (3) a 26.2 s train of injected current transients (inducing PSPs) starting at the same time as the noise waveform, and (4) two series of eight 1 ms, 1 nA hyperpolarizing current pulses applied before and after the current step (for details see Fig. 1 and Fig. 2 in Türker & Powers, 2001). We used three different types of background noise waveforms: (1) filtered Gaussian noise (time constant = 1 ms) with zero-mean amplitude, and a standard deviation of 0.03–0.0733 nA, (2) unfiltered Gaussian noise with a standard deviation of 0.1–0.25 nA, and (3) a combination of filtered and unfiltered noise. These waveforms were chosen to simulate a range of background synaptic noise levels and to produce relative variations in the interspike intervals of noise-driven motoneurones comparable with those observed during voluntary activation of human motoneurones (e.g. coefficients of variation of 10–25 %, cf. Clamann, 1969). The current transient waveforms consisted of series of alpha functions (Rall, 1967) designed to mimic various postsynaptic currents (PSCs). Several different PSC waveforms were used. They were various sizes of single, double and mixed PSCs. The intervals between the current transients were uniformly distributed between 200 and 600 ms. Therefore, each trial contained 66 PSCs (‘stimuli’). Individual transients had rise times of 0.1–10 ms and peak amplitudes of 0.1–1 nA. The amplitude and the time course of the simulated PSPs produced by the PSC train were calculated by convolving the current waveform with an estimate of the passive impulse response of the motoneurone. The passive impulse response was estimated from the average membrane response to the series of hyperpolarizing current pulses preceding and following the injected current step (cf. Türker & Powers, 1999).
Figure 1. Analysis of effects of simulated postsynaptic potentials (PSPs) on motoneurone firing probability and firing rate.
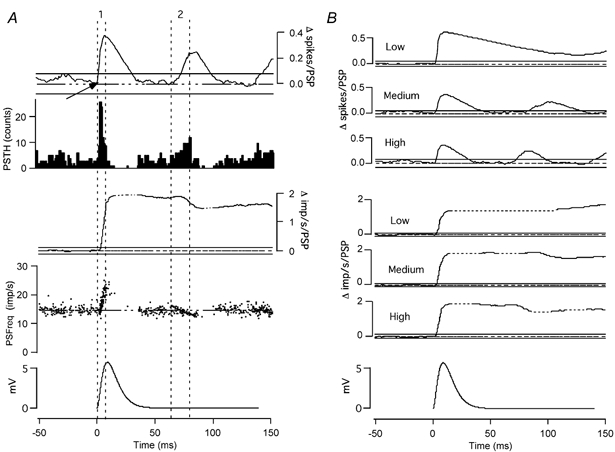
A, top traces: peristimulus time histogram (PSTH, second trace) and its CUSUM (top trace) calculated from the response of a tonically discharging hypoglossal motoneurone to repeated presentation of the PSP shown in the bottom trace. The CUSUM has been normalized by the number of applied PSPs. The fourth trace is the peristimulus frequencygram (PSFreq), which plots the instantaneous firing rate of the motoneurones as a function of time. The third trace from the top is the PSFreq-CUSUM, which has also been normalized by the number of applied PSPs. Horizontal segments of the PSFreq-CUSUM corresponding to gaps in the discharge record are indicated by dashed lines in this and subsequent figures. The lines superimposed on the CUSUMs in this and all subsequent figures represent a zero CUSUM value (dashed horizontal lines), along with the maximum deviations in the CUSUM at negative lags (Error box, continuous horizontal lines above and below the zero CUSUM line; see text for further details). The vertical dashed lines delineate the rising phases of the PSTH-CUSUM (labelled 1 and 2). B, PSTH-CUSUMs (top three traces) and PSFreq-CUSUMs (next three traces) in response to the PSP shown in the bottom trace for three different background-firing rates. All traces except the PSPs are calculated based on three trials each containing 66 PSPs (total of 198).
Figure 2. Simulation of surface and intramuscular EMG responses.
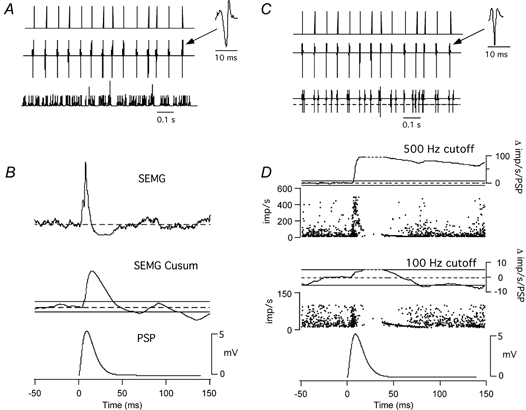
A, simulation of a SEMG recording. One-second sample of the times of spike occurrence (indicated by delta functions, top trace), the contribution of a single spike train to the SEMG recording (middle trace) and the simulated SEMG record, calculated by summing the contribution of 9 spike trains and rectifying the result (bottom trace). The contribution of an individual spike train is calculated by replacing the delta functions in the top trace with a typical single motor unit waveform as recorded with surface electrodes (inset). B, effects of a PSP on the simulated SEMG record. Top trace, PSP-triggered average of the simulated SEMG record. Middle trace, CUSUM of the simulated SEMG record. Bottom trace, PSP. C, simulation of multiunit (intramuscular) EMG recording. Same arrangement of traces as in A, except that the bottom trace represents the contributions of only three motor unit spike trains (firing at high, medium and low background rates), and the final result is not rectified, but is instead high-pass filtered at 1000 Hz. Times of threshold crossing are calculated from negative-going deflections that exceed a fixed threshold (shown by the dashed line in the bottom trace). Threshold-crossings were followed by a dead time of either 2 or 10 ms, so that the maximum frequency of threshold-crossings was either 500 or 100 Hz. D, PSFreqs and their CUSUMs calculated from three simulated multiunit trials using a frequency cut-off of either 500 (upper traces) or 100 Hz (lower traces). In B and D, the SEMG and the PSFreq are made up of 9 trials.
Experimental protocol
The effects of the simulated PSP trains on motoneurone discharge probability and rate were determined from a series of three, 26 s epochs of discharge evoked by the injected current waveforms described above. In different sets of trials, the amplitude of the current step was varied to maintain three ranges of discharge rates: low (5–9 impulses s−1), medium (10–14 impulses s−1) and high (15–22 impulses s−1).
Analysis
The responses of the motoneurone to a series of PSP trains were used to compile peristimulus time histograms (PSTHs) and peristimulus frequencygrams (PSFreqs). Cumulative sums (CUSUMs) were calculated from the PSTHs and PSFreqs by subtracting the mean bin value at negative lags (-200 to 0 ms prestimulus), and integrating the result. We have also built error boxes from the prestimulus variability of the CUSUM traces so that the existence of a significant poststimulus deflection could be determined (Türker et al. 1997a). To build the error box, we have determined the maximal negative and positive deflections from the CUSUM trace during the 200 ms prestimulus period (from −200 to 0 ms). The larger of the two values was then used to build a symmetrical box around zero. The box therefore illustrated the largest deflections to either side of a zero CUSUM value during the prestimulus period. Any poststimulus deflection that was larger than the limits of the error box was considered a significant response (Fig. 1).
In order to simulate the responses of multiple units, records from different cells or the same cell firing at different discharge rates were summed to build summed trains (Fig. 2). In these summed trains we have replaced each action potential with a typical representation of a single human motor unit action potential as recorded from the surface of a human muscle (inset in Fig. 2A) or from an intramuscular electrode (inset in Fig. 2C). To simulate a typical surface EMG recording (SEMG) the result was rectified (Fig. 2A, bottom trace). The final result was similar to the SEMG record obtained from human volunteers since the responses of many units firing at various rates are now represented together in one record. Since the summation was performed only when the same PSP train was delivered to the same or a different cell firing at various rates, it simulated a multiunit SEMG response to a given stimulus (Fig. 2B).
To simulate an intramuscular multiunit recording (MU-EMG) used to calculate threshold-crossings, the summed result is high-pass filtered at 1000 Hz (bottom trace in Fig. 2C). Times of threshold crossing in this filtered multiunit record were calculated from negative-going deflections that exceeded a fixed threshold (shown by the dashed line in the bottom trace of Fig. 2C). Threshold-crossings were followed by a dead time of either 2 or 10 ms, so that the maximum frequency of threshold-crossings was limited to either 500 or 100 Hz (Fig. 2D). By plotting these frequencies around the time of the stimuli we have compiled multiunit peristimulus frequencygrams (MU-PSFreqs).
RESULTS
The results described below were derived from 132 series of discharge records recorded from 14 motoneurones, where each series represented a set of discharge trials recorded at a similar mean discharge rate in response to a given combination of simulated background noise and synaptic potentials (PSPs). We first describe the responses of single motoneurones to various types of PSPs, followed by a description of the simulated multiunit responses.
Single unit records
Single EPSPs
We simulated simple, compound EPSPs using single, positive alpha function current transients with peak amplitudes of 0.1–1 nA. These produced simulated EPSPs with peak amplitudes in the range of 0.8–13 mV. At low background discharge rates, there was a single peak in the PSTH and an associated increase in its CUSUM during the rising phase of the EPSP (Fig. 1B, top trace). The CUSUM declined slowly during the falling phase of the EPSP (‘silent period’) to stay just above the zero line. When the background discharge rate was increased, the PSTH and its CUSUM began to illustrate second and third peaks and troughs (Fig. 1B, second and third traces from the top). The size of the initial peak in the CUSUM, and the duration of the ‘silent period’ both decreased as the discharge rate of the cell increased. The dependence of the silent period on the background discharge rate made it impossible to determine the duration of the underlying PSP from the PSTH-CUSUMs at any of the discharge rates. At all discharge rates, the upward deflection of the CUSUM underlying the rising phase of the EPSP was greater than the error box so long as the EPSP amplitude was larger than 1 mV. The time of EPSP onset was correctly identified by extrapolating the first poststimulus CUSUM deflection that was larger than the error box back into the error box and defining the time of the last deflection in the same direction (Fig. 1A, arrow).
After the initial peak, the CUSUM traces for the medium and high discharge rates came back to zero, indicating that all the phase-advanced spikes were accounted for. This was especially apparent at the highest discharge rates (Fig. 1A, top trace, and B, second and third traces from the top). Since the rising phase of the EPSP phase advanced and synchronized the spikes at a fixed point from the timing of the stimulus, it generated secondary and tertiary peaks and troughs reflecting the autocorrelation function of the motoneurone discharge. These peaks and troughs that occur after the completion of underlying PSPs will be subsequently referred to as ‘synchronization-related errors’.
As previously described in Türker & Powers (1999), the peristimulus frequencygram (PSFreq), which plots the peristimulus changes in discharge rate, can follow the shape of the EPSP without generating synchronization-related artifacts. At low discharge rates, the PSFreq followed the initial rising phase of the EPSP only, due to the absence of spikes during the falling phase of the EPSP. At the higher background discharge rates there were small number of high-frequency spikes during the falling phase of the EPSP (Fig. 1A; see also Fig. 8 of Türker & Powers, 1999). A large number of stimuli delivered at high background discharge rate are necessary to obtain larger numbers of spikes during the falling phase of the EPSP (for an example where 396 stimuli were used; see Fig. 2B of Türker & Powers, 1999). The PSFreq records were also crucial for determining the duration of the PSP since they returned to the initial discharge rate once the PSP was completed. To illustrate the timing and significance of the changes in the PSFreq records, PSFreq-CUSUMs were also calculated (third trace in Fig. 1A; traces 4–6 in Fig. 1B). (Since horizontal segments of the PSFreq-CUSUM can arise from either an absence of spikes or firing at the background discharge rate, horizontal segments corresponding to gaps in the discharge record are indicated by dashed lines in all figures.) A significant change in the discharge rate was indicated by any PSFreq-CUSUM deflection greater than the width of the error box. To illustrate whether synchronization-related errors could be identified using the PSFreq records, we have looked for significant deflections in the PSFreq-CUSUM record underlying each peak in the PSTH (i.e. rising phase of the PSTH-CUSUM). A significant deflection in the PSFreq-CUSUM underlying any of the significant rising phases in the PSTH-CUSUM was taken to indicate a direct effect of the underlying PSP, rather than a synchronization-related increase in firing probability. For example, a large EPSP induced two rising phases in the PSTH-CUSUM within 100 ms of PSP onset (indicated by the two sets of vertical dotted lines in Fig. 1A). The first of these is associated with a significant rise in the PSFreq-CUSUM, whereas the second is not.
Single IPSPs
We used negative current transients with peak amplitudes of 0.1–1 nA to generate simulated IPSPs. In general, the initial, falling phase of the IPSP led to a period of inactivity, reflected as a trough in the PSTH and a decline in its CUSUM (Fig. 3B, top trace). The CUSUM then increased during the repolarization phase of the IPSP to reach the limits of the error box. During this period all delayed spikes occurred, leading to a rise in the PSTH-CUSUM. At medium and high background discharge rates, second and third troughs and peaks appeared in the PSTH, and were reflected in long-latency deflections in its CUSUM (see Fig. 3B). Second and third troughs and peaks were generated by this repolarization phase of the IPSP that lined up the spikes. Once the spikes are phase-delayed by this phase of the IPSP, they are ‘synchronized’ to the stimulus and hence the second and third troughs must represent the autocorrelogram function of the cell's discharge. The IPSP-induced synchronization is not, however, as tightly packed as that generated by the rising phase of an EPSP (Fig. 3A) and hence the secondary and tertiary peaks and troughs are not as clear, and often smaller than the prestimulus error box (Fig. 3B). The CUSUM deflections underlying the falling phase of the IPSP were always larger than the prestimulus error box. The latency of the falling phase of the IPSP was also correctly identified from the beginning of the first poststimulus CUSUM deflection that was larger than the error box (arrows in Fig. 3B and D).
Figure 3. PSTH and PSFreq-CUSUMs calculated from motoneurone responses to various PSPs.
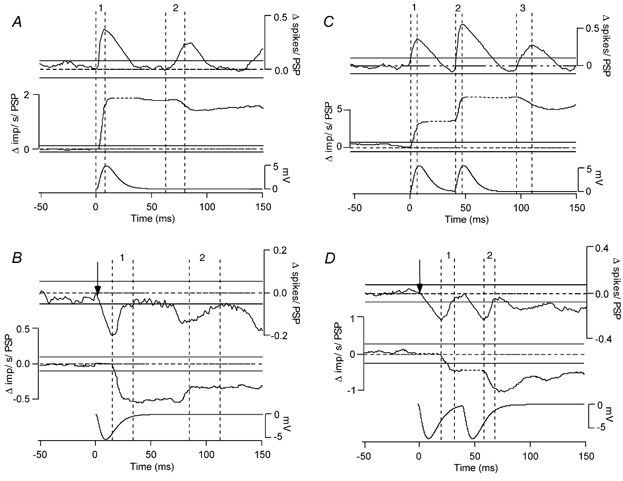
PSTH- (top traces) and PSFreq-CUSUMs (middle traces) calculated from responses to PSPs (bottom traces) for the highest motoneurone background discharge rate. A and B, responses to single EPSPs and IPSPs. C and D, responses to double EPSPs and IPSPs. Except for the PSPs, each trace is made up from three trials each containing 66 PSPs (total of 198). The vertical dashed lines delineate the rising phases of the PSTH-CUSUM (labelled 1, 2 and 3). Error boxes are indicated with continuous horizontal lines in this and other figures (Methods).
As previously reported (Türker & Powers 1999), when spikes occurred during IPSPs, their instantaneous frequency was lower than the background discharge rate. The PSFreq record thus followed various portions of the repolarization phase of the IPSP depending on the discharge rate. At low discharge rates it only followed the final section of the repolarization phase. At the higher discharge rates, it followed more of the repolarization phase. At very high discharge rates, it followed most of the repolarization profile of the IPSP and indicated its duration correctly. This appeared as a continuous decrease in the PSFreq-CUSUM throughout the repolarization phase of the IPSP (Fig. 3B).
The first rise in the PSTH-CUSUM (first set of vertical dashed lines in Fig. 3B) is associated with a significant negative deflection in the PSFreq-CUSUM, indicating that the increase in firing probability following the initial decrease is associated with inhibition. In contrast, the second significant rise in the PSTH-CUSUM (second set of vertical dashed lines in Fig. 3B) is not associated with a significant deflection in the PSFreq-CUSUM, indicating that this late change in firing probability reflects a synchronization-related increase in discharge probability, rather than a direct effect of a second PSP.
Double EPSPs
Double EPSPs were simulated by applying two depolarizing current transients with peak amplitudes of 0.1–1 nA, separated by 40 ms. The changes in firing probability produced by the double EPSPs generated two prominent peaks associated with the rising phases of the EPSPs and related prominent silent periods associated with the falling phase of the EPSPs in the PSTHs and their CUSUMs. The relative amplitude of the two peaks depended on motoneurone discharge rate. At low discharge rates, the second of the peaks was smaller than the first peak, at medium discharge rates the two peaks were about equal in areas, and at high discharge rates, the second peak was larger than the first peak (Fig. 3C). There was also a third peak, a synchronization-related error, in the high discharge rate trials only (Fig. 3C). The PSTH-CUSUM only came back to zero at high discharge rates but stayed above zero at lower rates (not shown). The CUSUM deflection underlying the rising phase of both EPSPs were always larger than the prestimulus error box. The latencies of the rising phase of the EPSPs were also correctly identified from the final deflection of the poststimulus CUSUMs that were larger than the error box. However, the durations of the PSPs could not be reliably determined from the PSTH-CUSUMs.
The PSFreq records could be used to distinguish changes in firing probability that were directly caused by the PSPs from those due to synchronization-related errors. The PSFreq-CUSUM (second trace in Fig. 3C) only exhibited rises during the rising phases of the two EPSPs, whereas the rising phase of the third peak in the PSTH and its CUSUM was associated with a slight and not significant (smaller than the error box in PSFreq-CUSUM) decrease in discharge rate (vertical dashed lines in Fig. 3C).
Double IPSPs
Double IPSPs were simulated by applying two hyperpolarizing current transients of equal amplitude (0.1–1 nA), again separated by 40 ms. These stimuli generated two prominent gaps and associated peaks in the PSTHs and their CUSUMs at all background discharge rates. The CUSUM deflections underlying the falling phase of both IPSPs were always larger than the prestimulus error box. The latency of the falling phase of the IPSPs was also correctly identified from the position of the poststimulus CUSUM deflection that was larger than the error box (Fig. 3D, top trace). At low and medium discharge rates, the first of the peaks that followed the period of reduced activity was more prominent than the second peak (not illustrated). However, their sizes became about equal at the high background discharge rates (see Fig. 3D, top trace). The duration of the PSPs could not be determined with confidence, due to the increased probability of discharge toward the end of each IPSP.
As was the case for single IPSPs, the instantaneous firing rates were reduced during the repolarizing phases of the double IPSPs. Thus, the PSFreq-CUSUM decreased below the baseline at a time when the PSTH-CUSUM indicated a period of increased firing probability. The decrease in firing rate associated with peaks in the PSTH thus indicates that direct effects of complex PSPs on firing probability can often be distinguished from secondary effects by measuring the associated changes in firing rate.
EPSP followed by equal-amplitude IPSP
We simulated more complex PSPs by combining depolarizing and hyperpolarizing current transients. The initial EPSP was associated with an increase in discharge probability and rate, regardless of the background discharge rate of the motoneurone (Fig. 4A). The latency of the initial EPSP was correctly identified from the beginning of the first poststimulus PSTH-CUSUM deflection that was larger than the error box. However, detection of the following IPSP was only possible at the medium and high background discharge rates (not shown). At the highest background discharge rate, the value of the PSTH-CUSUM increased above the prestimulus range during the EPSP and then decreased below this range during the subsequent IPSP. The PSTH-CUSUM obtained at the medium discharge rate was qualitatively similar, although the increase in the CUSUM during the EPSP was larger than the decrease during the IPSP. At the lowest discharge rate, the PSTH-CUSUM only exhibited a rise during the EPSP – there was no indication of the subsequent IPSP. The CUSUM deflections underlying the rising phase of the EPSP and the falling phase of the IPSP were always larger than the prestimulus error box so long as the PSP size was above 1 mV. The latency of the PSPs was correctly identified from the position of the very first poststimulus CUSUM deflection that was larger than the error box. The PSFreq-CUSUMs obtained at all discharge rates showed a prominent increase associated with the initial peak in the PSTH-CUSUM, coinciding with the rising phase of the EPSP. At the highest background discharge rate, the PSFreq-CUSUM decreased during the second peak in the PSTH, correctly indicating the decay phase of the IPSP. A similar result was obtained at the medium background discharge rate. There was a small increase in the PSFreq-CUSUM associated with the third phase of increased discharge probability, but it was less than the width of the prestimulus error box.
Figure 4. PSTH and PSFreq-CUSUMs calculated from responses to various mixed PSPs.
PSTH- (top traces) and PSFreq-CUSUMs (middle traces) calculated from responses to mixed PSPs (bottom traces) for the highest motoneurone background discharge rate. A, response to an EPSP followed by equal-amplitude IPSP. B, response to an IPSP followed by equal-amplitude EPSP. C, response to an EPSP followed by an IPSP of half its amplitude. D, response to an IPSP followed by an EPSP of half its amplitude. Except for the PSPs, each trace is made up from three trials each containing 66 PSPs (total of 198). The vertical dashed lines delineate the rising phases of the PSTH-CUSUMs (labelled 1, 2 and 3).
IPSP followed by equal-amplitude EPSP
The PSTH-CUSUM exhibited up to four deflections that exceeded the prestimulus range (Fig. 4B). The peak of the initial PSTH (first rising phase of the PSTH-CUSUM) coincided with the decay phase of the IPSP (indicated by a decrease in the PSFreq-CUSUM during this phase) and the peak of the second rising phase of the PSTH-CUSUM with the initial phase of the EPSP (indicated by a significant increase in the PSFreq-CUSUM during this phase) at all background discharge rates. Depending on the background discharge rate, the size of the two peaks changed significantly. At the high rate the first peak was more prominent, but this peak decreased in size and became wider relative to the second peak as the discharge rate reduced. The PSTH-CUSUM record returned to zero when each of the PSPs were completed, but could show additional small deflections following the complex PSP. The PSTH-CUSUM deflections underlying the falling phase of the IPSP and the rising phase of the EPSP were always larger than the prestimulus error box. The latency of the falling phase of the IPSP was also correctly identified from the beginning of the first poststimulus CUSUM deflection that was larger than the error box.
Other PSPs
Several other PSP complexes were used, such as a large PSP followed by small PSP, the reverse, double PSPs in which the two PSP subcomponents overlapped, and extremely short PSPs (some examples are shown in Fig. 4C and D). The results supported the basic findings for the single, double and complex PSPs detailed above in that the changes in single unit discharge probability and rate can generally provide information about the entire profile of an underlying synaptic potential, except in some cases in which the synaptic potential rapidly switches between excitation and inhibition within the duration of an average interspike interval (e.g. Fig. 5 of Türker & Powers, 1999).
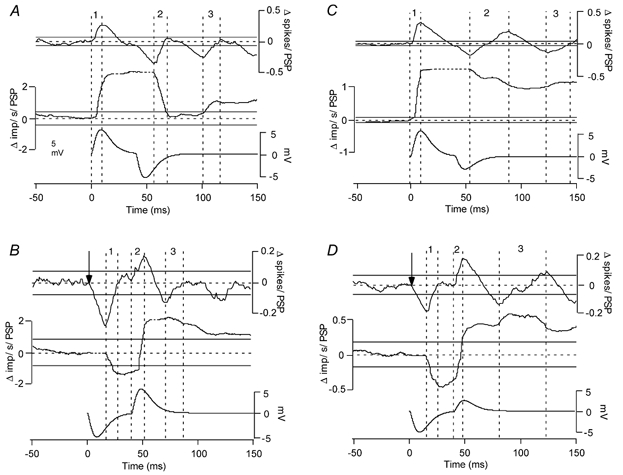
Figure 5. Effects of PSPs on simulated multiunit records.
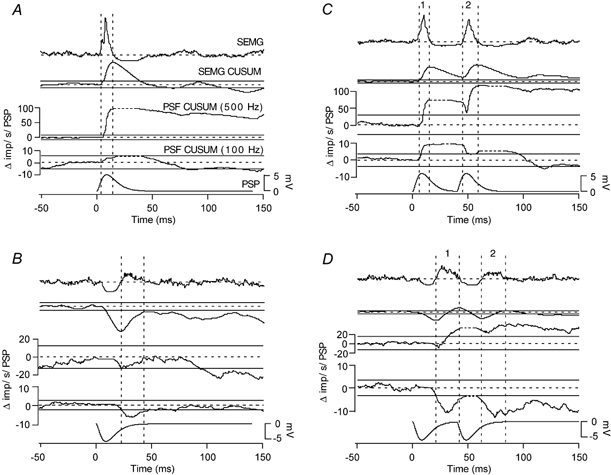
The traces in each panel in this figure, from top to bottom, are: a PSP-triggered average of the simulated SEMG record, the CUSUM of the average SEMG record, the CUSUM of a MU-PSFreq with a 500 Hz cut-off, the CUSUM of a MU-PSFreq with a 100 Hz cut-off, and the PSP. A and B, responses to a single EPSP and IPSP, respectively. C and D, responses to double EPSPs and IPSPs, respectively. The SEMGs and the PSFreqs are made up of 9 trials. Vertical dashed lines delineate the rising phases of the SEMG-CUSUMs. Only 1 in A and B; 1 and 2 in C and D.
Summary of the single unit data
As previously proposed, based on motor unit recordings from human subjects, we have now shown that the PSTH-CUSUM is useful for indicating the sign of the initial PSP since it comes back to the zero line during the recovery phase of the initial PSP. We found that to use the PSTH-CUSUM reliably to indicate the underlying initial PSP, the background discharge of the unit should be relatively high (more than 15 Hz). The sign of the second PSP can be determined using the combination of the probability- and frequency-based analyses. We found three indicators for the sign of the second PSP. First, an increase in the PSTH-CUSUM that is accompanied by an increase in the PSFreq-CUSUM indicates an EPSP. Second, an increase in the PSTH-CUSUM that is accompanied by a decrease in the PSFreq-CUSUM (preceded by a gap in the spike probability) indicates an IPSP. Third, an increase in the PSTH-CUSUM that is accompanied by no significant change in the PSFreq-CUSUM indicates that this increase is caused by the autocorrelation function of the unit. A decrease in the PSTH-CUSUM can occur for three reasons: (1) due to the reduction in the probability of spike occurrence during the repolarizing phase of an EPSP, (2) during the cessation of spike generation during the hyperpolarizing phase of an IPSP, and (3) as a result of a synchronization-related error. We found that a decrease in the PSTH-CUSUM only indicates the presence of an IPSP when it is associated with a decrease in the discharge rate during the rise of the PSTH-CUSUM.
Multiunit EMG results
The following section describes the effects of synaptic excitation and inhibition on simulated multiunit discharge, such as that detected either by surface or intramuscular electrodes (Methods). Figure 5 illustrates the effects of the various current transients on simulated SEMG records (top traces), the SEMG-CUSUM (second traces from the top), the PSFreq-CUSUMs calculated from the multiunit records (MU-PSFreq-CUSUMs; third and fourth traces) and the membrane potential (bottom traces). Instantaneous frequency values were calculated from simulated ‘multiunit’ EMG records (Fig. 2D). A 500 Hz cut-off (2 ms dead time) was chosen since it was found to be a good indicator of the EPSP-related increase in the discharge rate and a 100 Hz cut-off (10 ms dead time) was chosen since it was found to indicate the position of the IPSP correctly. These MU-PSFreq records could be used in the same way as single unit PSFreqs to predict the underlying PSP. The rising phase of EPSPs were associated with increases in the PSFreq record using the 500 Hz cut-off and the repolarizing phase of IPSPs was reflected as a decrease in frequency in the PSFreq record calculated with the 100 Hz cut-off.
‘Surface electromyography’
In order to illustrate the effectiveness of the SEMG in predicting the underlying PSP, we have replaced individual spikes in each trial with an estimated surface representation of human motor units (Methods). This has given us a record that simulated the SEMG records in human subjects. As before, the prestimulus range of the CUSUM records was used to generate an error box to indicate significant deflections in the CUSUMs. As can be observed, the SEMG-CUSUM is as useful as the PSTH-CUSUM for indicating the underlying initial PSP (compare Fig. 3 and Fig. 5). For the initial deflection in the SEMG-CUSUM, an increase over and above the error lines (i.e. significant increase) indicates an underlying EPSP and a decrease indicates an IPSP.
After the initial deflection over or below the error line, the SEMG-CUSUM trace returns to the prestimulus mean value (zero line), indicating the completion of the initial PSP. In contrast, just like the single unit results above, the secondary or tertiary peaks or troughs in the SEMG-CUSUM were not necessarily indicative of an underlying PSP. To estimate whether the secondary and tertiary peaks indicate genuine PSPs, MU-PSFreqs had to be used. Similar to the individual PSFreq-CUSUMs and PSTH-CUSUMs (Figs 1, 3 and 4), examination of MU-PSFreq-CUSUMs underlying the rising phases in the SEMG-CUSUM differentiated direct effects of PSPs on firing probability from those due to synchronization-related errors (Fig. 5). If the discharge rate (500 Hz limited) increases significantly during the rising phase of the SEMG-CUSUM it represents a genuine EPSP. To confirm that this is a genuine EPSP, examination of the discharge rate record where the limit was set to 100 Hz is essential. If there is no change or an increase in this record during the same peak, the EPSP is genuine. If, however, the discharge rate in the 100 Hz record decreases significantly during any of the rising phases in the SEMG-CUSUM, the underlying PSP is always an IPSP.
The simulated SEMG and intramuscular multiunit records used for the traces in Fig. 5 were derived from multiple records from the same cell. The SEMG records were based on summing 9–12 motor unit trains, whereas the multiunit frequency measures were based on three multiunit trials, each composed of three units. Although these simulated recordings are based on fewer units than would typically be recorded from surface and intramuscular electrodes, qualitatively similar results were obtained when larger numbers of units were used.
DISCUSSION
In this study, we have provided further evidence that changes in motoneurone firing probability following a synaptic input need to be interpreted with caution. Without proper interpretation of the CUSUM calculated from firing probability, these changes are not useful for indicating any of the properties of the underlying PSPs. Even with the simplest PSP such as a single EPSP or IPSP, the probability-based analyses induced at least two ‘significant’ changes, since significant changes are assessed as the number of counts or areas that are larger or smaller than the counts in similar prestimulus periods (Garnett & Stephens, 1980). Therefore, in any of the probability-based analyses one would interpret these significant changes in the record as indicating two consecutive PSPs (Fig. 1 and Fig. 2).
Utilizing CUSUM to avoid the count-related errors for the first PSP
We have previously suggested that, if properly interpreted, the CUSUMs of probability-based analyses may overcome the initial (count-related) errors in these analyses and hence may be able to illustrate the sign and the size of the first PSP correctly. However, this claim was not based on any direct evidence other than some observations using SMU rasters (Türker et al. 1994). In these human studies, we had no way of knowing that the stimulus induced only a single EPSP or an IPSP since it has been claimed that any mixed nerve stimulation would stimulate several types of nerve fibres, hence generating mixed PSPs (e.g. Burke et al. 1983, 1984). Therefore, a direct study where a known number and profile of PSPs can be injected into a regularly discharging motoneurone was needed to test this and also other methods of estimating PSPs.
We have illustrated that, in most cases, the CUSUM of any of the probability-based records can overcome the count-related errors related to the initial PSP only. Using single unit records, the PSTH-CUSUM can indicate with confidence, the latency, the sign and often the duration of the very first PSP except in two situations.
First, if the delay between two PSPs is less than the average interspike interval of the cells’ discharge, the CUSUM may not return to zero or returns to zero while the effects of the first PSP is still continuing, making it impossible to determine the duration of the first PSP (see also Fig. 5 of Türker & Powers, 1999). This problem can be partly overcome by increasing the background discharge rate of the cell.
Second, when the discharge rate of the units is extremely slow (< 5 Hz) and not regular, the EPSP may generate a discharge in some of the units more often than occurs normally during the prestimulus period. This happens as a result of the fact that, on occasion, a unit stops discharging momentarily and only fires when an extra EPSP reaches the cell. This naturally generates more spikes corresponding with the timing of the EPSP than during the period immediately preceding the stimulus (the prestimulus period) from which the zero level of the CUSUM is established. The peak in the CUSUM under this circumstance is made up of both phase-advanced spikes and recruited spikes. Therefore, when the EPSP ends, the CUSUM does not return to the zero level but stays above it (Fig. 1B, top trace). It is suggested therefore that the discharge rate of units should be regular and at least around 15 Hz to avoid such errors and also to account for a possible late PSP. In multiunit or surface recordings, using high levels of background contractions that recruit most or all units can reduce this problem.
The probability-based responses also exhibit secondary and tertiary peaks and troughs due to synchronization of the spikes by the initial PSP. The initial synchronization generates secondary and tertiary peaks and troughs following the autocorrelation function of the cell's discharge even when there are no subsequent PSPs. The CUSUM analyses could not reduce the errors in these ‘synchronization-related’ secondary and tertiary peaks and troughs. Therefore, secondary peaks and troughs in the CUSUM should not be interpreted as indicating a PSP unless single- or multiunit recordings are performed and PSFreq analyses are used in combination.
Error box approach to determine the existence of a PSP in probabilistic analyses
Using the CUSUM analysis, we have also examined whether the existence and the latency of a PSP could be determined by examining stimulus-evoked deflections in the CUSUM that exceed the prestimulus variation (error box). We have previously suggested (Türker et al. 1994, 1997b) that maximum prestimulus variations can be used to judge whether a deflection in the poststimulus CUSUM represents a genuine PSP (i.e. reflex response). Poststimulus deflections that were larger than the error box and occurred before the minimal reaction time of the subject to the stimulus were taken to represent genuine reflex responses (Türker et al. 1997a). We have also postulated that extrapolating any poststimulus CUSUM deflection that is larger than the error box back into the box and marking the timing of the start of the final deflection could be used to determine the latency of a PSP.
The results of the present study indicate that under certain conditions the interpretation of the PSTH-CUSUM described above can indeed indicate the existence and latency of underlying PSPs. The sensitivity of the analysis will depend upon a number of factors including the discharge rate of the motoneurone, the number of applied stimuli and the PSP amplitude. We have used PSP amplitudes that are similar in size to those thought to underlie typical human reflex responses to stimulation of multiple afferent fibres (2–5 mV; Miles et al. 1989a,b; Semmler & Türker, 1994; Türker & Cheng, 1994). We have also used smaller EPSPs and IPSPs in this and in our previous study to illustrate the effect of PSP size on the PSTH and frequencygram (Türker & Powers, 1999) and to determine the size of the PSP threshold that is unambiguously larger than the size of CUSUM error box. These findings illustrate that a PSP profile can be obtained for a wide range of PSP sizes, particularly if the background discharge rate is relatively fast (see also, Figs 3, 7 and 8 in Türker & Powers, 1999) and that PSP size should be 1 mV or larger for the CUSUM trace to deflect outside the error box. When smaller amplitude PSPs are used in human reflex work, it would be impossible to determine their existence with this current technique; however, it would also be difficult to pinpoint the existence of such stimulus-induced PSPs without confusing them with natural variations in the EMG or the discharge properties of motoneurones.
Frequency-based analysis to estimate the profile of complex PSPs?
Using simulated single large excitatory and inhibitory PSPs and recording directly from motoneurones in vitro, we have recently shown that the PSFreq technique is a reliable method for estimating the profile of single large PSPs (Türker & Powers, 1999). In the present study, as well as using single PSPs, we have also used double and complex PSPs of varying sizes. We have demonstrated that the PSFreq analyses performed on either the single- or the multiunit data could indicate the sign of PSPs when they are used in combination with the probability-based records. The separation used between the PSPs is also similar to various combinations of excitatory and inhibitory reflexes described in human muscles (van der Glas et al. 1984; van Steenberghe et al. 1989; Garland & Miles, 1997; Brooke et al. 1999). Furthermore, we have studied a condition where the earlier excitatory PSP is cut short by an inhibitory PSP that occurs 5 ms after the start of the excitatory PSP. These results also illustrated the need for examining the discharge rate data for matching the changes in the PSTH-CUSUM traces with the underlying PSPs. Unless the PSFreq is examined along with the PSTH-CUSUM, it was impossible to estimate the underlying PSP (see also Fig. 5 in Türker & Powers 1999). We have now extended the results using EPSP-IPSP and IPSP-EPSP complexes in differing amplitudes that occur within a few milliseconds of each other. These results indicated that the PSP complexes have to be at least 1 mV in amplitude before they could be unambiguously recognized as a significant event (larger than the CUSUM error box) and that to recognize their profile the PSFreq records have to be examined.
As discussed in our earlier paper (Türker & Powers, 1999), an EPSP produces an increase in the instantaneous discharge rate of the interval in which it occurs, but can lead to a subsequent decrease in discharge rate due to a higher residual afterhyperpolarization conductance left from the previous discharge (Türker & Powers, 1999; Powers & Türker, 2001). However, this effect is not due to an analysis error but reflects a genuine change in the membrane potential of the cell as a result of an injected current. Since this residual conductance effect did influence the discharge rate of the second interval slightly but consistently, this complicated the interpretation of firing rate changes produced by double and complex PSPs. As a result, a combination of frequency-based and probability-based records is needed in order to describe the underlying PSPs most accurately.
The PSFreqs can misrepresent the sign of the first EPSP when the motoneurone exhibits low-frequency, irregular discharge (< 5 Hz). Under these conditions, we observed a small dip in the PSFreq immediately preceding the increase caused by the rising section of the EPSP (Fig. 5C, third trace from top). This effect reflects the fact that when the discharge rate is very low, the initial section of the EPSP is able to bring the membrane potential to threshold when the cell is momentarily silent. In these cases, the PSTH-CUSUM record does not return to the zero line after the effect of the first PSP has faded. Thus, in order to obtain a more accurate estimate of the PSP profile, the discharge rate of units should be regular and at least around 15 Hz to avoid such errors and also to allow the discharge to reflect the influence of any later PSP components.
In this study, what we term the ‘multiunit’ records are made up of up to nine units and hence the data should be used with caution. The results indicate that the basic features of stimulus-evoked changes in firing rate and probability are not critically dependent upon the number of units contributing to the recording. However, further experiments need to be performed using larger numbers of units in order to confirm this interpretation.
Conclusions and recommendations
The background discharge of a single unit must be in the high discharge range (>15 Hz) in order to illustrate fully the profile of the PSP(s) and also to avoid errors due to low discharge rates (discussed above). Illustrating the profiles of subsequent PSPs is only possible using high discharge rates. However, as discussed earlier, high background rates increase the likelihood of synchronization-related errors. When the frequency-based records are used in combination with the PSTH-CUSUM, this problem can be minimized. Basically, when there is a peak in the probability-based record (rising phase in its CUSUM), an increase in the discharge rate underlying this peak correctly indicates an EPSP. If however, we observe a decrease in the discharge rate underlying the peak, this indicates the existence of an IPSP. Alternatively, if a peak is not accompanied by a significant change (i.e. larger than the error box) in the discharge rate, it indicates that this peak occurred due to a synchronization-related error.
Similar guidelines can be used to interpret SEMG and multiunit intramuscular recordings. If there is a peak in the probability-based record (i.e. rise in its CUSUM) and an increase in the discharge rate (MU-PSFreq-CUSUM) underlying this peak when the frequency is limited to a maximum of 500 Hz, this almost certainly correctly indicates an EPSP. If, when the frequency is limited to 100 Hz, the MU-PSFreq-CUSUM does not display a significant reduction in the discharge rate during this peak, this provides further evidence that the PSP is excitatory. If however the 100 Hz-limited MU-PSFreq-CUSUM records do display a significant reduction in the discharge rate underlying the SEMG peak, it almost certainly correctly indicates an IPSP.
If only the SEMG is used for studying the PSPs, the SEMG-CUSUM can be used to illustrate the sign and the size of the initial PSP. An initial increase in the SEMG-CUSUM larger than the error box indicates an underlying EPSP and a decrease larger than the error box indicates an IPSP. (This statement is true for all probability-based analyses) After the initial deflection over or below the error line, if the CUSUM trace returns to the prestimulus mean value (zero line), this may indicate the completion of the initial PSP rather than a second PSP. Secondary or tertiary peaks or troughs in the SEMG-CUSUM cannot be classified as genuine PSPs unless single or multiunit frequency data are available and examined in parallel.
Acknowledgments
We are grateful to Professor Marc Binder for encouragement and support during this study and valuable comments on the manuscript. This study was funded by the NH & MRC of Australia; NIH grants NS 31925 and NS 26840, NSF grant IBN 9986167 and a Human Frontiers Science Project Short Term Fellowship.
REFERENCES
- Brooke JD, McIlroy WE, Staines WR, Angerilli PA, Peritore GF. Cutaneous reflexes of the human leg during passive movement. J Physiol. 1999;518:619–628. doi: 10.1111/j.1469-7793.1999.0619p.x. [DOI] [PMC free article] [PubMed] [Google Scholar]
- Burke D, Gandevia SC, McKeon B. The afferent volleys responsible for spinal proprioceptive reflexes in man. J Physiol. 1983;339:535–552. doi: 10.1113/jphysiol.1983.sp014732. [DOI] [PMC free article] [PubMed] [Google Scholar]
- Burke D, Gandevia SC, McKeon B. Monosynaptic and oligosynaptic contributions to human ankle jerk and H-reflex. J Neurophysiol. 1984;52:435–448. doi: 10.1152/jn.1984.52.3.435. [DOI] [PubMed] [Google Scholar]
- Clamann HP. Statistical analysis of motor unit firing patterns in a human muscle. Biophys J. 1969;9:1233–1251. doi: 10.1016/S0006-3495(69)86448-9. [DOI] [PMC free article] [PubMed] [Google Scholar]
- Cope TC, Fetz EE, Matsumura M. Cross-correlation assessment of synaptic strength of single Ia fibre connections with triceps surae motoneurones in cats. J Physiol. 1987;390:161–188. doi: 10.1113/jphysiol.1987.sp016692. [DOI] [PMC free article] [PubMed] [Google Scholar]
- Ellaway PH. Cumulative sum technique and its application to the analysis of peristimulus time histogram. Electroencephalogr Clin Neurophysiol. 1978;45:302–304. doi: 10.1016/0013-4694(78)90017-2. [DOI] [PubMed] [Google Scholar]
- Fetz EE, Gustafsson B. Relation between shapes of post-synaptic potentials and changes in firing probability of cat motoneurones. J Physiol. 1983;341:387–410. doi: 10.1113/jphysiol.1983.sp014812. [DOI] [PMC free article] [PubMed] [Google Scholar]
- Garland SJ, Miles TS. Control of motor units in human flexor digitorum profundus under different proprioceptive conditions. J Physiol. 1997;502:693–701. doi: 10.1111/j.1469-7793.1997.693bj.x. [DOI] [PMC free article] [PubMed] [Google Scholar]
- Garnett R, Stephens JA. The reflex responses of single motor units in human first dorsal interosseous muscle following cutaneous afferent stimulation. J Physiol. 1980;303:351–364. doi: 10.1113/jphysiol.1980.sp013290. [DOI] [PMC free article] [PubMed] [Google Scholar]
- Gustafsson B, McCrea D. Influence of stretch-evoked synaptic potentials on firing probability of cat spinal motoneurones. J Physiol. 1984;347:431–451. doi: 10.1113/jphysiol.1984.sp015074. [DOI] [PMC free article] [PubMed] [Google Scholar]
- Jenner JR, Stephens JA. Cutaneous reflex responses and their central nervous pathways studied in man. J Physiol. 1982;333:405–419. doi: 10.1113/jphysiol.1982.sp014461. [DOI] [PMC free article] [PubMed] [Google Scholar]
- Kirkwood PA, Sears TA. The effects of single afferent impulses on the probability of firing of external intercostal motoneurones in the cat. J Physiol. 1982;322:315–336. doi: 10.1113/jphysiol.1982.sp014039. [DOI] [PMC free article] [PubMed] [Google Scholar]
- Miles TS, Le TH, Türker KS. Biphasic inhibitory responses and their IPSPs evoked by tibial nerve stimulation in human soleus motor neurones. Exp Brain Res. 1989a;77:637–645. doi: 10.1007/BF00249617. [DOI] [PubMed] [Google Scholar]
- Miles TS, Türker KS, Le TH. Ia reflexes and EPSPs in human soleus motor neurones. Exp Brain Res. 1989b;77:628–636. doi: 10.1007/BF00249616. [DOI] [PubMed] [Google Scholar]
- Moore GP, Segundo JP, Perkel DH, Levitan H. Statistical signs of synaptic interaction in neurons. Biophys J. 1970;10:876–900. doi: 10.1016/S0006-3495(70)86341-X. [DOI] [PMC free article] [PubMed] [Google Scholar]
- Okdeh AM, Lyons MF, Cadden SW. The study of jaw reflexes evoked by electrical stimulation of the lip: the importance of stimulus intensity and polarity. J Oral Rehabil. 1999;26:479–487. doi: 10.1046/j.1365-2842.1999.00407.x. [DOI] [PubMed] [Google Scholar]
- Poliakov AV, Powers RK, Binder MD. Functional identification of the input-output transforms of motoneurones in the rat and cat. J Physiol. 1997;504:401–424. doi: 10.1111/j.1469-7793.1997.401be.x. [DOI] [PMC free article] [PubMed] [Google Scholar]
- Poliakov AV, Powers RK, Sawczuk A, Binder MD. Effects of background noise on the response of rat and cat motoneurones to excitatory current transients. J Physiol. 1996;495:143–157. doi: 10.1113/jphysiol.1996.sp021580. [DOI] [PMC free article] [PubMed] [Google Scholar]
- Powers RK, Türker KS. Investigating the synaptic control of human motoneurons: New techniques, analyses and insights from animal models. In: Cope TC, editor. Motor Neurobiology of the Spinal Cord. New York: CRC Press; 2001. pp. 107–133. [Google Scholar]
- Rall W. Distinguishing theoretical synaptic potentials computed for different soma-dendritic distributions of synaptic input. J Neurophysiol. 1967;30:1138–1168. doi: 10.1152/jn.1967.30.5.1138. [DOI] [PubMed] [Google Scholar]
- Sawczuk A, Powers RK, Binder MD. Spike frequency adaptation studied in hypoglossal motoneurones of the rat. J Neurophysiol. 1995;73:1799–1810. doi: 10.1152/jn.1995.73.5.1799. [DOI] [PubMed] [Google Scholar]
- Semmler JG, Türker KS. Compound group I excitatory input is differentially distributed to motoneurons of the human tibialis anterior. Neurosci Lett. 1994;178:206–210. doi: 10.1016/0304-3940(94)90760-9. [DOI] [PubMed] [Google Scholar]
- Sonnenborg FA, Andersen OK, Arendt-Nielsen L. Modular organization of excitatory and inhibitory reflex receptive fields elicited by electrical stimulation of the foot sole in man. Clin Neurophysiol. 2000;111:2160–2169. doi: 10.1016/s1388-2457(00)00472-7. [DOI] [PubMed] [Google Scholar]
- Türker KS, Brodin P, Miles TS. Reflex responses of motor units in human masseter muscle to mechanical stimulation of a tooth. Exp Brain Res. 1994;100:307–315. doi: 10.1007/BF00227200. [DOI] [PubMed] [Google Scholar]
- Türker KS, Cheng HB. Motor-unit firing frequency can be used for the estimation of synaptic potentials in human motoneurones. J Neurosci Methods. 1994;53:225–234. doi: 10.1016/0165-0270(94)90181-3. [DOI] [PubMed] [Google Scholar]
- Türker KS, Powers RK. Effects of large excitatory and inhibitory inputs on motoneuron discharge rate and probability. J Neurophysiol. 1999;82:829–40. doi: 10.1152/jn.1999.82.2.829. [DOI] [PubMed] [Google Scholar]
- Türker KS, Powers RK. Effects of common excitatory and inhibitory inputs on motoneuron synchronization. J Neurophysiol. 2001;86:2807–2822. doi: 10.1152/jn.2001.86.6.2807. [DOI] [PubMed] [Google Scholar]
- Türker KS, Yang J, Brodin P. Conditions for excitatory or inhibitory masseteric reflexes elicited by tooth pressure in man. Arch Oral Biol. 1997a;42:121–128. doi: 10.1016/s0003-9969(96)00112-4. [DOI] [PubMed] [Google Scholar]
- Türker KS, Yang J, Scutter S. Tendon tap induces a single long lasting excitatory reflex in the motoneurons of human soleus muscle. Exp Brain Res. 1997b;115:169–173. doi: 10.1007/pl00005678. [DOI] [PubMed] [Google Scholar]
- van der Glas HW, Weytjens JL, De LA, Van SD, Pardaens JL. The influence of clenching level on the post-stimulus EMG complex, including silent periods, of the masseter muscles in man. Arch Oral Biol. 1984;29:51–58. doi: 10.1016/0003-9969(84)90042-6. [DOI] [PubMed] [Google Scholar]
- van Steenberghe D, van der Glas HW, De Laat A, Weytjens JL, Carels C, Bonte B. The masseteric poststimulus EMG complex (PSEC) in man: methodology, underlying reflexes and clinical perspectives) In: van Steenberghe D, De Laat A, editors. Electromyography of Jaw Reflexes in Man. Leuven: Leuven University Press; 1989. pp. 269–287. [Google Scholar]