

Abstract
Previous studies have disagreed about whether prostaglandin EP1 or EP3 receptors are critical for producing febrile responses. We therefore injected lipopolysaccharide (LPS) at a variety doses (1 μg kg−1−1 mg kg−1) intraperitoneally (I.P.) into wild-type (WT) mice and mice lacking the EP1 or the EP3 receptors and measured changes in core temperature (Tc) by using telemetry. In WT mice, I.P. injection of LPS at 10 μg kg−1 increased Tc about 1 °C, peaking 2 h after injection. At 100 μg kg−1, LPS increased Tc, peaking 5–8 h after injection. LPS at 1 mg kg−1 decreased Tc, reaching a nadir at 5–8 h after injection. In EP1 receptor knockout (KO) mice injected with 10 μg kg−1 LPS, only the initial (< 40 min) increase in Tc was lacking; with 100 μg kg−1 LPS the mice showed no febrile response. In EP3 receptor KO mice, LPS decreased Tc in a dose- and time-dependent manner. Furthermore, in EP3 receptor KO mice subcutaneous injection of turpentine did not induce fever. Both EP1 and EP3 receptor KO mice showed a normal circadian cycle of Tc and brief hyperthermia following psychological stress (cage-exchange stress and buddy-removal stress). The present study suggests that both the EP1 and the EP3 receptors play a role in fever induced by systemic inflammation but neither EP receptor is involved in the circadian rise in Tc or psychological stress-induced hyperthermia in mice.
Prostaglandin E2 (PGE2) is a principal mediator of fever (Blatteis & Sehic, 1997). For example, systemic administration of lipopolysaccharide (LPS), a bacterial endotoxin, is thought to produce fever by inducing cyclooxygenase-2, a rate limiting enzyme for PGE2 synthesis, by both venular endothelial cells (Yamagata et al. 2001; Ek et al. 2001; Schiltz & Sawchenko, 2002) and perivascular microglial cells (Elmquist et al. 1997; Schiltz & Sawchenko, 2002). PGE2 released into the brain may act on the neurons expressing E type prostaglandin (EP) receptors in the anteromedial preoptic area of the hypothalamus (POA) (Scammell et al. 1996) thus producing fever. There are four subtypes of EP receptors: EP1, EP2, EP3 and EP4 (Coleman et al. 1994). Among the four receptor subtypes, EP1, EP3 and EP4 receptors have been demonstrated within the rat POA (Oka et al. 2000), suggesting their possible role in febrile response. Previous pharmacological studies suggested the involvement of both EP1 and EP3 receptors in fever in rats, whereas EP4 agonists caused only hypothermia (Oka & Hori, 1994; Oka et al. 1997, 1998; Oka & Saper, 2003). In mice, however, intravenous injection of LPS failed to produce fever in animals lacking the EP3, but not animals lacking the EP1 or EP4 receptor genes (Ushikubi et al. 1998). Although this finding suggests that EP3 receptors play a crucial role in fever in mice, the study by Ushikubi and colleagues looked only at a limited time frame (1 h after administration) and a single fixed dose of LPS (10 mg kg-1), raising the question of whether other EP receptors may play a role under different conditions.
In rats, systemic administration of LPS is known to induce monophasic fever, multiphasic fever, or hypothermia depending on the dose, the route of administration, and the ambient temperature (Romanovsky et al. 1998a 1998b) and each phase is thought to be mediated by different neural mechanisms (Romanovsky, 2000; Szekely et al. 2000). Fever responses to LPS have not been documented as extensively in mice as in rats (Wang et al. 1997; Leon et al. 1997; Kozak et al. 1998; Li et al. 1999). However, the available data (Leon et al. 1997; Kozak et al. 1998) indicate that the dose of LPS is important, as LPS at 50–100 μg kg−1 induces fever whereas 2.5 mg kg−1 induces hypothermia. Therefore, we decided to document the changes in core body temperature (Tc) after LPS administration at a variety of doses in wild-type (WT) mice. Then, to test the roles of the different EP receptors in producing fever, we assessed the changes in Tc induced by LPS telemetrically over a > 10 h period under unrestrained and awake conditions in mice lacking the EP1 and EP3 receptors.
We then did parallel experiments in mice in which fever was induced by local inflammation, which may be mediated by different afferent neural pathways (Goldbach et al. 1997; Gourine et al. 2001) and cytokines (Leon et al. 1996, 1997) from systemic inflammation. Furthermore, we assessed the role of EP1 and EP3 receptors in circadian body temperature and psychological stress-induced hyperthermia as well because drugs that inhibit cyclooxygenase (COX) synthesis have been reported to attenuate the circadian rise in body temperature (Scales & Kluger, 1987) and open-field stress-induced hyperthermia (Singer et al. 1986; Kluger et al. 1987). These findings suggest the involvement of prostaglandin synthesis in circadian rhythms of body temperature and psychological stress-induced hyperthermia. However, to date it is not known which EP receptors might mediate such thermoregulatory responses.
Thus, the present study was undertaken to determine the role of EP1 and EP3 receptors in (1) circadian changes in body temperature, (2) various phases of LPS-induced fever, (3) local inflammation-induced fever, and (4) psychological stress-induced hyperthermia using mice lacking the EP1 and EP3 receptor genes.
METHODS
Animals
Male C57BL/6 strain mice (24–33 g) (SLC, Inc., Shizuoka, Japan) were used. Mice lacking either the EP1 or EP3 receptor genes were generated as reported previously (Ushikubi et al. 1998) and were backcrossed to the C57BL/6 strain for five generations. Homozygote and wild-type mice of the second and third generation from this strain were used. To determine the genotype of each mouse, PCR analysis was performed on DNA extracted from the tails of neonates as described previously (Ushikubi et al. 1998). Mice were housed in a light- (12 h on/off; lights on at 7.00 h) and temperature- (22–24 °C) controlled and specific pathogen-free facility, with food and water available ad libitum. All experiments were approved by the Harvard Medical School and Beth Israel Deaconess Medical Center Institutional Animal Care and Use Committees.
Surgery and monitoring Tc
Surgery for implanting telemetry transmitters was done under anaesthesia with chloral hydrate (350 mg kg−1, I.P.). Using aseptic techniques, a temperature transmitter (TA-F20, Data Sciences International, Saint Paul, MN, USA) was placed in the peritoneal cavity via a midline incision. After surgery, mice were housed in a cage (dimensions: 27 × 17 × 13 cm) individually in a sound-attenuated room and were handled daily (5–7 days) to minimize stress during the actual injection procedures. Tc was monitored telemetrically, starting at least 24 h before drug injection to assess baseline Tc. The Tc signals were received by an antenna below the mice cage and relayed to a signal processor (Data Quest III System, Mini Mitter Co., Sun River, OR, USA) connected to a Compaq computer. Tc was monitored every 1 min.
Experiment 1. Circadian changes in Tc
Seven days after surgery, Tc was monitored for 2 days. After observation, these mice were used for the following experiments.
Experiment 2. Effects of intraperitoneal (I.P.) injection of LPS on Tc
Two groups of mice were injected intraperitoneally with LPS from Salmonella typhimurium (1 μg kg−1, 10 μg kg−1, 100 μg kg−1, or 1 mg kg−1 in 0.15 ml) (Sigma, St Louis, MO, USA; lot 23H4047) or 0.15 ml of pyrogen-free 0.9 % saline (PFS) (Sigma). LPS was dissolved in PFS. Injections were given between 9.00 h and 9.10 h. The dose of LPS was determined based upon an earlier study (Romanovsky et al. 1996). As the LPS at 0.1 μg kg−1 did not induce significant changes in Tc in the pilot study, only the results of LPS at 1 μg kg−1−1 mg kg−1 are shown.
Experiment 3. Effects of subcutaneous (S.C.) injection of turpentine on Tc
Two groups of mice were injected subcutaneously with 0.15 ml of turpentine oil (Spectrum Quality Products, Inc., New Brunswick, NJ, USA) or PFS into the left thigh. Injections were given between 9.00 h and 9.10 h.
Experiment 4. Effects of cage-exchange stress on Tc
Cage-exchange stress was evoked by exchanging the home cages of two mice. The control mice were just replaced in the same cages. This experiment was done between 11.00 h and 14.00 h when the circadian changes in Tc were minimal.
Experiment 5. Effects of buddy-removal stress on Tc
This stress model is a modified form of the putative ‘anticipatory anxiety stress-induced hyperthermia’ model of Zethof and colleagues (Zethof et al. 1994, 1995). Five days after surgery, mice (24–25 g) were returned to the cages in which they had previously been housed in a group (n = 5 per cage; 1 operated, 4 unoperated). Three to five days after group housing, each of the four unoperated mice were removed, one by one, every 2 min. This experiment was done between 11.00 h and 14.00 h.
Data analysis
The values are presented as means ±s.e.m. Significant differences were assessed by one-way analysis of variance followed by Dunnett's test or Student's t test for unmatched data. A difference was considered to be significant if P < 0.05.
RESULTS
Diurnal changes in Tc
Wild-type (WT), EP1 receptor KO, and EP3 receptor KO mice showed nearly identical diurnal changes in Tc, i.e. increased Tc during the dark period. The Tc did not differ among the three groups at any time point (Fig. 1).
Figure 1. Circadian changes in Tc in WT (○), EP1 receptor KO (•) and EP3 receptor KO (▴) mice.

Each point represents mean ±s.e.m.n = number of animals. Bar shows dark period. There was no significant difference among the three groups.
Dose-dependent effect of I.P. injection of LPS on Tc
The initial Tc at time zero did not differ in any group. Intraperitoneal injection of 0.9 % saline induced a transient increase in Tc of about 1 °C at 20 min after injection, which then decreased to the initial Tc within 60 min in all mice. Tc increased again at the beginning of the dark period (600 min after injection) in all mice.
LPS at 1 μg kg−1 (Fig. 2) induced two small peaks in Tc in the WT mice, at 100–160 min and 220–240 min after injection. In the EP1 receptor KO mice there was a similar response, with the largest increase (1.1 ± 0.2 °C) 120 min after injection. However, in the EP3 receptor KO mice the increase in Tc seen 20 min after injection was significantly blunted and the subsequent elevations in Tc did not occur.
Figure 2. Effects of I.P. injection of LPS at 1 μg kg−1 on Tc in WT (A), EP1 receptor KO (B) and EP3 receptor KO (C) mice.
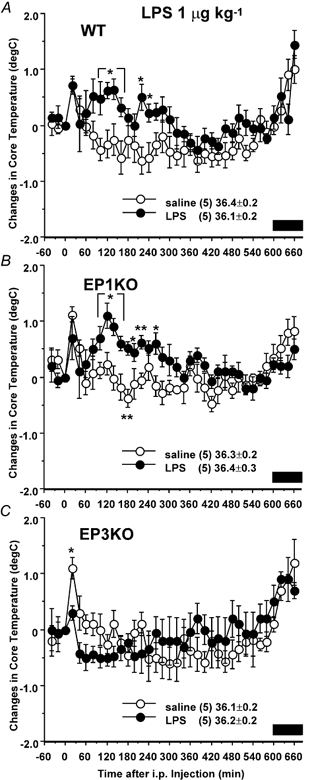
Mice were injected with LPS (•) or 0.9 % saline (○) at time zero. The data are expressed as differences from the Tc at time zero, which is shown in the figure. Each point represents mean ±s.e.m.n = number of animals. Bar shows dark period. Symbols represent level of significance when compared with 0.9 % saline-injected control at each time point. *P < 0.05; **P < 0.01.
LPS at 10 μg kg−1 (Fig. 3) caused an elevation of Tc in the WT mice at 60–260 min after injection, with the peak (1.0 ± 0.2 °C) 120 min after injection. In the EP1 receptor KO mice the early rise in Tc (20–40 min after injection) was blunted, but this was followed by an increase of about 1 °C in Tc that peaked 120–140 min after injection. By contrast, the EP3 receptor KO mice showed a blunting of the initial hyperthermia, followed by a hypothermic response with a decrease in Tc of about 1.0 °C from 40–140 min after injection.
Figure 3. Effects of I.P. injection of LPS at 10 μg kg−1 on Tc in WT (A), EP1 receptor KO (B) and EP3 receptor KO (C) mice.
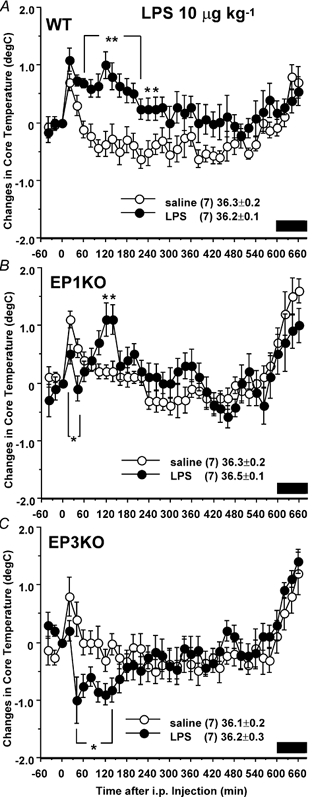
Mice were injected with LPS (•) or 0.9 % saline (○) at time zero. The data are expressed as differences from the Tc at time zero, which is shown in the figure. Each point represents mean ±s.e.m.n = number of animals. Bar shows dark period. Symbols represent level of significance when compared with 0.9 % saline-injected control at each time point. *P < 0.05; **P < 0.01.
At 100 μg kg−1, LPS (Fig. 4) caused an increase in Tc in the WT mice from 260 to 600 min after injection, with a peak of 1.0 ± 0.2 °C 380 min after injection. In the EP1 receptor KO mice Tc did not differ from the control saline-treated animals, whereas the EP3 receptor KO mice demonstrated a blunting of the initial hyperthermia and then a subsequent profound fall in Tc of about 2.0 °C from 40 to 540 min after injection
Figure 4. Effects of I.P. injection of LPS at 100 μg kg−1 on Tc in WT (A), EP1 receptor KO (B) and EP3 receptor KO (C) mice.

Mice were injected with LPS (•) or 0.9 % saline (○) at time zero. The data are expressed as differences from the Tc at time zero, which is shown in the figure. Each point represents mean ±s.e.m.n = number of animals. Bar shows dark period. Symbols represent level of significance when compared with 0.9 % saline-injected control at each time point. *P < 0.05; **P < 0.01.
Finally, the 1 mg kg−1 dose of LPS (Fig. 5) caused a biphasic hypothermic response in the WT mice, with a fall in Tc of about 1.5 °C from 40 to 80 min after injection, and a second phase with more profound hypothermia from 180 to 500 min, with the maximal decrease (−4.0 ± 0.9 °C) at 320 min after injection. In the EP1 receptor KO mice, the first phase of hypothermia was absent, and the second phase was similar if less intense than in the WT animals, reaching a nadir (−3.5 ± 1.0 °C) 280 min after injection. The EP3 receptor KO mice, by comparison, showed a much more intense triphasic hypothermia, with a decrease in Tc of about 2 °C during the first 2 h, followed by a profound fall to a maximal decrease of −6.8 ± 1.2 °C at 360 min after injection. The Tc then increased by 4–5 °C by 540 min after injection, but remained about 2 °C below baseline for the remainder of the 12 h period of observation.
Figure 5. Effects of I.P. injection of LPS at 1 mg kg−1 on Tc in WT (A), EP1 receptor KO (B) and EP3 receptor KO (C) mice.

Mice were injected with LPS (•) or 0.9 % saline (○) at time zero. The data are expressed as differences from the Tc at time zero, which is shown in the figure. Each point represents mean ±s.e.m.n = number of animals. Bar shows dark period. Symbols represent level of significance when compared with 0.9 % saline-injected control at each time point. *P < 0.05; **P < 0.01.
In summary, the EP3 receptor KO mice failed to show a hyperthermic response to LPS at any dose, but rather demonstrated only hypothermic responses that became more profound and more prolonged as the dose of LPS increased. The EP1 receptor KO mice had a more complex response, which varied at different dosages of LPS. At 1 μg kg−1 of LPS, their fever curve was very similar to WT animals. However at the 10 μg kg-−1 dose the hyperthermia was briefer, and at 100 μg kg−1 there was no fever response at all. The 1 mg kg−1 dose caused a hypothermic response that was similar to, but less intense than that seen in WT mice.
Effect of S.C. injection of turpentine on Tc
Following turpentine injection, the WT and EP1 receptor KO mice showed nearly identical responses, with higher Tc than saline-injected animals at the end of the first light period (from 9 to 10 h after injection) and during the second light period (from 24 to 33 h), but lower Tc during the second dark period (from 38 to 44 h). In contrast, in the EP3 receptor KO mice, the turpentine-injected group showed reduced Tc 1 h after injection and then during the dark periods for the next 2 days (Fig. 6).
Figure 6. Effects of S.C. injection of turpentine on Tc in WT (A), EP1 receptor KO (B) and EP3 receptor KO (C) mice.

Mice were injected with turpentine (•) or 0.9 % saline (○) at 9.00 h (arrows). The data are expressed as differences from the Tc at time zero, which is shown in the figure. Each point represents mean ±s.e.m.n = number of animals. Bar shows dark period. Symbols represent level of significance when compared with 0.9 % saline-injected control at each time point. *P < 0.05; **P < 0.01.
Effect of cage-exchange stress on Tc
Cage-exchange stress induced about a 2 °C increase in Tc within 20 min, gradually falling to an increase of about 1 °C at the end of the second hour when compared with control animals in the WT, EP1 receptor KO, and EP3 receptor KO mice. The degree of the maximal increase did not differ among the three groups (Fig. 7).
Figure 7. Effects of cage-exchange stress on Tc in WT (A), EP1 receptor KO (B) and EP3 receptor KO (C) mice.
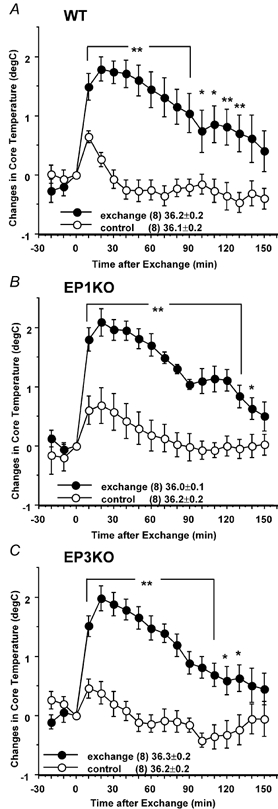
Cages of two mice were exchanged (•), or mice were removed and replaced in the same cages (○) as a control at time zero. The data are expressed as differences from the Tc at time zero, which is shown in the figure. Each point represents mean ±s.e.m.n = number of animals. Symbols represent level of significance when compared with control at each time point. *P < 0.05; **P < 0.01.
Effect of buddy-removal stress on Tc
In the WT mice, successive removal of four cage mates induced a 1.3 ± 0.1 °C increase in Tc in the remaining mouse within 20 min (Fig. 8A). Both the EP1 receptor KO and EP3 receptor KO mice showed a similar increase in Tc and the maximal Tc did not differ among the three groups (Fig. 8B).
Figure 8. Effects of buddy-removal stress on Tc in WT, EP1 receptor KO and EP3 receptor KO mice.
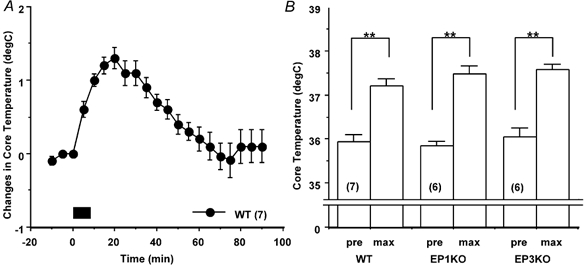
A, four out of five WT mice were removed from their home cage every 2 min, which started at time zero (bar). The time course of changes in Tc of the remained mouse is expressed as differences from the Tc at time zero. B, the maximal increases in Tc (max) induced by removing four mice from groups of five WT, EP1 receptor KO and EP3 receptor KO mice. Each point represents mean ±s.e.m.n = number of animals. Symbols adjacent to columns represent level of significance when compared with Tc at time zero (pre). *P < 0.05; **P < 0.01.
DISCUSSION
The present study demonstrated that (1) diurnal changes in Tc of both EP1 receptor KO and EP3 receptor KO mice are not different from those of WT mice, (2) EP3 receptor KO mice do not produce febrile responses but in fact are hypothermic after either I.P. injection of LPS or S.C. injection of turpentine, whereas, in the EP1 receptor KO mice, LPS-induced fever is partially attenuated, (3) both EP1 receptor KO mice and EP3 receptor KO mice demonstrate hyperthermia due to cage-exchange stress and buddy-removal stress that is identical to WT mice. These findings suggest a crucial role for EP3 receptors in causing fever at low dosages of LPS (1 and 10 μg kg−1) and in the first 36 h after turpentine injection, and in limiting or preventing hypothermia at higher dosages of LPS (100 and 1000 μg kg−1) and between 36 and 48 h after turpentine injection. EP3 receptors, however, are not involved in the circadian rhythm of Tc or in psychological stress-induced hyperthermia in mice. EP1 receptors, on the other hand, play a more subtle role in the pathogenesis of fever. They are particularly important in the late phase of fever (240–600 min) after intermediate (100 μg kg−1) doses of LPS, but do not seem to be important for changes in Tc during local inflammation or stress, nor in circadian rhythms of Tc.
Baseline Tc and circadian changes in Tc
In the present study, the baseline Tc of EP1 and EP3 receptor KO mice did not differ from WT mice, suggesting neither EP1 nor EP3 receptors are critical for maintaining normal body temperature. This finding is in agreement with a previous finding that antipyretic drugs failed to alter normal body temperature in rhesus monkeys (Barney & Elizondo, 1981). In rats, however, prostaglandin synthesis inhibitors such as indomethacin decreased Tc at night in spite of having little effect on Tc during the day (Scales & Kluger, 1987), suggesting a contribution of prostaglandins (PGs) to the circadian rise in Tc. If this is also the case in mice, a circadian rise in Tc must involve prostanoid receptors other than EP1 or EP3.
LPS fever and hypothermia
Systemic administration of LPS produces monophasic fever, multiphasic fever or hypothermia depending upon the dose in rats (Romanovsky et al. 1998a 1998b). LPS-induced multiphasic fever consists of at least three phases in rats with Tc peaking 1, 2 and 5 h after injection when animals are restrained and held at 30 °C (Romanovsky et al. 1998b). For unrestrained rats at 23 °C, the first peak is not seen (Elmquist et al. 1996). Different neural mechanisms are thought to be involved in each phase, i.e. capsaicin-sensitive afferent fibres (either non-vagal or both non-vagal and vagal) in the 1st phase and vagal efferent fibres in the 3rd phase (Romanovsky, 2000; Szekely et al. 2000). However, studies on the effects of LPS on Tc in mice have been more limited (Wang et al. 1997; Leon et al. 1997; Kozak et al. 1998; Li et al. 1999) and comparable data on the extensive dosing range described in rats (0.1 μg kg−1- 1 mg kg−1) have not been reported (Romanovsky et al. 1996). Therefore, we injected a wide range of doses of LPS (0.1 μg kg−1−1 mg kg−1, I.P.) into unrestrained mice at 23 °C and found at least four phases of Tc response: a peak at 20 min which appears to be due to handling (because it is seen even after PFS injection); an elevation at 40–80 min (which was missing in EP1 receptor KO mice and may correspond to the 1st phase in rats); and peaks at 2 h and 5–8 h post-injection in WT mice that may correspond to the 2nd and 3rd phases, respectively, in rats.
A previous study examining restrained mice at an ambient temperature of 25 °C showed that the fever peak 20 min after injecting 10 mg kg−1 LPS intravenously was absent in the EP3 receptor KO mice but not EP1 receptor KO mice (Ushikubi et al. 1998). The EP3 receptor KO animals showed normal thermogenic responses to being restrained (as in our stress-handling experiments). It is difficult to compare the previous experiments with the present ones, as in the current study the mice were handled briefly to inject LPS I.P. and the stress fever in our study coincided with the temperature elevation 20 min after LPS injection in the Ushikubi et al. study (1998). However, the EP3 receptor KO mice in our study did have a lower Tc at 20 min after the 1, 10 or 100 μg kg−1 LPS, compared with WT mice.
In addition, because the animals were studied at lower ambient temperature and for a longer period of time, the present study revealed that in the EP3 receptor KO mice LPS decreased Tc in a dose-dependent manner and that LPS (1 mg kg−1) induced hypothermia that was more profound than that seen in WT and EP1 receptor KO mice. These findings suggest that EP3 receptors are involved in all phases of LPS-induced hyperthermia, and their absence unmasks a hypothermic process that predominates even at moderate dosages of LPS (10 μg kg−1). LPS-induced hypothermia is also attenuated by type 2 cyclooxygenase inhibitors, but exacerbated by type 1 inhibitors (Zhang et al. 2003). The prostanoid species, site of action, and prostanoid receptor type that produce the hypothermic response to LPS are not known. However, EP3 receptors appear to have an inhibitory effect on LPS-induced hypothermia, and thus clearly are not involved in producing it.
In contrast, we found that, in EP1 receptor KO mice, the second phase of fever at 40–80 min after 10 μg kg−1 LPS was blunted and the 4th phase of fever at 240–600 min after 100 μg kg−1 LPS was eliminated. Again, the present experiments are not directly comparable to those of Ushikubi et al. (1998) because the conditions were quite different and the late changes in Tc occurred at time points beyond the 1 h window used in their study. Previous studies in rats have shown that intracerebroventricular (I.C.V.) administration of an EP1 receptor agonist caused a rapid-onset fever within 10–20 min that lasts for > 2 h (Oka et al. 2003). These observations are consistent with the action of PGE2 on EP1 receptors playing an important role in the early components of fever response to low doses of LPS, and in the late part of the response at higher dosages. EP1 receptor KO animals also had a profound hypothemic response, similar to WT animals, at high dosages of LPS, indicating that the EP1 receptors also are not necessary for this hypothermic action of LPS.
An alternative explanation for some of our findings might be a defect in prostaglandin synthesis, caused by the absence of either EP1 or EP3 receptors (e.g. if downstream signalling from either receptor influences PGE2 synthesis). However, we did not measure prostaglanin levels in the brain, and hence this remains a subject for future investigation.
Turpentine-induced fever
Systemic inflammatory stimuli (e.g. systemic LPS injection) may cause fever by mechanisms that are different from those activated by local inflammation (e.g. s.c. injection of turpentine or intramuscular injection of LPS; see Goldbach et al. 1997; Gourine et al. 2001; Leon et al. 1996). For example, subdiaphragmatic vagotomy attenuates I.P. LPS-induced fever but not intramuscular LPS-induced fever in guinea-pigs (Goldbach et al. 1997). Destruction of capsaicin-sensitive neurons exaggerates I.P. LPS fever but not fever induced by local inflammation due to injection of Freund's incomplete adjuvant in rats (Gourine et al. 2001). Mice with IL-1 type I receptor deletion produce fever identical to WT mice after I.P. injection of LPS, but do not produce fever after s.c. turpentine (Leon et al. 1996).
The present study showed that the fever about 10 h after S.C. turpentine was blocked only in the EP3 receptor KO mice. Thus, the EP3 receptor may play a role in fever due to local inflammation. However, S.C. turpentine also suppressed the normal circadian rise in Tc during the first dark period after injection in EP3 receptor KO mice. The mechanism for this response is not known but similar phenomena have also been seen in turpentine-injected IL-6 KO mice (Kozak et al. 1997).
Psychological stress-induced hyperthermia
Models of hyperthermia induced by psychological stress have two distinct mechanisms: some models are PG dependent and others are not (Oka et al. 2001). We, therefore, tested both types of models: the cage-exchange stress tested the PG-dependent model (Singer et al. 1986; Kluger et al. 1987; Morimoto et al. 1991) and the modified form of the putative ‘anticipatory anxiety’ stress (Zethof et al. 1995) tested the PG-independent model.
Previous studies showed that cage-exchange stress caused increased plasma PGE2 levels in rats (Morimoto et al. 1991) and that the hyperthermia it induced was attenuated by COX inhibitors (Singer et al. 1986; Kluger et al. 1987; Morimoto et al. 1991). In contrast, hyperthermia in the anticipatory anxiety model was not blocked by COX inhibitors but was blocked by serotonin (5-HT) 1A receptor agonists in mice (Zethof et al. 1994, 1995). In both types of models, a central noradrenergic component was involved (Lecci et al. 1990; Nakamori et al. 1993; Soszynski et al. 1996).
As most 5-HT and noradrenaline neurons exhibit EP3 receptor-like immunoreactivity (Nakamura et al. 2001), we hypothesized that either or both models might be attenuated in the EP3 receptor KO mice. However, EP3 receptor KO mice responded in both protocols with a hyperthermia identical to WT and EP1 receptor KO mice. Thus, the present findings suggest that the EP3 or EP1 receptors are not involved in psychological stress-induced hyperthermia, at least in these two models, and that the mechanism of psychological stress-induced hyperthermia is different from that of immune challenge-induced fever.
Localization of EP receptors involved in producing fever
Our results show that both the EP1 and EP3 receptors appear to play a role in producing different phases of fever. However, it is not clear where in the body the receptors are located that produce these responses.
It is known, for example that injection of E-type PGs into the anterior tip of the preoptic area near the wall of the third ventricle can induce fever responses (Williams et al. 1977; Stitt, 1991; Scammell et al. 1996) and that injection of a cyclooxygenase inhibitor into this region attenuates intravenous LPS fever responses (Scammell et al. 1998). Both EP1 and EP3 receptors are located in the paramedian preoptic region and so could mediate the fever response at that level.
However, neither preoptic COX inhibitor injections nor lesions entirely prevent fever responses (Lipton & Trzcinka, 1976; Matsumura et al. 1998). Considering these observations, one may speculate that EP receptors at other levels of the nervous system and perhaps some peripheral sites may also contribute to the response. For example, EP3 receptors have been found in the raphe pallidus region (Ek et al. 2000; Nakamura et al. 2001), which regulates the sympathetic response in brown adipose tissue during fever responses (Morrison, 1999). EP3 receptor mRNA or immunoreactivity has also been found on vagal afferents in the nucleus of the solitary tract and in the intermediolateral cell column in the spinal cord (Nakamura et al. 2000; Ek et al. 2000). It is also possible that EP3 receptors may be found on peripheral cell types involved in preventing the profound hypothermia that accompanies injection of large (1 mg kg−1) doses of LPS in mice at 23 °C. For example, there is evidence from injection of antibodies against TNFα that much of the hypothermic response is due to the action of TNFα, presumably causing peripheral systemic vasodilatation that is not centrally mediated (Kozak et al. 1995). If the white blood cells and macrophages secreting TNFα have EP3 receptors that limit their response, the absence of the EP3 receptor could result in a more profound hypothermic response to LPS.
We have not yet performed similar studies in mice with deletion of the EP2 or EP4 receptor genes. It would be interesting to test fever responses in EP4 receptor KO mice because most of the POA and paraventricular hypothalamic neurons that show Fos expression after LPS injection also express EP4 receptors (Oka et al. 2000). Lesions of the paraventricular nucleus do attenuate fever responses, but lesions of the region containing the POA cells that express EP4 receptors do not (Lu et al. 2000, 2001). In addition, intracerebroventricular injection of an EP4 receptor agonist decreases the Tc in rats (Oka et al. 2003), suggesting that EP4 receptors in the brain may be involved in hypothermic but not hyperthermic responses to LPS.
A key focus for future studies will be on the locations of the different EP receptors that are involved in causing fever responses. As opposed to the constitutive knockout animals that we used, in which a gene is absent throughout development and in every body tissue, it will be useful to have animals with conditional knockouts or knockins of EP receptors. Such animals will provide important opportunities to establish the location of sites where the EP receptors play a role in the complex process that regulates Tc after administration of LPS.
Acknowledgments
This study was supported by NIH grant NS33987.
REFERENCES
- Barney CC, Elizondo RS. Prostaglandins and temperature regulation in the rhesus monkey. J Appl Physiol. 1981;50:1248–1254. doi: 10.1152/jappl.1981.50.6.1248. [DOI] [PubMed] [Google Scholar]
- Blatteis CM, Sehic E. Prostaglandin E2: A putative fever mediator. In: Mackowiak PA, editor. Fever Basic Mechanisms and Management. Philadelphia: Blackwell Science Inc; 1997. pp. 117–145. [Google Scholar]
- Coleman RA, Smith WL, Narumiya S. International Union of Pharmacology classification of prostanoid receptors: properties, distribution, and structure of the receptors and their subtypes. Pharmacol Rev. 1994;46:205–229. [PubMed] [Google Scholar]
- Ek M, Arias C, Sawchenko P, Ericsson-Dahlstrand A. Distribution of the EP3 prostaglandin E(2) receptor subtype in the rat brain: relationship to sites of interleukin-1-induced cellular responsiveness. J Comp Neurol. 2000;428:5–20. doi: 10.1002/1096-9861(20001204)428:1<5::aid-cne2>3.0.co;2-m. [DOI] [PubMed] [Google Scholar]
- Ek M, Engblom D, Saha S, Blomqvist A, Jakobsson PJ, Ericsson-Dahlstrand A. Inflammatory response: pathway across the blood-brain barrier. Nature. 2001;410:430–431. doi: 10.1038/35068632. [DOI] [PubMed] [Google Scholar]
- Elmquist JK, Breder CD, Sherin JE, Scammell TE, Hickey WF, Dewitt D, Saper CB. Intravenous lipopolysaccharide induces cyclooxygenase 2-like immunoreactivity in rat brain perivascular microglia and meningeal macrophages. J Comp Neurol. 1997;381:119–129. doi: 10.1002/(sici)1096-9861(19970505)381:2<119::aid-cne1>3.0.co;2-6. [DOI] [PubMed] [Google Scholar]
- Elmquist JK, Scammell TE, Jacobson CD, Saper CB. Distribution of Fos-like immunoreactivity in the rat brain following intravenous lipopolysaccharide administration. J Comp Neurol. 1996;371:85–103. doi: 10.1002/(SICI)1096-9861(19960715)371:1<85::AID-CNE5>3.0.CO;2-H. [DOI] [PubMed] [Google Scholar]
- Goldbach JM, Roth J, Zeisberger E. Fever suppression by subdiaphragmatic vagotomy in guinea pigs depends on the route of pyrogen administration. Am J Physiol. 1997;272:R675–681. doi: 10.1152/ajpregu.1997.272.2.R675. [DOI] [PubMed] [Google Scholar]
- Gourine AV, Rudolph K, Korsak AS, Kubatko J, Tesfaigzi J, Kozak W, Kluger MJ. Role of capsaicin-sensitive afferents in fever and cytokine responses during systemic and local inflammation in rats. Neuroimmunomodulation. 2001;9:13–22. doi: 10.1159/000049003. [DOI] [PubMed] [Google Scholar]
- Kluger MJ, O'Reilly B, Shope TR, Vander AJ. Further evidence that stress hyperthermia is a fever. Physiol Behav. 1987;39:763–766. doi: 10.1016/0031-9384(87)90263-0. [DOI] [PubMed] [Google Scholar]
- Kozak W, Archuleta I, Mayfield KP, Kozak A, Rudolph K, Kluger MJ. Inhibitors of alternative pathways of arachidonate metabolism differentially affect fever in mice. Am J Physiol. 1998;275:R1031–1040. doi: 10.1152/ajpregu.1998.275.4.R1031. [DOI] [PubMed] [Google Scholar]
- Kozak W, Conn CA, Klir JJ, Wong GH, Kluger MJ. TNF soluble receptor and antiserum against TNF enhance lipopolysaccharide fever in mice. Am J Physiol. 1995;269:R23–29. doi: 10.1152/ajpregu.1995.269.1.R23. [DOI] [PubMed] [Google Scholar]
- Kozak W, Poli V, Soszynski D, Conn CA, Leon LR, Kluger MJ. Sickness behavior in mice deficient in interleukin-6 during turpentine abscess and influenza pneumonitis. Am J Physiol. 1997;272:R621–630. doi: 10.1152/ajpregu.1997.272.2.R621. [DOI] [PubMed] [Google Scholar]
- Lecci A, Borsini F, Volterra G, Meli A. Pharmacological validation of a novel animal model of anticipatory anxiety in mice. Psychopharmacology. 1990;101:255–261. doi: 10.1007/BF02244136. [DOI] [PubMed] [Google Scholar]
- Leon LR, Conn CA, Glaccum M, Kluger MJ. IL-1 type I receptor mediates acute phase response to turpentine, but not lipopolysaccharide, in mice. Am J Physiol. 1996;271:R1668–1675. doi: 10.1152/ajpregu.1996.271.6.R1668. [DOI] [PubMed] [Google Scholar]
- Leon LR, Kozak W, Peschon J, Kluger MJ. Exacerbated febrile responses to LPS, but not turpentine, in TNF double receptor-knockout mice. Am J Physiol. 1997;272:R563–569. doi: 10.1152/ajpregu.1997.272.2.R563. [DOI] [PubMed] [Google Scholar]
- Li S, Wang Y, Matsumura K, Ballou LR, Morham SG, Blatteis CM. The febrile response to lipopolysaccharide is blocked in cyclooxygenase- 2(−/−), but not in cyclooxygenase-1(−/−) mice. Brain Res. 1999;825:86–94. doi: 10.1016/s0006-8993(99)01225-1. [DOI] [PubMed] [Google Scholar]
- Lipton JM, Trzcinka GP. Persistence of febrile response to pyrogens after PO/AH lesions in squirrel monkeys. Am J Physiol. 1976;231:1638–1648. doi: 10.1152/ajplegacy.1976.231.6.1638. [DOI] [PubMed] [Google Scholar]
- Lu J, Greco MA, Shiromani P, Saper CB. Effect of lesions of the ventrolateral preoptic nucleus on NREM and REM sleep. J Neurosci. 2000;20:3830–3842. doi: 10.1523/JNEUROSCI.20-10-03830.2000. [DOI] [PMC free article] [PubMed] [Google Scholar]
- Lu J, Zhang Y-H, Chou TC, Gaus SE, Elmquist JK, Shiromani P, Saper CB. Contrasting effects of ibotenate lesions of the paraventricular nucleus and subparaventricular zone on sleep-wake cycle and temperature regulation. J Neurosci. 2001;21:4864–4874. doi: 10.1523/JNEUROSCI.21-13-04864.2001. [DOI] [PMC free article] [PubMed] [Google Scholar]
- Matsumura K, Cao C, Watanabe Y, Watanabe Y. Prostaglandin system in the brain: sites of biosynthesis and sites of action under normal and hyperthermic states. Prog Brain Res. 1998;115:275–295. doi: 10.1016/s0079-6123(08)62040-3. [DOI] [PubMed] [Google Scholar]
- Morimoto A, Watanabe T, Morimoto K, Nakamori T, Murakami N. Possible involvement of prostaglandins in psychological stress-induced responses in rats. J Physiol. 1991;443:421–429. doi: 10.1113/jphysiol.1991.sp018841. [DOI] [PMC free article] [PubMed] [Google Scholar]
- Morrison SF. RVLM and raphe differentially regulate sympathetic outflows to splanchnic and brown adipose tissue. Am J Physiol. 1999;276:R962–973. doi: 10.1152/ajpregu.1999.276.4.R962. [DOI] [PubMed] [Google Scholar]
- Nakamori T, Morimoto A, Morimoto K, Tan N, Murakami N. Effects of alpha- and beta-adrenergic antagonists on rise in body temperature induced by psychological stress in rats. Am J Physiol. 1993;264:R156–161. doi: 10.1152/ajpregu.1993.264.1.R156. [DOI] [PubMed] [Google Scholar]
- Nakamura K, Kaneko T, Yamashita Y, Hasegawa H, Katoh H, Negishi M. Immunohistochemical localization of prostaglandin EP3 receptor in the rat nervous system. J Comp Neurol. 2000;421:543–569. doi: 10.1002/(sici)1096-9861(20000612)421:4<543::aid-cne6>3.0.co;2-3. [DOI] [PubMed] [Google Scholar]
- Nakamura K, Li Y, Kaneko T, Katoh H, Negishi M. Prostaglandin EP3 receptor protein in serotonin and catecholamine cell groups: a double immunofluorescence study in the rat brain. Neuroscience. 2001;103:763–775. doi: 10.1016/s0306-4522(01)00027-6. [DOI] [PubMed] [Google Scholar]
- Oka K, Hori T. EP-1 receptor mediation of prostaglandin E2-induced hyperthermia in rats. Am J Physiol. 1994;267:R289–294. doi: 10.1152/ajpregu.1994.267.1.R289. [DOI] [PubMed] [Google Scholar]
- Oka K, Oka T, Hori T. Prostaglandin E2 may induce hyperthermia through EP1 receptor in the anterior wall of the third ventricle and neighboring preoptic regions. Brain Res. 1997;767:92–99. doi: 10.1016/s0006-8993(97)00562-3. [DOI] [PubMed] [Google Scholar]
- Oka K, Oka T, Hori T. PGE2 receptor subtype EP1 antagonist may inhibit central interleukin-1beta-induced fever in rats. Am J Physiol. 1998;275:R1762–1765. doi: 10.1152/ajpregu.1998.275.6.R1762. [DOI] [PubMed] [Google Scholar]
- Oka T, Oka K, Hori T. Mechanisms and mediators of psychological stress-induced rise in core temperature. Psychosom Med. 2001;63:476–486. doi: 10.1097/00006842-200105000-00018. [DOI] [PubMed] [Google Scholar]
- Oka T, Oka K, Saper CB. Contrasting effects of E type of prostaglandin (EP) receptor agonists on core temperature in rats. Brain Res. 2003;968:256–262. doi: 10.1016/s0006-8993(03)02268-6. [DOI] [PubMed] [Google Scholar]
- Oka T, Oka K, Scammell TE, Lee C, Kelly JF, Nantel F, Elmquist JK, Saper CB. Relationship of EP(1–4) prostaglandin receptors with rat hypothalamic cell groups involved in lipopolysaccharide fever responses. J Comp Neurol. 2000;428:20–32. doi: 10.1002/1096-9861(20001204)428:1<20::aid-cne3>3.0.co;2-x. [DOI] [PubMed] [Google Scholar]
- Romanovsky AA. Thermoregulatory manifestations of systemic inflammation: lessons from vagotomy. Auton Neurosci. 2000;85:39–48. doi: 10.1016/S1566-0702(00)00218-6. [DOI] [PubMed] [Google Scholar]
- Romanovsky AA, Kulchitsky VA, Akulich NV, Koulchitsky SV, Simons CT, Sessler DI, Gourine VN. First and second phases of biphasic fever: two sequential stages of the sickness syndrome. Am J Physiol. 1996;271:R244–253. doi: 10.1152/ajpregu.1996.271.1.R244. [DOI] [PubMed] [Google Scholar]
- Romanovsky AA, Kulchitsky VA, Simons CT, Sugimoto N. Methodology of fever research: why are polyphasic fevers often thought to be biphasic? Am J Physiol. 1998a;275:R332–338. doi: 10.1152/ajpregu.1998.275.1.R332. [DOI] [PubMed] [Google Scholar]
- Romanovsky AA, Simons CT, Kulchitsky VA. Biphasic fevers often consist of more than two phases. Am J Physiol. 1998b;275:R323–331. doi: 10.1152/ajpregu.1998.275.1.R323. [DOI] [PubMed] [Google Scholar]
- Scales WE, Kluger MJ. Effect of antipyretic drugs on circadian rhythm in body temperature of rats. Am J Physiol. 1987;253:R306–313. doi: 10.1152/ajpregu.1987.253.2.R306. [DOI] [PubMed] [Google Scholar]
- Scammell TE, Elmquist JK, Griffin JD, Saper CB. Ventromedial preoptic prostaglandin E2 activates fever-producing autonomic pathways. J Neurosci. 1996;16:6246–6254. doi: 10.1523/JNEUROSCI.16-19-06246.1996. [DOI] [PMC free article] [PubMed] [Google Scholar]
- Scammell TE, Griffin JD, Elmquist JK, Saper CB. Microinjection of a cyclooxygenase inhibitor into the anteroventral preoptic region attenuates LPS fever. Am J Physiol. 1998;274:R783–789. doi: 10.1152/ajpregu.1998.274.3.R783. [DOI] [PubMed] [Google Scholar]
- Schiltz JC, Sawchenko PE. Distinct brain vascular cell types manifest inducible cyclooxygenase expression as a function of the strength and nature of immune insults. J Neurosci. 2003;22:5606–5618. doi: 10.1523/JNEUROSCI.22-13-05606.2002. [DOI] [PMC free article] [PubMed] [Google Scholar]
- Singer R, Harker CT, Vander AJ, Kluger MJ. Hyperthermia induced by open-field stress is blocked by salicylate. Physiol Behav. 1986;36:1179–1182. doi: 10.1016/0031-9384(86)90497-x. [DOI] [PubMed] [Google Scholar]
- Soszynski D, Kozak W, Conn CA, Rudolph K, Kluger MJ. Beta-adrenoceptor antagonists suppress elevation in body temperature and increase in plasma IL-6 in rats exposed to open field. Neuroendocrinology. 1996;63:459–467. doi: 10.1159/000127072. [DOI] [PubMed] [Google Scholar]
- Stitt JT. Differential sensitivity in the sites of fever production by prostaglandin E1 within the hypothalamus of the rat. J Physiol. 1991;432:99–110. doi: 10.1113/jphysiol.1991.sp018378. [DOI] [PMC free article] [PubMed] [Google Scholar]
- Szekely M, Balasko M, Kulchitsky VA, Simons CT, Ivanov AI, Romanovsky AA. Multiple neural mechanisms of fever. Auton Neurosci. 2000;85:78–82. doi: 10.1016/S1566-0702(00)00223-X. [DOI] [PubMed] [Google Scholar]
- Ushikubi F, Segi E, Sugimoto Y, Murata T, Matsuoka T, Kobayashi T, Hizaki H, Tuboi K, Katsuyama M, Ichikawa A, Tanaka T, Yoshida N, Narumiya S. Impaired febrile response in mice lacking the prostaglandin E receptor subtype EP3. Nature. 1998;395:281–284. doi: 10.1038/26233. [DOI] [PubMed] [Google Scholar]
- Wang J, Ando T, Dunn AJ. Effect of homologous interleukin-1, interleukin-6 and tumor necrosis factor-alpha on the core body temperature of mice. Neuroimmunomodulation. 1997;4:230–236. doi: 10.1159/000097341. [DOI] [PubMed] [Google Scholar]
- Williams JW, Rudy TA, Yaksh TL, Viswanathan CT. An extensive exploration of the rat brain for sites mediating prostaglandin-induced hyperthermia. Brain Res. 1977;120:251–262. doi: 10.1016/0006-8993(77)90904-0. [DOI] [PubMed] [Google Scholar]
- Yamagata K, Matsumura K, Inoue W, Shiraki T, Suzuki K, Yasuda S, Sugiura H, Cao C, Watanabe Y, Kobayashi S. Coexpression of microsomal-type prostaglandin E synthase with cyclooxygenase-2 in brain endothelial cells of rats during endotoxin-induced fever. J Neurosci. 2001;21:2669–2677. doi: 10.1523/JNEUROSCI.21-08-02669.2001. [DOI] [PMC free article] [PubMed] [Google Scholar]
- Zethof TJ, Van Der Heyden JA, Tolboom JT, Olivier B. Stress-induced hyperthermia in mice: a methodological study. Physiol Behav. 1994;55:109–115. doi: 10.1016/0031-9384(94)90017-5. [DOI] [PubMed] [Google Scholar]
- Zethof TJ, Van Der Heyden JA, Tolboom JT, Olivier B. Stress-induced hyperthermia as a putative anxiety model. Eur J Pharmacol. 1995;294:125–135. doi: 10.1016/0014-2999(95)00520-x. [DOI] [PubMed] [Google Scholar]
- Zhang Y-H, Lu J, Elmquist JK, Saper CB. Specific roles of cyclooxygenase-1 and cyclooxygenase-2 in lipopolysaccharide-induced fever and Fos expression in rat brain. J Comp Neurol. 2003;463:3–12. doi: 10.1002/cne.10743. [DOI] [PubMed] [Google Scholar]