Abstract
The purpose of this study was to investigate steady-state force depression following active muscle shortening in human adductor pollicis during voluntary and electrically induced contractions. Subjects (n = 12; age 28 ± 5 years; 7 males and 5 females) performed isometric reference contractions and isometric-shortening-isometric contractions, using maximal voluntary effort and near-maximal electrical stimulation. Force depression was assessed by comparing the steady-state isometric forces produced following active muscle shortening with the purely isometric reference forces obtained at the corresponding muscle length. In order to test for effects of the shortening conditions on the steady-state force depression, the amplitude and speed of shortening were changed systematically in a random order but balanced design. Thumb adduction force and carpometacarpal joint angle were continuously measured using a custom-designed dynamometer. During voluntary contractions, muscle activation was recorded using electromyography and the superimposed twitch technique. During electrically induced contractions, muscle stiffness was assessed using a quick-stretch method. Force depression during voluntary contractions, with a constant level of muscle activation, was similar to that obtained during electrically induced contractions. Force depression increased with increasing amplitudes of shortening (9.9 ± 1.6 %, 15.6 ± 2.4 % and 22.4 ± 2.4 % for 10, 20 and 30 deg of shortening, respectively) and decreased with increasing speeds of shortening (27.1 ± 2.5 %, 19.3 ± 1.6 % and 15.6 ± 1.8 % for 20, 60 and 300 deg s−1 of shortening, respectively), regardless of the activation method. Muscle stiffness was significantly lower in the force-depressed state (5.9 ± 0.2 N deg−1) compared with that of the isometric reference contractions (7.2 ± 0.3 N deg−1), and decreased with increasing force depression (6.6 ± 0.5, 6.0 ± 0.5 and 5.3 ± 0.4 N deg−1 for the 10, 20 and 30 deg of shortening test contractions, respectively). Force depression appeared to be fully established at the end of the shortening phase. The results of this study suggest that steady-state force depression for voluntary movements is similar to that observed using electrical stimulation. Furthermore, it appears that force depression is established at the end of the shortening phase and is associated with a reduction in muscle stiffness and thus, presumably, a decrease in the proportion of attached cross-bridges.
The steady-state isometric forces produced following active muscle shortening are smaller than the purely isometric forces produced at the corresponding muscle lengths. This phenomenon is referred to as force depression following active muscle shortening (hereafter, force depression) and has been demonstrated in isolated muscle fibre preparations (Julian & Morgan, 1979; Sugi & Tsuchiya, 1988; Granzier & Pollack, 1989; Edman et al. 1993), in whole muscle preparations (Abbott & Aubert, 1952; Maréchal & Plaghki, 1979; Herzog & Leonard, 1997; Meijer et al. 1997; Morgan et al. 2000) and human skeletal muscles (de Ruiter et al. 1998; Lee et al. 1999, 2000; de Ruiter & de Haan, 2003).
There is general agreement that force depression increases with increasing magnitudes of shortening (Abbott & Aubert, 1952; Maréchal & Plaghki, 1979; Sugi & Tsuchiya, 1988; Herzog & Leonard, 1997; Meijer et al. 1997; de Ruiter et al. 1998; Morgan et al. 2000) and decreases with increasing speeds of shortening (Abbott & Aubert, 1952; Maréchal & Plaghki, 1979; Sugi & Tsuchiya, 1988; Meijer et al. 1997; Herzog & Leonard, 1997; Morgan et al. 2000; de Ruiter & de Haan, 2003). Furthermore, force depression can be abolished instantaneously by deactivating the muscle just long enough for force to fall to zero (Abbott & Aubert, 1952; Julian & Morgan, 1979; de Ruiter et al. 1998; Morgan et al. 2000). Despite ample observations on force depression following muscle shortening and general agreement on most experimental results, the mechanisms responsible for this phenomenon remain elusive. Traditional cross-bridge theories (Huxley, 1957; Huxley & Simmons, 1971) do not offer a ready explanation for these history-dependent effects.
Force depression has been well documented for electrically induced contractions, but has not been studied systematically for voluntary contractions. Therefore, it is not clear to what extent force depression may play a role during normal voluntary contractions. Lee et al. (1999, 2000) found a small amount of force depression (about 7 % on average) for human knee extensors during maximal voluntary contractions. However, force depression was not found in all subjects, and force depression was independent of the magnitude and speed of shortening. Furthermore, activation was not constant in those experiments, therefore direct comparisons of the results with those obtained using artificial electrical stimulation, were deemed inappropriate. De Ruiter et al. (2003) demonstrated force depression in human adductor pollicis during voluntary and electrically induced contractions. Their results showed that force depression was similar during voluntary and electrically induced contractions and moreover, that force depression was decreased when going from a very slow (19 deg s−1) to a very fast (306 deg s−1) speed of shortening. However, force depression was assessed at 1.0 and 1.5 s following the end of shortening, when steady-state force had not been reached (e.g. their Fig. 1D). Since force recovery is much faster following fast compared to slow speeds of shortening, the difference in force depression might have been caused by the much quicker and more complete force recovery following shortening at 306 deg s−1 compared to shortening at 19 deg s−1. Furthermore, possible changes in voluntary activation were not assessed throughout the contractions, only one shortening magnitude was used, and the number of independent observations (n = 7) was small, and therefore no systematic conclusions about the nature of voluntary force depression, or the possible mechanisms associated with voluntary force depression could be made.
Figure 1. Testing apparatus and experimental settings.
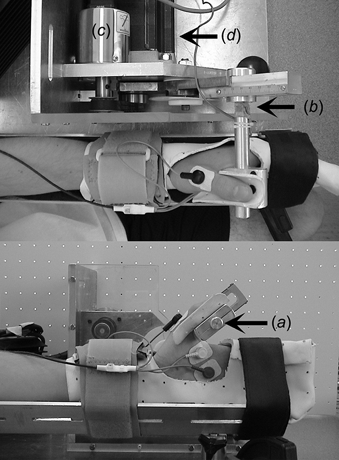
For the measurements of thumb adduction force and carpometacarpal joint angle, a custom-designed testing apparatus was used. When the adductor pollicis contracts, and the thumb presses against the aluminium rod (a), thumb adduction torque is measured via four calibrated strain gauges that are calibrated to provide the force exerted by the thumb on the aluminium rod (b). The strain gauges are arranged in a full Wheatstone bridge, and are attached to the base of the aluminium rod. Carpometacarpal joint angles are measured with an analogue encoder (c). Thumb movements are controlled by a rotary stepper motor (d), which is connected to the aluminium rod via two gears (1:4 gear ratio) and a rail arm. After attaching the nerve stimulation and EMG electrodes on the subject's wrist and hand, the wrist and all fingers, except for the thumb, are immobilized using a clinical cast, and are secured with two Velcro straps in the V-shaped frame of the testing device.
We hypothesized that force depression is similar during voluntary activation and electrically induced contractions, provided that activation is the same for the test and reference contractions. This study was aimed at investigating the steady-state force depression following active muscle shortening during voluntary and electrically induced contractions in human adductor pollicis. Specifically, force depression was evaluated for systematically changing speeds and magnitudes of shortening. Electromyographical recordings were performed throughout all tests, and the superimposed twitch technique (Merton, 1954) was used in all voluntary contractions to carefully monitor any possible changes in activation. Stiffness was measured in all electrically induced isometric reference contractions and the corresponding test contractions, to assess the possible role of cross-bridge dynamics on force depression. Finally, all contractions were performed for a sufficient period of time to minimize errors in the calculation of the steady-state force depression caused by force transients associated with muscle recovery following shortening contractions.
METHODS
Subjects
Twelve subjects (n = 12: 7 males and 5 females; age 28 ± 5 years; height 174 ± 7 cm; weight 72 ± 9 kg), without any history of neuromuscular disorder or injury to the hands, volunteered and gave free, written informed consent to participate in this study. All experimental procedures were approved by the Conjoint Ethics Committee of the University of Calgary.
Apparatus
A custom-designed testing apparatus was built to measure thumb adduction force and angle of the thumb at the carpometacarpal joint, and to control thumb movements (Fig. 1). A detailed description of the apparatus is given elsewhere (Lee & Herzog, 2002). Briefly, a rotary stepper motor (Model TS42BP10, Parker Hannifin Corp., Cleveland, OH, USA) was connected to an aluminium rod (1.5 cm diameter and 15 cm long) via gears (1:4 gear ratio). The small gear was attached to a shaft of the motor that engages the big gear. The big gear was cut to one-quarter of a circle, so the amount of rotation was restricted to 90 deg. The rod was attached to the big gear perpendicular to the plane of the gear through a length-adjustable rail arm. Two pairs of strain gauges (Model CEA-06–125UN-350, Measurement Group, Inc. Raleigh, NC, USA) were mounted on one end of the rod in a full Wheatstone circuit. The force transducer was calibrated prior to the experiments, and was found to be linear in the calibrated and experimental range of 0–200 N (r2= 0.99) with a resolution of 0.1 N and a directional sensitivity of < 2 %. The other end of the rod was cut to form a groove for the attachment of an auxiliary piece for thumb placement and fixation. An analogue encoder (Series 03 rotary transducer, Hohner Corp., UK) was connected to the shaft of the motor through a conveyer belt for angle measurement. Thumb movements were controlled by moving the rod using a digital controller (Model Gemini GT6-L8 Digital stepper driver/controller, Parker Hannifin Corp., Cleveland, OH, USA).
Experimental settings
The left hand was immobilized with a reusable clinical cast (Ezeform, Rehabilitation Division, Smith & Nephew Inc., Germantown, WI, USA) in a neutral position. Immobilization restricted movement of the wrist and fingers, except for the thumb. After immobilization, subjects sat on an adjustable chair with the forearm slightly abducted and the elbow flexed 90 deg. The forearm was placed in a V-shaped metal plate, and was secured with two Velcro straps (Fig. 1). The centre of rotation of the motor was aligned with the carpometacarpal joint. The aluminium rod was placed horizontally between the thumb and the index fingers. By placing the distal end of the thumb on the auxiliary piece of the aluminium rod and placing the hand in a slightly externally rotated position relative to the thumb, thumb movement was guided toward the third finger (Fig. 1). This alignment ensured that thumb movements during electrically stimulated contractions were as close as possible to those obtained during maximal voluntary contractions, and that the movement direction of the thumb was in line with the force measurement by the strain gauges.
The fully abducted thumb angle was defined as 30 deg. Thumb angles were defined to decrease with adduction. Because of the placement of the aluminium rod, the range of motion of the thumb was somewhat restricted. From preliminary tests, we found that 30 deg of thumb movement is the maximum range that could be comfortably performed by all subjects. The thumb adduction force-angle relationship was determined prior to the experiments by measuring the maximal isometric forces at seven different angles; from 0 to 30 deg at 5 deg intervals (Fig. 2). This relationship was virtually flat and showed that the 30 deg position is approximately on the plateau of the thumb adduction force-angle relationship, which is in agreement with the results of de Ruiter et al. (1998).
Figure 2. Thumb adduction force-angle relationship.
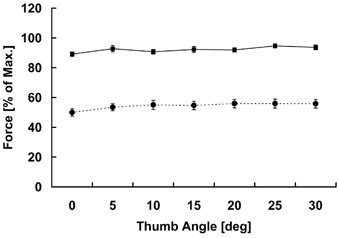
Mean (± S.E.M.) active isometric thumb adduction force (total force - passive force) as a function of thumb angle across all subjects. For comparison, each subject's maximal forces at different joint angles were normalized to the maximum isometric force obtained during voluntary contractions. •, electrically stimulated contractions; ▪, voluntarily activated contractions.
Force and angle measurements
When the adductor pollicis was activated, the thumb pressed against the aluminium rod, and the thumb adduction force was measured using the calibrated strain gauges. Thumb angle was measured using an analogue encoder and a goniometer.
Muscle activation measurements
For voluntary contractions, subjects were instructed to press perpendicularly against the aluminium rod, as hard as they could, and to maintain the intensity as steady as possible until the end of the test. During voluntary contractions, muscle activation was assessed using electromyography (EMG) and the interpolated twitch technique (Merton, 1954).
For EMG recording, a pair of surface electrodes was placed over the palmar side of the hand on the adductor pollicis, and the corresponding reference electrode was placed on the posterior bony side of the thumb. EMG signals were amplified (× 1000–5000) no further than 1 cm from the recording site, and were band-pass filtered (10 Hz and 1 kHz). EMG signals were collected at 2000 Hz.
For the twitch interpolation technique (Merton, 1954), a pair of carbon-impregnated rubber electrodes (4.5 cm × 4.5 cm) were placed on the skin over the ulnar nerve. A supramaximal doublet twitch (two square wave pulses of 0.8 ms duration and 8 ms inter-pulse interval) was delivered to the ulnar nerve during the maximal voluntary contractions using a stimulator (Grass S88, Quincy, MA, USA) with an isolation unit approved for human use (Belanger & McComas, 1981). The interpolated twitch forces (ITF) were measured during the steady-state isometric phase of the isometric reference contractions, and the steady-state isometric phase following muscle shortening. The interpolated twitch forces were normalized relative to the resting twitch forces (RTF), which were measured from the completely relaxed muscle immediately after the end of each contraction.
Electrical stimulation for tetanic contractions
In order to induce tetanic contractions with electrical stimulation, a series of square wave pulses of 0.1 ms duration was delivered to the adductor pollicis through the ulnar nerve. The frequency and voltage of stimulation ranged from 30–55 Hz and 50–80 V, respectively. Electrical stimulation was systematically increased for each subject until stimulation intensity was reached that could be tolerated comfortably by the subjects. The mean thumb adduction force measured during electrically induced contractions at different thumb angles was 62 ± 1 % of the maximal thumb adduction force assessed during voluntary contractions.
Experimental protocols
The basic idea of this study was to measure thumb adduction forces, carpometacarpal joint angles, and muscle activation for purely isometric contractions, and for isometric contractions following shortening of the thumb adductors. Subjects performed two conceptually different test protocols for the electrically induced contractions (Fig. 3) and the maximal voluntary contractions (Fig. 4): protocol 1 (Fig. 3A and Fig. 4A) was aimed at investigating the effects of shortening amplitude and protocol 2 (Fig. 3B and Fig. 4B) was aimed at determining the effects of shortening speed on the forces during shortening and the isometric, steady-state forces following shortening.
Figure 3. Force-time and angle-time histories during electrically induced contractions.
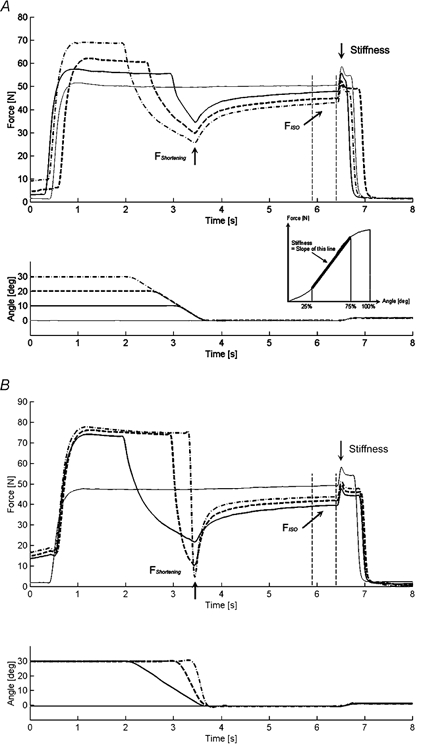
For shortening contractions, the minimum forces during the shortening phase (FShortening), steady-state isometric forces (FISO) and muscle stiffness were measured for comparisons with the corresponding values obtained from isometric reference contractions. The effects of shortening conditions were tested by systematically changing amplitudes (A) and speeds (B) of shortening. The inset shows a schematic illustration of the stiffness measurement used in this study.
Figure 4. Force-time and angle-time histories and EMG during voluntary contractions.
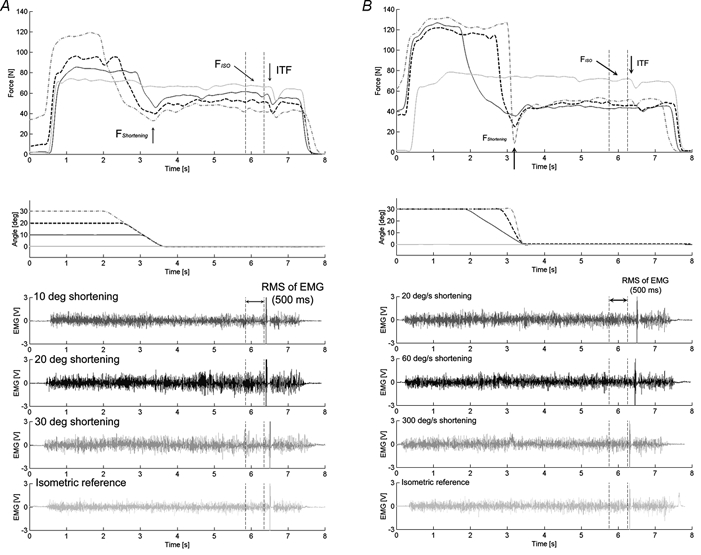
For shortening contractions, the minimum forces during the shortening phase (FShortening) and the steady-state isometric forces (FISO) were measured for comparisons with the corresponding values obtained from isometric reference contractions. During the contractions, muscle activation was continuously monitored using EMG and superimposed twitch technique. During the steady-state isometric phase following muscle shortening, the RMS of EMG values and interpolated twitch forces (ITF) were measured and compared with the corresponding values obtained from the isometric reference contractions. The effects of shortening conditions were tested by systematically changing amplitudes (A) and speeds (B) of shortening.
In protocol 1 (Fig. 3A and Fig. 4A), subjects performed purely isometric contractions and isometric contractions following muscle shortening (concentric thumb adduction) of varying amplitudes. All purely isometric reference contractions were performed at a thumb angle of 0 deg. For the determination of possible force depression following shortening, subjects performed an isometric contraction at an initial thumb angle, followed by a shortening of the adductor pollicis, followed by a further isometric contraction at the final thumb angle. Shortening was always performed at an angular velocity of 20 deg s−1, over shortening amplitudes of 10, 20 and 30 deg to the final thumb angle of 0 deg. Each shortening test of given amplitude was performed three times for a total of nine shortening experiments. Each set of three shortening tests, which consisted of three different shortening amplitudes, was preceded and followed by the isometric reference contractions. Following shortening, muscles were kept activated for a minimum of 3 s to ensure that a steady-state force was reached as closely as possible following the shortening-transient force response.
In protocol 2 (Fig. 3B and Fig. 4B), subjects performed the same protocols as those described in protocol 1, except that the contractile conditions for shortening were changed; contractions were performed at three different speeds (20, 60 and 300 deg s−1) over a constant amplitude of 30 deg.
In order to minimize possible effects of fatigue, order of test conditions, and activation method (electrical stimulation vs. maximal voluntary contraction), the order of test contractions and activation methods was randomly chosen using a balanced design. In addition, we used the isometric reference forces as an indicator of fatigue. Subjects took as much rest as they wanted, but a minimum of 3 min was always enforced between contractions.
We performed an additional experiment for selected subjects in order to test whether force depression in the human adductor pollicis is a transient or long-lasting phenomenon. Three subjects performed three or four tests involving a 30 deg shortening contraction at 20 deg s−1 using electrical stimulation. The contraction was maintained for > 15 s following the shortening phase, and force depression was assessed at 0, 3, 6, 9, 12 and 15 s following shortening.
Data collection and analysis
During testing, thumb adduction force, joint angle and EMG signals of the adductor pollicis were simultaneously collected at a sampling frequency of 2000 Hz, and saved on a computer with an analogue-to-digital converter.
Thumb adduction force was determined at two specific instances in time (Fig. 3 and Fig. 4): during the shortening phase, to give the minimum force value during shortening (FShortening) and during the steady-state isometric phase 2.5–3 s (i.e. over a 500 ms interval) following the shortening phase (FISO) to give the mean steady-state isometric force following shortening. All force values were normalized relative to the mean forces of the isometric reference contractions, which were performed before and after each set of test contractions. Force depression (FD) was calculated as the difference between the steady-state isometric force following muscle shortening and the corresponding isometric reference force.
The normalized interpolated twitch force values (ITF/RTF), obtained during the steady-state isometric phase following muscle shortening, were compared to the mean ITF/RTF values obtained during the isometric reference contractions. The root mean square (RMS) values of the EMG signals (for a 500 ms period) were assessed during the steady-state isometric phase following shortening (Fig. 4). Muscle activation of the test contractions, assessed with the RMS of the EMG values, was compared to the corresponding mean values of the isometric reference contractions.
For electrically induced contractions, muscle stiffness was determined by applying a quick stretch (eccentric thumb adduction over 2 deg at a speed of 500 deg s−1) during the steady-state, isometric phase following the shortening contractions for the dynamic tests and during the steady-state phase of the isometric reference contractions (Fig. 3). Stiffness was defined as the slope of the linear, mid-portion of the force-angle curve obtained during the quick stretch (inset, Fig. 3A). Stiffness values of the dynamic test contractions were compared with those obtained from the isometric reference contractions.
For statistical analysis, variables across test conditions and subjects were pooled. A repeated-measures ANOVA and Bonferroni post hoc comparisons were performed (α= 0.05). In the figures, we show the pooled variables for all subjects as means ± 1 S.E.M.
RESULTS
Steady-state isometric force following muscle shortening
The steady-state isometric forces (FISO) following muscle shortening were smaller than the corresponding isometric reference forces, regardless of the shortening conditions and the method of muscle stimulation (Fig. 3 and Fig. 4; Table 1 for absolute force values). Force depression was directly related to the magnitude of shortening and inversely related to the speed of shortening (Fig. 5; Table 1 for absolute values). No difference in force depression was observed between the electrically-stimulated and the voluntary contractions (Fig. 5). In protocol 1, the mean values for force depression, averaged across all subjects, were 12 ± 2 %, 17 ± 3 % and 22 ± 3 % during voluntary contractions and 8 ± 1 %, 14 ± 2 % and 24 ± 2 % during electrically induced contractions for shortening over 10, 20 and 30 deg (at 20 deg s−1), respectively. In protocol 2, the mean values for force depression, averaged across all subjects, were 27 ± 3 %, 22 ± 3 % and 17 ± 3 % during voluntary contractions and 24 ± 2 %, 18 ± 2 % and 16 ± 2 % during electrically induced contractions for shortening contractions at speeds of 20, 60 and 300 deg s−1 (over a range of 30 deg), respectively.
Table 1.
The force values (N) during shortening (Fshortening), and during the steady-state isometric phase after the shortening (FISO)
| Protocol 1 | Protocol 2 | |||||||
|---|---|---|---|---|---|---|---|---|
| 10 deg | 20 deg | 30 deg | Reference | 20 deg s−1 | 60 deg s−1 | 300 deg s−1 | Reference | |
| FShortening (N) | ||||||||
| Voluntary | 51.2 (5.3) | 43.8 (4.6) | 39.9 (4.4) | n.a. | 41.3 (3.6) | 25.9 (3.6) | 9.4 (2.6) | n.a. |
| Electrical | 32.5 (3.7) | 26.6 (3.6) | 21.4 (3.0) | n.a. | 21.0 (2.7) | 11.6 (2.2) | 3.5 (1.6) | n.a. |
| FISO (N) | ||||||||
| Voluntary | 62.2 (5.1) | 58.0 (4.9) | 55.0 (4.7) | 69.1 (4.6) | 56.0 (4.0) | 59.3 (4.0) | 63.4 (4.2) | 76.0 (4.8) |
| Electrical | 45.8 (4.2) | 42.8 (4.5) | 38.0 (4.0) | 49.2 (4.5) | 37.2 (3.4) | 40.1 (3.3) | 41.1 (3.5) | 48.3 (3.8) |
| FDISO (N) | ||||||||
| Voluntary | 6.9 (1.0) | 11.1 (1.2) | 14.1 (1.3) | 0 | 20.0 (2.0) | 16.7 (1.8) | 12.6 (2.0) | 0 |
| Electrical | 3.4 (0.6) | 6.4 (0.7) | 11.2 (0.9) | 0 | 11.1 (0.8) | 8.2 (0.7) | 7.2 (0.7) | 0 |
Fshortening (N) is the minimum force during the shortening phase, and FISO (N) is the steady-state isometric force in the isometric phase following shortening. Force depression (FDISO) was assessed in the steady-state isometric phase. The values are presented as means and 1 s.e.m. n.a., not applicable.
Figure 5. Force depression following muscle shortening (FD) for shortening contractions with different shortening conditions.
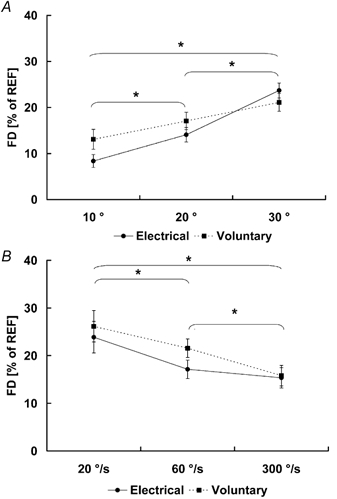
Force depression was assessed as the difference in the steady-state isometric force following shortening and the corresponding isometric reference force. Voluntary force depression (dotted line) was similar to force depression obtained for electrically induced contractions (continuous line). Force depression, pooled for each shortening condition and across all subjects, was increased with increasing magnitudes of shortening (A) and decreasing speeds of shortening (B) (*P < 0.05). Means (± S.E.M.) across all subjects are presented.
Minimum force during the shortening phase
Thumb adduction force decreased upon muscle shortening. Regardless of the activation method (voluntary or electrical), the minimum forces during shortening (FShortening) decreased with increasing magnitudes and speeds of shortening. The minimum forces during the shortening phase were significantly greater for the voluntary (63 ± 3 % and 33 ± 3 % of the isometric reference force for protocol 1 and protocol 2, respectively) compared to the electrically stimulated (53 ± 2 % and 21 ± 4 % of the isometric reference force for protocol 1 and protocol 2, respectively) contractions (Fig. 6; Table 1 for absolute force values). The minimum force during shortening was not always observed at the end of muscle shortening for the voluntary contractions, specifically not for the shortening contractions performed at the slowest speed.
Figure 6. Minimum thumb adduction force during the dynamic shortening phase.
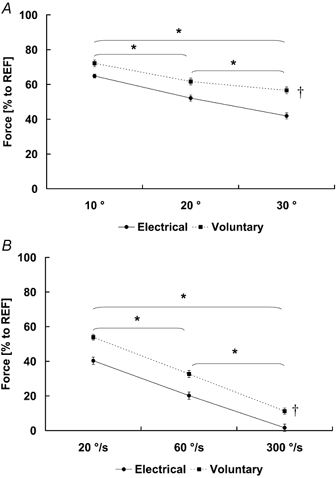
The minimum forces during the dynamic shortening phase (FShortening) were normalized relative to the corresponding isometric reference forces and pooled for each shortening condition and across all subjects. The minimum forces during the dynamic shortening phase were found to decrease with increasing magnitudes (A) and increasing speeds (B) of shortening (*P < 0.05). The minimum forces during shortening differed between the electrically induced (continuous line) and the voluntary contractions (dotted line) (†P < 0.05). Means (± S.E.M.) are presented.
Muscle activation during voluntary contractions
Voluntary muscle activation, as assessed with the interpolated twitch technique and EMG recordings, was the same for the isometric contractions following shortening and the corresponding isometric reference contractions (Fig. 7).
Figure 7. Muscle activation assessed by electromyography (EMG) and the interpolated twitch technique (ITT).
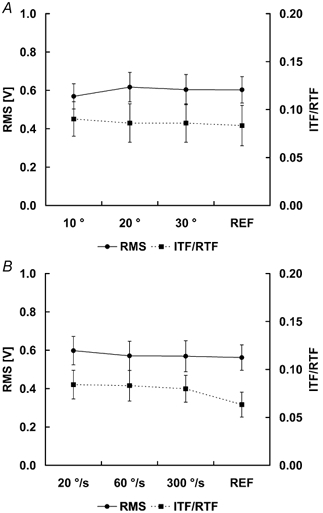
Muscle activation was assessed using EMG and the ITT during the steady-state isometric phase of the experimental test and the corresponding reference contractions. EMG was quantified using the RMS values for a 500 ms period during the steady-state, isometric phase. Muscle inhibition was assessed by measuring the interpolated twitch force (ITF) and normalizing it relative to the corresponding resting twitch force (RTF). The resting twitch force was obtained from the completely relaxed muscle 1 s after each contraction. A, protocol 1; B, protocol 2.
Muscle stiffness
Across all tests, muscle stiffness obtained from the steady-state isometric contractions following shortening (5.9 ± 0.2 N deg−1) was smaller than the stiffness obtained from the isometric reference contractions (7.2 ± 0.3 N deg−1). Muscle stiffness decreased with increasing magnitudes of shortening in protocol 1 (Fig. 8A), but was not systematically influenced by the speed of shortening in protocol 2 (Fig. 8B). In protocol 1, the mean muscle stiffness, averaged across all subjects, was 7.3 ± 0.5 N deg−1 for the isometric reference contractions, and 6.6 ± 0.5, 6.0 ± 0.5 and 5.3 ± 0.4 N deg−1 for the 10, 20 and 30 deg shortening contractions, respectively. In protocol 2, the mean muscle stiffness, averaged across all subjects, was 7.1 ± 0.5 N deg−1 for the isometric reference contractions, and 5.6 ± 0.4, 6.0 ± 0.4 and 5.9 ± 0.4 N deg−1 for 20, 60 and 300 deg s−1 shortening contractions, respectively.
Figure 8. Muscle stiffness for the shortening and isometric reference contractions.
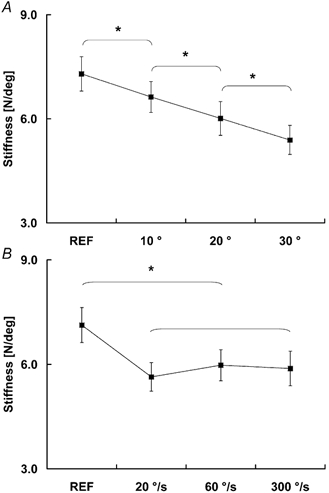
A, in protocol 1, muscle stiffness decreased with increases in the magnitude of shortening (*P < 0.05). B, in protocol 2, muscle stiffness was smaller for the shortening test contractions than for the isometric reference contractions (*P < 0.05), but the speed of shortening did not significantly affect muscle stiffness.
Force depression is long lasting
The steady-state force depression was found to persist for 15 s following the end of shortening (Fig. 9). Force depression assessed at 0, 3, 6, 9, 12 and 15 s following shortening was found to decrease over time but approached a steady state (38.4 ± 4.3 %, 19.8 ± 2.0 %, 17.6 ± 2.0 %, 16.7± 1.9 %, 15.3 ± 2.4 % and 14.6 ± 2.3 %, respectively).
Figure 9. Representative force-time history of a shortening and an isometric reference contraction maintained for 15 s.

A 30 deg shortening contraction (trace b) performed at 20 deg s−1 is presented with the corresponding isometric reference force (trace a). Following active shortening, the muscle was held isometrically for 15 s and force depression was determined at 0, 3, 6, 9, 12 and 15 s following the end of the shortening phase.
DISCUSSION
Here, we investigated force depression in human skeletal muscle during voluntary contractions at constant levels of activation. The results support the notion that force depression following active muscle shortening is similar in voluntary and electrically induced contractions. Force depression was found to increase with increasing magnitudes of shortening and decreasing speeds of shortening for the voluntary and electrically induced contractions, thereby confirming results on single fibre preparations (Sugi & Tsuchiya, 1988), whole muscles (Abbott & Aubert, 1952; Maréchal & Plaghki, 1979; Herzog & Leonard, 1997; Meijer et al. 1997; Morgan et al. 2000) and in vivo human muscles (de Ruiter et al. 1998), all of which were obtained using electrical stimulation.
The maximum force depression of 25 % found in this study for a 30 deg angular displacement at an angular speed of 20 deg s−1 is somewhat smaller than the maximum force depression of 38 % found by de Ruiter et al. (1998) for electrically induced contractions, but agrees perfectly with the 25 % voluntary force depression in their more recent study (de Ruiter & de Haan, 2003). However, both of the latter values must be considered with caution, as they were obtained in the transient recovery phase following muscle shortening, and as such do not represent steady-state force depression magnitudes. The current results do not agree with those obtained by Lee et al. (1999, 2000) for voluntary force depression in human knee extensor muscles. However, in that study, activation (measured using EMG and the superimposed twitch technique) was found to vary systematically between the isometric reference contractions and the corresponding shortening test contractions, and thus comparison with the results obtained here (in which activation was confirmed to be the same for reference and test contractions) is not possible.
Despite substantial research, the mechanisms underlying the steady-state force depression following active shortening have eluded satisfactory explanation. Here, we found that increasing the amplitude of shortening (for a given speed and level of activation) produced not only increases in steady-state force depression (Fig. 3A and Fig. 5B), but also decreases in force at the end of the shortening phase (Fig. 3A and Fig. 6A). In fact, force depression during shortening (FDShortening), which was defined as the difference between the minimum force during shortening and the corresponding isometric reference force, was highly correlated with the force depression during the steady-state isometric phase (FDISO) (Fig. 10, r2= 0.80). Moreover, for different amplitudes of shortening, the differences in force depression during shortening (ΔFDShortening) were highly correlated with the differences in force depression during the steady-state isometric phase (ΔFDISO) (Fig. 11, r2= 0.70), suggesting that force depression is produced during the shortening phase, and not during the recovery phase following shortening. The slope of the regression line between ΔFDShortening and ΔFDISO is smaller than 1.0, indicating that the differences in force depression at the end of shortening are greater than the differences in the steady-state force depression. Therefore, it appears that there are two mechanisms at work to depress force during shortening: the first mechanism is not reversible and causes the long-lasting, steady-state force depression. Its origin remains unknown. The second mechanism is reversible and might be associated with a reduced affinity of the troponin binding sites for calcium due to active shortening, which results in a transient inhibition of cross-bridge attachment that quickly recovers after the shortening phase, as suggested by Edman (1996).
Figure 10. Relationship between force depression at the end of the shortening phase and during the steady-state isometric phase.
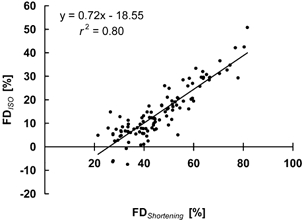
FDShortening, force depression at the end of the shortening phase, FDISO, force depression during the steady-state isometric phase. Data are from all 108 electrically stimulated contractions of protocol 1.
Figure 11. Differences in force depression during the shortening and steady-state isometric phases.
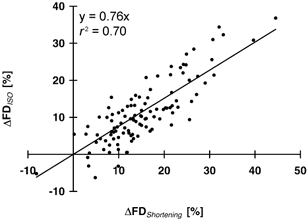
Differences in force depression at the end of the shortening phase (ΔFDShortening) and during the steady-state isometric phase (ΔFDISO). Data are from all 108 electrically stimulated contractions of protocol 1.
In theory, the steady-state force depression following active muscle shortening may occur either because of a decrease in the number of attached cross-bridges, or a decrease in the average force per cross-bridge (Huxley, 1957; Huxley & Simmons, 1971). One way of deciding between these two potential causes is to compare the stiffness in the isometric reference contractions with that obtained in the force-depressed state of the test contractions (Ford et al. 1981). For single fast muscle fibres from the tibialis anterior of frog (Rana japonica), stiffness was found to decrease in parallel with increasing force depression (Sugi & Tsuchiya, 1988). In contrast, no systematic changes in stiffness were observed in the force-depressed state of cat soleus (Herzog & Leonard, 2000). Based on theoretical considerations, and assuming that force depression was caused by sarcomere length non-uniformities, Morgan et al. (2000) suggested that muscle stiffness should be higher in the force-depressed state compared to the isometric reference contractions. Here, we found a decrease in muscle stiffness with increasing force depression (Fig. 12; r2= 0.67), similar to the results of Sugi & Tsuchiya (1988). This result suggests that force depression in the human adductor pollicis is probably associated with a decrease in the proportion of attached cross-bridges (Ford et al. 1981; Sugi & Tsuchiya, 1988) compared to the corresponding isometric reference contractions.
Figure 12. Relative muscle stiffness as a function of the steady-state force depression.
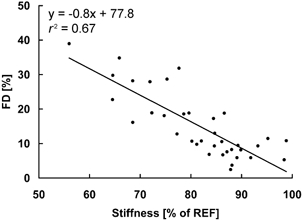
Note the negative relationship indicating that increased force depression is associated with decreased muscle stiffness. Values were obtained from the electrically induced contractions of protocol 1. Muscle stiffness was calculated relative to the stiffness of the isometric reference contraction for each subject (100 %).
Maréchal & Plaghki (1979) suggested that the steady-state force depression following active muscle shortening may be caused by a stress-induced inhibition of cross-bridge attachment in the actin-myosin overlap zone that is formed during shortening. This theory requires that force depression increases with increasing magnitudes of shortening and decreasing speeds of shortening (because of the increased force at low compared to fast speeds of shortening (Hill, 1938)). However, and more important in the present context, this theory also requires that muscle stiffness decreases in proportion with the amount of force depression. Here, we demonstrated that all of these predictions are closely approximated in whole muscle, and during voluntary and electrically induced contractions.
Conclusion
From the results of this study we conclude that force depression is a property of voluntarily contracted human skeletal muscle, and that this property is similar to those reported for artificial electrical stimulation using single fibre, isolated muscle, and in situ muscle preparations. Furthermore, we suggest that force depression occurs during the active shortening phase, and not during the recovery phase following shortening, and that force depression during shortening contains a transient and a long-lasting component. The transient component may be associated with a reduced calcium affinity of troponin, as suggested by Edman (1996). The mechanism of the long-lasting component of force depression appears to be associated with an inhibition of cross-bridge attachment, which reduces the proportion of attached cross-bridges in the steady-state force-depressed situation compared to that of the isometric reference state. However, we are unable, at present, to elucidate the details of such a possible cross-bridge inhibition.
REFERENCES
- Abbott BC, Aubert XM. The force exerted by active striated muscle during and after change of length. J Physiol. 1952;117:77–86. [PMC free article] [PubMed] [Google Scholar]
- Belanger AY, McComas AJ. Extent of motor unit activation during effort. J Appl Physiol. 1981;51:1131–1135. doi: 10.1152/jappl.1981.51.5.1131. [DOI] [PubMed] [Google Scholar]
- de Ruiter CJ, De Haan A. Shortening-induced depression of voluntary force in unfatigued and fatigued human adductor pollicis muscle. J Appl Physiol. 2003;94:69–74. doi: 10.1152/japplphysiol.00672.2002. [DOI] [PubMed] [Google Scholar]
- de Ruiter CJ, De Haan A, Jones DA, Sargeant AJ. Shortening-induced force depression in human adductor pollicis muscle. J Physiol. 1998;507:583–591. doi: 10.1111/j.1469-7793.1998.583bt.x. [DOI] [PMC free article] [PubMed] [Google Scholar]
- Edman KA. Fatigue vs. shortening-induced deactivation in striated muscle. Acta Physiol Scand. 1996;156:183–192. doi: 10.1046/j.1365-201X.1996.t01-1-198000.x. [DOI] [PubMed] [Google Scholar]
- Edman KA, Caputo C, Lou F. Depression of tetanic force induced by loaded shortening of frog muscle fibres. J Physiol. 1993;466:535–552. [PMC free article] [PubMed] [Google Scholar]
- Ford LE, Huxley AF, Simmons RM. The relation between stiffness and filament overlap in stimulated frog muscle fibres. J Physiol. 1981;311:219–249. doi: 10.1113/jphysiol.1981.sp013582. [DOI] [PMC free article] [PubMed] [Google Scholar]
- Granzier HL, Pollack GH. Effect of active pre-shortening on isometric and isotonic performance of single frog muscle fibres. J Physiol. 1989;415:299–327. doi: 10.1113/jphysiol.1989.sp017723. [DOI] [PMC free article] [PubMed] [Google Scholar]
- Herzog W, Leonard TR. Depression of cat soleus-forces following isokinetic shortening. J Biomech. 1997;30:865–872. doi: 10.1016/s0021-9290(97)00046-8. [DOI] [PubMed] [Google Scholar]
- Herzog W, Leonard TR. The history dependence of force production in mammalian skeletal muscle following stretch-shortening and shortening-stretch cycles. J Biomech. 2000;33:531–542. doi: 10.1016/s0021-9290(99)00221-3. [DOI] [PubMed] [Google Scholar]
- Hill AV. The heat of shortening and the dynamic constants of muscle. Proc R Soc Lond B Biol Sci. 1938;126:136–195. doi: 10.1098/rspb.1949.0019. [DOI] [PubMed] [Google Scholar]
- Huxley AF. Muscle structure and theories of contraction. Progr Biophys Biophys Chem. 1957;7:255–318. [PubMed] [Google Scholar]
- Huxley AF, Simmons RM. Proposed mechanism of force generation in striated muscle. Nature. 1971;233:533–538. doi: 10.1038/233533a0. [DOI] [PubMed] [Google Scholar]
- Julian FJ, Morgan DL. The effect on tension of non-uniform distribution of length changes applied to frog muscle fibres. J Physiol. 1979;293:379–392. doi: 10.1113/jphysiol.1979.sp012895. [DOI] [PMC free article] [PubMed] [Google Scholar]
- Lee HD, Herzog W. Force enhancement following muscle stretch of electrically stimulated and voluntarily activated human adductor pollicis. J Physiol. 2002;545:321–330. doi: 10.1113/jphysiol.2002.018010. [DOI] [PMC free article] [PubMed] [Google Scholar]
- Lee HD, Suter E, Herzog W. Force depression in human quadriceps femoris following voluntary shortening contractions. J Appl Physiol. 1999;87:1651–1655. doi: 10.1152/jappl.1999.87.5.1651. [DOI] [PubMed] [Google Scholar]
- Lee HD, Suter E, Herzog W. Effects of speed and distance of muscle shortening on force depression during voluntary contractions. J Biomech. 2000;33:917–923. doi: 10.1016/s0021-9290(00)00070-1. [DOI] [PubMed] [Google Scholar]
- Maréchal G, Plaghki L. The deficit of the isometric tetanic tension redeveloped after a release of frog muscle at a constant velocity. J Gen Physiol. 1979;73:453–467. doi: 10.1085/jgp.73.4.453. [DOI] [PMC free article] [PubMed] [Google Scholar]
- Meijer K, Grootenboer HJ, Koopman HF, Huijing PA. Fully isometric length-force curves of rat muscle differ from those during and after concentric contractions. J Appl Biomech. 1997;13:164–181. [Google Scholar]
- Merton PA. Voluntary strength and fatigue. J Physiol. 1954;123:553–564. doi: 10.1113/jphysiol.1954.sp005070. [DOI] [PMC free article] [PubMed] [Google Scholar]
- Morgan DL, Whitehead NP, Wise AK, Gregory JE, Proske U. Tension changes in the cat soleus muscle following slow stretch or shortening of the contracting muscle. J Physiol. 2000;522:503–513. doi: 10.1111/j.1469-7793.2000.t01-2-00503.x. [DOI] [PMC free article] [PubMed] [Google Scholar]
- Sugi H, Tsuchiya T. Stiffness changes during enhancement and deficit of isometric force by slow length changes in frog skeletal muscle fibres. J Physiol. 1988;407:215–229. doi: 10.1113/jphysiol.1988.sp017411. [DOI] [PMC free article] [PubMed] [Google Scholar]


