

Abstract
Ethanol is the leading cause of pancreatitis; however, its cellular effects are poorly understood. We examined the direct effects of ethanol in the concentration range 0.1–30 mM, i.e. relevant to usual levels of drinking, on fluid secretion from guinea-pig pancreatic duct cells. Fluid secretion was continuously measured by monitoring the luminal volume of interlobular duct segments isolated from the guinea-pig pancreas. [Ca2+]i was estimated by microfluorometry in duct cells loaded with fura-2. Ethanol at 0.3–30 mM significantly augmented fluid secretion stimulated by physiological (1 pM) or pharmacological (1 nM) concentrations of secretin. It augmented dibutyryl cAMP-stimulated fluid secretion but failed to affect spontaneous or acethylcholine-stimulated secretion. Ethanol at 1 mM shifted the secretin concentration-fluid secretion response curve upwards and raised the maximal secretory response significantly by 41 %. In secretin-stimulated ducts, 1 mM ethanol induced a transient increase in [Ca2+]i that was dependent on the presence of extracellular Ca2+. Ethanol failed to augment secretin-stimulated secretion from ducts pretreated with an intracellular Ca2+ buffer (BAPTA) or a protein kinase A inhibitor (H89). In conclusion, low concentrations of ethanol directly augment pancreatic ductal fluid secretion stimulated by physiological and pharmacological concentrations of secretin, and this appears to be mediated by the activation of both the intracellular cAMP pathway and Ca2+ mobilization.
Alcoholic beverages are commonly consumed with meals. Their abuse causes a variety of cellular dysfunctions and diseases in many organ systems. The acute effects of ethanol depend on its blood concentration, which may vary depending on the amount of ethanol ingested, body mass, drinking style and type of meal, which may affect the gastric emptying, absorption and metabolism of ethanol. A pint of beer may increase blood ethanol levels by up to 5 mM (Laurence & Bennett, 1987). The objective effects of ethanol on the central nervous system, such as flicker fusion, appear in the range 4–6 mM. The effects on behaviour become evident at around 10 mM. More than 50 % of people are grossly intoxicated at around 30 mM. Loss of consciousness occurs at around 60 mM and death certainly occurs at levels over 100 mM (Deitrich & Harris, 1996).
In the exocrine pancreas, ethanol is the most common cause of acute and chronic pancreatitis; however, its effects on acinar and duct cell functions are poorly understood (Singh & Simsek, 1990; Niebergall-Roth et al. 1998). Many investigators examined the direct effects of ethanol on acinar cells and found that very high concentrations of ethanol are required to observe measurable effects (Singh & Simsek, 1990; Niebergall-Roth et al. 1998). For example, 600 mM ethanol inhibited cholecystokinin-stimulated enzyme secretion from isolated rat pancreatic acini (Tachibana et al. 1996). Only a few investigators have examined the effects of ethanol on duct cells. Combination of aspirin and ethanol (20 mM) increased the permeability of ductal epithelium to Cl− and HCO3− in the main pancreatic duct of the cat (Reber et al. 1993). However, the effects of ethanol on smaller (intra- or interlobular) pancreatic ducts, where most of the HCO3− and water are secreted (Case & Argent, 1993), have not yet been examined. In order to understand the cellular action of ethanol, we have examined the direct effects of ethanol on fluid secretion from isolated interlobular ducts (Ishiguro et al. 1998; Suzuki et al. 2001). It was surprising to find that low concentrations of ethanol, relevant to blood levels observed after occasional social drinking, strongly augmented ductal fluid secretion stimulated by both physiological (1 pM) and pharmacological (1 nM) concentrations of secretin.
METHODS
The following study was approved by the Ethical Committee of Nagoya University on Animal Use for Experiment.
Isolation and culture of interlobular ducts
Female Hartley guinea-pigs (˜350 g) were killed by cervical dislocation. Interlobular ducts of the pancreas were isolated as described previously (Ishiguro et al. 1996). The body and tail of the pancreas were removed and digested with collagenase and hyaluronidase. Interlobular duct segments (diameter, 100–150 μm) were microdissected under a dissection microscope using sharpened needles. The duct segments were cultured at 37 °C in 5 % CO2 in air for 3 h.
Solutions
The standard Hepes-buffered solution contained (mM): NaCl 140, KCl 5, CaCl2 1, MgCl2 1, D-glucose 10 and Hepes 10, and was equilibrated with 100 % O2. The standard HCO3−-buffered solution contained (mM): NaCl 115, KCl 5, CaCl2 1, MgCl2 1, D-glucose 10 and NaHCO3 25, and was equilibrated with 95 % O2-5 % CO2. The osmolality of both solutions was ˜290 mosmol kg−1. The Ca2+-free HCO3−-buffered solution was prepared by replacing CaCl2 with 0.2 mM EGTA. The solutions were adjusted to pH 7.4 at 37 °C.
Measurement of the fluid secretory rate
During the short-term culture both ends of the interlobular duct segments sealed spontaneously thus isolating the luminal space from the bathing medium. The cultured ducts were stored at 4 °C in the standard Hepes-buffered solution prior to use. The fluid secretory rate into the closed luminal space was measured by a method described previously (Ishiguro et al. 1998; Suzuki et al. 2001; Szalmay et al. 2001). The ducts were attached to the glass coverslips pretreated with Cell-Tak (Becton Dickinson Labware, Bedford, MA) and were superfused at 37 °C on the stage of an inverted microscope. The bright-field images of the duct were obtained at 1 min intervals using a CCD camera. In order to determine the fluid secretory rate, the initial values for the length (L0), diameter (2R0) and image area (A0) of the duct lumen were measured in the first image of the series. The initial volume (V0) of the duct lumen was calculated, assuming cylindrical geometry, as πR02L0. The values of L0, R0 and V0 of the ducts used for experiments were 308 ± 9 μm, 70 ± 3 μm and 5.6 ± 0.5 nl, respectively (n = 72, mean ± S.E.M.). The luminal surface area of the epithelium was taken to be 2πR0L0. In subsequent images of the series, the luminal image area (A) was expressed as relative area (A/A0). Relative volume (V/V0) was estimated from relative area assuming V/V0= (A/A0)3/2. The rate of fluid secretion was calculated at 1 min intervals from the increment in duct volume and expressed as the secretory rate per unit luminal area of epithelium (nl min−1 mm−2). The validity of this method in the presence of 1 mM ethanol was confirmed by repetitive injections of 0.5 nl of the buffer into the duct lumen using a nanolitre-syringe driver (Sutter Instruments, Novato, CA, USA) as described previously (Ishiguro et al. 1998). The relationships between the cumulative injected volume and the calculated increase in volume in the absence and presence of ethanol were identical.
Measurement of intracellular Ca2+ concentration
Intracellular free Ca2+ concentration ([Ca2+]i) was estimated by microfluorometry in duct cells loaded with fura-2 as previously described (Ko et al. 1999). The cultured duct segments were incubated for 90 min at room temperature with the acetoxymethyl ester form of fura-2 (fura-2 AM; 3 μM). Microfluorometry was performed on a small area of the ductal epithelium (10 to 20 cells) illuminated alternately at 340 and 380 nm. The fluorescence intensities (F340 and F380) were measured at 510 nm. Changes in [Ca2+]i are presented as changes in the F340/F380 fluorescence ratio.
Materials
Secretin was obtained from the Peptide Institute (Minoh, Osaka, Japan); fura-2 AM from Dojindo Laboratories (Kumamoto, Japan); the acetoxymethyl ester form of 1,2-bis(O-amino phenoxy)ethane-N,N,N′,N′-tetraacetic acid (BAPTA AM) from Molecular Probes (Eugene, OR, USA); H89 from LKT Laboratories (St Paul, MN, USA); and acetylcholine (ACh), thapsigargin and dibutyryl cyclic AMP (dbcAMP) from Sigma (St Louis, MO, USA).
Statistics
Data are presented as means ±s.e.m. Tests for statistically significant differences were made with Student's t test for paired data or by analysis of variance followed by Tukey's post hoc procedure for unpaired multiple comparison.
RESULTS
Effects of ethanol on spontaneous (HCO3−-dependent) fluid secretion
Isolated interlobular ducts, superfused with HCO3−-CO2-free Hepes-buffered solution, produced little fluid secretion (−0.02 ± 0.03 nl min−1 mm−2, n = 5, Fig. 1A). When the bath solution was switched to the standard HCO3−-CO2-buffered solution, the fluid secretory rate increased to 0.95 ± 0.07 nl min−1 mm−2. When 1 mM ethanol was added to the bath, the fluid secretion transiently stopped for a period of 1 min but recovered to steady levels (0.98 ± 0.08) in the next 1 min period. The addition of 1 mM mannitol, a relatively impermeant molecule compared with ethanol, induced net fluid absorption (−0.30 ± 0.08 nl min−1 mm−2) in the first minute. The secretion then gradually returned to steady state levels in about 7 min. Thus the initial transient inhibition appears to be induced by an osmotic effect of ethanol that completely offsets the osmotic gradient created by net HCO3− transport into the duct lumen. The osmotic equilibrium is probably achieved in the next minute by a rapid diffusion of ethanol into the lumen.
Figure 1. Effects of ethanol on spontaneous fluid secretion, secretin-stimulated secretion and ACh-stimulated secretion.
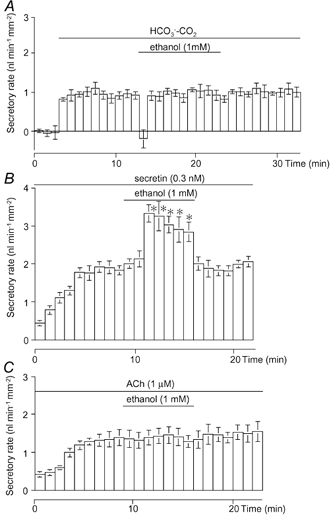
Effects of 1 mM of ethanol on spontaneous fluid secretion (A; n = 5), secretin (0.3 nM)-stimulated secretion (B; n = 6) and ACh (1 μM)-stimulated secretion (C; n = 4) from interlobular duct segments isolated from guinea-pig pancreas superfused with the standard HCO3− -CO2 -buffered solution. Values are means ±s.e.m.* Significant differences (P < 0.05) from control levels before the application of ethanol (1 mM).
Effects of ethanol on secretin-stimulated fluid secretion
In the presence of HCO3−-CO2, a submaximal concentration of secretin (0.3 nM) increased ductal fluid secretion to 1.75 ± 0.10 nl min−1 mm−2 (n = 6, Fig. 1B). Ethanol (1 mM) increased fluid secretion by 76 ± 13 % to 3.08 ± 0.19 nl min−1 mm−2 (n = 6). When ethanol was removed from the perfusate, the fluid secretory rate showed a quick and complete recovery.
Effects of ethanol on acetylcholine-stimulated fluid secretion
Acetylcholine (ACh) induces fluid secretion via the elevation of intracellular Ca2+ in pancreatic duct cells (Ashton et al. 1993). ACh (1 μM)-stimulated fluid secretion (1.42 ± 0.04 nl min−1 mm−2, n = 4) was not affected by 1 mM ethanol (Fig. 1C).
Relationship between ethanol concentration and fluid secretion
In order to identify the concentration range of ethanol that affects fluid secretion, ethanol (0.1–100 mM) was added to the bath during stimulation with either a physiological (1 pM) or pharmacological (1 nM) concentration of secretin (Fig. 2A and B). Ethanol in the range 0.3–30 mM significantly augmented the secretin-stimulated fluid secretion. Ethanol at 1 mM augmented fluid secretion stimulated by 1 pM and 1 nM of secretin by 55 % and 46 %, respectively. Ethanol at 100 mM significantly (P < 0.05) inhibited the secretory response to 1 pM secretin by about 15 % (Fig. 2A) but did not affect the secretion stimulated by 1 nM secretin (Fig. 2B).
Figure 2. Effects of ethanol concentration on fluid secretion stimulated by high and low concentrations of secretin.
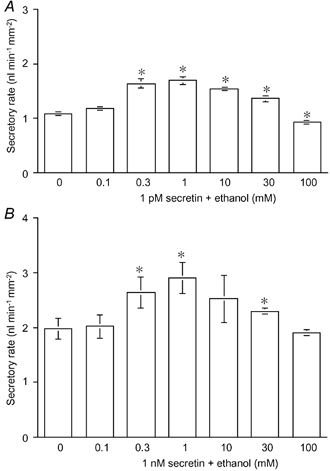
Effects of ethanol concentration on fluid secretion stimulated by 1 pM (A) and 1 nM (B) secretin in the presence of HCO3−-CO2. Values are means ±s.e.m. of 4–6 experiments. * Significant differences (P < 0.05) from control (without ethanol).
Effects of ethanol on the relationship between secretin concentration and fluid secretion
As shown in Fig. 3A, fluid secretion in response to 0.1 and 1 pM secretin was not significantly different from spontaneous secretion (0.82 ± 0.14 nl min−1 mm−2, n = 4). Secretin at 10 and 100 pM significantly (P < 0.01) increased the secretory rate to 1.34 ± 0.07 and 1.95 ± 0.10 nl min−1 mm−2, respectively. In the presence of 1 mM ethanol, the fluid secretion response to secretin (10−12−10−7 M) significantly (P < 0.01) increased (Fig. 3B and C). Ethanol (1 mM) augmented the maximal secretory response to secretin significantly (P < 0.01) by 41 % from 2.28 ± 0.09 to 3.21 ± 0.07 nl min−1 mm−2. As summarized in Fig. 3D, application of 0.3 nM secretin plus 1 μM Ach elicited an additive response (2.08 ± 0.20 nl min−1 mm−2) compared to that of each stimulant alone. In contrast, the combination of 0.3 nM secretin and 1 mM ethanol induced a much larger response (3.08 ± 0.19 nl min−1 mm−2) than the maximal secretory response to secretin alone (Fig. 3D).
Figure 3. Effects of 1 mM ethanol on the secretin concentration-fluid secretion relationship.
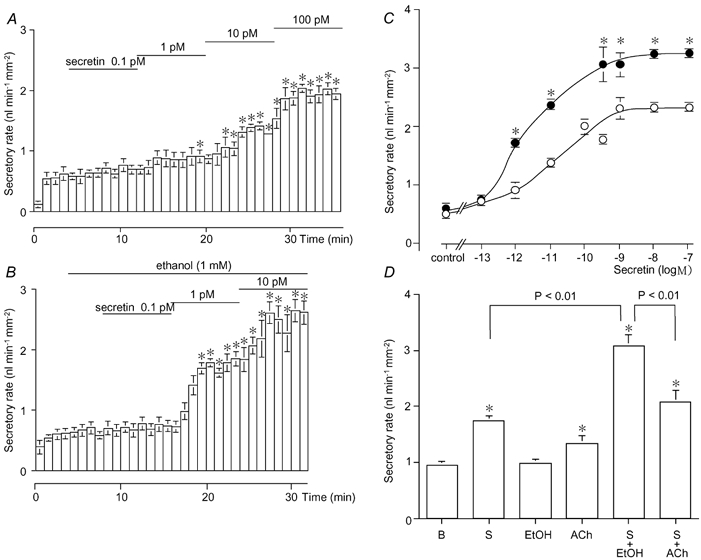
The concentrations of secretin (10−13−10−10 M) were sequentially increased in the absence (A; n = 4) or presence (B; n = 5) of 1 mM ethanol. * Significant differences (P < 0.05) from control (without secretin). C, concentration-response curve of the pooled data in the absence (○) and presence (•) of 1 mM ethanol. * Significant differences (P < 0.05) from the respective controls (without ethanol). D, effects of 0.3 nM secretin (S, n = 6), 1 mM ethanol (EtOH, n = 5), 1 μM ACh (n = 10), 0.3 nM secretin + 1 mM ethanol (S + EtOH, n = 6) and 0.3 nM secretin + 1 μM ACh (S + ACh, n = 5) on fluid secretion. * Significant differences (P < 0.05) from spontaneous basal secretion in the presence of HCO3− -CO2 (B, n = 5). Values are means + S.E.M.
Effects of ethanol on cAMP-stimulated fluid secretion
Secretin is believed to induce fluid secretion by elevating intracellular cyclic AMP. Ethanol was applied during stimulation with dbcAMP to investigate the cellular mechanism for the stimulatory effect of ethanol (Fig. 4A). Ethanol (1 mM) significantly (P < 0.01) augmented dbcAMP (0.5 mM)-stimulated fluid secretion (1.47 ± 0.20 nl min−1 mm−2, n = 7) to 2.19 ± 0.23 nl min−1 mm−2. Pancreatic ducts pre-treated with H89 (30 μM), an inhibitor of protein kinase A, failed to respond to 1 nM secretin (Fig. 4B). The secretory rate remained at the spontaneous levels (0.74 ± 0.10 nl min−1 mm−2, n = 5) and was not affected by 1 mM ethanol.
Figure 4. Effects of ethanol on fluid secretion stimulated by dbcAMP, or by secretin following preincubation with H89.
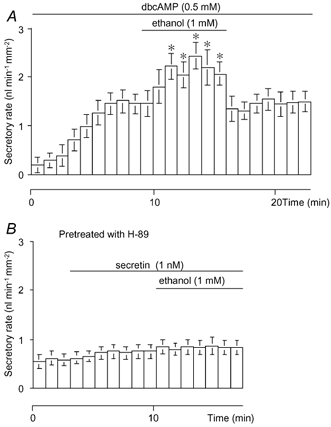
A, effects of 1 mM ethanol on fluid secretion stimulated by 0.5 mM dbcAMP (n = 7). B, effects of 1 mM ethanol on fluid secretion stimulated by 1 nM secretin in ducts preincubated with 30 μM H89 for 30 min just before experiments began (n = 5). Values are means ±s.e.m.* Significant differences (P < 0.05) from control levels before the application of ethanol (1 mM).
Effects of ethanol on [Ca2+]i
In unstimulated ducts, the application of 1 mM ethanol had no effect on [Ca2+]i, while 10 μM ACh induced a sustained increase in [Ca2+]i (Fig. 5A). During the stimulation with secretin (1 nM), ethanol (1 mM) increased [Ca2+]i transiently (Fig. 5B). When ACh was applied before ethanol treatment, the [Ca2+]i response was similar. The threshold concentration of ethanol to cause an effect was 0.3 mM (Fig. 5C). Ethanol at 0.3–10 mM induced a significant (P < 0.05) [Ca2+]i response, but the response was not dependent on concentration. The [Ca2+]i response was no longer detected at 100 mM ethanol. Secretin at submaximal concentrations (< 1 nM) alone had no effect on [Ca2+]i (Fig. 5D), while, in the presence of 1 mM ethanol, it evoked a change in [Ca2+]i after a lag period of 1–2 min (Fig. 5E), which probably reflects the time to produce a sufficient amount of cAMP for activating ethanol-dependent Ca2+ entry. As with secretin, the stimulation of ducts with dbcAMP (0.5 mM) alone had no effect on [Ca2+]i (Fig. 5F). Ethanol (1 mM) induced a transient increase of [Ca2+]i during the stimulation with dbcAMP (Fig. 5F), which is similar to the response observed in secretin-stimulated ducts (Fig. 5B). The removal of extracellular Ca2+ abolished the [Ca2+]i response to ethanol (Fig. 5G). Thapsigargin (1 μM; an inhibitor of the Ca2+-ATPase of the endoplasmic reticulum) evoked a sustained increase in [Ca2+]i in secretin-stimulated ducts. In the presence of thapsigargin, ethanol (1 mM) caused an additional small increase in [Ca2+]i (Fig. 5H).
Figure 5. Effects of ethanol on intracellular Ca2+ concentration shown as changes in fura-2 fluorescence ratio (F340/F380) in guinea-pig pancreatic duct cells.
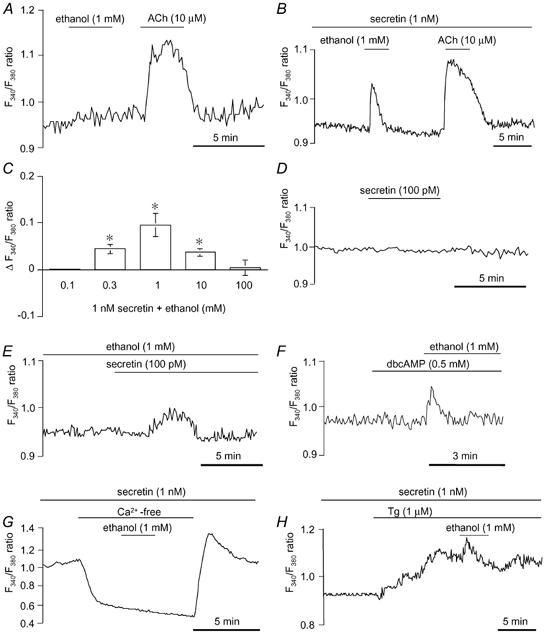
A and B, effects of 1 mM ethanol and 10 μM ACh on [Ca2+]i in unstimulated (A) and secretin (1 nM)-stimulated (B) ducts. C, effects of ethanol concentration (0.1–100 mM) on [Ca2+]i (means ±s.e.m. of change in fluorescence ratio (ΔF340/F380 ratio; n = 4) in ducts stimulated with 1 nM secretin. * Significant differences (P < 0.05). D and E, effects of 100 pM secretin on [Ca2+]i in the absence (D) and presence (E) of 1 mM ethanol. F, effects of 1 mM ethanol on [Ca2+]i in dbcAMP (0.5 mM)-stimulated ducts. G, effects of 1 mM ethanol on [Ca2+]i in secretin (1 nM)-stimulated ducts superfused with Ca2+-free solution. H, effects of 1 mM ethanol on [Ca2+]i in secretin (1 nM)-stimulated ducts in the presence of 1 μM thapsigargin (Tg). Each trace is representative of 4 experiments.
Effects of ethanol on fluid secretion in BAPTA-loaded ducts
To examine the role of intracellular Ca2+ in the augmentation of secretin-stimulated fluid secretion by ethanol, the duct segments were pre-incubated with 10 μM BAPTA AM for 30 min (Zhao et al. 1994). ACh (1 μM) failed to stimulate fluid secretion in the ducts loaded with BAPTA (Fig. 6A), indicating that changes in [Ca2+]i were effectively buffered using this protocol. In these ducts, secretin (1 nM) stimulated fluid secretion to 1.97 ± 0.12 nl min−1 mm−2 (n = 5, Fig. 6B), a value comparable to that observed in non-loaded ducts (Fig. 2B). Ethanol (1 mM) failed to augment secretin-stimulated secretion from the ducts loaded with BAPTA (Fig. 6B).
Figure 6. Effects of ethanol on fluid secretion from ducts loaded with BAPTA.
Ducts were pre-incubated with 10 μM BAPTA AM for 30 min. A, 1 μM ACh was applied to the BAPTA-loaded ducts (n = 4). B, the BAPTA-loaded ducts were first stimulated with 1 nM secretin and then 1 mM ethanol was added (n = 5). Values are means ± S.E.M.
DISCUSSION
Direct stimulatory effects of ethanol on ductal fluid secretion
In the present study we examined, for the first time, the direct effects of ethanol on fluid secretion from interlobular duct cells, where most water is secreted in the guinea-pig pancreas. Our major finding is that ethanol at concentrations relevant to usual levels of drinking (0.3–30 mM) augmented ductal fluid secretion stimulated by physiological (1–10 pM) as well as maximal (100 nM) concentrations of secretin. However the augmentation disappeared at the lethal blood level of ethanol (100 mM). The onset and disappearance of the action of ethanol was fairly rapid and completely reversible. Ethanol in vivo is oxidized to acetaldehyde primarily by hepatic alcohol dehydrogenase 2 (ADH2) (Yoshida et al. 1991). Therefore it appears that ethanol at lower concentrations acts directly on isolated duct cells. However, we cannot exclude the possibility that very small amounts of metabolites of ethanol produced by other ADH isozymes present in duct cells may play some role when the ethanol level exceeds 20 mM.
Effects of acute administration of ethanol on pancreatic exocrine secretion in vivo have been investigated in various species including man (Singh & Simsek, 1990; Hajnal et al. 1990; Niebergall-Roth et al. 1998). Oral or intragastric administration of ethanol stimulates pancreatic HCO3− and protein secretion when the gastric content is allowed to enter the duodenum, which suggests that increased gastric acid secretion mediates the stimulation of the pancreas. It has been demonstrated that intravenous administration of ethanol inhibits pancreatic secretion. However, doses of ethanol used previously were relatively high (20–100 mM) (Deitrich & Harris, 1996). Sarles and colleagues observed either a stimulation or an inhibition depending on the blood alcohol levels in conscious dogs (Kubota et al. 1983; Noel-Jorand & Sarles, 1983). Blood ethanol concentration less than 1 g l−1 (20 mM) augmented secretin-stimulated fluid and protein secretion, while ethanol concentration above 1 g l−1 inhibited secretion. The involvement of the vagus nerves was suggested because the stimulatory effect was inhibited by atropine. The present observation that ethanol in the range 0.3–30 mM augmented secretin-stimulated ductal fluid secretion (Fig. 2) is in good agreement with the earlier observations in vivo. This direct stimulatory effect on the duct cells is probably responsible for the alcohol-induced fluid and bicarbonate secretion that remained after administration of pentolinium, a ganglionic blocker (Noel-Jorand & Sarles, 1983).
Activation of the cAMP pathway is required for ethanol-induced fluid secretion
The ductal system of the exocrine pancreas produces a HCO3−-rich fluid secretion in response to stimuli including secretin and ACh. The epithelial cells lining intra- or interlobular pancreatic ducts are the major sites of HCO3− secretion (Case & Argent, 1993). Secretin stimulates HCO3− secretion via elevation of intracellular cAMP concentration. We found that ethanol strongly augmented secretin-stimulated fluid secretion. However, it failed to affect basal or Ach-stimulated secretion, indicating that activation of the cAMP pathway is required for ethanol-induced fluid secretion. Indeed, ethanol enhanced fluid secretion in the presence of dbcAMP, a membrane-permeant analogue of cAMP (Fig. 4A). Furthermore, the augmentation of secretin-stimulated fluid secretion by ethanol was abolished by pretreatment with a protein kinase A inhibitor H89 (Fig. 4B). The minimal concentration of secretin required for ethanol-induced secretion was very low. A concentration of secretin as low as 1 pM, which by itself had a marginal stimulatory effect, significantly increased secretion (Fig. 3). Fasting levels of secretin have been reported in the range 1–5 pM (Chang & Chey, 1980). Ingestion of a meal raised plasma secretin levels to a peak of 10 pM (Gyr et al. 1984). Thus, physiological levels of secretin are sufficient to cause ethanol-induced fluid secretion.
Ca2+ mobilization is required for ethanol-induced fluid secretion
In the present study we have demonstrated that ethanol induced a transient Ca2+ influx in secretin-stimulated ducts probably via the activation of Ca2+ channels (Fig. 5G). At submaximal concentrations of secretin, Ca2+ influx was observed only in the presence of 0.3–10 mM ethanol (Fig. 5B and E). Acute exposure to ethanol (42 mM) activated an L-type Ca2+ channel (McArdle et al. 1992). A combined application of ethanol (4.4 mM) and H2O2 (10 μM) activated a ryanodine receptor/Ca2+-release channel in skeletal muscle (Oba et al. 2000). It is not known why ethanol failed to induce Ca2+ influx in unstimulated ducts (Fig. 5A). The Ca2+ influx pathway activated by ethanol may also be regulated by cAMP as reported in other cell types (Gray et al. 1998). It is unlikely that secretin or ethanol increased the driving force for Ca2+ rather than activating an entry channel. In ducts filled with HCO3−-rich fluid, secretin did not affect the membrane potential (Ishiguro et al. 2002) and ethanol induced a small depolarization (authors' unpublished data). In the present study, pretreatment with BAPTA AM inhibited ACh-stimulated fluid secretion (Fig. 6A) and, as expected, the secretory response to secretin was unaffected by the presence of BAPTA (Fig. 6B). Since ethanol (1 mM) failed to augment secretin-stimulated fluid secretion when changes in [Ca2+]i were buffered with BAPTA, the transient Ca2+ influx must be necessary for ethanol-induced fluid secretion. In fact 100 mM ethanol, which failed to affect [Ca2+]i (Fig. 5C), also failed to increase fluid secretion (Fig. 2). How a transient increase in [Ca2+]i leads to the sustained increase of fluid secretion remains to be elucidated.
Ethanol augments the maximal rate of secretin-stimulated fluid secretion
Secretin at concentrations of 10−8-10−7 M evoked the maximal fluid secretory response (Fig. 3C). Ethanol (1 mM) significantly augmented the maximal secretory responses to secretin by as much as 40 %. The magnitudes of augmentation, i.e. the difference between the secretory rates with and without ethanol, appear to be similar irrespective of the concentration of secretin in the range 10−12–10−7 M. Thus the action of ethanol is not to shift the secretin concentration-fluid secretion response curve to the left but to elevate it, resulting in the augmentation of the maximal secretory response.
Cellular mechanisms for ethanol-induced fluid hypersecretion
The activation of the cAMP pathway and the transient Ca2+ entry triggered by ethanol were two crucial events for the induction of fluid hypersecretion. Both fluid hypersecretion and the transient Ca2+ increase by ethanol were observed in dbcAMP-stimulated as well as in secretin-stimulated ducts. Several lines of evidence indicate that there is no interaction between the calcium and cAMP pathways at the level of intracellular messenger production (Stuenkel & Hootman, 1990; Evans et al. 1996). Therefore it appears that the augmentation effect of ethanol probably occurs downstream of intracellular messenger generation. The augmentation of the maximal response to secretin (Fig. 3C), in which a generation of cAMP is maximally stimulated, is consistent with this interpretation.
In rat and guinea-pig pancreatic duct cells cholinergic stimulation activates Ca2+ influx via Ca2+ channels (Stuenkel & Hootman, 1990; Hug et al. 1996). The Ca2+ ionophore, ionomycin, mimicked the effect of ACh on [Ca2+]i and on fluid secretion from rat pancreatic duct cells (Ashton et al. 1993). When a Ca2+-mediated secretagogue is combined with a cAMP-mediated secretagogue, the protein secretory response from pancreatic acinar cells is greater than the additive response to the two individual responses in the guinea-pig, rat and mouse (Williams & Blevins, 1993). This potentiation was also observed when receptors were bypassed by the use of the Ca2+ ionophore and cAMP derivatives. However, as in rat pancreatic ducts (Evans et al. 1996), a simultaneous application of ACh and secretin failed to induce a potentiating effect (Fig. 3D). In contrast, a combination of secretin and ethanol elicited a much larger response than the combination of secretin and ACh, which excludes the possibility that ethanol potentiates fluid secretion by releasing ACh from residual nerves.
In the central nervous system the effects of ethanol are generally attributed to its direct action on neurotransmitter-gated ion channels (Little, 1999). Lower concentrations of ethanol (< 10 mM) have highly selective effects on certain target ion channels. For example, the nicotinic ACh receptor channel is modulated by 0.1 mM ethanol (Nagata et al. 1996). As in the central nervous system, low concentrations of ethanol (< 1 mM) had a significant and reversible effect on ductal fluid secretion. Furthermore, the onset and disappearance of the effect were rapid after the application and removal of ethanol from the superfusate. As ethanol can readily enter the intermolecular sites of ion channels, it may modify intermolecular forces and bonds that are important for the channel function (Naruse et al. 1999). Water follows the osmotic gradient created by the net movement of Cl− and HCO3− via aquaporin water channels (AQP1) present in the apical and basolateral membranes of duct cells (Ko et al. 2002; Furuya et al. 2002). Therefore, ethanol might have caused ductal fluid hypersecretion by directly modifying activities of cAMP-regulated ion channel, such as the cystic fibrosis transmembrane conductance regulator (CFTR), or other ion transporters that play a pivotal role in pancreatic fluid secretion (Case & Argent, 1993; Lee et al. 1999; Ishiguro et al. 2000; Choi et al. 2001). The channel molecule responsible for Ca2+ entry may be the site of ethanol action. The TRPV family of proteins regulated by intracellular lipid ligands (Benham et al. 2002) are possible candidates as ethanol can activate the vanilloid receptor-1 and thereby enhance the Ca2+ response to capsaicin (Trevisani et al. 2002). However these possibilities remain speculative until the exact site of action is elucidated.
A possible pathophysiological implication of ethanol-induced augmentation of secretion
Lower concentrations (5 %, v/v) of ethanol in the stomach stimulate gastric acid secretion (Lenz et al. 1983). When gastric acid enters the duodenum, it stimulates pancreatic fluid and bicarbonate secretion by releasing secretin from the duodenal mucosa. As discussed above, in the presence of 1 mM ethanol, i.e. a concentration found after usual levels of social drinking, a physiological concentration of secretin (1–10 pM) causes a significant increase of pancreatic fluid secretion from interlobular ducts. Although it is not known whether ethanol induces pancreatic fluid secretion in humans, pancreatic duct cells of guinea-pigs have similar physiological characteristics to those of humans (Case & Argent, 1993). Therefore, our data together with the earlier observation in dogs (Kubota et al. 1983; Noel-Jorand & Sarles, 1983) suggest that a small volume of alcoholic beverages may augment pancreatic fluid secretion. In the presence of a highly viscous pancreatic juice, protein plug or intraductal stones, ethanol-induced fluid hypersecretion would elevate the intraductal pressure in the proximal part of the duct, leading to oedema formation around acini. This possibility can explain the apparent lack of the threshold dose of alcohol that induces pancreatitis (Sarles, 1992) but requires further verification.
In conclusion, we have shown in isolated guinea-pig pancreatic ducts that low concentrations of ethanol, relevant to usual levels of drinking, strongly augments fluid secretion stimulated by physiological as well as maximal concentrations of secretin. The augmentation by ethanol appears to be mediated by both the intracellular cAMP pathway and Ca2+ mobilization, but the exact mechanisms remain to be studied.
Acknowledgments
This study was supported by grants from the Japan Society for the Promotion of Science, the Ministry of Health, Labour and Welfare (Japan), Pancreas Research Foundation of Japan and the Uehara Memorial Foundation. We thank Dr V. Wray for his advice.
REFERENCES
- Ashton N, Evans RL, Elliott AC, Green R, Argent BE. Regulation of fluid secretion and intracellular messengers in isolated rat pancreatic ducts by acethylcholine. J Physiol. 1993;471:549–562. doi: 10.1113/jphysiol.1993.sp019915. [DOI] [PMC free article] [PubMed] [Google Scholar]
- Benham CD, Davis JB, Randall AD. Vanilloid and TRP channels: a family of lipid-gated cation channels. Neuropharmacology. 2002;42:873–888. doi: 10.1016/s0028-3908(02)00047-3. [DOI] [PubMed] [Google Scholar]
- Case RM, Argent BE. Pancreatic duct cell secretion: control and mechanisms of transport. In: Go VLW, Di Magno EP, Gardner JD, Labenthal E, Reher HA, Scheele GA, editors. The Pancreas: Biology, Pathobiology and Disease. 2. New York: Blackwell Science Inc; 1993. pp. 301–350. [Google Scholar]
- Chang TM, Chey WY. Radioimmunoassay of secretin; a critical review and current status. Dig Dis Sci. 1980;25:529–552. doi: 10.1007/BF01315215. [DOI] [PubMed] [Google Scholar]
- Choi JY, Muallem D, Kiselyov K, Lee MG, Thomas PJ, Muallem S. Aberrant CFTR-dependent HCO3− transport mutations associated with cystic fibrosis. Nature. 2001;410:94–97. doi: 10.1038/35065099. [DOI] [PMC free article] [PubMed] [Google Scholar]
- Deitrich RA, Harris RA. How much alcohol should I use in my experiments. Alcohol Clin Exp Res. 1996;20:1–2. doi: 10.1111/j.1530-0277.1996.tb01033.x. [DOI] [PubMed] [Google Scholar]
- Evans RL, Ashton N, Elliott AC, Green R, Argent BE. Interactions between secretin and acetylcholine in the regulation of fluid secretion by isolated rat pancreatic ducts. J Physiol. 1996;496:265–273. doi: 10.1113/jphysiol.1996.sp021683. [DOI] [PMC free article] [PubMed] [Google Scholar]
- Furuya S, Naruse S, Ko SBH, Ishiguro H, Yoshikawa T, Hayakawa T. Distribution of aquaporin 1 in the rat pancreatic duct system examined with light and electron microscopic immunohistochemistry. Cell Tissue Res. 2002;308:75–86. doi: 10.1007/s00441-002-0527-x. [DOI] [PubMed] [Google Scholar]
- Gray PC, Scott JD, Catterall WA. Regulation of ion channels by cAMP-dependent protein kinase and A-kinase anchoring proteins. Curr Opin Neurobiol. 1998;8:330–334. doi: 10.1016/s0959-4388(98)80057-3. [DOI] [PubMed] [Google Scholar]
- Gyr K, Beglinger C, Fried M, Grotzinger U, Kayasseh L, Stalder GA, Girard J. Plasma secretin and pancreatic response to various stimulants including a meal. Am J Physiol. 1984;246:G535–542. doi: 10.1152/ajpgi.1984.246.5.G535. [DOI] [PubMed] [Google Scholar]
- Hajnal F, Flores MC, Radley S, Valenzuela JE. Effect of alcohol and alcoholic beverages on meal-stimulated pancreatic secretion in humans. Gastroenterology. 1990;98:191–196. doi: 10.1016/0016-5085(90)91309-t. [DOI] [PubMed] [Google Scholar]
- Hug MJ, Pahl C, Novak I. Calcium influx pathways in rat pancreatic ducts. Pflügers Arch. 1996;432:278–285. doi: 10.1007/s004240050134. [DOI] [PubMed] [Google Scholar]
- Ishiguro H, Naruse S, Kitagawa M, Suzuki A, Yamamoto A, Hayakawa T, Case RM, Steward MC. CO2 permeability and bicarbonate transport in microperfused interlobular ducts isolated from guinea-pig pancreas. J Physiol. 2000;528:305–315. doi: 10.1111/j.1469-7793.2000.00305.x. [DOI] [PMC free article] [PubMed] [Google Scholar]
- Ishiguro H, Naruse S, Steward MC, Kitagawa M, Ko SBH, Hayakawa T, Case RM. Fluid secretion in interlobular ducts isolated from guinea-pig pancreas. J Physiol. 1998;511:407–422. doi: 10.1111/j.1469-7793.1998.407bh.x. [DOI] [PMC free article] [PubMed] [Google Scholar]
- Ishiguro H, Steward MC, Lindsay ARG, Case RM. Accumulation of intracellular HCO3− by Na+-HCO3− cotransport in interlobular ducts from guinea-pig pancreas. J Physiol. 1996;495:169–178. doi: 10.1113/jphysiol.1996.sp021582. [DOI] [PMC free article] [PubMed] [Google Scholar]
- Ishiguro H, Steward MC, Sohma Y, Kubota T, Kitagawa M, Kondo T, Case RM, Hayakawa T, Naruse S. Membrane potential and bicarbonate secretion in isolated interlobular ducts from guinea-pig pancreas. J Gen Physiol. 2002;120:617–628. doi: 10.1085/jgp.20028631. [DOI] [PMC free article] [PubMed] [Google Scholar]
- Ko SBH, Naruse S, Kitagawa M, Ishiguro H, Furuya S, Mizuno N, Wang Y, Yoshikawa T, Suzuki A, Shimano S, Hayakawa T. Aquaporins in rat pancreatic interlobular ducts. Am J Physiol Gastrointest Liver Physiol. 2002;282:G324–331. doi: 10.1152/ajpgi.00198.2001. [DOI] [PubMed] [Google Scholar]
- Ko SBH, Naruse S, Kitagawa M, Ishiguro H, Murakami M, Hayakawa T. Arginine vasopressin inhibits fluid secretion in guinea-pig pancreatic duct cells. Am J Physiol. 1999;277:G48–54. doi: 10.1152/ajpgi.1999.277.1.G48. [DOI] [PubMed] [Google Scholar]
- Kubota K, Magee DF, Sarles H. Biphasic action of intravenous ethanol on dog exocrine pancreatic secretion. Dig Dis Sci. 1983;28:1116–1120. doi: 10.1007/BF01295811. [DOI] [PubMed] [Google Scholar]
- Laurence DR, Bennett PN. Clinical Pharmacology. 6. Edinburgh: Blackwell Science Inc; 1987. [Google Scholar]
- Lee MG, Choi JY, Luo X, Strickland E, Thomas PJ, Muallem S. Cystic fibrosis transmembrane conductance regulator regulates Cl−/HCO3− exchange in mouse submandibular and pancreatic ducts. J Biol Chem. 1999;274:14670–14677. doi: 10.1074/jbc.274.21.14670. [DOI] [PubMed] [Google Scholar]
- Lenz HJ, Ferrari-Taylor J, Isenberg JI. Wine and five percent ethanol are potent stimulants of gastric acid secretion in humans. Gastroenterology. 1983;85:1082–1087. [PubMed] [Google Scholar]
- Little HJ. The contribution of electrophysiology to knowledge of the acute and chronic effects of ethanol. Pharmacol Ther. 1999;84:333–353. doi: 10.1016/s0163-7258(99)00040-6. [DOI] [PubMed] [Google Scholar]
- McArdle JJ, Chol JJ, Huang G-J. Effects of imipramine and ethanol on the activity of a neuronal L-type calcium channel. Ann N Y Acad Sci. 1992;654:477–479. doi: 10.1111/j.1749-6632.1992.tb26005.x. [DOI] [PubMed] [Google Scholar]
- Nagata K, Aistrup GL, Huang C-S, Marszalec W, Song J-H, Yeh JZ, Narahashi T. Potent modulation of neuronal nicotinic acethylcholine receptor-channel by ethanol. Neurosci Lett. 1996;217:189–193. [PubMed] [Google Scholar]
- Naruse S, Kitagawa M, Ishiguro H. Molecular understanding of chronic pancreatitis: a perspective on the future. Mol Med Today. 1999;5:493–499. doi: 10.1016/s1357-4310(99)01595-6. [DOI] [PubMed] [Google Scholar]
- Niebergall-Roth E, Harder H, Singer MV. A review: acute and chronic effects of ethanol and alcoholic beverages on the pancreatic exocrine secretion in vivo and in vitro. Alcohol Clin Exp Res. 1998;22:1570–1583. doi: 10.1111/j.1530-0277.1998.tb03951.x. [DOI] [PubMed] [Google Scholar]
- Noel-Jorand MC, Sarles H. Simultaneous mechanisms on exocrine pancreatic secretion initiated by alcohol in conscious dog. Dig Dis Sci. 1983;28:879–888. doi: 10.1007/BF01317037. [DOI] [PubMed] [Google Scholar]
- Oba T, Ishikawa T, Murayama T, Ogawa Y, Yamaguchi M. H2O2 and ethanol act synergistically to gate ryanodine receptor/calcium-release channel. Am J Physiol Cell Physiol. 2000;279:C1366–1374. doi: 10.1152/ajpcell.2000.279.5.C1366. [DOI] [PubMed] [Google Scholar]
- Reber HA, Adler G, Karanjia N, Widdison A. Permeability characteristics of the main pancreatic duct in cats. In: Go VLW, DiMagno EP, Gardner JD, Labenthal E, Reher HA, Scheele GA, editors. The Pancreas: Biology, Pathobiology and Disease. 2. New York: Blackwell Science Inc; 1993. pp. 527–550. [Google Scholar]
- Sarles H. Alcoholic Pancreatitis. In: Burns GP, Bank S, editors. Disorders of the Pancreas. New York: Blackwell Science Inc; 1992. pp. 273–282. [Google Scholar]
- Singh M, Simsek H. Ethanol and the pancreas. Gastroenterology. 1990;98:1051–1062. doi: 10.1016/0016-5085(90)90033-w. [DOI] [PubMed] [Google Scholar]
- Stuenkel EL, Hootman SR. Secretagogue effects on intracellular calcium in pancreatic duct cells. Pflügers Arch. 1990;416:652–658. doi: 10.1007/BF00370610. [DOI] [PubMed] [Google Scholar]
- Suzuki A, Naruse S, Kitagawa M, Ishiguro H, Yoshikawa T, Ko SBH, Yamamoto A, Hamada H, Hayakawa T. 5-Hydroxytryptamine strongly inhibits fluid secretion in guinea-pig pancreatic duct cells. J Clin Invest. 2001;108:749–756. doi: 10.1172/JCI12312. [DOI] [PMC free article] [PubMed] [Google Scholar]
- Szalmay G, Varga G, Kajiyama F, Yang X-S, Lang TF, Case RM, Steward MC. Bicarbonate and fluid secretion evoked by cholecystokinin, bombesin and acetylcholine in isolated guinea-pig pancreatic ducts. J Physiol. 2001;535:795–807. doi: 10.1111/j.1469-7793.2001.00795.x. [DOI] [PMC free article] [PubMed] [Google Scholar]
- Tachibana I, Okabayashi Y, Akiyama T, Koide M, Matsushita K, Otsuki M. Ethanol inhibits CCK-induced enzyme secretion by affecting calcium-pump activity in isolated rat pancreatic acini. Pancreas. 1996;13:571–577. doi: 10.1097/00006676-199610000-00016. [DOI] [PubMed] [Google Scholar]
- Trevisani M, Smart D, Gunthorpe MJ, Tognetto M, Barbieri M, Campi B, Amadesi S, Gray J, Jerman JC, Brough SJ, Owen D, Smith GD, Randall AD, Harrison S, Bianchi A, Davis JB, Geppetti P. Ethanol elicits and potentiates nociceptor responses via the vanilloid receptor-1. Nat Neurosci. 2002;5:546–551. doi: 10.1038/nn0602-852. [DOI] [PubMed] [Google Scholar]
- Williams JA, Blevins GT., Jr Cholecystokinin and regulation of pancreatic acinar cell function. Physiol Rev. 1993;73:701–723. doi: 10.1152/physrev.1993.73.4.701. [DOI] [PubMed] [Google Scholar]
- Yoshida A, Hsu LC, Yasunami M. Genetics of human alcohol-metabolizing enzymes. Prog Nucleic Acid Res Mol Biol. 1991;40:255–287. doi: 10.1016/s0079-6603(08)60844-2. [DOI] [PubMed] [Google Scholar]
- Zhao H, Star RA, Muallem S. Membrane localization of H+ and HCO3− transporters in the rat pancreatic duct. J Gen Physiol. 1994;104:57–85. doi: 10.1085/jgp.104.1.57. [DOI] [PMC free article] [PubMed] [Google Scholar]