

Abstract
This study was undertaken to validate a new method of measuring cerebral metabolic rate in the fetal sheep based on heat production in a local region of the brain. Heat production was compared to oxygen use in 20 near-term fetuses during basal conditions, moderate hypoxia and cord occlusion. Thermocouples were placed to measure core and brain temperature and a composite probe placed in the parietal cortex to measure changes in cortical blood flow (CBF) using laser Doppler flowmetry and tissue PO2 using fluorescent decay. Catheters were inserted in a brachiocephalic artery and sagittal sinus for blood sampling. With moderate hypoxia, induced by administering 10−12 % oxygen to the ewes, fetal arterial PO2 declined from 23 ± 1 to 11 ± 1 Torr and brain tissue PO2 fell from 7.6± 0.7 to a nadir of 0.8 ± 0.4 Torr, while CBF increased to 139 ± 5 % of baseline. Cortical heat production, calculated as the product of CBF, the temperature gain from artery to brain tissue, and the specific heat of blood, decreased by 45 ± 11 % in parallel to similar declines in oxygen uptake. With severe asphyxia induced by complete cord occlusion for 10 min, fetal arterial PO2 declined from 23 ± 1 to 9 ± 2 Torr and brain tissue PO2 fell from 7.0 ± 0.7 to essentially 0 Torr while CBF decreased 40 ± 5 %. Cortical heat production decreased by 78 ± 6 % while oxygen use declined by 90 ± 3 %. Glucose uptake increased significantly relative to oxygen use and lactate concentration increased in sagittal sinus blood. We conclude that local measurements of heat production in the brain provide a useful index of overall metabolic rate, closely reflecting oxygen use in moderate hypoxia and indicating a significant contribution from anaerobic metabolism during severe asphyxia.
Fetal and newborn animals have increased tolerance to hypoxia when compared to adult animals (Duffy et al. 1975; Hochachka 1986; Mortola, 1997; Gunn et al. 2001). A number of mechanisms contribute to this tolerance and these include a diversion of blood flow to favour critical organs such as the brain and a regulated reduction of metabolic rate before oxygen stores are entirely depleted (Ashwal et al. 1984; Asakura et al. 1990; Bennet et al. 1998; Jensen et al. 1999; Singer, 1999). Together these changes tend to maintain the oxygen supply/oxygen use ratio during hypoxic stress.
In the fetal sheep cerebral blood flow (CBF) increases in moderate hypoxia (Purves & James, 1969; Jones et al. 1978; Ashwal et al. 1984; Bishai et al. 2003) so as to increase oxygen delivery to the brain at the expense of peripheral tissues (Jensen et al. 1999). However, during profound hypoxia, such as induced by umbilical cord occlusion, blood pressure and CBF decrease and oxygen use falls to negligible levels (Field et al. 1990; Hunter et al. 2003a). With such severe stress any residual energy production of the brain must depend on anaerobic pathways, normally quite limited in the adult (Chih et al. 2001), but possibly of more importance in the fetus in accord with its increased tolerance to anoxic stress (Hohimer et al. 1991; Singer, 1999; Van Cappellen et al. 1999).
In general, studies of metabolic control in the fetus have been limited by the lack of a method that would allow for the continuous measurement of brain metabolic rate. In this report we describe a method to measure the total metabolic rate of the fetal brain, i.e. anaerobic as well as aerobic processes, that is based on heat production in a local region of the parietal cortex. We report results of cortical heat production, blood flow, cortical tissue PO2, and the rate of oxygen use, glucose uptake, and lactate production during both moderate hypoxia and severe asphyxia in the late-term fetal sheep. We show evidence that heat production parallels oxygen use under conditions of moderate hypoxia, but that as tissue oxygen levels decline to asphyxic levels induced by cord occlusion heat production continues, a response indicating contributions from anaerobic pathways.
METHODS
Measurement of brain heat production using temperature difference and blood flow
The method to be described provides a continuous index of metabolic rate in a local region of the cerebral cortex. The method requires precise and sensitive measurement of temperature of arterial blood supplying the brain (Tblood) and the brain tissue itself (Tbrain). Subtracting Tbrain from Tblood gives the temperature increase resulting from brain metabolism. Multiplying this difference by blood flow (CBF; ml g−1 min−1) and the specific heat of blood (SH; 3.68 J g−1 °C−1 at a normal fetal haematocrit of 35 %) provides the heat production in the region of the brain wherein the sensors are placed. In steady state, when there is no net storage or release of heat and thus the rate of heat production (J g−1 min−1) matches the rate of elimination, the relationship may be summarized in equation form:
| (1) |
Once heat production is known, estimates of oxygen use (O2; μmol g−1 min−1) are readily calculated provided all metabolism is aerobic. This is because about 473 kJ of heat is produced per mole of oxygen used (4.8 cal ml−1 oxygen used), an equivalency that varies less than 11 % irrespective of whether the substrate is glucose, fat, or protein (Carpenter, 1939). Thus:
| (2) |
In essence the approach described here uses a modified Fick principle to calculate heat production. Because heat is highly diffusible in biological tissues, temperature equilibration between tissue, capillary and venous blood is assumed and the standard arterio-venous difference is then replaced by the arterio-tissue difference (Power, 1989). The method is generally applicable for other organs, but does require temperature-measuring devices that are able to accurately record temperature to a few hundredths of a degree centigrade.
The validity of the method depends on a number of assumptions, primary among them being that all the heat produced by the brain exits via blood flow while temperatures are in steady state conditions. The assumptions of the method are (1) that appreciable heat is not lost from the brain through the dura, scalp and amniotic fluid route, (2) that a steady state exists at the time the observation is made; i.e. that there is no net storage of heat in the brain or release of stored heat for the brain, as indicated by constant Tbrain, (3) that the temperature of an upper-body artery is a valid measure of the temperature of arterial blood supplying the brain; i.e. heat is not exchanged through a functional rete whereby venous blood or amniotic fluid would cool or warm arterial blood between the point of arterial temperature measurement and the brain; and (4) that there is temperature equilibration between venous blood leaving the local brain region and brain tissue itself. The latter assumption is quite safe given the highly diffusible nature of heat, which is many hundred-fold greater than oxygen (Power, 1989).
An additional validation step was performed to assess the contribution of the laser Doppler flowmetry (LDF) probe to heat production in the brain tissue. In a physical model system consisting of the LDF probe inserted into gelatin (GelTreat strawberry Gel-type dessert, Kozy Shack Inc., Hicksville, NY, USA) designed to simulate the brain tissue we found that the light from the LDF probe produced no measurable increase in temperature as measured by the thermocouple included alongside the LDF probe.
Use of the method to measure heat production in moderate hypoxia and severe asphyxia will now be described.
Surgery and instrumentation
Animal protocols were approved by the Institutional Animal Research Committee of Loma Linda University. Pregnant Western ewes were obtained from Nebeker Ranch (Lancaster, CA, USA) and were instrumented at 125-127 days of gestation (term ≈147 days). Following induction with thiopental sodium (10 mg kg−1 I.V.), anaesthesia was maintained by inhalation of 1.5-2.5 % halothane in oxygen through a cuffed endotracheal tube.
Under strict aseptic conditions the maternal abdominal wall and uterus were incised and the fetal head was delivered. A scalp incision was made rostral to the coronal suture, exposing the right and left parietal bones. A 1.5 mm burr hole was drilled on the right side 5 mm lateral to the sagittal suture and 10 mm caudal to the coronal suture. The tip of the LDF probe was inserted to a depth of 5-6 mm below the dura into the parasagittal parietal lobe cortex, and the probe fixed to the skull with tissue glue and supported as described previously (Lan et al. 2000). A polyvinyl catheter was then inserted into the sagittal sinus, and secured with tissue glue and dental dam. The catheter enabled recording of intracranial pressure and sampling of mixed venous blood from the anterior brain. The fetal scalp incision was closed, and the fetal head was replaced in the uterus.
Following instrumentation of the head, a polyvinyl catheter and thermocouple were inserted in the fetal brachiocephalic artery for arterial blood sampling and recording of blood pressure, heart rate, and arterial upper-body temperature. Lastly, a polyvinyl catheter was placed in the amniotic fluid for measurement of amniotic fluid pressure and administration of antibiotics. Fetuses assigned to the asphyxia group were instrumented with a reversible inflatable umbilical occluder (In Vivo Metric, Healdsburg, CA, USA) that was placed loosely around the umbilical cord near its abdominal insertion.
The uterine wall was sutured closed in layers, and catheters, probes and thermocouples were exteriorized to the ewe's left flank, and stored in a pouch attached to the maternal skin. Postoperatively, the ewe was given 900 000 U penicillin intramuscularly for 3 days, and the fetus was given 500 mg ampicillin and 40 mg gentamicin daily in the amniotic fluid until the experiments were completed. Fetal arterial blood gases were monitored daily for 3 days of postoperative recovery.
Experimental design
Hypoxia
Eleven fetuses were studied in the hypoxia protocol. During an initial 60 min normoxic baseline period, blood samples were taken at –60, –45, –30, –20, –10 and 0 min. This baseline period was followed by a 30 min period of fetal hypoxia induced by having the ewe breathe ≈10 % oxygen in a balance of nitrogen from a plastic bag placed over her head through which gas flowed at 30 l min−1. After initiation of the hypoxic period, blood samples were taken at 5, 10, 20 and 30 min. The animals were allowed to recover for 60 min with blood samples taken at: 40, 50, 60, 75 and 90 min during the recovery period.
Cord occlusion
Nine fetuses were studied in the cord occlusion protocol. During an initial 60 min normoxic baseline period, blood samples were taken at −60, −45, −30, −15, and 0 min. Asphyxia was then induced by complete occlusion of the umbilical cord for 10 min, with blood samples taken at 2 and 8 min. The animals were allowed to recover for 6 h, with blood samples taken at: 15, 20, 30, 50, 60, 90 and 120 min.
Blood sampling
Fetal arterial (0.3 ml) and sagittal sinus (0.3 ml) samples were collected and analysed for blood gases (ABL3, Radiometer, Copenhagen, Denmark). Values were corrected to the body temperature of the fetus. Haemoglobin concentration and oxyhaemoglobin saturation were measured spectrophotometrically (OSM2 Hemoximeter, Radiometer). Plasma glucose and lactate concentrations were measured using a YSI 2700 analyser (Yellow Springs Instruments, Dayton, OH, USA).
Laser Doppler measurements of cortical blood flow
Cortical blood flow was measured by use of a laser Doppler flowmeter (Oxford Optronics, Oxford, UK). A pulsatile signal and an in-range red blood cell mass signal indicated that the probe was sampling tissue flow. Because LDF provides a relative, not absolute, measure of flow, CBF values for each animal were calculated as a percentage of the average LDF values during the 60 min baseline period.
Intracortical oxygen tension measurements
Continuous monitoring of intracortical O2 tensions was performed using a fluorescent oxygen probe (Oxylite, Oxford Optronics), as described previously (Bishai et al. 2003). The probe was a 4-channel composite, 400 μM in diameter, consisting of a LDF probe with separate emitting and receiving fibres, a fluorescent PO2 probe, and a thermocouple. Unlike the Clarke-type oxygen electrode, this sensor does not consume O2 and is instead based on the fluorescent decay time of a ruthenium-based dye within brain tissue. A thermocouple was included in the probe to correct for temperature.
After the experiments were completed, the ewe and fetus were killed with 15 ml of a proprietary euthanasia solution given intravenously (Euthasol, Western Medical Supply, Arcadia, CA, USA).
Calculations and statistical analysis
Cortical blood flow, mean arterial blood pressure (MABP), and both core body and cortical temperatures were recorded continuously. The LDF, mean arterial blood pressure,and heart rate data were calculated and expressed as 1 min averages. Analog outputs were digitized (sampling rate 100 Hz) and stored using an analogue-to-digital converter (MP100, Biopac Systems Inc., Santa Barbara, CA, USA) and data acquisition software (Acqknowledge v3.5 for Macintosh, Biopac Systems Inc.). Data were calculated as means ± s.e.m. The significance of changes in CBF, tissue PO2, MABP, heart rate, arterial haemoglobin, oxyhaemoglobin saturation, PO2, and PCO2 from baseline values was detected using one-way ANOVA with repeated measures, followed by Fischer's test of least significant difference for multiple-comparisons (DATAMSTR, courtesy R.A. Brace, UC San Diego, USA). Statistical significance was assumed at P < 0.05.
Heat production was calculated using eqn (1) and results were expressed as a percentage of baseline for each animal. Cerebral O2 consumption was calculated at each blood sampling time point by multiplying CBF by the O2 content difference (Δ oxygen) between arterial and sagittal sinus blood. The cerebral arterio-venous difference for glucose (Δ glucose) and lactate (Δ lactate) was calculated as the difference between arterial and sagittal sinus blood. The glucose/oxygen quotient was calculated as (Δ glucose × 6)/(Δ oxygen). Since 6 mol oxygen is used during the complete oxidation of glucose to CO2 and water, the glucose/oxygen quotient provides an index of glucose use relative to O2 use, and thus is equal to 1 during conditions of aerobic glucose use. Periods of anaerobic metabolism are reflected by an increase in the glucose/oxygen quotient, indicating non-oxidative metabolism of glucose.
RESULTS
Hypoxia
Mean arterial blood pressures, heart rate and blood gas values
From a baseline of 46 ± 2 mmHg, MABP rose progressively throughout the 30 min hypoxic period to a peak of 55 ± 3 mmHg at 30 min (P < 0.05), and then declined gradually throughout recovery. From a baseline average of 170 ± 5 beats min−1, heart rate decreased during the first 15 min of hypoxia to a nadir of 130 ± 4 beats min−1 (P < 0.05), and then increased progressively during recovery to 141 ± 6 beats min−1.
The effects of maternal hypoxia on fetal arterial haemoglobin, PO2, PCO2, O2 content, pH, and lactate and glucose are summarized in Table 1. Maternal hypoxia led to declines of fetal preductal arterial PO2 from 23 ± 1 to 11 ± 1 Torr, with little change in arterial pH or PCO2. The fetal hypoxaemia was reversible and after a 30 min recovery interval, fetal arterial PO2 was indistinguishable from initial control values.
Table 1.
Time sequence of arterial O2 content, blood gases, and haemoglobin, glucose and lactate confcentrations in animals exposed to moderate hypoxia (n = 11) and severe asphyxia (n = 9) induced by cord occlusion
| Baseline | Hypoxia | Recovery | |||
|---|---|---|---|---|---|
| −30 min | +5 min | +30 min | +40 min | +90 min | |
| O2 content (mm) | 4.0 ± 0.2 | 2.2 ± 0.2* | 1.7 ± 0.1* | 3.9 ± 0.2 | 3.4 ± 0.2 |
| Po2 (Torr) | 23 ± 1 | 13 ± 1* | 11 ± 1* | 25 ± 1 | 21 ± 1 |
| Hb (g dl−1) | 9.6 ± 0.5 | 9.6 ± 0.5 | 10.0 ± 0.5 | 9.5 ± 0.4 | 8.8 ± 0.5 |
| Pco2 (Torr) | 49 ± 2 | 44 ± 2* | 45 ± 2 | 48 ± 2 | 48 ± 2 |
| pH | 7.30 ± 0.02 | 7.40 ± 0.02* | 7.30 ± 0.03 | 7.26 ± 0.02 | 7.32 ± 0.02 |
| Lactate (mm) | 1.46 ± 0.15 | 1.68 ± 0.19 | 5.94 ± 0.63* | 6.36 ± 0.75* | 4.06 ± 0.58* |
| Glucose (mm) | 1.37 ± 0.19 | 1.32 ± 0.20 | 1.73 ± 0.19* | 1.69 ± 0.21 | 1.62 ± 0.23 |
| Baseline | Cord occlusion | Recovery | |||
|---|---|---|---|---|---|
| −30 min | +2 min | +8 min | +15 min | +90 min | |
| O2 content (mm) | 4.3 ± 0.3 | 0.6 ± 0.1* | 0.5 ± 0.1* | 4.8 ± 0.5* | 4.1 ± 0.4 |
| Po2 (Torr) | 23 ± 1 | 5 ± 1* | 9 ± 2* | 27 ± 1 | 22 ± 2 |
| Hb (g dl−1) | 9.9 ± 0.2 | 10.4 ± 0.3 | 11.0 ± 0.4* | 10.9 ± 0.2 | 10.0 ± 0.5 |
| Pco2 (Torr) | 47 ± 2 | 72 ± 4* | 118 ± 6* | 56 ± 2* | 48 ± 3 |
| pH | 7.38 ± 0.01 | 7.21 ± 0.02* | 6.59 ± 0.02* | 7.20 ± 0.01* | 7.34 ± 0.02 |
| Lactate (mm) | 0.86 ± 0.13 | 2.57 ± 0.40* | 5.28 ± 0.69* | 5.03 ± 0.78* | 2.62 ± 0.67* |
| Glucose (mm) | 0.77 ± 0.1 | 0.32 ± 0.08* | 0.69 ± 0.2 | 1.59 ± 0.11* | 1.00 ± 0.21 |
Values are means ± s.e.m.
P < 0.01 vs. baseline.
Changes in CBF and tissue PO2 during moderate hypoxia
The changes in CBF and tissue oxygen tension (tPO2) before, during and after hypoxia are shown in Fig. 1. During hypoxia, CBF increased gradually, reaching a maximum of 139 ± 5 % (P < 0.01), and then returned to baseline during the first 30 min of recovery. Initiation of hypoxia was associated with a reduction of tPO2 from 7.6 ± 0.7 Torr to a nadir of 0.8 ± 0.4 Torr at 11 min (P < 0.01) and then a gradual increase to average 1.5 ± 0.8 Torr during the last 15 min of the hypoxic interval. During the recovery period, tPO2 increased to 12.5 ± 2.3 Torr, significantly higher than initial baseline (P < 0.05), and then returned to previous levels during the next 20 min.
Figure 1.

Heart rate, mean arterial blood pressure (MABP), cortical blood flow and cortical tissue PO2 in animals treated with either moderate hypoxia (n = 11) or severe asphyxia (n = 9) induced by cord occlusion. Data points represent means ± s.e.m.
Cortical heat production and O2 consumption
The effect of moderate hypoxia on cortical heat production is shown in Fig. 2. The mean value of Tbrain –Tblood during the baseline period was 0.20 ± 0.02 °C. This value decreased to 0.10 ± 0.02 °C during the hypoxic period (P < 0.05) and returned to baseline values during the recovery. Cortical heat production decreased 45 ± 11 % by the end of hypoxia (P < 0.01) and recovered to baseline values by ≈20 min.
Figure 2.
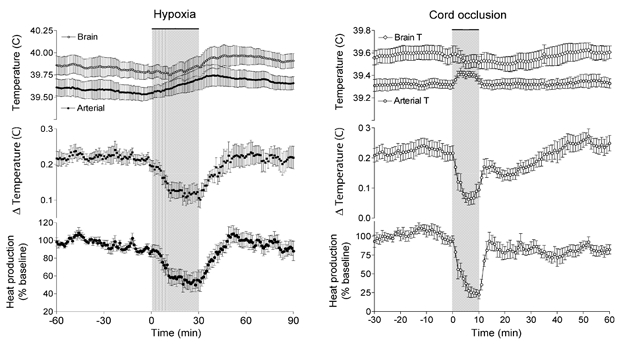
Brain and arterial temperature, the brain-arterial temperature difference (ΔTemperature), and cortical heat production in animals treated with either moderate hypoxia (n = 11) or severe asphyxia (n = 9) induced by cord occlusion. Data points represent means ± s.e.m.
Cerebral oxygen consumption decreased by 37 ± 8 % during hypoxia (P < 0.01), and recovered to baseline values by ≈30 min. These results are shown in Fig. 3 and may be compared to calculated heat production shown in Fig. 2. A relatively close, direct linear correlation between Tbrain –Tblood and the arterio-venous oxygen content difference is shown in Fig. 4 (r2 = 0.92, P < 0.001).
Figure 3.
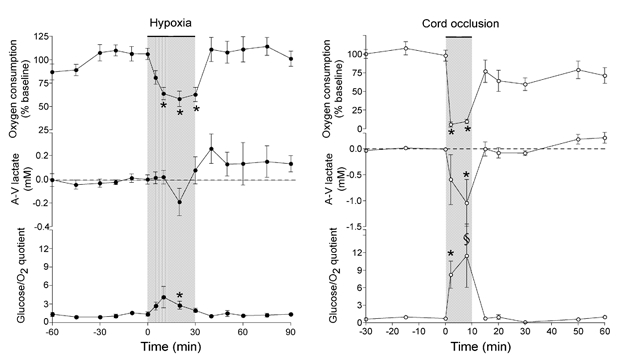
Cortical oxygen consumption, the arterio-venous difference of lactate across the cerebral circulation (A-V lactate), and the glucose/oxygen quotient (Δglucose × 6/Δoxygen) in animals treated with either moderate hypoxia (n = 8) or severe asphyxia induced by cord occlusion (n = 6). The glucose:oxygen quotient is equal to one when all glucose is oxidatively metabolized and higher during nonoxidative glycolysis. Values are means ± s.e.m. * P < 0.01, §P < 0.05 vs. baseline.
Figure 4.
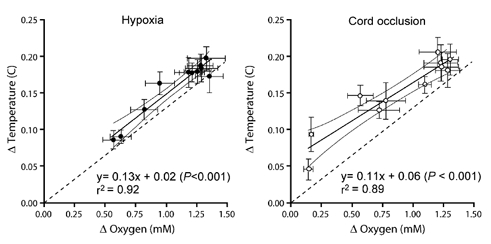
The arterio-tissue temperature difference for the parietal cortex (Δ Temperature) and the arterio-venous oxygen content difference (Δ Oxygen) in animals treated with either moderate hypoxia (n = 11) or severe asphyxia induced by cord occlusion (n = 9). The dashed line through the intercept shows the predicted relationship between Δ temperature and Δ oxygen assuming that 473 kJ are produced per mole of O2 consumed and that the specific heat of blood is 3.68 J g−1 °C−1.
The arterio-venous difference for lactate decreased minimally during hypoxia indicating a modest release of lactate from the brain (Fig. 3). It then reversed during recovery indicating lactate uptake by the brain. The glucose/oxygen quotient increased measurably but minimally during the first 10 min of the hypoxic interval and then returned towards baseline while hypoxia continued. This pattern of response is consistent with a minimal, transient increase in relative contribution of anaerobic pathways to total metabolism.
Asphyxia resulting from a 10 min cord occlusion
Mean arterial blood pressures, heart rate, and blood gas values
Cord occlusion was associated with severe fetal acidosis, hypercapnia and hypoxaemia (Table 1). Occlusion of the umbilical cord was followed by a sustained bradycardia, with a period of initial hypertension followed by progressive decline in blood pressure to a nadir of 25 ± 2 mmHg (P < 0.01, from a baseline of 45± 2 mmHg).
Changes in CBF and tissue PO2 during asphyxia
The changes in CBF before, during and after cord occlusion are shown in Fig. 1. Immediately after occlusion CBF initially increased to 15 % above baseline by 5 min and then declined to 40 % below baseline as blood pressure fell below ≈30 mmHg (P < 0.01). After release of cord occlusion, CBF increased above baseline for ≈25 min and then fell to values significantly below baseline. CBF gradually recovered to baseline during the next 8 h. Initiation of cord occlusion was associated within 2 min with a reduction of cortical tPO2 from baseline of 7.0 ± 0.7 Torr to essentially zero Torr (P < 0.01). Upon release of the cord, cortical tPO2 increased above baseline to 16.1 ± 1.2 Torr (P < 0.05, Fig. 1) and remained elevated during the next several hours.
Cortical heat production and oxygen consumption
The effect of cord occlusion on cortical heat production is shown in Fig 2. At the onset of cord occlusion arterial temperature rose ≈0.15 °C. This decrease in the temperature difference between the brain and arterial blood indicated decreased heat production of the cortex. During the last 3 min of the occlusion period cortical heat production fell to 22 % of baseline (P < 0.01). Absolute brain temperature decreased by 0.03 °C during occlusion, indicating a release of heat from the brain. The results of heat production as shown in the figure were calculated with this additional heat release taken into account. The correction added 3 % to the results.
Cerebral oxygen consumption decreased by 90 ± 3 % during cord occlusion (P < 0.01) and remained depressed in the recovery period (Fig. 3). This result may be compared to the time course of calculated heat production shown in Fig. 2. Again a direct, linear correlation was observed between Tbrain –Tblood and the arterio-venous difference for oxygen content (r2 = 0.89, P < 0.001) as shown in Fig. 4.
The arterio-venous difference for lactate decreased markedly during the occlusion interval, about five-fold more than during moderate hypoxia, indicating a significant release of lactate from the brain (P < 0.05, Fig. 3). The glucose/oxygen quotient increased about six-fold during occlusion, as shown in Fig. 3 (P < 0.01), and then returned to baseline during the first 5 min of the recovery period. This pattern of results is consistent with a major contribution to total metabolism from anaerobic pathways that persisted throughout the occlusive period.
DISCUSSION
These experiments compare brain-related responses to moderate hypoxia and cord occlusion in the near-term fetal sheep. The methodology employed offers important advances over those available previously. Responses were recorded for cortical blood flow, tissue PO2 and temperature from the same local region of the cortex. This was achieved by use of a composite probe that measured blood flow by laser Doppler flowmetry, tissue PO2 by a fluorescence-based sensor, and temperature by a thermocouple. The results provide clear evidence of a hypometabolic response directly related to the severity of reductions in tissue PO2.
The method described provided an index of total metabolic rate in the parietal cortex based on local heat production and used it to characterize responses to two types of hypoxic stress: moderate maternal hypoxia and severe asphyxia induced by cord occlusion. During moderate hypoxia cortical blood flow increased gradually to about 140 % of baseline values. This result is similar to earlier work in which fetal hypoxia was induced by the administration of 10−12 % O2 in nitrogen to the ewe (Ashwal et al. 1984; Blood et al. 2002; Hunter et al. 2003b). Oxygen consumption and heat production both declined in parallel to about 60 % of basal levels. Because there was a direct and linear relationship between oxygen use and heat production, these results indicate the usefulness of measurements of heat production as a surrogate for measurements of oxygen use during moderate hypoxia. The relationship indicates that while oxygen metabolism is significantly reduced during hypoxia, anaerobic metabolism is not a major source of energy production, a conclusion supported by the maintenance of a normal glucose/oxygen quotient and the absence of any appreciable lactate release into sagittal sinus blood.
During a 10 min period of complete umbilical cord occlusion, severe asphyxia developed, as evidenced by marked acidosis, hypercapnia, progressing hypotension, cerebral hypoperfusion, and pronounced tissue hypoxia, consistent with results of previous studies (Mallard et al. 1992; Bennet et al. 1998; Hunter et al. 2003a). Cortical blood flow initially increased by 15 % but then declined later in the asphyxia period as blood pressure fell below baseline levels. Within minutes of cord occlusion cerebral oxygen consumption had fallen to 10 % of baseline levels, while heat production also declined, but less so than oxygen use, and reached levels that averaged 22 % of baseline. Thus measurable metabolic activity capable of producing heat continued and was unrelated to oxygen use. This response is consistent with significant contributions to total energy production from anaerobic pathways, a conclusion that is supported by findings of lactate release from the brain and pronounced increases in the glucose/oxygen quotient during asphyxia. This association of findings is strongly indicative of a contribution of anaerobic glycolysis to maintain essential metabolic functions in the fetal brain during profound asphyxia.
Heat method for measuring metabolic rate of the brain
Heat is produced in tissues as a by-product of metabolic processes. Measurement of metabolic heat production as an index of total metabolism has been shown to be useful both in vitro (Doll et al. 1994; Johansson et al. 1995; Lou et al. 2000) and for both the whole body and brain in vivo (Abrams et al. 1977; Power et al. 1984; Nybo et al. 2002). Measurement of metabolic heat production provides the important advantage of allowing for total contributions to metabolic rate (not just oxygen consumption). In conditions of exclusive aerobic metabolism heat production must fall to zero when oxygen use falls to zero. Any continuing heat production without oxygen uptake then provides evidence of non-oxidative anaerobic processes. Examination of Fig. 4 shows an intercept close to zero during moderate hypoxia, in accord with the tenet that brain metabolism is exclusively aerobic when studied in the moderate hypoxic range. However, the intercept lies appreciably above zero during cord occlusion. This elevated intercept, along with the continued uptake of glucose and release of lactate by the brain, is evidence for an anaerobic contribution to energy production in the context of these experiments.
Heat-oxygen comparisons
Figure 4 shows that brain temperature is slightly but detectably higher than can be accounted for on the basis of 473 kJ of heat being released for each mole of oxygen being taken up by the brain and a value for the specific heat of blood of 3.68 kJ g−1 °C−1. This is demonstrated by the elevation of the fitted (continuous) lines over the expected (dashed) lines. A number of possibilities merit consideration in exploring the reason for this finding. One possibility is that heat from the LDF probe results in local temperature elevations and a falsely high calculation of heat production. However, as noted in the Methods section, a physical model indicated that this is not the case. A second possibility is that the tissue thermocouple was located in grey matter, which has a relatively high metabolic rate, whereas sagittal sinus blood reflects oxygen use by both white matter, which has a lower metabolic rate, and grey matter. This possibility cannot be discounted entirely until the metabolic rate in white matter alone and the changes that occur during hypoxia and asphyxia can be measured. As shown by Ashwal and coworkers (Ashwal et al. 1984), there is an appreciable inhomogeneity in blood flow between different regions of the fetal brain. The present results apply only to the cortex, a fairly homogenous region with respect to blood flow (Bishai et al. 2003), and do not apply globally to brainstem, hippocampus and white matter, where flow responses to hypoxia differ (Ashwal et al. 1984). There is also the possibility of a small but measurable contribution to total metabolism from anaerobic processes, even with normal O2 delivery, but the absence of lactate in sagittal sinus blood and a glucose/oxygen quotient equal to 1, as well as previous work by others, argue against this possibility (Tsoulos et al. 1972; Hohimer et al. 1991; Turbow et al. 1995).
Assumptions and critique of heat method
A number of possible shortcomings should be considered in evaluating the usefulness of the new method for assessing metabolic rate using heat production. The method is based on the Fick principle and assumes temperature equilibration between brain tissue and capillaries and hence venous drainage. Thus brain tissue temperature replaces venous temperature in the traditional Fick approach. Given the highly diffusible nature of heat, this assumption seems well justified. The method also assumes that temperature measured in the ascending aortic blood is equal to the temperature of arterial blood entering the brain. This assumption would be violated if the rete, which is known to be anatomically present in the vasculature supplying the sheep brain (Baldwin & Bell, 1963), were to exchange significant amounts of heat. Although the functional importance of the rete before birth is unknown, it seems likely to be exceptionally small, because the temperature gradients available to move heat are only a few tenths of a degree Celsius (Power, 1989). Nonetheless, the importance of the rete might change during asphyxia when brain metabolism falls to near zero and this possibility merits further study.
The method would be in error if appreciable amounts of heat were lost from the brain region under study through the dura and scalp into the amniotic fluid independently of blood flow. This too seems unlikely to be of quantitative importance because blood flow has a large capacity to carry heat away relative to the capacity of heat to diffuse over a distance of 5 mm, that distance representing the depth of probe placement into the substance of the brain. Finally the method would be in error if appreciable net quantities of heat were stored in or released from the brain over the time period of study, i.e. if there were appreciable thermal inertia. The tendency of temperature curves to rapidly approach new stable values during hypoxia, however, indicates that new temperature steady states are rapidly achieved. The data reported here were collected when changes in brain temperature were minimal and errors from heat storage or release were calculated to be less than 5 % of total heat production.
Laser Doppler flowmetry
The measurement of heat production using the Fick equation depends critically on continuous measurements of cortical blood flow. For this purpose LDF was used, as adapted for the chronically instrumented ovine fetus (Lan et al. 2000; Blood et al. 2002). The method has recently been evaluated and validated during hypoxia in the fetal sheep by comparing results obtained using LDF and labelled microspheres during hypoxia (Bishai et al. 2003). In addition, Muller and coworkers have demonstrated an acceptable correlation between data obtained with LDF and microspheres in response to hypercapnia in studies of fetal cerebral autoregulation (Muller et al. 2002). The method is limited in that it provides only values relative to a baseline. Values calculated from flow changes, including oxygen use and heat production, are similarly limited to relative change. Despite this limitation, the introduction of a continuous measurement of flow provides important information that was not available using previous methodologies. Note that comparisons of oxygen use and heat production, as shown in Fig. 4, do not depend on laser Doppler measurements of flow, as the term is common to both Fick calculations.
Evidence of anaerobic contribution to total metabolism
Figure 3 shows changes in oxygen consumption, Δ lactate across the brain, and glucose utilization relative to oxygen use (glucose/oxygen quotient) during hypoxia and cord occlusion experiments. During cord occlusion, and to a much lesser extent during hypoxia, these factors change in a manner consistent with anaerobic metabolism. Thus, after 8 min of cord occlusion, for example, glucose uptake continues at ≈86 % of baseline values while O2 use has diminished to ≈10 % of baseline. At this time there is a net entry of lactate into sagittal sinus blood. Heat production continues at 22 % of baseline. This combination of results is consistent with anaerobic contributions to production of ATP and heat. The contribution appears to be substantial, despite a lower energy yield wherein only 2 ATP molecules result from lactate production, in contrast to 38 ATP molecules derived from complete oxidation of a mole of glucose to water and carbon dioxide.
Earlier studies of aerobic and anaerobic brain metabolism
In the present study during moderate hypoxia cortical oxygen consumption decreased without evidence of significant anaerobic metabolism. Thus glucose, the primary substrate of brain tissues, continued to be metabolized aerobically as indicated by the proportional uptake of glucose and oxygen. A close matching of oxygen uptake and heat production was also observed in the present study when the degree of hypoxia was moderate. In contrast to this work, previous workers have suggested that cerebral oxygen consumption is maintained in the fetal sheep until arterial oxygen content is severely reduced (below ≈1.5 mmol l−1) (Jones et al. 1977; Field et al. 1990; Richardson et al. 1993). However, examination of the data presented in two of these studies (Field et al. 1990; Richardson et al. 1993) suggests that oxygen metabolism is in fact reduced during moderate hypoxia in relation to oxygen delivery, as suggested by the results of this study.
In agreement with our data indicating a significant increase in anaerobic metabolism and continued heat production during severe reductions in oxygen delivery, other workers have shown significant increases in anaerobic metabolism in the fetal sheep during severe ischaemia (Chao et al. 1989) and asphyxia (Hohimer et al. 1991; Van Cappellen et al. 1999; Kaneko et al. 2003).
Hypometabolism
A growing body of evidence suggests the linkage between oxygen supply and metabolic rate may be a regulated response that is operative before severe asphyxia and inevitable oxygen starvation. Because these responses occur before ATP stores are exhausted, the mechanism has been termed adaptive or regulated hypometabolism (Duffy et al. 1975; Mortola, 1997; Rohlicek et al. 1998; Suzuki et al. 2000). Thus, as hypoxia progressively deepens in the fetus and newborn of many species, cerebral oxygen consumption also diminishes progressively (Vannucci & Duffy, 1976; Singer, 1999; Boutilier, 2001; Hochachka & Lutz, 2001). The biochemical control(s) of this response are not firmly established. One possible candidate molecule is adenosine, a known powerful suppressor of metabolic rate in both the adult (Boutilier, 2001) and the fetus (Karimi et al. 1996; Newman et al. 2001), that increases in concentration in plasma (Kubonoya et al. 1998) and within the brain in response to hypoxia and asphyxia (Winn et al. 1981; Koos et al. 1997). Furthermore, we have recently demonstrated that inhibition of the adenosine A1 receptor during a 10 min period of complete cord occlusion resulted in significantly increased neuronal cell death compared to controls, delayed the suppression of EEG activity, and resulted in increased cerebral metabolism, as evidenced by continued heat production (Hunter et al. 2003a).
Figure 5 is a summary figure that shows the relation of cerebral oxygen consumption, cortical heat production, and the glucose/oxygen quotient in relation to oxygen delivery for the hypoxic and asphyxia experiments together. Oxygen consumption declines progressively to zero during reductions in oxygen delivery to the brain while heat production also declines, but does not fall to zero. Glucose uptake in excess of oxygen uptake becomes pronounced with severely restricted oxygen delivery. These combined results thus further indicate continued energy production from non-oxidative glucose use that could contribute to brain ATP levels before and during complete oxygen starvation. These data are in sharp contrast to data in adult animals and humans which indicate that cerebral metabolism is maintained during severe reductions in oxygen delivery until near oxygen starvation (Cohen et al. 1967; Duffy et al. 1975; Gjedde et al. 2002). The ability to reduce non-essential oxygen use during moderate hypoxia and increase anaerobic contributions to ATP production during severe asphyxia may be credibly put forward as major mechanisms responsible for the pronounced fetal tolerance to hypoxia.
Figure 5.
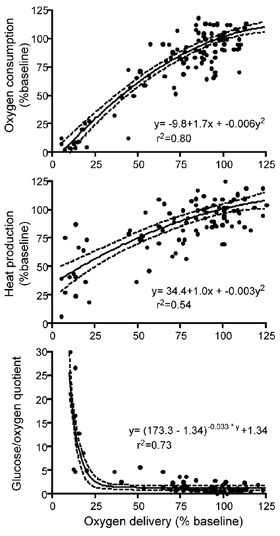
Cortical oxygen consumption, cortical heat consumption, and the glucose/oxygen quotient (Δ glucose × 6/Δ oxygen) in all experiments plotted against cortical oxygen delivery. Note the progressively steep increase of the glucose/oxygen ratio and maintenance of heat production as oxygen delivery falls below 50 % of baseline. These findings are consistent with anaerobic contributions to total metabolism during severe hypoxic stress. Individual data points are plotted and fitted to equations represented by the solid lines, the 95 % confidence intervals are shown as dashed lines.
Conclusions
We have described a method to measure total energy production by the fetal brain based on the Fick principle. Local measurements of heat production in the brain are shown to provide a useful index of metabolic rate, closely reflecting oxygen use in moderate hypoxia and indicating a significant contribution from anaerobic metabolism during severe asphyxia. These results provide the first reported continuous measurement of fetal cortical metabolic responses to hypoxia and asphyxia.
When oxygen delivery to the fetal brain is moderately reduced by hypoxia, cerebral oxygen consumption is reduced without increases in anaerobic glucose use. During markedly impaired oxygen delivery induced by cord occlusion, brain tissue PO2 falls to near zero and oxygen consumption decreases to negligible levels, yet heat production continues at ≈22 % of basal levels, in association with continued uptake of glucose and release of lactate into venous blood. Thus anaerobic processes provide an important energy source during severe asphyxia. This response in which oxygen consumption decreases during a reduction in oxygen delivery is clearly different from that of adult animals where cerebral metabolic rate remains constant until oxygen delivery is severely reduced.
The mechanisms controlling the rate of oxygen use and conversion to anaerobic pathways are largely unexplored in the fetus, but are of clear importance in withstanding hypoxic stresses and for long term growth and development. Active induction of adaptive hypometabolism by adenosine and other mediators during hypoxic stress is a likely possibility. The method described will aid investigation of these mechanisms in the brain and other organs.
Acknowledgments
The authors thank Shannon Bragg for expert technical assistance and Alistair J. Gunn and Laura Bennet for critical review and helpful suggestions. This work was supported in part by USPHS NIH HL 654941.
REFERENCES
- Abrams RM, Clapp JF, Notelovitz M, Tyler T, Cassin S. Heat production of fetal sheep brain in utero. J Appl Physiol. 1977;43:747–749. doi: 10.1152/jappl.1977.43.4.747. [DOI] [PubMed] [Google Scholar]
- Asakura H, Ball KT, Power GG. Interdependence of arterial po2 and o2 consumption in the fetal sheep. J Dev Physiol. 1990;13:205–213. [PubMed] [Google Scholar]
- Ashwal S, Dale PS, Longo LD. Regional cerebral blood flow: Studies in the fetal lamb during hypoxia, hypercapnia, acidosis, and hypotension. Pediatr Res. 1984;18:1309–1316. doi: 10.1203/00006450-198412000-00018. [DOI] [PubMed] [Google Scholar]
- Baldwin BA, Bell FR. The anatomy of the cerebral circulation of the sheep and ox. The dynamic distribution of the blood supplied by the carotid and vertebral arteries to cranial regions. J Anat. 1963;97:203–215. [PMC free article] [PubMed] [Google Scholar]
- Bennet L, Peebles DM, Edwards AD, Rios A, Hanson MA. The cerebral hemodynamic response to asphyxia and hypoxia in the near-term fetal sheep as measured by near infrared spectroscopy. Pediatr Res. 1998;44:951–957. doi: 10.1203/00006450-199812000-00022. [DOI] [PubMed] [Google Scholar]
- Bishai JM, Blood AB, Hunter CJ, Longo LD, Power GG. Fetal lamb cerebral blood flow (CBF) and oxygen tensions during hypoxia: A comparison of laser Doppler and microsphere measurements of CBF. J Physiol. 2003;546:869–878. doi: 10.1113/jphysiol.2002.025270. [DOI] [PMC free article] [PubMed] [Google Scholar]
- Blood AB, Hunter CJ, Power GG. The role of adenosine in regulation of cerebral blood flow during hypoxia in the near-term fetal sheep. J Physiol. 2002;543:1015–1023. doi: 10.1113/jphysiol.2002.023077. [DOI] [PMC free article] [PubMed] [Google Scholar]
- Boutilier RG. Mechanisms of cell survival in hypoxia and hypothermia. J Exp Biol. 2001;204:3171–3181. doi: 10.1242/jeb.204.18.3171. [DOI] [PubMed] [Google Scholar]
- Carpenter TM. Tables for Respiratory Exchange. Washington: Carnegie Institution of Washington Publication; 1939. [Google Scholar]
- Chao CR, Hohimer AR, Bissonnette JM. Cerebral carbohydrate metabolism during severe ischemia in fetal sheep. J Cereb Blood Flow Metab. 1989;9:53–57. doi: 10.1038/jcbfm.1989.7. [DOI] [PubMed] [Google Scholar]
- Chih CP, Lipton P, Roberts EL., Jr Do active cerebral neurons really use lactate rather than glucose. Trends Neurosci. 2001;24:573–578. doi: 10.1016/s0166-2236(00)01920-2. [DOI] [PubMed] [Google Scholar]
- Doll C, Hochachka P, Hand S. A microcalorimetric study of turtle cortical slices: Insights into brain metabolic depression. J Exp Biol. 1994;191:141–153. doi: 10.1242/jeb.191.1.141. [DOI] [PubMed] [Google Scholar]
- Duffy TE, Kohle SJ, Vannucci RC. Carbohydrate and energy metabolism in perinatal rat brain: Relation to survival in anoxia. J Neurochem. 1975;24:271–276. doi: 10.1111/j.1471-4159.1975.tb11875.x. [DOI] [PubMed] [Google Scholar]
- Field DR, Parer JT, Auslender RA, Cheek DB, Baker W, Johnson J. Cerebral oxygen consumption during asphyxia in fetal sheep. J Dev Physiol. 1990;14:131–137. [PubMed] [Google Scholar]
- Gjedde A, Marrett S, Vafaee M. Oxidative and nonoxidative metabolism of excited neurons and astrocytes. J Cereb Blood Flow Metab. 2002;22:1–14. doi: 10.1097/00004647-200201000-00001. [DOI] [PubMed] [Google Scholar]
- Gunn AJ, Quaedackers JS, Guan J, Heineman E, Bennet L. The premature fetus: Not as defenseless as we thought, but still paradoxically vulnerable. Dev Neurosci. 2001;23:175–179. doi: 10.1159/000046139. [DOI] [PubMed] [Google Scholar]
- Hochachka PW, Lutz PL. Mechanism, origin, and evolution of anoxia tolerance in animals. Comp Biochem Physiol B Biochem Mol Biol. 2001;130:435–459. doi: 10.1016/s1096-4959(01)00408-0. [DOI] [PubMed] [Google Scholar]
- Hohimer AR, Chao CR, Bissonnette JM. The effect of combined hypoxemia and cephalic hypotension on fetal cerebral blood flow and metabolism. J Cereb Blood Flow Metab. 1991;11:99–105. doi: 10.1038/jcbfm.1991.11. [DOI] [PubMed] [Google Scholar]
- Hunter CJ, Bennet L, Power GG, Roelfsema V, Blood AB, Quaedackers JS, George S, Guan J, Gunn AJ. A key neuroprotective role for endogenous adenosine A1 receptor activation during asphyxia in the fetal sheep. Stroke. 2003a doi: 10.1161/01.STR.0000083623.77327.CE. in press. [DOI] [PubMed] [Google Scholar]
- Jensen A, Garnier Y, Berger R. Dynamics of fetal circulatory responses to hypoxia and asphyxia. Eur J Obstet Gynecol Reprod Biol. 1999;84:155–172. doi: 10.1016/s0301-2115(98)00325-x. [DOI] [PubMed] [Google Scholar]
- Johansson D, Nilsson G, Oum L, Rnblom E. Effects of anoxia on energy metabolism in crucian carp brain slices studied with microcalorimetry. J Exp Biol. 1995;198:853–859. doi: 10.1242/jeb.198.3.853. [DOI] [PubMed] [Google Scholar]
- Jones M, Jr, Sheldon RE, Peeters LL, Meschia G, Battaglia FC, Makowski EL. Fetal cerebral oxygen consumption at different levels of oxygenation. J Appl Physiol. 1977;43:1080–1084. doi: 10.1152/jappl.1977.43.6.1080. [DOI] [PubMed] [Google Scholar]
- Jones MD, Jr, Sheldon RE, Peeters LL, Makowski EL, Meschia G. Regulation of cerebral blood flow in the ovine fetus. Am J Physiol. 1978;235:H162–166. doi: 10.1152/ajpheart.1978.235.2.H162. [DOI] [PubMed] [Google Scholar]
- Kaneko M, White S, Homan J, Richardson B. Cerebral blood flow and metabolism in relation to electrocortical activity with severe umbilical cord occlusion in the near-term ovine fetus. Am J Obstet Gynecol. 2003;188:961–972. doi: 10.1067/mob.2003.219. [DOI] [PubMed] [Google Scholar]
- Karimi A, Ball KT, Power GG. Exogenous infusion of adenosine depresses whole body O2 use in fetal/neonatal sheep. J Appl Physiol. 1996;81:541–547. doi: 10.1152/jappl.1996.81.2.541. [DOI] [PubMed] [Google Scholar]
- Koos BJ, Kruger L, Murray TF. Source of extracellular brain adenosine during hypoxia in fetal sheep. Brain Res. 1997;778:439–442. doi: 10.1016/s0006-8993(97)01207-9. [DOI] [PubMed] [Google Scholar]
- Kubonoya K, Yoneyama Y, Sawa R, Araki T, Power GG. Brain temperature and metabolic responses during umbilical cord occlusion in fetal sheep. Pflugers Arch. 1998;436:667–672. doi: 10.1007/s004240050687. [DOI] [PubMed] [Google Scholar]
- Lan J, Hunter CJ, Murata T, Power GG. Adaptation of laser-Doppler flowmetry to measure cerebral blood flow in the fetal sheep. J Appl Physiol. 2000;89:1065–1071. doi: 10.1152/jappl.2000.89.3.1065. [DOI] [PubMed] [Google Scholar]
- Lou F, Van Der Laarse WJ, Curtin NA, Woledge RC. Heat production and oxygen consumption during metabolic recovery of white muscle fibres from the dogfish scyliorhinus canicula. J Exp Biol. 2000;203:1201–1210. doi: 10.1242/jeb.203.7.1201. [DOI] [PubMed] [Google Scholar]
- Mallard EC, Gunn AJ, Williams CE, Johnston BM, Gluckman PD. Transient umbilical cord occlusion causes hippocampal damage in the fetal sheep. Am J Obstet Gynecol. 1992;167:1423–1430. doi: 10.1016/s0002-9378(11)91728-1. [DOI] [PubMed] [Google Scholar]
- Mortola J. Developmental aspects of the ventilatory adaptation to hypoxia: Hypometabolism and its implications. In: Houston C, Coates G, editors. Hypoxia: Woman at Altitude. Burlington: Queen City Printers; 1997. pp. 166–176. [Google Scholar]
- Muller T, Lohle M, Schubert H, Bauer R, Wicher C, Antonow-Schlorke I, Sliwka U, Nathanielsz PW, Schwab M. Developmental changes in cerebral autoregulatory capacity in the fetal sheep parietal cortex. J Physiol. 2002;539:957–967. doi: 10.1113/jphysiol.2001.012590. [DOI] [PMC free article] [PubMed] [Google Scholar]
- Newman JP, Peebles DM, Hanson MA. Adenosine produces changes in cerebral hemodynamics and metabolism as assessed by near-infrared spectroscopy in late-gestation fetal sheep in utero. Pediatr Res. 2001;50:217–221. doi: 10.1203/00006450-200108000-00009. [DOI] [PubMed] [Google Scholar]
- Nybo L, Secher NH, Nielsen B. Inadequate heat release from the human brain during prolonged exercise with hyperthermia. J Physiol. 2002;545:697–704. doi: 10.1113/jphysiol.2002.030023. [DOI] [PMC free article] [PubMed] [Google Scholar]
- Power GG. Biology of temperature: The mammalian fetus. J Dev Physiol. 1989;12:295–304. [PubMed] [Google Scholar]
- Power GG, Schroder H, Gilbert RD. Measurement of fetal heat production using differential calorimetry. J Appl Physiol. 1984;57:917–922. doi: 10.1152/jappl.1984.57.3.917. [DOI] [PubMed] [Google Scholar]
- Purves MJ, James IM. Observations on the control of cerebral blood flow in the sheep fetus and newborn lamb. Circ Res. 1969;25:651–667. doi: 10.1161/01.res.25.6.651. [DOI] [PubMed] [Google Scholar]
- Richardson BS, Carmichael L, Homan J, Patrick JE. Cerebral oxidative metabolism in fetal sheep with prolonged and graded hypoxemia. J Dev Physiol. 1993;19:77–83. [PubMed] [Google Scholar]
- Rohlicek CV, Saiki C, Matsuoka T, Mortola JP. Oxygen transport in conscious newborn dogs during hypoxic hypometabolism. J Appl Physiol. 1998;84:763–768. doi: 10.1152/jappl.1998.84.3.763. [DOI] [PubMed] [Google Scholar]
- Singer D. Neonatal tolerance to hypoxia: A comparative-physiological approach. Comp Biochem Physiol A Mol Integr Physiol. 1999;123:221–234. doi: 10.1016/s1095-6433(99)00057-4. [DOI] [PubMed] [Google Scholar]
- Suzuki S, Murata T, Jiang L, Power GG. Hyperthermia prevents metabolic and cerebral flow responses to hypoxia in the fetal sheep. J Soc Gynecol Investig. 2000;7:45–50. doi: 10.1016/s1071-5576(99)00068-4. [DOI] [PubMed] [Google Scholar]
- Tsoulos NG, Schneider JM, Colwill JR, Meschia G, Makowski EL, Battaglia FC. Cerebral glucose utilization during aerobic metabolism in fetal sheep. Pediatr Res. 1972;6:182–186. doi: 10.1203/00006450-197203000-00006. [DOI] [PubMed] [Google Scholar]
- Turbow RM, Curran-Everett D, Hay WW, Jr, Jones MD., Jr Cerebral lactate metabolism in near-term fetal sheep. Am J Physiol. 1995;269:R938–942. doi: 10.1152/ajpregu.1995.269.4.R938. [DOI] [PubMed] [Google Scholar]
- Van Cappellen AM, Heerschap A, Nijhuis JG, Oeseburg B, Jongsma HW. Hypoxia, the subsequent systemic metabolic acidosis, and their relationship with cerebral metabolite concentrations: An in vivo study in fetal lambs with proton magnetic resonance spectroscopy. Am J Obstet Gynecol. 1999;181:1537–1545. doi: 10.1016/s0002-9378(99)70401-1. [DOI] [PubMed] [Google Scholar]
- Vannucci RC, Duffy TE. Carbohydrate metabolism in fetal and neonatal rat brain during anoxia and recovery. Am J Physiol. 1976;230:1269–1275. doi: 10.1152/ajplegacy.1976.230.5.1269. [DOI] [PubMed] [Google Scholar]
- Winn HR, Rubio R, Berne RM. Brain adenosine concentration during hypoxia in rats. Am J Physiol. 1981;241:H235–242. doi: 10.1152/ajpheart.1981.241.2.H235. [DOI] [PubMed] [Google Scholar]