

Abstract
The mammalian cortex is densely populated by extensively branching, thin, unmyelinated axons that form en passant synapses. Some thin axons in the peripheral nervous system hyperpolarize if action potential frequency exceeds 1-5 Hz. To test the hypothesis that cortical axons also show activity-induced hyperpolarization, we recorded extracellularly from individual CA3 pyramidal neurons while activating their axon with trains consisting of 30 electrical stimuli. Synaptic excitation was blocked by kynurenic acid. We observed a positive correlation between stimulation strength and the number of consecutive axonal stimuli that resulted in soma spikes, suggesting that the threshold increased as a function of the number of spikes. During trains without response failures there was always a cumulative increase in the soma response latency. Intermittent failures, however, decreased the latency of the subsequent response. At frequencies of > 1 Hz, the threshold and latency increases were enhanced by blocking the hyperpolarization-activated H current (Ih)by applying the specific Ih blocker ZD7288 (25 μM) or 2 mM Cs+. Under these conditions, response failures occurred after 15–25 stimuli, independent of the stimulation strength. Adding GABA receptor blockers (saclofen and bicuculline) and a blocker of metabotropic glutamate receptors did not change the activity-induced latency increase in recordings of the compound action potential. We interpret these results as an activity-induced hyperpolarization that is partly counteracted by Ih. Such a hyperpolarization may influence transmitter release and the conduction reliability of these axons.
Most cortical axons are thin and unmyelinated. To a large extent we have to make assumptions about their properties based on what we know from other axon types, because the tiny dimensions of cortical axons have rendered them inaccessible to intracellular membrane potential recordings. An interesting property of thin, unmyelinated axons in peripheral nervous systems, for example vagal C fibres, is that they hyperpolarize in response to repeated action potentials (Ritchie & Straub, 1956, 1957). The main contribution to this hyperpolarization is the electrogenic Na+-K+ pump, which is activated by intracellular Na+ (Ritchie & Straub, 1957; Rang & Ritchie, 1968; Morita et al. 1993; Kobayashi et al. 1997). Some unmyelinated axons hyperpolarize at frequencies well within their physiological range. For example, the unmyelinated C fibres from the rabbit vagus nerve hyperpolarize during activation at 1-2 Hz (Grafe et al. 1997), and 5 Hz was sufficient to decrease the conduction velocity in human C fibres (Torebjörk, 1974), a finding that may be a result of hyperpolarization.
Myelinated nerves also show this activity-dependent hyperpolarization, but usually at higher frequencies over longer periods than unmyelinated fibres (Gasser, 1935; Baker et al. 1987; Morita et al. 1993). In some axons, both myelinated (Baker et al. 1987; Eng et al. 1990) and unmyelinated (Grafe et al. 1997; Robert & Jirounek, 1998), the activity-induced hyperpolarization is counteracted by a hyperpolarization-activated cation current, Ih (Mayer & Westbrook, 1983; Pape, 1996), which may be important for maintaining their conduction reliability.
These findings are based on intra-axonal voltage recordings or sucrose-gap techniques, which reflect changes in intracellular voltage. In the mammalian cortex, presynaptic voltage recordings have been possible only from fibres with particularly large presynaptic specializations (Forsythe, 1994; Southan & Robertson, 1998; Geiger & Jonas, 2000). No activity-dependent hyperpolarization was reported from these structures, although this question was not explicitly addressed. For most of the thin axons, we are still limited to using indirect measures of the membrane potential, like changes in activation threshold and conduction velocity.
We have measured electrical stimulation threshold and latency changes in response to trains of action potentials in the Schaffer collaterals in the rat hippocampus. The reason for using these fibres as a model system is that they are among the thinnest axons in the mammalian CNS (Shepherd & Harris, 1998). Action potentials in these thin axons might be expected to lead to larger changes in intracellular Na+ concentrations, and therefore hyperpolarize more, than thicker axons (Kuffler et al. 1984). Furthermore, the Schaffer collaterals branch extensively and have presynaptic specializations (boutons) along their entire paths (Westrum & Blackstad, 1962; Ishizuka et al. 1990; Sik et al. 1993; Li et al. 1994). A hyperpolarization may therefore interfere with both conduction reliability and synaptic efficacy.
METHODS
Animals and slice preparation
All procedures used were in accordance with regulations given by The National Animal Research Authority in Norway. Wistar rats of both sexes (age 4-12 weeks) were exposed to evaporated ether until they lost consciousness and pain reflexes, usually in less than 30 s. Their brains were then quickly removed and submerged in ice-cold artificial cerebrospinal fluid (ACSF). The hippocampus was dissected free and cut into 400 μm transverse slices with a Vibroslicer (Campden Instruments) in ice-cold, oxygenated ACSF. During recording the slices were kept submerged in a 3 ml tissue chamber with oxygenated ACSF flowing at 3.5 ml min−1. The temperature was kept at either 23-25 °C (nominally 24 °C) or 34-36 °C (nominally 34 °C) with a TC2bip temperature controller (Cell MicroControls, Norfolk, VA, USA). The composition of the ACSF was (mM): NaCl 124, KCl 2, KH2PO4 1.25, MgSO4 2, NaHCO3 26, CaCl2 2.0 and glucose 11.1. Kynurenic acid was obtained from Sigma Aldrich; ZD7288, (RS)-α-methyl-4-sulphonophenylglycine, saclofen and bicuculline methochloride were from Tocris Cookson.
Stimulation and recording
Presynaptic action potentials were isolated chemically from synaptic activity by adding to the bath 2 mM of the unspecific glutamate receptor antagonist kynurenic acid. Compound action potentials (CAP) and single CA3 soma unit discharges were recorded with glass pipettes filled with ACSF, having a tip diameter of ≈5 μm. Action potentials were elicited with an insulated tungsten electrode. For CAP recordings, both electrodes were positioned within the stratum radiatum of CA1, at the same distance (≈100 μm) from the CA1 soma layer, and with an interelectrode distance of 500-1000 μm. Schaffer collaterals were activated by stimulus trains consisting of 80 pulses at a constant stimulation strength (within 0.75-1.25 mA for 100 μs). The pulse trains were separated by a recovery period of > 2 min. The frequencies 0.5, 2 and 5 Hz were tested. To check the stability of the stimulus strength during the trains we measured the amplitude of the stimulus artefacts during the trains in seven experiments. The sizes of the last 10 artefacts were on average 100.04 % of the first 10 artefacts in the trains, and none were less than 99.91 %. This means that there was no systematic decline of stimulus strength during the trains.
For the recording of single CA3 soma units, Schaffer collaterals in the stratum radiatum of CA1 were stimulated with minimal strength to isolate single units. The single units were confirmed by controlling their all-or-none amplitude over a range of stimulation strengths, as described previously (Raastad, 1995). One of their Schaffer collateral branches was then stimulated by pulse trains consisting of 30 stimuli of identical strength at 2 Hz. After a 1 min recovery period, we repeated the train with different stimulation strengths. The stimuli were chosen in a random order from a range of stimuli that was determined before the first train in the following way: a stimulus of 80 μs duration was repeated at 0.5 Hz and the current amplitude of the stimulator adjusted to lie just below the current needed to elicit any action potential (defined as the threshold, T). The same current was used with 90 μs duration to confirm that action potentials were elicited at this strength. Then stimulus durations between 80 and 140 μs (with 3 μs resolution) were chosen, in random order, for 21 stimulus trains.
Data acquisition
Field recordings were amplified with a DAM 50 differential amplifier (World Precision Instruments), filtered at 1 kHz, digitized at 10 kHz and stored on the computer hard disk.
Measurements and statistical analysis
CAP amplitudes were measured from the first positive to the most negative peak. Single-unit amplitudes were measured from baseline to the most negative peak and were in all cases more than three times the peak-to-peak noise amplitude. Single-unit and CAP latencies were measured from the start of the stimulus artefact to the most negative peak.
Unless noted otherwise, all measurements are given as mean and standard error of the mean (S.E.M.). In order to test differences of means, Student's t test, paired when relevant, was used.
RESULTS
The threshold increases with action potential activity in Schaffer collaterals
We recorded extracellular potentials from individual CA3 pyramidal somata while stimulating Schaffer collaterals within the CA1 stratum radiatum. Excitatory transmission was blocked by 2 mM kynurenic acid. CA3 units were easily isolated using low stimulation strength and long interelectrode distances. Large negative spikes with clear all-or-none behaviour and stability over a range of stimulus intensities (Fig. 1A) were used as the criterion for single unit recordings (see also Methods). Sometimes we could detect more than one unit, like the small response marked with an asterisk in Fig. 1B. However, the unit we measured always had an amplitude of more than three standard deviations of the background activity, including such small unit responses, and was therefore distinguishable from the background.
Figure 1. Single Schaffer collaterals increase their activation threshold during repeated activity.
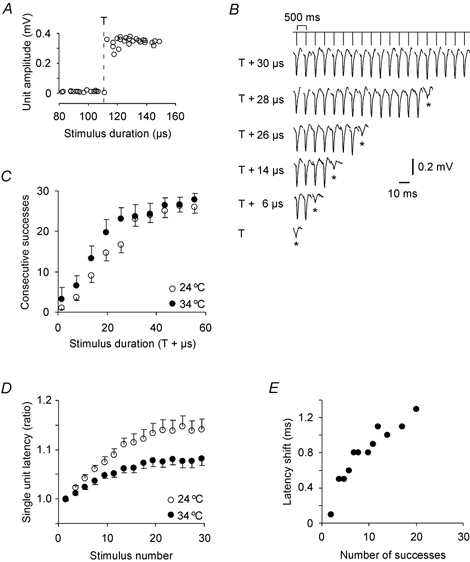
A, a single soma unit was identified by an all-or-none response over a range of stimulation strengths at 0.5 Hz. The highest stimulation strength not eliciting an action potential is indicated by the dashed line, and is defined as stimulus threshold (T). B, a single soma unit responding to repeated activation (2 Hz) of one of its Schaffer collaterals. The number of consecutive successful responses increased with increasing stimulation strength. The first failure in each train is included (asterisk), showing a small background response. C, the mean number (14 and eight experiments at 24 °C (○) and 34 °C (•), respectively) of consecutive successes before the first failure in trains of 30 stimuli increased with increasing stimulus intensity above threshold. Data from two adjacent stimulus durations were averaged. Vertical bars give the S.E.M. D, repeated firing increased the single unit latencies up to a plateau after 20 stimuli, at 115 ± 2 % and 109 ± 2 % of the initial latency at 24 °C (○) and 34 °C (•), respectively. E, the latency of the last single unit response before the first failure (i.e. when the stimulus strength was close to threshold) increased proportionally to the number of successes at 24 °C.
When the axon was activated at 2 Hz with the stimulus duration just above T (defined as the duration of the strongest stimulation that gave only failures), failures often occurred after few stimuli (T + 6 μs, Fig. 1B). However, with stronger stimuli (e.g. T + 26 μs) the first failure appeared at a higher stimulus number. In Fig. 1C, the average number of consecutive successes before a failure is plotted as a function of stimulus strength above threshold for 14 experiments at 24 °C and eight experiments at 34 °C.
In all these experiments, the number of consecutive successes was increased by increasing the stimulus strength. This was tested by the correlation between stimulus number for first failure and stimulation strength, giving positive and significant (P < 0.05) correlations in all experiments. Pearson's r ranged from 0.46 to 0.80 at 34 °C and from 0.60 to 0.91 at 24 °C. This shows that repeated activation increased the threshold at the stimulus point (the axon) and that the failures were not conduction or somatic invasion failures.
In addition to the increased activation threshold, repeated firing also resulted in an increased latency (Fig. 1D), suggesting that the threshold increased along major parts of the conducting fibre, not at the stimulation site alone. The latency increased monotonically and reached a plateau after ≈20 responses (2 Hz). The mean and S.E.M. at this plateau was 115 ± 2 % (n = 13) and 109 ± 2 % (n = 8) of the initial latency at 24 and 34 °C, respectively, both significantly different from 100 % (P < 0.001), but not significantly different from each other (P = 0.06).
One problem with the interpretation that the activity-induced latency increases were due to increased threshold along the axon is that the point for spike initiation may move closer to the stimulation electrode as the threshold increases, giving a longer conduction distance. However, at threshold, just before the axon failed, the spike initiation point would be expected to be at the closest distance from the stimulating electrode. When we measure the latency for only the last responses that appeared before the first failures (one example presented in Fig. 1E), there was also a significant correlation with the number of successful stimuli and the latency (P < 0.05) in seven out of nine experiments at 24 °C. We would have preferred to stimulate the individual axons at two distances with the same electrode and the same intensity to show that the latency increase correlated with conduction distance, but this was not achieved. However, this type of correlation is presented in population responses, as described in a later section.
What caused the increased threshold and latency?
One observation that strongly suggested that the latency changes were due to activity in the recorded axon, and not activation of other adjacent axons and neurons, was that individual failures during the stimulus trains had a significant effect on the latency. One example is shown in Fig. 2A, where the latency increased monotonically and similarly during two stimulus trains until there was a failure (arrow) in the stimulus train marked by filled symbols. This failure induced a reduction in the latency of the subsequent response despite the fact that the stimulation strength was the same for all stimuli in each train, meaning that the activation of other axons and excitable cells at the stimulation site was relatively constant.
Figure 2. Failure in a single Schaffer collateral reduces the subsequent spike latency.
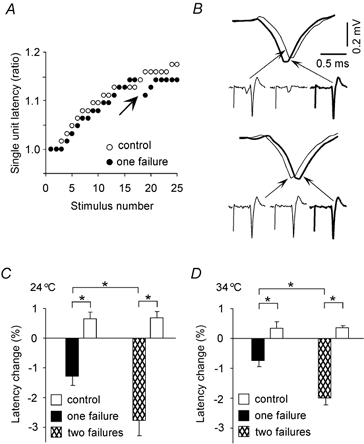
A, single unit latencies during two pulse trains (2 Hz). The latency increased similarly for both stimulation trains until a failure occurred (arrow) in the train marked with filled circles. B, illustration of the latency reduction following a single failure in Fig. 1A. Antidromic soma responses separated by a single failure (upper panel) or by a success (lower panel) are superimposed. C and D, effect of one and two failures on single unit latencies at 24 °C (C) and 34 °C (D). There was a significant (P < 0.02) latency reduction in response to one (24 °C: n = 13; 34 °C: n = 7) and two failures (24 °C: n = 12; 34 °C: n = 6) compared to no failures. Two failures reduced the latency more than one failure. *P < 0.02.
To quantify the effect of failures during stimulus trains we compared the latencies when there were three consecutive responses with cases with the pattern response- failure- response (Fig. 2B). The three consecutive stimuli were chosen after at least 15 stimuli, because the latencies were then close to their maximal values. In Fig. 2B we see that the latency dropped when the response pattern was response-failure-response, and increased when there were three consecutive responses.
We also measured the effect of two failures appearing between two responses, and the results are shown together with changes after one failure in Fig. 2C (24 °C) and D (34 °C). While there was a small increase in latency with three or four consecutive responses, there was a significant (paired t test, P < 0.02) latency reduction in response to one (24 °C: n = 13, 34 °C: n = 7) and two failures (24 °C: n = 12, 34 °C: n = 6) compared to no failures. Two failures reduced the latency more than one failure (P < 0.02).
These results suggest that the latency changes, and therefore most likely the threshold changes, were due mainly to spike activity in the axon from the recorded soma and not the activation of surrounding axons, somata and dendrites.
The activity-induced threshold and latency increase was enhanced by an Ih-specific blocker
Ih is an inward mixed cation current that is active at relatively hyperpolarized potentials. This current has been found in a variety of neurons, mostly investigated in the soma (Pape, 1996), but also found in myelinated and unmyelinated mammalian axons (Marsh, 1982; Baker et al. 1987; Eng et al. 1990; Birch et al. 1991; Grafe et al. 1997), where it dampens the activity-induced hyperpolarization. We therefore tested the effect of the specific Ih blocker ZD7288 (Harris & Constanti, 1995) on the threshold changes in Schaffer collaterals. Figure 3 shows that at low stimulus frequencies (≤ 0.2 Hz, 24 °C) 25 μM ZD7288 had very small effects on the amplitude and latency of the pharmacologically isolated CAP (n = 10). The threshold for antidromic activation of single soma units was also unchanged by the blocker (n = 6).
Figure 3. Minimal effect of ZD7288 at low frequencies.
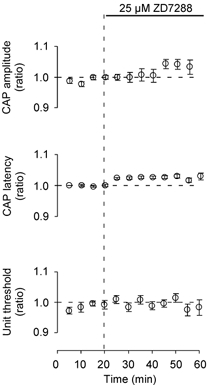
At low frequencies (≤ 0.2 Hz) the Ih blocker ZD7288 (25 μM) had only a small effect on CAP amplitude (n = 10) and latency (n = 10) and on soma unit threshold for antidromic activation (n = 6). Data from 5 min time bins were averaged. Vertical bars give the S.E.M.
Since a slow reduction of the excitatory synaptic signal has been reported as an effect of ZD7288 (Chevaleyre & Castillo, 2002), we also followed the field responses without blocking excitatory postsynaptic potentials (EPSPs). We observed a slow decline in the amplitude of the field EPSP at low-frequency stimulation (< 0.5 Hz), similar in magnitude and time course to the field EPSP decline reported by Chevaleyre & Castillo (2002). Interestingly, there was a parallel decline in the CAP amplitude that was not observed in the presence of kynurenic acid (n = 3, data not shown).
At a 2 Hz stimulus frequency (34 °C) the Ih blocker changed the correlation between the number of consecutive successes and stimulus strength in two ways (Fig. 4A). First, we had to increase the stimulus intensity more to overcome the failures, corresponding to the right-shift of the curve. Second, the failures were often difficult to eliminate, even at high stimulus intensities, corresponding to the plateau of the curve from the blocker experiments.
Figure 4. Ih counteracted the activity-induced threshold increase.
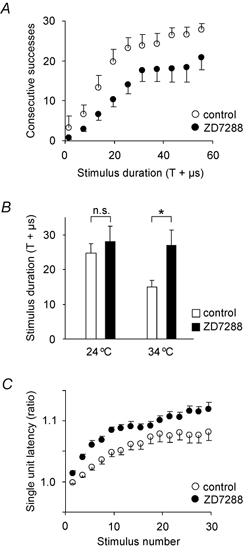
A, blocking Ih using ZD7288 (25 μM, n = 8) while stimulating the axon at 2 Hz increased the additional stimulation strength needed to overcome the activity-dependent failures, compared to control (n = 8; seen as a right shift of curve). With the blocker it was also difficult to reach the maximum of 30 consecutive responses. Data from two adjacent stimulus durations were averaged and are given as the mean and S.E.M. B, the increase in stimulus strength required for at least 15 consecutive responses was significantly higher than threshold for both temperatures, both with and without blocking the Ih (P < 0.001). At 34 °C the required stimulus intensity was significantly higher when Ih was blocked (n = 5) compared to control (n = 6). At 24 °C the difference was not significant (ZD7288: n = 7; control: n = 11). *P < 0.05, n.s.: not significant. C, the single unit latency (34 °C) increased monotonically during the stimulus trains most when Ih was blocked, similar to the threshold increase. Only consecutive successful stimuli were selected (n = 8 for both control and Ih block).
In order to test statistically the difference between these two groups of results, we measured the average increase in stimulus intensity from threshold (in μs additional width of the stimulus) that was required to give at least 15 consecutive successes (Fig. 4B). Both with and without the Ih blocker at 24 and 34 °C we needed a significant additional stimulus intensity above T to get 15 consecutive successes (P < 0.001), confirming that threshold increased with activity, as shown in Fig. 1. At 34 °C we needed a higher intensity with than without the blocker (T + 25.2 μs and T + 14.0 μs, respectively, P = 0.03), but this difference was smaller and not significant at 24 °C (P > 0.1).
This suggests that Ih is important for limiting the threshold increase during activity at 34 °C. The reason for the smaller effect at 24 °C was not explored, but a tentative explanation may include a lower level of Ih activation because of a more depolarized membrane potential, or changes in the Ih voltage activation curve.
The single unit latency (34 °C) increased in parallel with the threshold increase (Fig. 4C), probably because both these changes were the result of the same underlying process, namely a hyperpolarization. Figure 4C shows that the latency increased more when Ih was blocked (P = 0.05, tested as the average latency increase during the train, relative to the first latency). After only two consecutive successes (unit responses) there was a significantly higher latency with (102.7 ± 0.7 %) than without (100 ± 0.5 %) the blocker (n = 8, P < 0.001).
How does the CAP reflect the excitability changes?
It is difficult to predict how the activity-induced increase in threshold, which probably represents a hyperpolarization, would affect the amplitude of the CAP. This is an important issue because many experiments studying synaptic changes use the stability of CAP amplitude as a criterion for stability in the number of axons activated under different test conditions. We measured peak-to-peak amplitude and latency to the most negative peak of the CAP, recorded and activated in the stratum radiatum in area CA1 (see Methods), which means that mostly Schaffer collaterals were activated. In the standard solution, stimulating the Schaffer collaterals with 80 pulses at 2 Hz (34 °C) had small effects on the amplitude and latency of the compound volley, as shown by superimposing the first and last three responses in the stimulus train (Fig. 5A, left). However, after applying 25 μM ZD7288, the responses became slower and smaller (Fig. 5A, right) during the train, findings that fit well with the effects of the Ih blocker on latency and threshold in the single unit experiments.
Figure 5. Changes in CAP amplitude and latency in response to 80 equally strong stimuli at different frequencies with and without ZD7288 at 34 °C.
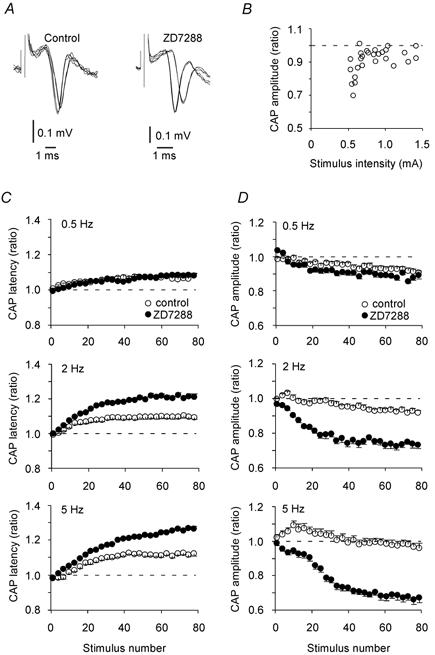
A, the first and last three CAP responses to 80 stimuli (2 Hz, constant stimulation strengths) are superimposed and show only small effects on the latency and amplitude in a control experiment (left panel), while ZD7288 resulted in a marked increase in the latency and reduction of the amplitude (right panel). B, the CAP amplitude reduction (the average of the last three divided by the average of the first three responses in stimulus trains of 80 pulses at 2 Hz) depended on the stimulus intensity (n = 5). C, in control experiments the CAP latency increased at all frequencies (n = 8, 11 and 7 at 0.5, 2 and 5 Hz, respectively). ZD7288 gave a further latency increase at 2 and 5 Hz (n = 7 and 6, respectively), but not at 0.5 Hz (n = 7). D, the CAP amplitudes decreased slightly during the stimulus trains in control experiments at 0.5 and 2 Hz (P < 0.01 when comparing the first and last three responses in the trains), while at 5 Hz the amplitudes ended at approximately their initial value. With ZD7288, the amplitudes fell considerably more than control at 2 and 5 Hz (n = 7 and 6, respectively), but not at 0.5 Hz (n = 7). In C and D the values are grouped in bins of three stimuli and given as the mean and S.E.M.
The finding that the CAP amplitude changed little at 2 Hz in standard solution may seem at odds with the obvious threshold increase at this frequency in standard solution for the single unit experiments (Fig. 1B, C). It is important, however, to understand that the amplitude reduction of the CAP depends on the proportion of axons activated by strengths close to their threshold. This is demonstrated in Fig. 5B where the last amplitude divided by the first amplitude in trains (2 Hz, 80 stimuli) are plotted as a function of the stimulus strength (the current amplitude of a 100-μs-long stimulus). The same stimulus electrode was used on five slices to sample 27 amplitude ratios. There was a larger relative reduction in CAP amplitude with the weakest stimulus currents (≈0.5 mA) than with stronger stimuli, probably because a large fraction of the fibres were stimulated with strengths close to their initial thresholds. To avoid these weakest stimuli where there was a clear correlation between stimulation strength and amplitude reduction, we chose stimulation strengths 50-100 % above the threshold for detecting a CAP (0.75-1.0 mA in Fig. 5B).
The change of latency and amplitude during 0.5, 2 and 5 Hz stimulus trains is shown in Fig 5C and D, respectively. With standard bath solution there was an increase in latency in all experiments, significantly different from 1.0 (P < 0.01) after only 4, 7 and 18 stimuli for 0.5, 2 and 5 Hz, respectively. Blocking Ih gave larger differences in latency except at 0.5 Hz, probably because the axons did not hyperpolarize enough to activate Ih at this low frequency. Both with and without ZD7288, the mean latency increase after 80 pulses was highly correlated to frequency (Pearson's r = 0.91 and 1, respectively).
The threshold increase was not reflected in the CAP amplitude as systematically as in the latency. Without the Ih blocker there was only a small reduction of amplitude, and at 5 Hz, response numbers 1 and 80 were not significantly different. As seen in the single unit experiments, these axons could be stimulated strongly enough to fire almost without failures at 2 Hz. Thus, if most axons contributing to the CAP were activated well above threshold, one would expect small-amplitude reductions in CAP (Fig. 5B) despite a threshold increase in the individual axons. Some axons in the periphery of the effective stimulation field, however, would be expected to fail. This effect may have been partly masked by, for example, an increase in the amplitude of the individual action potential units due to hyperpolarization.
Blocking Ih resulted in a large activity-induced amplitude reduction of the CAP amplitude with 2 and 5 Hz stimuli, suggesting that this current plays a role in maintaining the excitability of these axons when they fire at 2 and 5 Hz. As for the latency measurements, there was no effect of blocking Ih at 0.5 Hz. The latency increase and amplitude reduction at 2 Hz, 24 °C (Fig. 6A and B, respectively) were similar with and without block of GABAA, GABAB and metabotropic glutamate receptors (in addition to kynurenic acid and ZD7288), supporting the theory that the threshold and latency increase is not due to release of glutamate or GABA.
Figure 6. Tests for GABA and glutamate effects, correlation between conduction distance and latency and Cs+ effects.
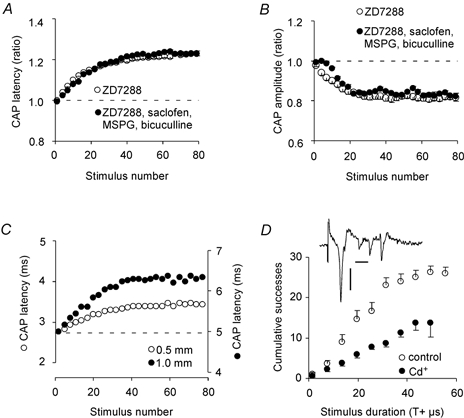
A, the latency increase and B, the peak-to-peak amplitude reduction of the CAP during stimulus trains with 80 stimuli were similar with and without blockers of GABAA (10 μM bicuculline), GABAB (200 μM saclofen) and metabotropic glutamate receptors (100 μM (RS)-α-methyl-4-sulphonophenylglycine, MSPG). C, one representative experiment showing that the latency increase with 1 mm distance between stimulation and recording electrodes (right axis) was twice as large as that of 0.5 mm (left axis). The axes were shifted vertically to superimpose the initial latency (broken line). All experiments were carried out at 24 °C, the stimulation frequency was 2 Hz, and 25 μM ZD7288 and 2 mM kynurenic acid had been added to the bath solution. Values from three adjacent stimulus strengths were averaged. D, the activity-induced threshold increase was more pronounced with 2 mM Cs+ in the bath than without (filled and open symbols, respectively). This effect was similar to that of ZD7288, but Cs+ gave in addition spontaneous discharge of CA3 neurons as an undesirable side effect (insert, horizontal and vertical scale bars are 5 ms and 0.1 mV, respectively).
The activity-induced latency increase (for example Fig. 1D) would be expected to be proportional to conduction distance if the increase was due to slower conduction along the axon as opposed to changes at the action potential initiation point. We therefore compared the latency increase (with ZD7288 at 24 °C, 2 Hz) at 0.5 and 1 mm from the stimulation electrode. Figure 6C shows one typical example where the latency increased by 0.64 ms at 0.5 mm and by 1.36 ms at 1 mm. On average, the latency increased by a factor of 2.09 ± 0.11 at 1 mm compared to 0.5 mm (six experiments), showing a high degree of proportionality between conduction distance and latency increase.
If the enhancement of the activity-induced threshold increase that was observed by applying ZD7288 (Fig. 4A and B) was due to the block of Ih, similar effects may be expected with low concentrations of Cs+. We therefore compared five experiments with 2 mM Cs+ in the bath and seven experiments without Cs+ (24 °C, Fig. 6D), showing that there was a larger threshold increase with Cs+, similar to the effect of ZD7288 shown in Fig. 4A. However, Cs+ gave spontaneous discharge of CA3 neurons as an undesirable side effect, which was not observed with ZD7288. The Cs+ effect may therefore be a combined effect of Ih block and spontaneous activity.
DISCUSSION
Our results show that repeated action potentials in Schaffer collaterals at frequencies between 0.5 and 5 Hz lead to an increased threshold for extracellular electrical activation. This threshold increase was partly prevented by the hyperpolarization-activated mixed cation current Ih. At lower frequencies (≤ 0.2 Hz) this current had very small effects on amplitude or latency of the CAP (Fig. 2A and B), or on the threshold of single axons (Fig. 2C), suggesting low Ih activity at resting membrane potentials.
Activity-induced hyperpolarization
We interpret the activity-induced threshold increase as a hyperpolarization because this could explain the threshold and latency increase at single unit and population levels, as well as the effect of the Ih blocker. This interpretation is also based on the fact that a hyperpolarization has been found to underlie activity-induced threshold increases in other axons that, as opposed to the Schaffer collaterals, allow membrane potential measurements (Ritchie & Straub, 1957; Baker et al. 1987; Grafe et al. 1997; Robert & Jirounek, 1998).
An increase in the activation threshold because of Na+ channel inactivation may be the most relevant alternative explanation. Long-lasting desensitization has been described in dendrite recordings from CA1 pyramidal cells by Jung et al. (1997). One second after 15-20 short depolarizations at 20 Hz, they observed an 18 % reduction in the peak amplitude of the Na+ current in the dendrites. It seems unlikely, however, that four stimuli at 0.5 Hz (where we observed a reduction in excitability and conduction velocity) would give any significant Na+ channel inactivation.
Theoretically, accumulation of extracellular K+ could contribute to Na+ channel inactivation by keeping the membrane depolarized for a long time after a stimulus. Increased concentration of extracellular K+ as a result of synchronous neuronal activity has been observed in various preparations (Malenka et al. 1981; Kocsis et al. 1983; Eng & Kocsis, 1987; Poolos et al. 1987). Such a K+ efflux can decrease excitability, but usually at much higher stimulus frequencies than we have used, often preceded by an increase in excitability (while we observed a reduced excitability after only four action potentials). The K+ effects are partly dependent on excitatory synaptic transmission (Malenka et al. 1981; Poolos et al. 1987), which in our case was blocked. The activity-induced K+ levels may, however, be tissue specific and should be considered as a possible cause of threshold changes when bundles of axons are activated synchronously.
The initial increase in CAP amplitude shown in Fig. 5D (2 and 5 Hz) could, without considering the other results, be caused by K+ accumulation and thereby threshold reduction at the stimulation site. However, no initial threshold reduction was observed in the single unit experiments, and the latency measurements lack any initial reduction that would have been expected if an initial threshold reduction occurred. Possible explanations for the initial amplitude increase may be increased amplitude of the individual axonal action potentials because of hyperpolarization, and increased driving force for Na+. Broadening of the individual action potentials may also have contributed.
The best argument against the theory that the threshold and latency increase was due to K+ (or other neuroactive compounds, like GABA or glutamate) released from excitable tissue around the stimulation electrode is based on the analysis of the intermittent failures in the single unit experiments (Fig. 2), showing that the latency decreased when the single unit failed once or twice. During stimulation trains with constant strength, it is unlikely that the other neurons, axons or dendrites, releasing K+ or other neuroactive compounds, would fail simultaneously with the recorded unit.
In support of this theory is the parallel change in threshold and latency, the resistance of these effects to GABAA, GABAB and metabotropic glutamate blockers, and the correlation between latency increase and distance between recording and stimulating electrodes. While threshold changes could, theoretically, be the result of a local effect, the reduced conduction velocity (i.e. latency) is unlikely to be a local effect.
Supporting the theory that the activity-induced threshold and latency increases were caused by hyperpolarization is that these increases were reduced by blocking Ih. This hyperpolarization-activated inward cation current has been found in mammalian peripheral axons (unmyelinated and myelinated; Marsh, 1982; Baker et al. 1987; Birch et al. 1991; Grafe et al. 1997) and in central, myelinated axons (Eng et al. 1990). In these preparations the current is activated by hyperpolarization caused by high Na+-K+ pump activity. Ih has also been demonstrated in presynaptic specializations in the mammalian CNS (calyx of Held: Southan et al. 2000; Cuttle et al. 2001) and has been suggested to play a presynaptic role in long-term synaptic potentiation at the mossy fibre boutons (Mellor et al. 2002), but to our knowledge the present study is the first to show its effects on conduction and threshold in unmyelinated cortical axons.
The mammalian Ih channel is encoded by a family of genes called HCN (1-4; Clapham, 1998; Santoro & Tibbs, 1999). Interestingly, CA3 pyramidal cells display significant levels of mouse HCN2 transcripts, but little or no Ih current could be recorded at the soma (Santoro et al. 2000). These authors suggest that the channels are inserted at locations electrically remote from soma, a theory fitting with our finding that the channels may be located in the axonal membrane.
We have not explored the mechanism underlying the putative hyperpolarization in the Schaffer collaterals. It seems likely that the Na+-K+ pump plays an important role because experiments from a wide range of thin, unmyelinated axons where sucrose gap or intra-axonal voltage recordings have been possible show that blocking this pump prevents post-tetanic hyperpolarization (Ritchie & Straub, 1957; Rang & Ritchie 1968; Kobayashi et al. 1997). Block of the Na+-K+ pump in hippocampal slice preparations causes depolarization and spreading depression (Balestrino et al. 1999) and is therefore difficult to interpret without intracellular voltage control.
The process responsible for the hyperpolarization needs to have a slow time course to explain the accumulation of latency and threshold increase over at least 10-20 s (Fig. 5C). Na+ elimination in the dendrites of pyramidal neurons has been reported to be slow, with time constants of up to 5.7 s at 33 °C (Rose et al. 1999). Na+-activated K+ channels (Dryer, 1994) may follow time courses similar to that of Na+ elimination and are therefore also theoretical candidates.
Other slow, hyperpolarizing processes include Ca2+-activated SK channels, with deactivation time constants of up to 1.5 s (Bond et al. 1999). Such channels may deactivate with time constants similar to that of Ca2+ elimination that have been reported to be up to 0.5 s in pyramidal axon boutons (Koester & Sakmann 2000). These Ca2+-mediated mechanisms therefore seem to be too fast to explain the accumulation of hyperpolarization over a period of 10-20 s, although the secondary effects of Ca2+ increases, like phosphorylation of K+ channels, remain theoretical possibilities.
We should also point out that we have not investigated threshold changes at shorter intervals than 200 ms. At such short intervals, other factors like interactions between the slow Na+-K+ pump and the slow compensatory Ih depolarization may be important.
The Schaffer collaterals increase their threshold at 0.5 Hz, which is a lower frequency than most other investigated axons. The fact that they are unmyelinated in rat is probably important because myelin is assumed to limit the amount of Na+ entering the axon during an action potential (Ritchie, 1995). Furthermore, the Schaffer collaterals are among the thinnest mammalian axons, with an average diameter of 0.17 μm (Shepherd & Harris, 1998). This gives a larger surface-to-volume ratio, which in turn may give a larger Na+ concentration change in response to action potentials (Kuffler et al. 1984). The pump rate, and thereby the degree of hyperpolarization, increases with increasing intracellular concentration of Na+ (Thomas, 1969), but little is known about the magnitude of Na+ ion flux across the membrane of these thin axons. These considerations therefore remain speculations until actual measurements are made.
Functional implications
The test frequencies that induced a threshold increase (0.5-5 Hz) are typical for CA3 cell activity in vivo (Ranck, 1973), making our observation potentially important for hippocampal function. We will mention three theoretical implications of the assumption that the activity-induced threshold increase was due to hyperpolarization. First, the Ih activity may be sufficient to keep the putative hyperpolarization within such limits that it does not interfere significantly with neuronal function. Second, the hyperpolarization may interfere with synaptic release mechanisms, which can theoretically increase or decrease the transmitter release (Wojtowicz & Atwood, 1983, 1984). Unfortunately, our finding makes it particularly difficult to interpret synaptic investigations that use the same frequency range that gives a threshold increase, because an extracellular electrode cannot be assumed to activate a constant number of fibres during repeated stimulations, even if the amplitude of the CAP changes very little (see Fig. 5D). Finally, the hyperpolarization may induce an action potential conduction block at regions with a low safety factor, as shown for example in the leech (Van Essen, 1973; Yau, 1976). Without the Ih blocker we observed very few failures at the investigated frequencies. In contrast, during Ih block it was difficult to fire the axons consecutively more than 20 times (the stimulation-insensitive plateau in Fig. 4A), and there was a large reduction in the amplitude of the CAP (Fig. 5D). These two findings suggest that conduction failures occurred. It would be interesting to test whether these failures were influenced by blockers of the A current, which has been suggested to contribute to conduction failures at relatively hyperpolarized potentials (Debanne et al. 1997). We conclude that Ih may play a role in maintaining excitability and reliable conduction during action potential activity in hippocampal Schaffer collaterals.
Acknowledgments
We thank Professor Per Andersen for support and helpful discussions. This work was supported by a stipend (AFS) from the Medical Faculty, University of Oslo, Norway.
REFERENCES
- Baker M, Bostock H, Grafe P, Martius P. Function and distribution of three types of rectifying channel in rat spinal root myelinated axons. J Physiol. 1987;383:45–67. doi: 10.1113/jphysiol.1987.sp016395. [DOI] [PMC free article] [PubMed] [Google Scholar]
- Balestrino M, Young J, Aitken P. Block of (Na+, K+) ATPase with ouabain induces spreading depression-like depolarization in hippocampal slices. Brain Res. 1999;838:37–44. doi: 10.1016/s0006-8993(99)01674-1. [DOI] [PubMed] [Google Scholar]
- Birch BD, Kocsis JD, Di Gregorio F, Bhisitkul RB, Waxman SG. A voltage- and time-dependent rectification in rat dorsal spinal root axons. J Neurophysiol. 1991;66:719–728. doi: 10.1152/jn.1991.66.3.719. [DOI] [PubMed] [Google Scholar]
- Bond CT, Maylie J, Adelman JP. Small-conductance calcium-activated potassium channels. Ann N Y Acad Sci. 1999;868:370–378. doi: 10.1111/j.1749-6632.1999.tb11298.x. [DOI] [PubMed] [Google Scholar]
- Chevaleyre V, Castillo PE. Assessing the role of Ih channels in synaptic transmission and mossy fiber LTP. Proc Natl Acad Sci U S A. 2002;99:9538–9543. doi: 10.1073/pnas.142213199. [DOI] [PMC free article] [PubMed] [Google Scholar]
- Clapham DE. Not so funny anymore: pacing channels are cloned. Neuron. 1998;21:5–7. doi: 10.1016/s0896-6273(00)80508-5. [DOI] [PubMed] [Google Scholar]
- Cuttle MF, Rusznák Z, Wong AYC, Owens S, Forsythe ID. Modulation of a presynaptic hyperpolarization-activated cationic current (Ih) at an excitatory synaptic terminal in the rat auditory brainstem. J Physiol. 2001;534:733–744. doi: 10.1111/j.1469-7793.2001.00733.x. [DOI] [PMC free article] [PubMed] [Google Scholar]
- Debanne D, Guérineau NC, Gäwiler BH, Thompson SM. Action-potential propagation gated by an IA-like K+ conductance in hippocampus. Nature. 1997;389:286–289. doi: 10.1038/38502. [DOI] [PubMed] [Google Scholar]
- Dryer SE. Na+-activated K+ channels: a new family of large-conductance ion channels. Trends Neurosci. 1994;17:155–160. doi: 10.1016/0166-2236(94)90093-0. [DOI] [PubMed] [Google Scholar]
- Eng DL, Gordon TR, Kocsis JD, Waxman SG. Current-clamp analysis of a time-dependent rectification in rat optic nerve. J Physiol. 1990;421:185–202. doi: 10.1113/jphysiol.1990.sp017940. [DOI] [PMC free article] [PubMed] [Google Scholar]
- Eng DL, Kocsis JD. Activity-dependent changes in extracellular potassium and excitability in turtle olfactory nerve. J Neurophysiol. 1987;57:740–754. doi: 10.1152/jn.1987.57.3.740. [DOI] [PubMed] [Google Scholar]
- Forsythe ID. Direct patch recording from identified presynaptic terminals mediating glutamatergic EPSPs in the rat CNS, in vitro. J Physiol. 1994;479:381–387. doi: 10.1113/jphysiol.1994.sp020303. [DOI] [PMC free article] [PubMed] [Google Scholar]
- Gasser HS. Changes in nerve-potentials produced by rapidly repeated stimuli and their relation to the responsiveness of nerve to stimulation. Am J Physiol. 1935;11:35–50. [Google Scholar]
- Geiger JR, Jonas P. Dynamic control of presynaptic Ca(2+) inflow by fast-inactivating K(+) channels in hippocampal mossy fiber boutons. Neuron. 2000;28:927–939. doi: 10.1016/s0896-6273(00)00164-1. [DOI] [PubMed] [Google Scholar]
- Grafe P, Quasthoff S, Grosskreutz J, Alzheimer C. Function of the hyperpolarization-activated inward rectification in nonmyelinated peripheral rat and human axons. J Neurophysiol. 1997;77:421–426. doi: 10.1152/jn.1997.77.1.421. [DOI] [PubMed] [Google Scholar]
- Harris NC, Constanti A. Mechanism of block by ZD 7288 of the hyperpolarization-activated inward rectifying current in guinea pig substantia nigra neurons in vitro. J Neurophysiol. 1995;74:2366–2378. doi: 10.1152/jn.1995.74.6.2366. [DOI] [PubMed] [Google Scholar]
- Ishizuka N, Weber J, Amaral DG. Organization of intrahippocampal projections originating from CA3 pyramidal cells in the rat. J Comp Neurol. 1990;295:580–623. doi: 10.1002/cne.902950407. [DOI] [PubMed] [Google Scholar]
- Jung HY, Mickus T, Spruston N. Prolonged sodium channel inactivation contributes to dendritic action potential attenuation in hippocampal pyramidal neurons. J Neurosci. 1997;17:6639–6646. doi: 10.1523/JNEUROSCI.17-17-06639.1997. [DOI] [PMC free article] [PubMed] [Google Scholar]
- Kobayashi J, Ohta M, Terada Y. Evidence for the involvement of Na+-K+ pump and K+ conductance in the post-tetanic hyperpolarization of the tetrodotoxin-resistant C-fibers in the isolated bullfrog sciatic nerve. Neurosci Lett. 1997;236:171–174. doi: 10.1016/s0304-3940(97)00790-8. [DOI] [PubMed] [Google Scholar]
- Kocsis JD, Malenka RC, Waxman SG. Effects of extracellular potassium concentration on the excitability of the parallel fibres of the rat cerebellum. J Physiol. 1983;334:225–244. doi: 10.1113/jphysiol.1983.sp014491. [DOI] [PMC free article] [PubMed] [Google Scholar]
- Koester HJ, Sakmann B. Calcium dynamics associated with action potentials in single nerve terminals of pyramidal cells in layer 2/3 of the young rat neocortex. J Physiol. 2000;529:625–646. doi: 10.1111/j.1469-7793.2000.00625.x. [DOI] [PMC free article] [PubMed] [Google Scholar]
- Kuffler SW, Nicholls JG, Martin AR. From Neuron to Brain. A Cellular Approach to the Function of the Nervous System. 2. Sunderland, MA, USA: Sinauer Associates; 1984. [Google Scholar]
- Li XG, Somogyi P, Ylinen A, Buzsaki G. The hippocampal CA3 network: an in vivo intracellular labeling study. J Comp Neurol. 1994;339:181–208. doi: 10.1002/cne.903390204. [DOI] [PubMed] [Google Scholar]
- Malenka RC, Kocsis JD, Ransom BR, Waxman SG. Modulation of parallel fiber excitability by postsynaptically mediated changes in extracellular potassium. Science. 1981;214:339–341. doi: 10.1126/science.7280695. [DOI] [PubMed] [Google Scholar]
- Marsh SJ. Conductance measurements in mammalian unmyelinated nerves. J Physiol. 1982;325:5–6. [Google Scholar]
- Mayer ML, Westbrook GL. A voltage-clamp analysis of inward (anomalous) rectification in mouse spinal sensory ganglion neurons. J Physiol. 1983;340:19–45. doi: 10.1113/jphysiol.1983.sp014747. [DOI] [PMC free article] [PubMed] [Google Scholar]
- Mellor J, Nicoll RA, Schmitz D. Mediation of hippocampal mossy fiber long-term potentiation by presynaptic Ih channels. Science. 2002;295:143–147. doi: 10.1126/science.1064285. [DOI] [PubMed] [Google Scholar]
- Morita K, David G, Barrett JN, Barrett EF. Posttetanic hyperpolarization produced by electrogenic Na+-K+ pump in lizard axons impaled near their motor terminals. J Neurophysiol. 1993;70:1874–1884. doi: 10.1152/jn.1993.70.5.1874. [DOI] [PubMed] [Google Scholar]
- Pape HC. Queer current and the pacemaker: the hyperpolarization-activated cation current in neurons. Ann Rev Physiol. 1996;58:299–327. doi: 10.1146/annurev.ph.58.030196.001503. [DOI] [PubMed] [Google Scholar]
- Poolos NP, Mauk MD, Kocsis JD. Activity-evoked increases in extracellular potassium modulate presynaptic excitability in the CA1 region of the hippocampus. J Neurophysiol. 1987;58:404–416. doi: 10.1152/jn.1987.58.2.404. [DOI] [PubMed] [Google Scholar]
- Raastad M. Extracellular activation of unitary synapses between hippocampal CA3 and CA1 pyramidal cells. Eur J Neurosci. 1995;7:1882–1888. doi: 10.1111/j.1460-9568.1995.tb00709.x. [DOI] [PubMed] [Google Scholar]
- Ranck JB. Studies on single neurons in dorsal hippocampal formation and septum in unrestrained rats. Part I. Behavioral correlates and firing repertoires. Exp Neurol. 1973;41:461–531. doi: 10.1016/0014-4886(73)90290-2. [DOI] [PubMed] [Google Scholar]
- Rang HP, Ritchie JM. On the electrogenic sodium pump in mammalian non-myelinated nerve fibres and its activation by various external cations. J Physiol. 1968;196:183–221. doi: 10.1113/jphysiol.1968.sp008502. [DOI] [PMC free article] [PubMed] [Google Scholar]
- Ritchie JM. Physiology of axons. In: Waxman SG, Kocsis JD, Stys PK, editors. The Axon. Structure, Function and Pathophysiology. New York: Oxford University Press; 1995. pp. 68–96. [Google Scholar]
- Ritchie JM, Straub RW. The after-effects of repetitive stimulation on mammalian non-medullated fibres. J Physiol. 1956;134:698–711. doi: 10.1113/jphysiol.1956.sp005676. [DOI] [PMC free article] [PubMed] [Google Scholar]
- Ritchie JM, Straub RW. The hyperpolarization which follows activity in mammalian non-medullated fibres. J Physiol. 1957;136:80–97. doi: 10.1113/jphysiol.1957.sp005744. [DOI] [PMC free article] [PubMed] [Google Scholar]
- Robert A, Jirounek P. Axonal and glial currents activated during the post-tetanic hyperpolarization in non-myelinated nerve. Pflugers Arch. 1998;436:529–537. doi: 10.1007/s004240050668. [DOI] [PubMed] [Google Scholar]
- Rose CR, Kovalchuk Y, Eilers J, Konnerth A. Two-photon Na+ imaging in spines and fine dendrites of central neurons. Pflugers Arch. 1999;439:201–207. doi: 10.1007/s004249900123. [DOI] [PubMed] [Google Scholar]
- Santoro B, Chen S, Lüthi A, Pavlidis P, Shumyatsky GP, Tibbs GR, Siegelbaum SA. Molecular and functional heterogeneity of hyperpolarization-activated pacemaker channels in the mouse CNS. J Neurosci. 2000;20:5264–5275. doi: 10.1523/JNEUROSCI.20-14-05264.2000. [DOI] [PMC free article] [PubMed] [Google Scholar]
- Santoro B, Tibbs GR. The HCN gene family: molecular basis of the hyperpolarization-activated pacemaker channels. Ann NY Acad Sci. 1999;868:741–764. doi: 10.1111/j.1749-6632.1999.tb11353.x. [DOI] [PubMed] [Google Scholar]
- Shepherd GM, Harris KM. Three-dimensional structure and composition of CA3→CA1 axons in rat hippocampal slices: implications for presynaptic connectivity and compartmentalization. J Neurosci. 1998;18:8300–8310. doi: 10.1523/JNEUROSCI.18-20-08300.1998. [DOI] [PMC free article] [PubMed] [Google Scholar]
- Sik A, Tamamaki N, Freund TF. Complete axon arborization of a single CA3 pyramidal cell in the rat hippocampus, and its relationship with postsynaptic parvalbumin-containing interneurons. Eur J Neurosci. 1993;5:1719–1728. doi: 10.1111/j.1460-9568.1993.tb00239.x. [DOI] [PubMed] [Google Scholar]
- Southan AP, Morris NP, Stephens GJ, Robertson B. Hyperpolarization-activated currents in presynaptic terminals of mouse cerebellar basket cells. J Physiol. 2000;526:91–97. doi: 10.1111/j.1469-7793.2000.t01-1-00091.x. [DOI] [PMC free article] [PubMed] [Google Scholar]
- Southan AP, Robertson B. Patch-clamp recordings from cerebellar basket cell bodies and their presynaptic terminals reveal an asymmetric distribution of voltage-gated potassium channels. J Neurosci. 1998;18:948–955. doi: 10.1523/JNEUROSCI.18-03-00948.1998. [DOI] [PMC free article] [PubMed] [Google Scholar]
- Thomas RC. Membrane current and intracellular sodium changes in a snail neurone during extrusion of injected sodium. J Physiol. 1969;201:495–514. doi: 10.1113/jphysiol.1969.sp008769. [DOI] [PMC free article] [PubMed] [Google Scholar]
- Torebj örk HE. Afferent C units responding to mechanical, thermal and chemical stimuli in human non-glabrous skin. Acta Phyiol Scand. 1974;92:374–390. doi: 10.1111/j.1748-1716.1974.tb05755.x. [DOI] [PubMed] [Google Scholar]
- Van Essen DC. The contribution of membrane hyperpolarization to adaptation and conduction block in sensory neurones of the leech. J Physiol. 1973;230:509–534. doi: 10.1113/jphysiol.1973.sp010201. [DOI] [PMC free article] [PubMed] [Google Scholar]
- Westrum LE, Blackstad TW. An electron microscopic study of the stratum radiatum of the rat hippocampus (regio superior, CA1) with particular emphasis on synaptology. J Comp Neurol. 1962;119:281–292. doi: 10.1002/cne.901190303. [DOI] [PubMed] [Google Scholar]
- Wojtowicz JM, Atwood HL. Maintained depolarization of synaptic terminals facilitates nerve-evoked transmitter release at the crayfish neuromuscular junction. J Neurobiol. 1983;14:385–390. doi: 10.1002/neu.480140506. [DOI] [PubMed] [Google Scholar]
- Wojtowicz JM, Atwood HL. Presynaptic membrane potential and transmitter release at the crayfish neuromuscular junction. J Neurophysiol. 1984;52:99–113. doi: 10.1152/jn.1984.52.1.99. [DOI] [PubMed] [Google Scholar]
- Yau KW. Receptive fields, geometry and conduction block of sensory neurones in the central nervous system of the leech. J Physiol. 1976;263:513–538. doi: 10.1113/jphysiol.1976.sp011643. [DOI] [PMC free article] [PubMed] [Google Scholar]