

Abstract
Renal ischaemia releases reactive oxygen species (ROS) in the kidneys. We hypothesized that the kidneys are more resistant to the insult of ROS in chronically hypoxic rats. We thus compared rats kept at sea level (SL) and those that had been adapted to hypoxia (hypoxia adapted, HA) by exposure to an altitude of 5500 m in an altitude chamber for 15 h day−1 for 4 weeks. Xanthine (X, 0.75 mg kg−1) and xanthine oxidase (XO, 24.8 mU kg−1) were injected intrarenally. A lucigenin-enhanced chemiluminescence method was employed to detect the amount of free radicals in renal venous blood samples and on the kidney surface. In the renal venous blood samples, 26.05 (± 4.36) × 104 and 10.98 (± 1.79) × 104 counts were detected in the SL and HA rats, respectively, after X-XO treatment; these figures were significantly different. On the kidney surface of the SL rats, the free radical count amounted to 12.77 (± 1.64) × 104, while that in the HA rats was 8.47 (± 0.42) × 104; these figures were also significantly different. There was a significant increase in urine volume and urinary excretion of Na+, K+ and protein after X-XO administration in both groups of rats. However, the effect was greater for the SL rats than for the HA rats. The lipid peroxidation of the kidneys was not significantly different in the two groups of rats. Finally, we found that the activity of superoxide dismutase (SOD) and SOD mRNA were higher in the renal tissue of HA rats. We conclude that the renal response to free radicals is attenuated after chronic hypoxia in rats, and that SOD might play an important role in protecting HA rats from oxidative stress.
We have shown previously that chronically hypoxic kidneys are more resistant to ischaemic insult. In response to 45 min of renal artery occlusion, renal function was more preserved (Chen, 1993) and the renal handling of saline loading had nearly recovered 24 h after the ischaemia (Chien & Chen, 1994). The mechanism underlying this beneficial effect has not yet been established.
Reactive oxygen species (ROS) are constantly formed in the body, often for useful metabolic purposes, but oxidative stress is an important cause of cell damage in various diseases. To prevent excessive ROS-induced stress, the effects of a complex antioxidant defence involving superoxide dismutases (SOD), catalase (CAT) and glutathione peroxidases (GSH-px) have been discussed extensively. In the kidney, antioxidant enzyme expression has been shown to be particularly high compared with that in other organs (Lenzen et al. 1996).
The oxidative state of a tissue is determined by the balance between the oxidative and antioxidant systems. Inside the kidney, the activities of xanthine oxidase and NADH and NADPH-dependent oxidases do not differ in the glomeruli and proximal tubules; however, the activities of SOD, CAT and GSH-px are much higher in the proximal tubules than in the glomeruli (Gwinner et al. 1998).
In general, the formation of oxygen-derived free radicals decreases during hypoxia (De Groot & Littauer, 1989). However, Nakanishi et al. (1995) showed that malondialdehyde (MDA) levels in the serum, heart, lungs, liver and kidneys of hypobaric hypoxic rats are all significantly higher than in control rats by day 21 of exposure, indicating increased oxidative stress. They also found that SOD, CAT and GSH-px levels were not significantly changed during that time.
Pretreatment with some ROS scavengers improves renal function after ischaemia/reperfusion (I/R) damage, indicating that ROS are involved in renal I/R insults (Alatas et al. 1996; Chien et al. 1999a). We proposed that the attenuation of renal impairment from an I/R challenge in chronically hypoxic kidneys could be due to increased antioxidant and/or reduced oxidant production.
Whether the same extent of I/R produces the same level of oxidants in the chronically hypoxic kidney as that produced in rats kept at sea level (SL) is not known. In this study, we produced the same amount of ROS inside the kidney by an injection of the same amount of xanthine-xanthine oxidase (X-XO); we then measured the quantity of ROS released from the kidney surface and in samples of renal venous blood. Thus, the renal defence against oxidants could be compared between control and experimental animals.
METHODS
Experiments were performed on female Wistar rats weighing 190-260 g. All animal experiments and animal care were preformed according to the Guides for the Care and Use of Laboratory Animals (published by National Academy Press, Washington DC, 1996). The protocol was approved by the Laboratory Animal Care Committee of the National Taiwan University College of Medicine.
Induction of chronic hypoxia
The rats were exposed to hypoxia in an altitude chamber for 15 h day−1 for 4 weeks, as described previously (Chen et al. 1991, 1997; Chen, 1993). They were kept in the chamber (hypoxia adapted, HA) at a constant temperature and light cycle (light at 07.00 h to 18.00 h), while the controls were maintained at room air pressure (SL). The level of 5500 m (380 Torr) was selected for hypoxia because it represents the maximal altitude to which most rats can adapt successfully. The animals were exposed from 17.00 h to 08.00 h, then returned to room air. The animals were allowed free access to food and water at all times, and their body weight was measured weekly.
Renal response to X-XO treatment
On the experimental day, all rats were anaesthetized with sodium pentobarbital (50 mg kg−1, I.P.) and were tracheotomized. Catheters were placed in the left carotid artery for arterial blood pressure recording, and in the left femoral vein for anaesthetic supplements (pentobarbital 15 mg kg−1 h−1) and blood administration. The rat was then placed on its right side and the left kidney was exposed via a flank incision and dissection from the surrounding tissue. The left renal artery was cannulated by introducing a length of stretched PE10 tubing from the left femoral artery via the aorta. The left renal vein was cannulated via the inferior vena cava, as described by Chapman et al. (1981). Ninety minutes were allowed for stabilization after surgery, and then the following experiments were performed.
Changes of lucigenin-enhanced chemiluminescence counts (CL)
Renal venous blood
The aorta above the renal artery was temporarily occluded (1 min), and the following chemicals (in a volume of 300 μl) were infused via the renal artery in the following groups of animals, each group comprising five rats: (1) SL-V, 0.01 N NaOH (vehicle) to SL rats, (2) SL-S, normal saline to SL rats, (3) SL-XXO, xanthine (0.75 mg kg−1, dissolved in 0.01 N NaOH), then xanthine oxidase (24.8 mU kg−1) to SL rats, (4) HA-S, normal saline to HA rats and (5) HA-XXO, xanthine (0.75 mg kg−1), then xanthine oxidase (24.8 mU kg−1) to HA rats. In order to ascertain whether or not the CL originated from superoxide, blood samples were prepared as follows: (6) SL-SOD-XXO, renal venous blood samples were obtained after injection of 10 000 U of SOD, then X-XO was applied directly to the blood sample and (7) SL-XXO-SOD, the blood sample from SL-XXO was mixed with 10 000 U of SOD.
In order to detect the influence of haematocrit (Hct) on blood CL, another three blood samples (n = 5, each) were prepared: (1) SL40, blood samples from SL rats with the Hct adjusted to 40 %, (2) HA60, blood samples from HA rats with the Hct adjusted to 60 % and (3) HA40, blood samples from HA rats with the Hct reduced to 40 %. The Hct adjustment was effected by withdrawal of plasma or red blood cells from the samples.
A 0.2 ml sample of whole blood was obtained from each animal with a heparinized plastic syringe 1 min and 30 min after X-XO administration from the left renal vein, and 0.1 ml of PBS buffer (pH 7.4) was added to the blood sample.
ROS levels were measured by a CL analysing system (CLD-110, Tohoku Electronic Industrial, Sendai, Japan). The system contains a photon detector (Model CLD-110), CL counter (Model CLC-10), water circulator (Model CH-200) and 32 bit IBM personal computer system. A cooler circulator is connected to the model CLD-110 photon detector to keep the temperature at 5 °C. The CLD-110 model is extremely sensitive; it is able to detect as little as 10−15 W of radiant energy.
The CL was measured in an absolutely dark chamber of the CL analysing system. We demonstrated that using lucigenin (N,N‘-dimethyldiacridinium, Sigma, USA) or 2-methyl-6- [4-methoxyphenyl]-3,7-dihydroimidazo-[1,2-a]-pyrazin-3-one hydrochloride to enhance the CL counts provided similar data to those reported in our previous in vivo study (Chien et al. 2001). The lucigenin-enhanced CL method provides a reliable assay for superoxide. After 100 s, 1.0 ml of 0.1 mM lucigenin in PBS (pH = 7.4) was mixed with the blood. The CL in the blood sample was measured continuously for a total of 600 s. The assay was performed in duplicate for each sample, and the results are expressed as CL counts (10 s)−1. The total amount of CL in 600 s was calculated by integrating the area under the curve. The mean ± S.E.M. CL level for each sample was calculated.
The kidney surface
After surgery, the animals were placed into the sample chamber (Model TLU-17, CLD-110, Tohoku Electronic Industrial) and the kidney was subjected to CL assay, as described previously (Chien et al. 2001). To exclude photons from sources other than the kidney CL, the animals were housed in a dark box with a shielded plate. Only the renal window was left unshielded and positioned under a reflector, reflecting the photons from the exposed kidney onto the photosensitive area of the detector. To record ROS production optically, 0.1 ml of 0.1 mM lucigenin was injected directly into the kidney via the renal artery. Five study groups were prepared: SL-V (n = 3), SL-S (n = 3), SL-XXO (n = 3), HA-S (n = 4) and HA-XXO (n = 3).
Changes in renal function
After general surgery, the rats were further prepared for renal clearance studies. The left kidney was exposed for measurement of cortical microvascular blood flow (CMVBF), as described previously (Chen et al. 1996), using a 1 mm diameter fibre-optic probe attached to a Periflux PF 3 laser Doppler flowmeter (Perimed, Stockholm, Sweden). The CMVBF was measured in perfusion units (PU) and was displayed on the polygraph. To collect urine, the left ureter was cannulated. A sustained infusion of saline (1.2 ml h−1) containing inulin (Inutest, Laevosan-Gesellschaft, Austria) was administered intravenously.
Ninety minutes were allowed for stabilization before clearance measurements were made. Each clearance period was 30 min. After baseline measurements were made, four groups of animals were studied: (1) SL-S (n = 6), (2) SL-XXO (n = 8, (3) HA-S (n = 4) and (4) HA-XXO (n = 9), and another four clearance periods were imposed after the administration of chemicals. The process of X-XO or saline administration was the same as described above. Arterial blood samples were obtained from the carotid arterial catheter at the beginning and end of each clearance period. All blood withdrawn was replaced with an equal volume of blood taken from a separate donor animal in order to maintain stable blood pressure and Hct. The donor rat was prepared using the same surgical procedure. The rat was anaesthetized with sodium pentobarbital (50 mg kg−1, I.P.) and tracheotomized, and a catheter was placed in the carotid artery. At the end of the experiment, the animal was killed by an overdose of pentobarbital (300 mg kg−1).
The urine volume was estimated by weighing and the Hct was determined with a Triac centrifuge (Clay-Adams, NJ, USA). Spectrophotometric methods were used to determine the urinary and plasma concentrations of inulin (Fuhr et al. 1975), and the glomerular filtration rate (GFR) was estimated from the renal clearance of inulin. Plasma and urine concentrations of sodium were determined with a flame photometer (Eppendorf, FCM6341, Hamburg, Germany).
Lipid peroxidation of the kidneys
SL and HA rats (n = 6 each) were killed by an overdose of sodium pentobarbital (150 mg kg−1 via the femoral vein). Kidneys were flushed with ice-cold normal saline from the aorta, excised and separated into the cortex and medulla. All tissue was weighed and homogenized in 1.5 volumes of potassium phosphate buffer containing 0.1 mM EDTA, followed by centrifugation (12 000 g, 4 °C, 10 min). The supernatant was taken and immediately stored at -70 °C, until enzyme assay. Protein concentration was determined by its reaction with Coomassie blue dye (Bio-Rad, Hercules, CA, USA).
MDA measurements
MDA levels in the kidneys were determined by spectrophotometric measurement, according to the methods provided by Oxis Research (Portland, OR, USA), and are expressed as mM (mg protein)−1.
Isoprostane assay
The extraction and enzyme immunoassay procedures used to measure isoprostanes follow the methods supplied in the 8-isoprostaglandin F2α enzyme immunoassay kit obtained from Assay Designs (Ann Arbor, MI, USA). First, 2 M HCl was added to all samples (pH 3.5), which were then mixed thoroughly and centrifuged. Extraction was then performed with a Sep-Pak C18 column, with washes of water and hexane. The isoprostanes were eluted from the column with a solution of ethyl acetate-methanol, which was then removed by drying under nitrogen. The samples were reconstituted into 1 ml of assay buffer. For the assay, standards and samples were first added in duplicate to the 96-well plate provided in the kit, followed by addition of tracer and antibody and then incubation for 45 min at room temperature. The plate was washed several times with wash buffer. After optimal development of colour, the plate was read at 450 nm, and values of unknowns are expressed as ng (mg protein)−1.
SOD in the kidneys
SOD activity
Renal SOD activity was measured in eight SL and seven HA rats, using the Bioxytech SOD-525 method (Oxis, Portland, OR, USA), as described previously (Huang et al. 2002), based on the SOD-mediated increase in the rate of autoxidation of 5,6,6a,11b-tetrahydro-3,9,10-trihydroxybenzofluorine in alkaline solution, to yield a chromophore with maximum absorbance at 525 nm. Ethanol/chloroform extraction inactivates MnSOD, therefore the extract is specific for CuZnSOD.
SOD mRNA
Total RNA from the kidneys of six SL rats and five HA rats was extracted using Trizol reagent (Gibcobrl, Grand Island, NY, USA), following the manufacturer's instructions. The amount of total RNA was determined from the 260 nm/280 nm optical density ratio of each sample, and its quality was confirmed by electrophoresis on 1.2 % agarose gels stained with ethidium bromide. The PCR procedure was performed using a TaqMan EZ RT-PCR kit (Perkin-Elmer, Foster City, CA, USA), as described previously (Ma et al. 2002b). The theoretical basis and methodology of the ABI PRISM 7700 Sequence Detection System (TaqMan) real-time quantitative PCR (Perkin-Elmer Applied Biosystem) have been described by Johnson et al. (2000). Briefly, samples with a high starting copy number of the gene of interest show increased fluorescence early in the PCR process, resulting in a low-threshold cycle number (CT). The comparative CT (ΔΔCT) method was used to quantify renal MnSOD mRNA levels, the fold induction being equal to 2-(ΔΔCT).
The primers and fluorogenic probes for CuZnSOD, MnSOD and glyceraldehyde-3-phosphate dehydrogenase (GAPDH) were designed, and total RNA extraction and the PCR procedure were performed as described previously (Ma et al. 2002a,b). The CuZnSOD primers and probe were as follows: forward primer 5′-TTC CAT CAT TGG CCG TAC TA-3′, reverse primer 5′-AGC GGC TTC CAG CAT TT-3′ and probe 5′-6-carboxyfluorescein (FAM)-ACT TTC TTC ATT TCC ACC TTT GCC CAA-tetramethylrhodamine (TAMRA)-3′. The MnSOD primers and probe were as follows: forward primer 5′-ACG CGA CCT ACG TGA ACA ATC T-3′, reverse primer 5′-CAG TGC AGG CTG AAG AGC AA-3′ and probe 5′-FAM-ATC TCC CTT GGC CAG GGC CT-TAMRA-3′. The GAPDH primers and probe were as follows: forward primer 5′-TTT CTC GTG GTT CAC ACC CA-3′, reverse primer 5′-GTC ATC ATC TCC GCC CCT T-3′ and probe 5′-FAM-CGC TGA TGC CCC CAT GTT TGT G-TAMRA-3′.
Data treatment
All values are expressed as means ± S.E.M. Differences within groups were evaluated by Student's paired t test. Differences between the groups were analysed by Student's unpaired t test or one-way analysis of variance, and Duncan's multiple range test was used to compare groups. Differences were regarded as significant if P < 0.05 was attained.
RESULTS
After 4 weeks, the HA rats were in good health with a significantly higher Hct than the control animals (60.1 ± 1.3 vs. 41.3 ± 0.7 %; P < 0.001).
Renal response to X-XO
Changes in lucigenin-enhanced CL
Figure 1 shows representative measurements of blood CL after different treatments. Group data are shown in Fig. 2. The basal CL levels in the renal venous blood samples were in the region of 1150 counts (10 s)−1. Total counts in 10 min were around 5-8 × 10⁴. Lucigenin enhanced CL from the blood after the intrarenal arterial administration of X-XO. X-XO increased the CL count by 187 % in blood samples from SL rats, and by only 28 % in HA blood samples, figures that are significantly different. The blood samples obtained 30 min after X-XO treatment still showed higher CL counts in SL-XXO (24.0 (± 6.33) × 104) and HA-XXO animals (8.13 (± 0.14) × 104) compared to SL-S (8.67 (± 0.70) × 104) and HA-S animals (7.71 (± 0.81) × 104).
Figure 1. Original tracings of lucigenin-enhanced CL from renal venous blood samples after different treatments directed into the right kidney of SL rats.

Experimental groups: (1) SL-V, injection of 0.01 N NaOH (vehicle), (2) SL-S, injection of normal saline, (3) SL-XXO, injection of xanthine (0.75 mg kg−1, dissolved in 0.01 N NaOH) then xanthine oxidase (24.8 mU kg−1), (4) SL-SOD-XXO, instead of treating the animals with X-XO, renal venous blood samples were obtained after injection of 10 000 U of SOD then X-XO was added directly to the samples, and (5) SL-XXO-SOD, blood samples from SL-XXO animals were mixed with 10 000 U of SOD.
Figure 2. CL counts in renal venous blood samples from the seven experimental groups.

Mean ± S.E.M. CL counts from the following experimental groups: SL-V, SL-S, HA-S (normal saline administered to HA rats), SL-XXO and HA-XXO (0.75 mg kg−1 xanthine and then 24.8 mU kg−1 xanthine oxidase administered to HA rats), SL-SOD-XXO and SL-XXO-SOD. n = 5 animals per group. *P < 0.05, **P < 0.01, injection of saline vs. injection of X-XO; §P < 0.05, SL vs. HA after the same treatment.
The blood samples taken following administration of vehicle (0.01 N NaOH) or saline via the renal artery exhibited no change in CL compared to control.
The addition of SOD to blood samples taken following X-XO treatment caused an abrupt reduction in the CL (Fig. 1). Pretreatment with SOD via the renal artery only mildly increased CL after X-XO. This suggests that the CL occurs mainly as a result of the action of superoxide.
When the Hct was reduced from 60 to 40 % in HA blood samples, the CL increased by 80 %, but was still lower than in SL rats with a Hct of 40 % (Fig. 3).
Figure 3. Influence of Hct on CL in the blood samples of HA rats.
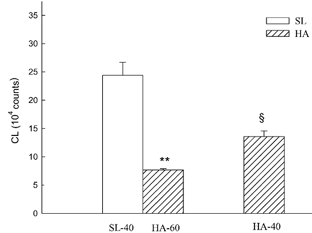
Blood CL counts were determined in SL blood at a Hct of 40 % (SL-40), HA blood at a Hct of 60 % (HA-60) and HA blood at a Hct of 40 % (HA-40). n = 5 animals per group. **P < 0.01, HA-60 vs. HA-40 blood samples; §P < 0.05, HA-40 vs. SL-40.
Injection of lucigenin into the X-XO-pretreated kidney via the renal artery led to a rapid rise in CL counts to a peak at 2 min postinjection. The basal CL level detected from the normal kidney surface was about 1500 counts (10 s)−1. The SL and HA kidneys treated with vehicle (0.01 N NaOH) or saline did not show such an abruptly increased CL after the administration of lucigenin, suggesting that the enhanced CL was the result of X-XO stimulation. The total amount of CL released from the kidney surface in 10 min is shown in Fig. 4. The baseline release of CL in SL-S and HA-S kidneys were not significantly different. X-XO increased CL release by 91.62 % in SL rats and 19.01 % in HA rats. The increase of CL in SL rats was significantly higher than that in HA rats. The increase in CL release was still evident 30 min after the administration of X-XO in both SL and HA rats.
Figure 4. CL counts from kidney surface in five groups of rats.

SL-V (n = 3), SL-S (n = 3), HA-S (n = 3), SL-XXO (n = 4) and (5) HA-XXO (n = 3). *P < 0.05, injection of HA-XXO vs. injection of X-XO; §P < 0.05, SL vs. HA after the same treatment.
The injection of saline via the renal artery did not cause any significant change in renal function in either SL or HA rats (data not shown).
Changes in renal function
As shown in Table 1, the baseline mean arterial blood pressure (MABP), heart rate (HR), urine volume (UV), urinary sodium (UNaV), potassium (UKV) and protein (UproV) excretions, GFR and CMVBF of the left kidneys in HA rats were not significantly different from those of SL rats. Table 1 also shows the renal effect of injection of X-XO via the renal artery. Direct renal artery administration of X-XO into the left kidney did not cause a significant change in MABP, HR or Hct. X-XO significantly increased UV, UNaV, UKV and UproV in both SL and HA animals. GFR increased in SL rats, but did not significantly change in HA rats. CMVBF was reduced in both groups of animals. All of these, except UproV and CMVBF, eventually returned to their normal, resting levels. It is very interesting to note that the exaggerated urinary excretions after X-XO were significantly attenuated in HA rats (Fig. 5).
Table 1.
Effect of administration of xanthine-xanthine oxidase (X-XO) via the renal artery on renal function in SL and HA rats
| C1 | C2 | T1 | T2 | T3 | T4 | ||
|---|---|---|---|---|---|---|---|
| MABP (mmHg) | SL | 113.8 ± 2.8 | 117.5 ± 13.3 | 117.9 ± 6.1 | 112.1 ± 5.3 | 105.0 ± 3.9 | 105.7 ± 4.4 |
| HA | 112.2 ± 1.9 | 107.8 ± 2.1 | 112.2 ± 2.4 | 112.2 ± 2.4 | 110.0 ± 2.5 | 109.4 ± 2.8 | |
| HR (beats min-1) | SL | 456.5 ± 4.2 | 448.5 ± 4.5 | 432.0 ± 7.7 | 420.5 ± 7.8 | 425.3 ± 7.2 | 440.8 ± 8.0 |
| HA | 452.6 ± 7.2 | 450.5 ± 5.6 | 449.8 ± 8.9 | 452.3 ± 9.5 | 454.5 ± 9.5 | 460.5 ± 8.2 | |
| Hct (%) | SL | 41.3 ± 0.7 | 40.9 ± 0.9 | 41.1 ± 0.9 | 40.9 ± 1.0 | 40.9 ± 1.0 | 41.0 ± 0.9 |
| HA | 60.1 ± 1.3§§ | 60.1 ± 1.3§§ | 60.2 ± 1.3§§ | 60.3 ± 1.3§§ | 60.2 ± 1.3§§ | 60.2 ± 1.3§§ | |
| UV(μl min1) | SL | 4.49 ± 0.35 | 4.54 ± 0.24 | 13.69 ± 1.40** | 6.35 ± 0.99 | 5.41 ± 0.97 | 4.92 ± 0.86 |
| HA | 5.84 ± 0.61 | 5.43 ± 0.64 | 7.93 ± 0.56*§§ | 6.29 ± 0.83 | 6.11 ± 0.70 | 5.51 ± 0.84 | |
| UNaV (mmol min-1) | SL | 0.51 ± 0.10 | 0.51 ± 0.12 | 2.59 ± 0.23** | 0.60 ± 0.05 | 0.53 ± 0.12 | 0.44 ± 0.12 |
| HA | 0.58 ± 0.12 | 0.53 ± 0.10 | 0.98 ± 0.12*§ | 0.77 ± 0.15 | 0.65 ± 0.15 | 0.55 ± 0.17 | |
| UKV (mmol min-1) | SL | 0.72 ± 0.07 | 0.74 ± 0.07 | 1.47 ± 0.05** | 0.84 ± 0.07 | 0.69 ± 0.05 | 0.58 ± 0.08 |
| HA | 0,83 ± 0.05 | 0.78 ± 0.06 | 0.94 ± 0.06§ | 0.85 ± 0.11 | 0.78 ± 0.06 | 0.73 ± 0.08 | |
| UproV (μg min-1) | SL | 3.83 ± 0.62 | 4.69 ± 0.88 | 179.2 ± 17.7** | 46.8 ± 11.9* | 32.19 ± 8.61* | 23.62 ± 7.56* |
| HA | 3.23 ± 0.52 | 3.80 ± 0.65 | 9.04 ± 1.60**§§ | 4.36 ± 1.10§§ | 4.31 ± 1.25§§ | 4.23 ± 1.13§§ | |
| GFR (ml min-1) | SL | 1.04 ± 0.11 | 1.13 ± 0.13 | 1.51 ± 0.14* | 1.09 ± 0.11 | 0.94 ± 0.08 | 1.03 ± 0.13 |
| HA | 1.20 ± 0.08 | 1.18 ± 0.11 | 1.27 ± 0.19 | 1.39 ± 0.24 | 1.14 ± 0.12 | 1.15 ± 0.16 | |
| CMVBF(PU) | SL | 430.6 ± 9.21 | 421.8 ± 8.3 | 367.2 ± 18.9* | 371.8 ± 20.0 | 362.0 ± 14.5* | 335.6 ± 20.8* |
| HA | 447.3 ± 17.0 | 438.0 ± 15.0 | 425.2 ± 16.0§ | 401.1 ± 10.2** | 396.0 ± 15.2** | 387.8 ± 21.9 |
X-XO was administrered to SL (n = 8) and HA (n = 9) rats. C1 and C2 are baseline data; T1, T2, T3 and T4 are data recorded after treatment.
P < 0.05
P < 0.01, comparison before and after treatment
P < 0.05
P < 0.01, comparison between SL and HA.
Figure 5. Per cent changes of UV, UNaV, UKV and UproV after direct renal injection of X-XO in SL (n = 8) and HA (n = 9) rats.

T1, T2, T3 and T4 represent the 1st, 2nd, 3rd and 4th clearance periods after X-XO injection. *P < 0.05, **P < 0.01, injection of X-XO vs. injection of saline; §§P < 0.01 SL vs. HA after the same treatment.
Lipid peroxidation of the kidneys
No significant changes were seen in either isoprostane or MDA levels in the renal cortex or medulla after 4 weeks of hypoxia (Fig. 6).
Figure 6. Effect of adaptation to hypoxia on the levels of lipid peroxides in the rat kidney.

Lipid peroxides in the renal medulla and renal cortex of SL (n = 6) and HA (n = 6) rats.
SOD in the kidneys
The activities of SODs are depicted in Fig. 7. In SL kidneys, CuZnSOD activity was 60 % higher in the renal medulla than in the renal cortex. CuZnSOD activity in the HA kidneys was also higher in the medulla than in the cortex; the activity in each part of the HA renal tissue, was considerably higher than that in its counterpart in SL kidneys. In SL kidneys, the activity of MnSOD in the medulla was higher than in the cortex. The same tendency for MnSOD activity was found in the renal tissue of the HA kidneys. MnSOD activity in each part of HA kidneys was also higher than in its counterpart in SL kidneys.
Figure 7. Effect of adaptation to hypoxia on the activity of CuZnSOD and MnSOD in the rat kidney.

The activity of CuZnSOD and MnSOD in the renal medulla and renal cortex of SL (n = 8) and HA rats (n = 7). *P < 0.05, **P < 0.01, renal tissue from HA vs. SL rats.
Figure 8 shows that there was a significantly higher expression of both kinds of SOD mRNA in both the renal cortex and renal medulla in HA rats compared with that in SL rats.
Figure 8. Expression of CuZnSOD and MnSOD mRNA in the kidneys of SL and HA rats.

CuZnSOD and MnSOD mRNA expression in kidneys from SL (n = 5) and HA rats (n = 5), measured using real-time RT-PCR. The fold induction in five SL and five HA kidneys, as assessed using specific GAPDH and neurokinin-1 receptor primers, is shown. The ΔΔCT value was calculated by subtracting the ΔCT value for the no template control from that for each sample. *P < 0.05, **P < 0.01, HA vs. SL rats.
DISCUSSION
In the present study we have demonstrated that (1) injection of X-XO via the renal artery causes CL release that could be detected in renal venous blood and on the kidney surface, (2) the amount of CL released was significantly attenuated in HA rats, (3) the same dose of X-XO caused renal functional changes that were milder in HA rats than in SL rats, (4) renal lipid peroxidation was similar in SL and HA rats and (5) the enzyme activity and mRNA of both CuZn and MnSOD were higher in the tissues of HA kidneys.
In the study presented here, we injected X-XO directly into the kidney and followed this with 1 min of renal ischaemia and stimulation by 0.1 ml of 0.01 N sodium hydroxide as the vehicle. As shown in our results, 1 min of renal ischaemia and reperfusion without X-XO administration did not cause an elevation of CL. This process did not cause any significant changes in the renal parameters measured. Furthermore, the injection of X-XO did not produce any significant systemic alteration, suggesting that it is possible to study the local action of X-XO treatment in vivo.
After the X-XO challenge, HA rats released less CL, which could be due to a lower response of HA kidneys to X-XO and/or a higher SOD action. The CL detected from the kidney surface and renal venous blood samples was not entirely the result of the initially injected X-XO, which remained in the kidneys for only 1 min during the aortic occlusion and was then was flushed away after reperfusion. The enhanced CL was still detected 30 min after the reperfusion. The CL might result indirectly from the activated tissue stimulated by X-XO. The attenuation of CL release in HA kidneys might be due to a blunted response to X-XO.
The CL detected from the renal surface might have originated from tissues beneath it, including some endothelial cells, epithelial cells and neutrophils from the blood. Analysing their role in the reduction of CL is more complicated. The blood corpuscles are very potent scavengers, reducing the Hct from 60 to 40 % in HA blood, and increasing the CL by 80 %. At the same Hct of 40 %, HA blood released only half of the CL released by SL blood, suggesting that scavengers other than blood cells exist in HA blood or that blood corpuscles from HA rats are more potent scavengers than those of SL rats.
In general, the formation of oxygen-derived free radicals decreases during hypoxia (De Groot & Littauer, 1989). However, prolonged exposure to high altitude has been reported to cause a marked increase in the level of expired pentane, suggesting an increase in lipid peroxidation, which may indicate increased oxidative stress (Simon-Schnass, 1992). Nakanishi et al. (1995) demonstrated directly an increase in the level of MDA in the plasma and several organs (including the kidney) in their rats, which were subjected to different durations of hypoxia at an altitude of 5500 m. However, the MnSOD did not significantly change in all kidney tissues. This is different from the results of our study, in which we found that the activity of both MnSOD and CuZnSOD were significantly enhanced. In fact, the actual amount of SOD may not reflect solely the activity of the enzyme, it may also reflect the presence or absence of cofactors, activators and inhibitors.
Based on cytochrome c reduction, Gwinner et al. (1998) measured the antioxidant activity in kidneys and found that the activity of SOD was much higher in the tubules than in the glomeruli. This was more or less confirmed in our SL kidneys, in which the activity of SOD in both the cytosol and mitochondria was higher in the medulla than in the cortex. Generally speaking, SOD activity was higher in each portion of HA kidneys than in their counterpart in SL kidneys.
The baseline lipid peroxidation and the baseline CL detected on the renal surface or in blood samples were not significantly different between the SL and HA rats. We found that SOD is higher in the kidneys of HA rats, also suggesting that HA rats produce more ROS, especially superoxide, in their kidneys. This experiment did not uncover the reason for the higher SOD activity in the HA kidney; however, we suggest that it may be due to a simple upregulation stimulated by the increase of ROS that occurs following chronic hypoxia, and that a new balance of oxidants and antioxidants has been reached in the chronic hypoxic kidney.
Yoshioka et al. (1991) found that massive proteinuria resulted from the direct infusion of hydrogen peroxide into the rat renal artery, which was not related to any light or electron microscopic abnormalities in the glomeruli. These authors also found severe diuresis after the application of hydrogen peroxide; however, the effective renal blood flow and GFR were not significantly changed, indicating that the diuresis was the result of the inhibition of tubular reabsorption. In our experiment, the application of X-XO directly into the renal artery caused the same diuresis and proteinuria, and these were accompanied by an increase in GFR in SL rats, so the mechanism of diuresis may be not the same as in the experiments of Yoshioka et al. (1991) involving challenge with hydrogen peroxide. This discrepancy might be due to the different methods used in the two studies.
Ischaemic preconditioning is a phenomenon by which multiple brief exposure to ischaemia can reduce the damage caused by subsequent prolonged ischaemia (Murry et al. 1986). More recently, studies have suggested that hypoxia can substitute for ischaemia in preconditioning (Silverman et al. 1997; Chien et al. 1999b). Tajima et al. (1994) reported that chronic hypoxia increased the tolerance to myocardial ischaemia in a manner dissimilar to preconditioning, and showed that ischaemic preconditioning and HA were additively protective. Lai et al. (1998) showed that chronic hypoxia attenuated hyperpnoea-induced bronchoconstriction via a decrease in the oxygen radical-mediated release of tachykinins. Adaptation to chronic hypoxia might place the organism in a better position to tolerate impending episodes of challenge. The results of this experiment suggest that increased levels of SOD also provide some help.
Our previous report showed that chronically hypoxic kidneys are more resistant to ischaemic insult, due to increases in the levels of heat shock protein 70 and bcl-2 (Chien et al. 1999b). The mechanism underlying this beneficial effect requires further study. Here, we report an enhanced level of SOD in the kidneys of chronically hypoxic rats, which might play a role in their resistance to detrimental challenges. Hypoxia-inducible factor 1 is a protein that is synthesized rapidly during hypoxia and then activates the transcription of several genes including erythropoietin, vascular endothelial growth factor, inducible nitric oxide synthase and endothelin 1 (Jung et al. 2000). Whether or not it also activates the transcription of the gene for SOD is of further interest.
In conclusion, the renal response to a free radical challenge is attenuated in HA rats, and SOD might play an important role in protecting HA rats from oxidative stress.
Acknowledgments
We thank Professor Y. C. Lin, Department of Physiology, Hawaii University, USA, for careful reading of the manuscript and for correcting the English. The present study was supported by grants from the National Science Council of the Republic of China (NSC90-2320-B002-155 and 91-2320-B-002-077) to Dr C. F. Chen.
REFERENCES
- Alatas O, Sahin A, Colak O, Inal M, Koken T, Yasar B, Karahuseyinoglu E. Beneficial effects of allopurinol on glutathione levels and glutathione peroxidase activity in rat ischaemic acute renal failure. J Int Med Res. 1996;24:33–39. doi: 10.1177/030006059602400105. [DOI] [PubMed] [Google Scholar]
- Chapman BJ, Munday KA, Philpot ME. Cannulation of the renal vein of the rat for the measurement of the arterial to venous extraction ratio (E) for various substances. J Physiol. 1981;310:38P. [Google Scholar]
- Chen CF. Renal functional response to ischaemic renal failure in chronic hypoxic rats. Clin Sci. 1993;85:123–127. doi: 10.1042/cs0850123. [DOI] [PubMed] [Google Scholar]
- Chen CF, Chen LW, Chien CT, Wu MS. Renal function of substance P in rats chronically exposed to hypoxia. Aviat Space Environ Med. 1997;68:705–709. [PubMed] [Google Scholar]
- Chen CF, Chen LW, Chien CT, Wu MS, Tsai TJ. Renal kallikrein in chronic hypoxic rats. Clin Exp Pharmacol Physiol. 1996;23:819–824. doi: 10.1111/j.1440-1681.1996.tb01186.x. [DOI] [PubMed] [Google Scholar]
- Chen CF, Chien CT, Fang HS, Chiu IS. Effects of atrial natriuretic factor in chronic hypoxic spontaneously hypertensive rats. Hypertension. 1991;18:355–359. doi: 10.1161/01.hyp.18.3.355. [DOI] [PubMed] [Google Scholar]
- Chien CT, Chen CF. Ischemic renal failure in chronic hypoxic rats. Ren Fail. 1994;16:255–261. doi: 10.3109/08860229409044865. [DOI] [PubMed] [Google Scholar]
- Chien CT, Chen CF, Chiang LY, Lai MK. Novel water-soluble hexa(sulfony)fullerenes attenuates apoptosis formation after ischemic renal failure. Fullerene Sci Technol. 1999a;7:529–540. [Google Scholar]
- Chien CT, Chen CF, Hsu SM, Lee PH, Lai MK. Protective mechanism of preconditioning hypoxia attenuates apoptosis formation during renal ischemia/reperfusion phase. Transplant Proc. 1999b;31:2012–2013. doi: 10.1016/s0041-1345(99)00250-x. [DOI] [PubMed] [Google Scholar]
- Chien CT, Lee PH, Chen CF, Ma MC, Lai MK, Hsu SM. De novo demonstration and co-localization of free-radical production and apoptosis formation in rat kidney subjected to ischemia/reperfusion. J Am Soc Nephrol. 2001;12:973–982. doi: 10.1681/ASN.V125973. [DOI] [PubMed] [Google Scholar]
- De Groot H, Littauer A. Hypoxia, reactive oxygen, and cell injury. Free Radic Biol Med. 1989;6:541–551. doi: 10.1016/0891-5849(89)90047-6. [DOI] [PubMed] [Google Scholar]
- Fuhr J, Kaczmarczyk J, Kruttgen CD. Eine einfache colorimetrische Methode zur Inulinbestimmugn. Klin Wochensch. 1975;33:729–730. doi: 10.1007/BF01473295. [DOI] [PubMed] [Google Scholar]
- Gwinner W, Deters-Evers U, Brandes RP, Kubat B, Koch KM, Pape M, Olbricht CJ. Antioxidant-oxidant balance in the glomerulus and proximal tubule of the rat kidney. J Physiol. 1998;509:599–606. doi: 10.1111/j.1469-7793.1998.599bn.x. [DOI] [PMC free article] [PubMed] [Google Scholar]
- Huang HS, Ma MC, Chen J, Chen CF. Changes in the oxidant-antioxidant balance in the kidney of rats with nephrolithiasis induced by ethylene glycol. J Urol. 2002;167:2584–2593. [PubMed] [Google Scholar]
- Johnson MR, Wang K, Smith JB, Heslin MJ, Diasio RB. Quantitation of dihydropyrimidine dehydrogenase expression by real-time reverse transcription polymerase chain reaction. Anal Biochem. 2000;278:175–184. doi: 10.1006/abio.1999.4461. [DOI] [PubMed] [Google Scholar]
- Jung F, Palmer LA, Zhou N, Johns RA. Hypoxic regulation of inducible nitric oxide synthase via hypoxia inducible factor-1 in cardiac myocytes. Circ Res. 2000;86:319–325. doi: 10.1161/01.res.86.3.319. [DOI] [PubMed] [Google Scholar]
- Lai YL, Lin CW, Lai LC. Attenuation of isocapnic hyperpnoea-induced guinea-pig bronchoconstriction by chronic hypoxia. Eur Respir J. 1998;11:1075–1080. doi: 10.1183/09031936.98.11051075. [DOI] [PubMed] [Google Scholar]
- Lenzen S, Drinkgern J, Tiedge M. Low antioxidant enzyme gene expression in pancreatic islets compared with various other mouse tissues. Free Radic Biol Med. 1996;20:463–466. doi: 10.1016/0891-5849(96)02051-5. [DOI] [PubMed] [Google Scholar]
- Ma MC, Huang HS, Chen CF. Impaired renal sensory responses after unilateral ureteral obstruction in the rat. J Am Soc Nephrol. 2002a;13:1008–1016. doi: 10.1681/ASN.V1341008. [DOI] [PubMed] [Google Scholar]
- Ma MC, Huang HS, Chien CT, Wu MS, Chen CF. Temporal decrease in renal sensory responses in rats after chronic ligation of the bile duct. Am J Physiol. 2002b;283:F164–172. doi: 10.1152/ajprenal.00231.2001. [DOI] [PubMed] [Google Scholar]
- Murry CE, Jennings RB, Reimer KA. Preconditioning with ischemia: a delay of lethal cell injury in ischemic myocardium. Circulation. 1986;74:1124–1136. doi: 10.1161/01.cir.74.5.1124. [DOI] [PubMed] [Google Scholar]
- Nakanishi K, Tajima F, Nakamura A, Yagura S, Ookawara T, Yamashita H, Suzuki K, Taniguchi N, Ohno H. Effects of hypobaric hypoxia on antioxidant enzymes in rats. J Physiol. 1995;489:869–876. doi: 10.1113/jphysiol.1995.sp021099. [DOI] [PMC free article] [PubMed] [Google Scholar]
- Silverman HS, Wei S, Haigney MC, Ocampo CJ, Stern MD. Myocyte adaptation to chronic hypoxia and development of tolerance to subsequent acute severe hypoxia. Circ Res. 1997;80:699–707. doi: 10.1161/01.res.80.5.699. [DOI] [PubMed] [Google Scholar]
- Simon-Schnass IM. Nutrition at high altitude. J Nutr. 1992;122:778–781. doi: 10.1093/jn/122.suppl_3.778. [DOI] [PubMed] [Google Scholar]
- Tajima M, Katayose D, Bessho M, Isoyama S. Acute ischaemic preconditioning and chronic hypoxia independently increase myocardial tolerance to ischaemia. Cardiovasc Res. 1994;28:312–319. doi: 10.1093/cvr/28.3.312. [DOI] [PubMed] [Google Scholar]
- Yoshioka T, Ichlkawa I, Fogo A. Reactive oxygen metabolites cause massive reversible proteinuria and glomerular sieving defect without apparent ultrastructural abnormality. J Am Soc Nephrol. 1991;2:902–912. doi: 10.1681/ASN.V24902. [DOI] [PubMed] [Google Scholar]