

Abstract
In the present work we test the hypothesis that sustained transgenic overexpression of insulin-like growth factor-1 (IGF-1) in skeletal muscle prevents age-related decreases in myoplasmic Ca2+ concentration and consequently in specific force in single intact fibres from the flexor digitorum brevis (FDB) muscle from the mouse. Measurements of IGF-1 concentration in FDB muscle showed higher levels in transgenic than in wild-type mice at all ages. The specific tetanic force decreased significantly in single muscle fibres from old (286 ± 22 kPa) compared to young wild-type (455 ± 28 kPa), young transgenic (423 ± 43 kPa), and old transgenic mice (386 ± 15 kPa) (P < 0.05). These results are consistent with measurements in whole FDB muscles. The peak Ca2+ concentration values in response to prolonged stimulation were: 1.47 ± 0.15, 1.70 ± 0.29, 0.97 ± 0.13 and 1.7 ± 0.22 μm, in fibres from young wild-type, young transgenic, old wild-type and old transgenic mice, respectively. The effects of caffeine on FDB fibres support the conclusion that the age-related decline in peak myoplasmic Ca2+ and specific force is not explained by sarcoplasmic reticulum Ca2+ depletion. Immunohistochemistry in muscle cross-sections was performed to determine whether age and/or IGF-1 overexpression induce changes in fibre type composition. The relative percentages of type IIa, IIx and I myosin heavy chain (MHC) isoforms did not change significantly with age or genotype. Therefore, IGF-1 prevents age-related decline in peak intracellular Ca2+ and specific force in a muscle that does not exhibit changes in fibre type composition with senescence.
Impairment in sustained muscle force during prolonged activation is a general phenomenon in ageing mammals (Booth et al. 1994; Hurley, 1995). Specific force declines with ageing in humans (Schultz, 1995; Frontera et al. 2000) and animal models of ageing (Brooks and Faulkner, 1988; González et al. 2000). Studies on in vitro contractility have shown that, in addition to decreases in muscle mass, the intrinsic force-generating capacity of fast- and slow-twitch muscle fibres is impaired in ageing rodents (Brooks and Faulkner, 1994; Renganathan et al. 1998; González et al. 2000). The loss in muscle mass and force per crossbridge would account for the reported decline in absolute and specific force, respectively. Ca2+ plays a major role in muscle force development (for a review see Ashley et al. 1991). We have proposed that decreases in myoplasmic Ca2+ concentration account, at least partially, for the deficit in specific force (Delbono et al. 1995; Wang et al. 2000). The interaction between L-type Ca2+ channel (dihydropyridine receptor, DHPR) and sarcoplasmic reticulum Ca2+ release channel/ryanodine receptor (RyR) at the triadic junction results in sarcoplasmic reticulum Ca2+ release into the myoplasm (Schneider & Chandler, 1973). The age-related decrease in maximum Ca2+ mobilization upon muscle fibre depolarization would result from a decrease in DHPR and ryanodine receptor expression (Renganathan et al. 1997a, 1998). Peak intracellular Ca2+ concentration depends on various factors, some of them being, the activation of the DHPR, activation of the RyR1 and their interaction (Melzer et al. 1995). We have also shown that isolated muscle fibres exhibit a significant reduction in charge movement and peak intracellular Ca2+ in senescent compared to young-adult mice (Wang et al. 2000); however, whether impairment in intracellular Ca2+ mobilization results in decreases in muscle specific force, is not known. To address this point in the present work, we recorded simultaneously maximum intracellular Ca2+ mobilization and specific force in contracting single intact muscle fibres from the flexor digitorum brevis (FDB) muscle of the mouse.
Insulin-like growth factor-1 (IGF-1) is a peptide that has a primary role in promoting skeletal muscle differentiation and growth (Florini et al. 1993, 1996). A series of evidences such as the parallel decrease in circulating IGF-1 and growth hormone pulsatile secretion (Sonntag et al. 1980), the IGF-1 resistance of skeletal muscles from ageing rodents (Florini et al. 1996), the IGF-1-induced hypertrophy in muscle fibres in culture (Vandenburgh et al. 1991), and in transgenic mice (Coleman et al. 1995; Musaro et al. 2001), and the IGF-1-evoked increase in DHPR expression (Renganathan et al. 1998), suggest that this trophic factor can exert effects on muscle structure and function.
In the present work we test the hypothesis that sustained overexpression of IGF-1 in skeletal muscle prevents age-related decreases in myoplasmic Ca2+ concentration and consequently in specific force. Muscle fibre typing was performed to determine whether age and/or IGF-1 overexpression induce changes in fibre type composition of the mouse FDB muscle that potentially confound the interpretation of the functional recordings.
METHODS
Single intact muscle fibre dissection and mounting
Single intact fibres from the flexor digitorum brevis (FDB) muscle were dissected from young adult (2–6 months) or old (22–24 months) DBA or FVB wild-type or S1S2 IGF-1 transgenic mice (Coleman et al. 1995; Renganathan et al. 1998; Renganathan et al. 1997b). The DBA, FVB and S1S2 strains have been used previously as animal models of ageing (Bakker et al. 1997; Renganathan et al. 1997b, 1998; Zheng et al. 2001). Either DBA or FVB mice have been used as control strain due to the non-significant difference in force development (González & Delbono, 2001). The founders of the S1S2 colony were kindly provided by Dr R. Schwartz (Department of Biology, Baylor College of Medicine, Houston, TX, USA). Mice were housed in a pathogen-free area at Wake Forest University School of Medicine (WFUSM). Animal handling and procedures followed an approved protocol by the Animal Care and Use Committee of WFUSM. Mice were killed by cervical dislocation and single fibres were manually dissected from the FDB muscle. The solution for fibre dissection contained (mm): NaCl 145, KCl 5, CaCl2 2.5, MgSO4 1, Hepes 10 and glucose 10 (pH adjusted to 7.4 with NaOH) (Delbono & Kotsias, 1987). The fibre was mounted between a 403A force-transducer (Aurora Scientific, Ontario, Canada) (compliance: 1 μm mN−1, resonant frequency: 0.6 kHz) and an adjustable holder, allowing control on fibre position and length as described previously (Lannergren & Westerblad, 1987; González et al. 2000). The fibre was continually perfused with recording solution (see below) by means of a push-pull pump at a rate of ≈12 ml h−1.
Recording and analysis of single intact muscle fibre contraction
Muscle fibres were stimulated directly by an electrical field generated between two parallel platinum electrodes connected to a stimulator. Fibre length was adjusted at the estimate of sarcomere length eliciting the maximum twitch and tetanic force (Lo). Rectangular pulses (1.5 × threshold and 0.5 ms duration) were applied to elicit brief contractions. Trains of pulses of variable frequency, ranging from 5 to 100 Hz, were applied for 350 ms to elicit unfused or fused contractions. All the experiments were performed at room temperature (21–23°C). The solution used for contraction recording contained (mm): NaCl 121, KCl 5, CaCl2 1.8, MgCl2 0.5, NaH2PO4 0.4, NaHCO3 24.0, glucose 5.5 and EDTA 0.1. This solution was permanently bubbled with a mixture of 5 % CO2 and 95 % O2 in a contiguous chamber, to attain pH 7.4 in the recording chamber. The interval between trains of pulses was maintained constant (5 min). For data acquisition, a personal computer, a D-A and A-D board, interface (Digidata 1200, Axon Instruments, Foster City, CA, USA) and pCLAMP software (Axon) were used. Stimulation pulse waveform was acquired and digitized together with the contraction signal and stored for analysis off-line. The diameter of each fibre was measured at Lo in the recording chamber at 200× magnification and, in some experiments, on digital images of the fibre assisted by image processing software. The largest and smallest diameter of each cell was measured in two different places due to the non-uniform diameter of the fibre. The cross sectional area (CSA) was calculated as π(d/2)2 where d is the mean diameter (Lannergren & Westerblad, 1987; González et al. 2000; González & Delbono, 2001).
Whole muscle contraction experiments
The distal part of the FDB muscle was dissected from both legs of the mouse for whole muscle contraction. The muscle was mounted between a 404A force transducer (Aurora Scientific) (compliance: 0.1 μm mN−1, resonant frequency: 2 kHz) and an adjustable holder, allowing control on muscle position and length. The muscle was continually perfused with recording solution by means of a push-pull pump as described for single fibre experiments.
Contraction recording and analysis for whole muscle experiments followed the technique described for single intact fibres with minor changes. To elicit the maximum tension at different frequencies train of pulses were applied for 500 ms. Longer train durations were applied when needed. The diameter was measured in the recording chamber at Lo by microscopic visualization at 30 × magnification or histological cross sections. The latter were digitally acquired and area of the sections was measured using Isee software (Inovision, Durham, NC, USA). The cross sectional area of each muscle was measured by drawing a region of interest (ROI) along the border of several cross sections of each muscle on digital images. The area was calculated based on the height, width, and the total number of pixels contained in the ROI.
Intracellular Ca2+ recordings in single intact FDB fibres
Intracellular Ca2+ was measured, simultaneously with specific-force, using the fluorescent indicator fluo 3-AM (Molecular Probes, Eugene, OR, USA). Fibres were loaded with 5 μm fluo 3-AM for 30–40 min using a 1 mm fluo 3-AM stock solution in DMSO. This high stock allowed for a very low concentration of DMSO in the recording solution during cell loading (≤ 0.5 %). After loading, cells were perfused for at least 5 min with recording solution before the experiment started. For fluorescent recordings the fibre was illuminated with a laser beam at 488 nm wavelength. The light beam passed through an OZ Scan module (Noran Instruments Confocal System, Middleton, WI, USA) and through a ×20 Fluar objective (Zeiss, Oberkochen, Germany), mounted in an inverted microscope (Axiovert S100 2TV, Zeiss) before reaching the preparation. The fluorescence emitted was collected by the objective and directed to the OZ scan module, in non-slit mode, through the emission filter at 500 nm wavelength before being collected by the photomultiplier tube and digitized. Hardware control, image acquisition, and processing were done with Intervision Software (Noran Instruments) run in a Silicon Graphics O2 Workstation (Mountain View, CA, USA). For data analysis, several ROIs were selected for each cell and the maximum fluorescent deflection was used for the statistics.
Fluo 3-AM calibration and calculation of intracellular Ca2+ concentration
For intracellular Ca2+ quantification, fluorescent signals were converted into Ca2+ concentration. To this end, fluo 3-AM was calibrated in the muscle fibre. Although the Kd is a property of the Ca2+ indicator and is not expected to vary beyond certain limits, it is known that it can be affected by several factors such as pH, viscosity and ionic strength, among others. Therefore, we measured the Kd of fluo 3-AM for Ca2+in vivo, using acutely dissociated FDB fibres. FDB muscles from young mice were incubated with 2 mg ml−1 collagenase (Sigma, St Louis, MO, USA) in a dissociation solution containing: 155 mm caesium aspartate, 5 mm magnesium aspartate and 10 mm Hepes (pH 7.4 with CsOH) (Beam & Franzini-Armstrong, 1997), for 3 h at 37°C. Muscle fibres were dissociated using Pasteur pipettes of different tip sizes. Single fibres were incubated with fluo 3-AM (5 μm) for 30–40 min. After cell loading, the dye was washed out and the fibre exposed to different standard Ca2+ concentration solutions (0–100 μm). The Ca2+ concentration of the standard solutions was calculated according to published methods (Tsien & Pozzan, 1989). In these conditions, basal fluorescence was recorded. Fibres were then permeabilized by applying 0.01 % saponin to allow Ca2+ entry. The maximum fluorescence attained before fibre movement or morphological distortion was recorded. Each experimental point resulted from the mean of at least four cells. The fluorescence at different pCa values were normalized to the maximum fluorescence, and the mean values were fitted to the following equation: y = 1/(1 + (Kd/[Ca2+])) (Wang et al. 1999b). The Kd for fluo 3-AM, measured in these conditions, was 708 nm. Maximum fluorescence (Fmax) was measured at the end of the experiment in each individual cell by perfusing with a Ringer solution containing 1.8 mm Ca2+ and 0.01 % saponin. Fmin, the fluorescence at rest, was measured in a group of fibres equilibrated with 2 mm BAPTA AM. This procedure gave similar results to the minimum fluorescence recorded in individual fibres manually dissected. Intracellular Ca2+ concentration was calculated using the following equation: [Ca2+]i=Kd(F−Fmin)/(Fmax−F), where Kd is the dissociation constant, and F the peak fluorescence value recorded (Tsien & Pozzan, 1989).
Skeletal muscle fibre typing
After contraction recordings, muscles were removed from the recording chamber, pinned at Lo, embedded in OCT medium (Tissue-Tek, Torrance, CA, USA), and rapidly frozen in 2-methylbutane (Fisher Scientific, Pittsburgh, PA, USA) cooled in dry ice at −40°C. Muscles were kept at −80°C for subsequent use. Frozen samples were sectioned with a cryostat (Leica CM3000, Nussloch, Germany) at −21°C. Sections (10 μm) were stored at 4°C until processed for immunohistochemistry. For FDB fibre subtype identification, muscle sections were exposed to the primary antibody NCL-MHCs (type-I), NCL-MHCf (total fast) (Novocastra, Newcastle upon Tyne, UK), A4.74 (type IIa) (Alexis Biochemicals, San Diego, CA, USA), or BF-F3 (type IIb) (ATCC, Rockville, MD, USA) at 1:20 dilution in PBS. A rabbit anti-mouse IgG-fluorescein isothiocyanate (FITC) conjugate (Sigma) was used as a secondary antibody at a 1:100 dilution. MHC IIx was obtained by subtracting IIa and IIb fibres to the total number of fast fibres detected with the NCL-MHCf antibody (Novocastra). As no type IIb fibres were identified in FDB muscle, extensor digitorum longus (EDL) muscles from the same animals were used as positive controls for the BF-F3 antibody. Muscle fluorescence was acquired using an inverted microscope (Axiovert 100, Zeiss) and a PXL-EEV-37 CCD camera (Photometrics, Tucson, AZ, USA)-based imaging system. Isee software (Inovision) running in a Silicon Graphics O2 workstation was used for data acquisition and processing.
Measurement of IGF-1 concentration in FDB muscles
To measure human IGF-1 (hIGF-1) concentration in FDB muscles we used the Active IGF-I ELISA kit (DSL-10-5600, Diagnostic System Laboratories, Inc., Webster, TX, USA). Briefly, individual FDB muscles from wild-type and transgenic mice were frozen in liquid nitrogen and stored at −80° C. Muscles were thawed in assay buffer (1 mg muscle (10 μl assay buffer)−1), homogenized, sonicated, and centrifuged for 10 min at 12 000 g. The supernatant and standard were added into the wells and mixed with the antibody-enzyme complex for 2 h. After washing out this complex, tetramethylbenzidine (TMB) chromogen solution followed by stop solution were added to each well. The absorbance of each well was measured at 450 nm in an AB Biosystem microplate reader. For data normalization, protein concentration in the supernatants was measured using the BCA protein assay (Pierce, Rockford, IL, USA). The detection limit for hIGF-1 was 0.03 ng (g protein)−1.
Statistics
Values are given as means ±s.e.m. with the number of observations (n). Statistical analysis has been performed using analysis of variance (ANOVA) followed by multiple comparisons (Student-Newman-Keuls test). P < 0.05 was considered significant.
RESULTS
IGF-1 expression in FDB muscles from transgenic mice
Previous publications have reported a sustained overexpression of hIGF-1 in S1S2 transgenic mice (Coleman et al. 1995; Renganathan et al. 1998). High-level transgene expression resulted in concentrations of IGF-1 in skeletal muscle from transgenic mice being at least 47-fold greater than in wild-type mice (Coleman et al. 1995). However, the concentration of IGF-1 in specific muscles is not known. Also, there are some indications that the level of IGF-1 expression in transgenic animals varies among muscles (Musaro et al. 2001). Therefore, we measured hIGF-1 concentration in FDB, and compared it with EDL, another hindlimb fast-twitch muscle, from young and old wild-type and transgenic mice, respectively. Measurements were performed in a separate set of muscles to those used for contraction and fluorescence recordings. For these determinations, four to five muscles from two to three mice were pooled, and results were normalized to muscle proteins. Human IGF-1 concentration in FDB and EDL muscles from young and old wild-type mice was undetectable. In transgenic mice, the values for three determinations of hIGF-1 concentration in young and old mice were, in FDB (mean ±s.e.m.; in ng (mg protein)−1): 255 ± 18 and 58 ± 4, and in EDL muscles: 250 ± 22 and 144 ± 16, respectively. It appears that hIGF-1 expression in young transgenic mice is similar in FDB and EDL muscles and that the expression declines in both muscles with ageing.
Specific force in whole FDB muscles from wild-type and IGF-1 transgenic mice
Specific force was measured in FDB muscles from young (number of muscles, n = 6) and old (n = 10) wild-type and from young (n = 8) and old (n = 8) transgenic mice. Both twitch and tetanic force were normalized to the cross-sectional area. The values of specific tetanic force recorded in the present work are similar to those reported for EDL and quadriceps muscle (Fitts et al. 1984; Eddinger et al. 1986), but lower than those for EDL and soleus in other publications (Brooks & Faulkner, 1988; Barton-Davis et al. 1998). An explanation for this difference could be that a significant number of fibres do not develop maximum tension due to the pennation and complex tendon insertion of the whole FDB muscle. Figure 1 shows the values corresponding to these four experimental groups. The specific twitch tension in FDB muscles did not differ significantly among the four groups. The specific tetanic force decreased significantly in FDB muscles from young wild-type (135 ± 17 kPa) and transgenic mice (126 ± 8 kPa) to old wild-type mice (92 ± 6 kPa) (P < 0.05). The percentage of decrease in maximum specific force with ageing of 32 % is consistent with previous reports in the fast twitch EDL muscle from mice and rats (see below). The difference between young wild-type and young transgenic mice was not statistically significant. The specific tension recorded in muscles from old transgenic mice (114 ± 7 kPa) was not significantly different to that recorded in young wild-type or transgenic mice, and it was significantly higher than that recorded in old wild-type mice. These results indicate that transgenic overexpression of IGF-1 in skeletal muscle prevents age-related decreases in maximum whole muscle specific force.
Figure 1. Maximum specific force in FDB muscles from young adult and old, wild-type and IGF-1 transgenic mice.

Tetanic contraction declined significantly in old wild-type compared to young, young transgenic and old IGF-1 transgenic mice (P < 0.05). No statistically significant differences were detected among young, young transgenic and old transgenic(P > 0.05). Twitch specific force was not significantly different among groups. #, statistically significant. Data values are represented as the mean +s.e.m.
Previous studies from our laboratory demonstrated that the peak of intracellular Ca2+ decreases in muscle fibres from ageing mice measured under voltage-clamp conditions (Wang et al. 2000). To examine whether age and/or IGF-1 modify the peak intracellular Ca2+ in contracting fibres, we recorded contraction simultaneously with intracellular Ca2+ concentration in single intact FDB fibres from young adult and old wild-type and IGF-1 transgenic mice.
Cross sectional area and maximum specific force recorded in single intact FDB fibres
The analysis of the cross sectional area of FDB fibres showed an age-dependent atrophy that was prevented by overexpression of IGF-1. The fibre diameter and cross sectional area in old wild-type was: 23 ± 0.9 μm and 436 ± 55 μm2, respectively (n = 20). These values were significantly lower than those recorded in fibres from young wild-type (29 ± 1.2 and 671 ± 41 μm2, n = 17), young transgenic (36 ± 2.3 and 1054 μm2, n = 9) and old transgenic (31 ± 1.8 μm and 781 ± 82 μm2, n = 14) mice. Also, fibre diameter and cross sectional area in fibres from young transgenic are significantly higher compared to young wild-type but not old transgenic mice.
A frequency-tension curve was constructed from records of the force generated in response to stimulation at increasing frequencies. The frequency-tension curve was recorded for most of the fibres using 350 ms trains of pulses of variable frequency. This curve allowed us to find the maximum force for each fibre. The sequence of frequencies tested was 5, 10, 20, 50, 75 and 100 Hz. Fibre stimulation was interrupted when two sequential trains of pulses elicited similar force. Most of the fibres reached the maximum tension at either 75 or 100 Hz. In a few cases, more prolonged stimulation (400 ms) was needed to attain the maximum tension. Figure 2A illustrates the frequency-tension curve for FDB fibres from young and old wild-type and old transgenic mice. Values have been normalized to the maximum tension for each cell. No significant differences in submaximum specific tension normalized to maximum tension were found between the four experimental groups. These results indicate that neither age nor IGF-1 overexpression in muscle exerts significant effects on the frequency needed to elicit force.
Figure 2. Force-frequency and [Ca2+]-frequency relationships in single intact FDB muscle fibres from young and old wild-type and IGF-1 transgenic mice.

Tension (A) and myoplasmic Ca2+ concentration (B) have been normalized to the maximum value for each fibre. Data points are expressed as means ±s.e.m. Results have been fitted to a single exponential function. No statistically significant difference was detected among groups (P > 0.05).
Figure 3 shows representative twitches (Aa) and tetani (Ba) in single FDB fibres. Twitch specific force did not change significantly with ageing or IGF-1 overexpression; however, the decline in maximum tetanic specific force in old wild-type was not recorded in old transgenic mice. Figure 4A compares twitch and tetanus specific force recorded in young wild-type, young transgenic, old wild-type, and old transgenic mice. A significant decrease in maximum specific force was recorded in fibres from old mice compared to young wild-type and young and old transgenic mice. The maximum specific force recorded in fibres from young wild-type, young transgenic, old wild-type and old transgenic mice were: 455 ± 28 (n = 14), 423 ± 43 (n = 11), 286 ± 22 (n = 13) and 385 ± 15 kPa (n = 9) (P < 0.05), respectively. Differences in the values recorded in young wild-type and transgenic and old transgenic mice were not statistically significant.
Figure 3. Contraction and intracellular Ca2+ recordings in single intact FDB fibres.

Representative records of twitch (A) and tetanic (B) contractions and intracellular Ca2+. Traces in a and b correspond to contraction and intracellular Ca2+ transients, respectively, recorded in single intact FDB fibres from young and old wild-type and transgenic mice. Both maximum specific force and peak intracellular Ca2+ concentration are significantly lower in old wild-type than in young or old transgenic mice. Fibre tension is expressed as normalized values to cross-sectional area, in kilopascals. Ca2+ concentration is expressed in absolute values, as explained in Methods. Contraction and intracellular Ca2+ transients have the same time scale. Dashed lines indicate the force and myoplasmic Ca2+ baselines.
Figure 4. Maximum specific twitch force, tetanic force, and peak intracellular Ca2+ concentration in single intact FDB muscle fibres from young adult and old wild-type and IGF-1 transgenic mice.

A, tetanic contraction declined significantly in old wild-type compared to young wild-type and transgenic and old transgenic mice (P < 0.05). No significant differences in twitch specific force were detected among the four groups. B, maximum intracellular Ca2+ concentration recorded in response to twitch or tetanic pulses in intact FDB fibres. #, statistically significant difference between the old wild-type and the other three groups (P < 0.05). No statistically significant difference was detected among young, young transgenic, and old transgenic mice. Data values are represented as means +s.e.m.
To determine whether the population of fibres studied in young and old wild-type and transgenic mice was different, we analysed the rate of force generation (dP/dt) normalized to twitch tension, the time to peak, and half relaxation time in the twitch (Table 1). The statistical analysis did not show significant differences among the four groups for the three parameters measured. To further determine the phenotype of the fibres studied, we investigated myosin heavy chain expression in whole muscle using immunocytochemistry (see below).
Table 1.
Twitch contraction and intracellular Ca2+ kinetics in single intact FDB muscle fibres
| Young wild type | Young transgenic | Old wild type | Old transgenic | |
|---|---|---|---|---|
| Normalized dP/dt (ms−1) | 0.035 ± 0.004 | 0.033 ± 0.004 | 0.038 ± 0.007 | 0.037 ± 0.006 |
| Time to peak (ms) | 38 ± 2 | 43 ± 1 | 45 ± 3 | 42 ± 4.5 |
| Half relaxation time (ms) | 68 ± 6 | 71 ± 5 | 87 ± 7 | 81 ± 11 |
| dCa2+/dt(μm/ms) | 0.05 ± 0.01 | 0.06 ± 0.01 | 0.06 ± 0.01 | 0.07 ± 0.02 |
Values are expressed as means ±s.e.m. from 14–17 fibres per group. The statistical groups did not show significant differences (P > 0.05). dp/dt is the rate of force development and has been normalized to the twitch tension. dCa2+/dt is the rate of Ca2+ release.
Peak intracellular Ca2+ concentration in single intact FDB muscle fibres
Transient elevations in intracellular Ca2+ concentration were recorded simultaneously with contraction using the fluorescent Ca2+ indicator fluo 3-AM. Figure 3Ab and Bb shows intracellular Ca2+ transients in response to brief and prolonged stimulation, respectively, in intact FDB fibres from young and old wild-type and transgenic mice. The peak intracellular Ca2+ concentration recorded in old transgenic mice was not significantly different to that recorded in young and old wild-type and transgenic mice in response to brief stimulations. It is also apparent that the peak intracellular Ca2+ is significantly lower in old wild-type than in young wild-type and transgenic mice in response to prolonged stimulation (tetanus), and that this decline is prevented by transgenic overexpression of IGF-1.
To determine whether ageing and/or IGF-1 modify the frequency-Ca2+ concentration curve, intracellular Ca2+ was recorded in response to different stimulation frequencies in FDB fibres from young and old wild-type and old transgenic mice (Fig. 2B). Ca2+ values are lower than 100 % because Ca2+ concentration has been normalized to the maximum value in each fibre, which was not always at 100 Hz (i.e. it was at 75 Hz in some experiments). Normalized values to the maximum peak intracellular Ca2+ did not show significant differences among the experimental groups in the frequency needed to reach the peak intracellular Ca2+ or submaximal responses, in correspondence with the frequency-tension curve shown in Fig. 2A.
No differences in peak intracellular Ca2+ concentration were found in fibres from young wild-type and transgenic and old transgenic mice in response to the tetanic stimuli (Fig. 4B). The peak intracellular Ca2+ concentration recorded in fibres from old wild-type mice in response to prolonged pulses (tetani) was significantly lower than that recorded in the other three groups. No significant differences were found when intracellular Ca2+ concentration in FDB fibres from young wild-type and transgenic and old transgenic fibres were compared (P > 0.05). The peak Ca2+ concentration values in response to prolonged stimulation were: 1.47 ± 0.15, 1.70 ± 0.29, 0.97 ± 0.13 and 1.7 ± 0.22 μm, in fibres from young wild-type, young transgenic, old wild-type and old transgenic mice, respectively. The Ca2+ transient values recorded in response to brief stimulation (twitch) were: 0.50 ± 0.04, 0.54 ± 0.07, 0.38 ± 0.06 and 0.57 ± 0.07 μm for young wild-type, young transgenic, old wild-type and old transgenic mice, respectively. These values were not significantly different. The rate of intracellular Ca2+ concentration change was calculated in individual experiments as the first derivative of the Ca2+ transient signal in response to brief stimulation. As reported previously, dCa2+/dt represents the SR Ca2+ release for brief pulses (Melzer et al. 1987). The rate of increase in intracellular Ca2+ (dCa2+/dt) was not significantly different among the four groups (P > 0.05) (Table 1). The rate of decrease in intracellular Ca2+ was not measured due to the slow dissociation kinetics of the fluo 3-Ca2+ complex.
Effects of caffeine on the age-related decline in maximum specific force and peak myoplasmic Ca2+ concentration
Figure 5A shows the enhancing effect of caffeine on maximum tetanic force for young wild-type (n = 8), young transgenic (n = 8), old wild-type (n = 15) and old transgenic mice (n = 7) (P < 0.05). Maximum specific force and myoplasmic Ca2+ concentration was measured simultaneously in 7–8 fibres. Differences in the number of experiments reflect the inclusion in the statistics of fibres in which only one parameter was measured, or the exclusion of those ones in which measurements were not reliable for technical reasons. Caffeine-induced potentiation of single fibre force is consistent with the increase in caffeine-induced Ca2+ release reported by our laboratory previously, in single voltage-clamped muscle fibres (Delbono et al. 1995). The specific force measured in fibres from young and old wild-type mice exposed to caffeine was significantly different (P < 0.05). However, no differences were detected between fibres from young wild-type mice before caffeine and old wild-type mice after caffeine treatment. In addition, no differences were found between fibres from young wild-type and transgenic and old transgenic recorded in caffeine. In summary, these results show that caffeine can fully restore the specific force of FDB fibres from old wild-type mice to the level of the young wild-type group before caffeine; however a deficit remains when fibres from both groups are compared after caffeine treatment.
Figure 5. Effects of caffeine on maximum specific force and intracellular Ca2+ concentration in single intact fibres from young and old wild-type and transgenic mice.

Specific force (A) and peak myoplasmic Ca2+ concentration (B) before and after 5 mm caffeine (within 30 min incubation). * and #, statistical significance within groups (before and after caffeine) and between old wild-type mice and the remaining groups before caffeine (P < 0.05), respectively. **, statistically significant difference between muscle fibres from young and old wild-type mice treated with caffeine.
The force-frequency relationship for young and old wild-type and transgenic mice reached a plateau, suggesting that maximum activation is attained in tetanus. To examine whether an impairment of Ca2+ release accounts for the deficit in tension recorded in fibres from old wild-type mice, the effect of caffeine on the peak intracellular Ca2+ was studied. Figure 5B represents the effect of caffeine on intracellular Ca2+ measured in single intact FDB muscle fibres from young wild-type (n = 9), young transgenic (n = 7), old wild-type (n = 8) and old transgenic mice (n = 7). The maximum effect of caffeine was recorded within 30 min of incubation. It is obvious that caffeine (5 mm) enhances the peak intracellular Ca2+ significantly in the four groups of mice (P < 0.05). The enhancing effect of caffeine on maximum myoplasmic Ca2+ was more obvious in fibres from old wild-type mice than in the remaining three groups. The change in intracellular Ca2+ concentration induced by caffeine in fibres from old wild-type mice was not significantly different to that recorded in fibres from the other three groups.
Fibre-type composition in ageing and IGF-1 transgenic FDB muscle
To determine whether the reduction in specific force recorded in whole muscle and single fibres from FDB results from changes in fibre type composition, FDB muscles were analysed for myosin heavy chain (MHC) composition using immunohistochemistry as described above (see Methods). Figure 6 shows representative serial non-continuous sections of FDB muscle immunostained with antibodies for type I, IIa and IIb fibres. This technique allowed us to quantify the relative percentage of muscle fibre subtypes. Table 2 shows the statistical analysis of the muscle fibre type characterization in four to five FDB muscles used for functional recordings in the present study. The counting of the total number of fibres was not significantly different. Therefore, the determination of the relative proportion of fibre subtypes was done over a comparable number of fibres regardless of age or genotype. Fibres expressing MHC IIb were not detected in any of the four groups of FDB muscles. The predominant MHC isoform was the IIx followed by IIa and I. The statistical analysis did not show significant differences among groups, suggesting that the age-related decline in specific force and intracellular Ca2+ reported above does not result from changes in fibre subtype.
Figure 6. Fibre-type composition in ageing and IGF-1 transgenic FDB muscle.
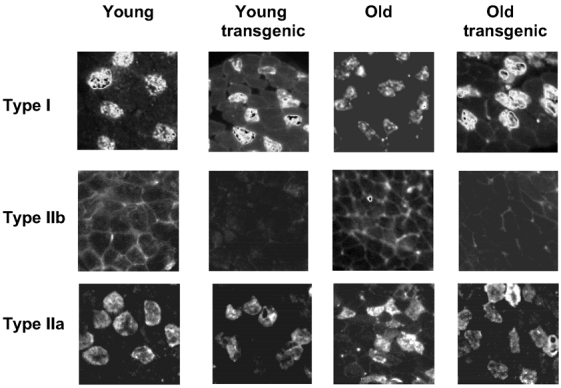
Representative serial sections of FDB muscle immunostained with labelled antibodies for type I, IIa and IIb fibres from young and old wild-type and IGF-1 transgenic mice. Quantification of the relative percentages of muscle fibre subtypes is shown in Table 2.
Table 2.
FDB muscle fibre type composition
| Young wild type | Young transgenic | Old wild type | Old transgenic | |
|---|---|---|---|---|
| Number of fibres per muscle | 209 ± 16 | 199 ± 10 | 210 ± 19 | 208 ± 11 |
| I | 17.0 ± 3.9 | 16.3 ± 3.2 | 12.7 ± 1.8 | 17.6 ± 0.25 |
| IIa | 12.5 ± 2.9 | 14.2 ± 3.6 | 11.5 ± 0.7 | 9.2 ± 1.3 |
| IIb | 0 | 0 | 0 | 0 |
| Ix | 70.5 ± 4.2 | 69.5 ± 6.5 | 75.8 ± 1.1 | 73.2 ± 1.2 |
FDB muscle fibre type composition has been studied by immunohistochemistry. Values (means ±s.e.m.) from 4–5 muscles per group are expressed as percentages of the total number of fibres per muscle. The statistical analysis among groups did not show significant differences (P > 0.05).
DISCUSSION
The present study supports the conclusion that overexpression of IGF-1 in skeletal muscle prevents the age-related decrease in intracellular Ca2+ and subsequently in specific force, and that age and IGF-1 effects are not associated with switching in fibre subtype in FDB muscle of the mouse.
IGF-1 prevents age-related decreases in specific force
In this work we investigated the effects of sustained overexpression of IGF-1 in skeletal muscle on specific force and intracellular Ca2+ in single intact fibres. We hypothesized that IGF-1 prevents age-related decline in skeletal muscle specific force secondarily to enhancing the peak intracellular Ca2+ and correcting any other possible associated alteration(s) (i.e. decline in force per crossbridge). The effects of sustained overexpression of IGF-1 on skeletal muscle mass have been reported previously in the mouse and rat. Recombinant adenovirus prevents the age-related loss in muscle mass and force. This effect would occur through a primary stimulation of muscle regeneration and preservation of type IIb fibres via the activation of satellite cells by IGF-1 (Barton-Davis et al. 1998). A transgenic mouse overexpressing the muscle isoform of IGF-1 in skeletal muscle exhibits muscle hypertrophy, however data on muscle force at later ages have not been reported (Musaro et al. 2001).
In the present study, we found that the reported age-related decline in muscle specific force described in FVB (the background strain for S1S2 mice) (González & Delbono, 2001) was prevented by muscle overexpression of hIGF-1, and that this does not seem to result from an effect on muscle fibre type composition. Although fibre type was assessed in whole muscle, it is unlikely that differences in intracellular peak Ca2+ and specific force result from changes in fibre phenotype. This assertion finds further support in the lack of significant difference in the rate of fibre contraction and relaxation and rate of increase in intracellular Ca2+ concentration with age and IGF-1 overexpression.
The reported decrease in fibre cross sectional area in the absence of changes in muscle fibre type composition suggests that the fibre type switching and/or denervation previously reported in rat fast muscles (Larsson et al. 1991) is delayed in mouse FDB compared to other muscles and animal species. It should be mentioned that the FDB is comparatively slower than EDL, among other muscles, based on the absence of type IIb fibres (Allen et al. 1993). The significant effect of IGF-1 on muscle cross sectional area is consistent with previous reports (Coleman et al. 1995; Musaro et al. 2001). The muscle atrophy recorded in muscles from old wild-type mice together with the lack of statistically significant difference in fibre cross sectional area between young wild-type and old transgenic mice suggests that IGF-1 preserves muscle trophism and favours regeneration across ages, probably through an effect on satellite cell activation (Barton-Davis et al. 1998). In the present study, apoptosis does not seem to be an obvious event based on the similar number of fibres per muscle among the age groups.
In this work we report a 32 % decrease in FDB muscle specific tension with ageing. This value is similar to that reported in rat FDB muscle (Carlsen & Walsh, 1987) and mouse EDL (Brooks & Faulkner, 1988). Age-dependent effects on single intact FDB fibres have not been reported previously. The age-related decline in specific force reported here for FDB muscle and single fibres is consistent with previous studies in EDL and soleus single intact muscle fibres that show a decrease in 26 % and 20 %, respectively (González et al. 2000). We did not find significant differences in whole muscle specific tension recorded in young wild-type and old IGF-1 transgenic mice. These results agree with those previously reported in rodents overexpressing IGF-1 by means of an adenovirus (Barton-Davis et al. 1998) or a transgenic mechanism (Renganathan et al. 1998), and suggest that localized high concentrations of IGF-1 improve the force developed by crossbridges in addition to the reported role in enhancing muscle mass.
Mechanisms underlying the decline in muscle fibre specific force with ageing
We have proposed that impairment in the mechanism of sarcolemmal excitation-sarcoplasmic reticulum Ca2+ release is a basic process underlying the reported age-related decline in specific skeletal muscle tension (Delbono et al. 1995, 1997). To examine this hypothesis, we investigated whether alterations in intracellular Ca2+ elevations induced by electrical stimulation result in reduced specific force in contracting single intact FDB fibres from senescent mice. The mean peak Ca2+ concentration recorded in FDB fibres from young wild-type mice in response to brief stimulation was in the range reported in the literature (Westerblad & Allen, 1991; Carroll et al. 1995) although lower than that reported by other group (Bakker et al. 1997). The lack of significant differences between young and young transgenic mice is consistent with voltage-clamped FDB fibres in which intracellular Ca2+ was recorded with a relatively low affinity Ca2+ indicator (Wang et al. 2002). The maximum intracellular Ca2+ concentration in fibres from old mice was significantly lower than that recorded in young mice. The decrease in peak Ca2+ concentration (≈34 %) was similar to the decrease in specific force in single fibres (37 %) and whole muscle (32 %). This decrease was somewhat less than that reported in voltage-clamped fibres (≈48 %) (Wang et al. 2000). To examine whether an impairment of Ca2+ release accounts for the tension deficit, the effect of caffeine on maximum tension was studied. The caffeine-induced potentiation of single fibre maximum force reported here is consistent with the increase in Ca2+ release evoked by caffeine in single voltage-clamped muscle fibres (Delbono et al. 1995). It could be argued that tetanus does not represent a condition of maximal fibre activation, since it has been reported that caffeine enhances maximum myoplasmic Ca2+ and specific force in intact fibres from the mouse FDB muscle (Allen & Westerblad, 1995). Based on this experimental evidence, further increase in myoplasmic Ca2+ after reaching maximum electrically evoked sarcoplasmic reticulum Ca2+ release, is expected. The caffeine experiments in fibres from young and old wild-type and transgenic mice support the conclusion that there is an extra pool of sarcoplasmic reticulum Ca2+ available in response to maximum electrical stimulation. This supports the idea that sarcoplasmic reticulum Ca2+ depletion does not explain the decrease in maximum Ca2+ release in fibres from senescent wild-type mice. The decrease in DHPR number and RyR1 (Renganathan et al. 1997a), increase in RyR uncoupled to DHPR (Renganathan et al. 1998), and potential alterations in RyR open probability associated with channel disregulation (Damiani et al. 1996) in fibres from senescent mice, are some of the explanations for the failure to make use of the extra Ca2+ pool to compensate for the decline in voltage-dependent Ca2+ release. Although peak myoplasmic Ca2+ concentration is fully restored, a deficit in specific force remains after caffeine treatment of fibres from old wild-type mice. Therefore, other mechanisms contributing to the age-related decline in force should be considered. The alteration of a fully activated contractile machinery to develop force can contribute to the decline in specific force with ageing. Age-related decrease in specific force in type I, IIA, and IIB/IIX fibres from rat and human muscles has been reported in the literature (Li & Larsson, 1996; Larsson et al. 1997; Thompson and Brown, 1999; Frontera et al. 2000; Lowe et al. 2002). The observation that maximally activated skinned muscle fibres from old humans and old small mammals develop less specific force than muscle fibres from young individuals suggests that the intrinsic capacity of the myofibrillar apparatus to develop force is also impaired in ageing in addition to alterations in excitation-contraction coupling. Both submaximal activation of the contractile apparatus and loss of intrinsic capacity to develop force could cooperate in determining the loss of force in ageing.
Mechanisms of IGF-1 effects on IGF-1 transgenic mice
Local sustained overexpression of IGF-1 prevents age-related decrease in peak intracellular Ca2+ and specific force in FDB fibres from old S1S2 mice. This suggests that IGF-1 prevents alterations in excitation-contraction coupling in addition to other potential mechanism(s) (i.e. decline in force per crossbridge) involved in the age-dependent decline in muscle force. Peak Ca2+ recorded in fibres from old transgenic mice was significantly higher than that recorded in fibres from old wild-type but similar to fibres from young wild-type mice. IGF-1 enhances the expression of DHPRα1S in muscle primary culture (Renganathan et al. 1998; Wang et al. 1999a) and in muscles from adult and senescent mice, consistently with the reported sustained overexpression of IGF-1 in muscle (10–15-fold compared to wild-type) throughout life (Renganathan et al. 1998). The increase in DHPR α1 subunits results from an increase in gene transcription (Zheng et al. 2001). The pathway for IGF-1 effects on fibre size has been reported and seems to involve the activation of calcineurin and GATA (Musaro et al. 1999; Semsarian et al. 1999). Studies from our laboratory have demonstrated a complex mechanism for DHPRα1S expression (Zheng et al. 2002). Therefore, the signalling pathways for the IGF-1 effects on muscle hypertrophy and control of key molecules involved in muscle Ca2+ dynamics do not overlap completely. Whether the muscle IGF-1 isoform (Owino et al. 2001) is also effective in preventing age-related decrease in the expression of these channels, intracellular Ca2+, and specific force as reported here, is not known.
Acknowledgments
The present study was supported by grants from the National Institutes of Health/National Institute on Aging (AG18755, AG13934, and AG15820) and Muscular Dystrophy Association of America to Osvaldo Delbono.
REFERENCES
- Allen DG, Duty S, Westerblad H. Metabolic changes in muscle during exercise; their effects on muscle function. Proc Aust Physiol Pharmacol Soc. 1993;24:65–75. [Google Scholar]
- Allen DG, Westerblad H. The effects of caffeine on intracellular calcium, force and the rate of relaxation of mouse skeletal muscle. J Physiol. 1995;487:331–342. doi: 10.1113/jphysiol.1995.sp020883. [DOI] [PMC free article] [PubMed] [Google Scholar]
- Ashley CC, Mulligan IP, Lea TJ. Ca2+ and activation mechanisms in skeletal muscle. Q Rev Biophys. 1991;24:1–73. doi: 10.1017/s0033583500003267. [DOI] [PubMed] [Google Scholar]
- Bakker AJ, Head SI, Stephenson DG. Time course of calcium transients derived from Fura-2 fluorescence measurements in single fast twitch fibres of adult mice and rat myotubes developing in primary culture. Cell Calcium. 1997;21:359–364. doi: 10.1016/s0143-4160(97)90029-4. [DOI] [PubMed] [Google Scholar]
- Barton-Davis ER, Shoturma DI, Musaro A, Rosenthal N, Sweeney HL. Viral mediated expression of insulin-like growth factor I blocks the aging-related loss of skeletal muslce function. Proc Natl Acad Sci U S A. 1998;95:15603–15607. doi: 10.1073/pnas.95.26.15603. [DOI] [PMC free article] [PubMed] [Google Scholar]
- Beam KG, Franzini-Armstrong C. Functional and structural approaches to the study of excitation-contraction coupling. Methods Cell Biol. 1997;52:283–306. doi: 10.1016/s0091-679x(08)60384-2. [DOI] [PubMed] [Google Scholar]
- Booth FW, Weeden SH, Tseng BS. Effect of aging on human skeletal muscle and motor function. Med Sci Sports Exerc. 1994;26:556–560. [PubMed] [Google Scholar]
- Brooks SV, Faulkner JA. Contractile properties of skeletal muscles from young, adult and aged mice. J Physiol. 1988;404:71–82. doi: 10.1113/jphysiol.1988.sp017279. [DOI] [PMC free article] [PubMed] [Google Scholar]
- Brooks SV, Faulkner JA. Skeletal muscle weakness in old age: underlying mechanisms. Med Sci Sports Exerc. 1994;26:432–439. [PubMed] [Google Scholar]
- Carlsen RC, Walsh DA. Decrease in force potentiation and appearance of alpha-adrenergic mediated contracture in aging rat skeletal muscle. Pflugers Arch. 1987;408:224–230. doi: 10.1007/BF02181463. [DOI] [PubMed] [Google Scholar]
- Carroll SL, Klein MG, Schneider MF. Calcium transients in intact rat skeletal muscle fibers in agarose gel. Am J Physiol. 1995;269:C28–34. doi: 10.1152/ajpcell.1995.269.1.C28. [DOI] [PubMed] [Google Scholar]
- Coleman ME, Demayo F, Yin KC, Lee HM, Geske R, Montgomery C, Schwartz RJ. Myogenic vector expression of insulin-like growth factor I stimulates muscle cell differentiation and myofiber hypertrophy in transgenic mice. J Biol Chem. 1995;270:12109–12116. doi: 10.1074/jbc.270.20.12109. [DOI] [PubMed] [Google Scholar]
- Damiani E, Larsson L, Margareth A. Age-related abnormalities in regulation of the ryanodine receptor in rat fast-twitch muscle. Cell Calcium. 1996;19:15–27. doi: 10.1016/s0143-4160(96)90010-x. [DOI] [PubMed] [Google Scholar]
- Delbono O, Kotsias BA. Relation between action potential duration and mechanical activity on rat diaphragm fibers. Effects of 3, 4-diaminopyridine and tetraethylammonium. Pflugers Arch. 1987;410:394–400. doi: 10.1007/BF00586516. [DOI] [PubMed] [Google Scholar]
- Delbono O, O'Rourke KS, Ettinger WH. Excitation-calcium release uncoupling in aged single human skeletal muscle fibers. J Membr Biol. 1995;148:211–222. doi: 10.1007/BF00235039. [DOI] [PubMed] [Google Scholar]
- Delbono O, Renganathan M, Messi ML. Excitation-Ca2+ release-contraction coupling in single aged human skeletal muscle fiber. Muscle Nerve Suppl. 1997;5:S88–92. doi: 10.1002/(sici)1097-4598(1997)5+<88::aid-mus21>3.0.co;2-u. [DOI] [PubMed] [Google Scholar]
- Eddinger TJ, Cassens RG, Moss RL. Mechanical and histochemical characterization of skeletal muscles from senescent rats. Am J Physiol. 1986;251:C421–430. doi: 10.1152/ajpcell.1986.251.3.C421. [DOI] [PubMed] [Google Scholar]
- Fitts RH, Troup JP, Witzmann FA, Holloszy JO. The effect of ageing and exercise on skeletal muscle function. Mech Ageing Dev. 1984;27:161–172. doi: 10.1016/0047-6374(84)90041-1. [DOI] [PubMed] [Google Scholar]
- Florini JR, Ewton DZ, Coolican SA. Growth hormone and insulin growth factor system in myogenesis. Endocrinol Rev. 1996;17:481–517. doi: 10.1210/edrv-17-5-481. [DOI] [PubMed] [Google Scholar]
- Florini JR, Ewton DZ, Magri KA, Mangiacapra FJ. IGFs and muscle differentiation. Adv Exp Med Biol. 1993;343:319–326. doi: 10.1007/978-1-4615-2988-0_31. [DOI] [PubMed] [Google Scholar]
- Frontera WR, Suh D, Krivickas LS, Hughes VA, Goldstein R, Roubenoff R. Skeletal muscle fiber quality in older men and women. Am J Physiol Cell Physiol. 2000;279:C611–618. doi: 10.1152/ajpcell.2000.279.3.C611. [DOI] [PubMed] [Google Scholar]
- González E, Delbono O. Age-dependent fatigue in single intact fast- and slow-fibers from mouse EDL and soleus skeletal muscles. Mech Ageing Dev. 2001;122:1019–1032. doi: 10.1016/s0047-6374(01)00229-9. [DOI] [PubMed] [Google Scholar]
- González E, Messi ML, Delbono O. Contractile properties of single intact mouse extensor digitorum longus (EDL), flexor digitorum brevis (FDB). and soleus muscle fibers. J Membr Biol. 2000;178:175–183. doi: 10.1007/s002320010025. [DOI] [PubMed] [Google Scholar]
- Hurley BF. Age, gender, and muscular strength. J Gerontol Series A, Biol Sci Med Sci. 1995;50:41–44. doi: 10.1093/gerona/50a.special_issue.41. [DOI] [PubMed] [Google Scholar]
- Lannergren J, Westerblad H. The temperature dependence of isometric contractions of single, intact fibres dissected from a mouse foot muscle. J Physiol. 1987;390:285–293. doi: 10.1113/jphysiol.1987.sp016700. [DOI] [PMC free article] [PubMed] [Google Scholar]
- Larsson L, Ansved T, Edstrom L, Gorza L, Schiaffino S. Effects of age on physiological, immunohistochemical and biochemical properties of fast-twitch single motor units in the rat. J Physiol. 1991;443:257–275. doi: 10.1113/jphysiol.1991.sp018833. [DOI] [PMC free article] [PubMed] [Google Scholar]
- Larsson L, Li X, Frontera WR. Effects of aging on shortening velocity and myosin isoform composition in single human skeletal muscle cells. Am J Physiol. 1997;272:C638–649. doi: 10.1152/ajpcell.1997.272.2.C638. [DOI] [PubMed] [Google Scholar]
- Li X, Larsson L. Maximum shortening velocity and myosin isoforms in single muscle fibers from young and old rats. Am J Physiol. 1996;270:C352–360. doi: 10.1152/ajpcell.1996.270.1.C352. [DOI] [PubMed] [Google Scholar]
- Lowe DA, Thomas DD, Thompson LV. Force generation, but not myosin ATPase activity, declines with age in rat muscle fibers. Am J Physiol. 2002;283:C187–192. doi: 10.1152/ajpcell.00008.2002. [DOI] [PubMed] [Google Scholar]
- Melzer W, Herrmann-Frank A, Luttgau HC. The role of Ca2+ ions in excitation-contraction coupling of skeletal muscle fibres. Biochim Biophys Acta. 1995;1241:59–116. doi: 10.1016/0304-4157(94)00014-5. [DOI] [PubMed] [Google Scholar]
- Melzer W, Rios E, Schneider MF. A general procedure for determining the rate of calcium release from the sarcoplasmic reticulum in skeletal muscle fibers. Biophys J. 1987;51:849–863. doi: 10.1016/S0006-3495(87)83413-6. [DOI] [PMC free article] [PubMed] [Google Scholar]
- Musaro A, McCullagh KJA, Naya FJ, Olson EN, Rosenthal N. IGF-1 induces skeletal myocyte hypertrophy through calcineurin in association with GATA-2 and NF-ATc1. Nature. 1999;400:581–585. doi: 10.1038/23060. [DOI] [PubMed] [Google Scholar]
- Musaro A, McCullagh KJ, Paul A, Houghton L, Dobrowolny G, Molinaro M, Barton-davis ER, Sweeney HL, Rosenthal N. Localized IGF-1 transgene expression sustains hypertrophy and regeneration in senescent skeletal muscle. Nat Genet. 2001;27:195–200. doi: 10.1038/84839. [DOI] [PubMed] [Google Scholar]
- Owino W, Yang SY, Goldspink G. Age-related loss of skeletal muscle function and the inability to express the autocrine form of insulin-like growth factor-1 (MGF) in response to mechanical overload. FEBS Lett. 2001;505:259–263. doi: 10.1016/s0014-5793(01)02825-3. [DOI] [PubMed] [Google Scholar]
- Renganathan M, Messi ML, Delbono O. Dihydropyridine receptor-ryanodine receptor uncoupling in aged skeletal muscle. J Membr Biol. 1997a;157:247–253. doi: 10.1007/s002329900233. [DOI] [PubMed] [Google Scholar]
- Renganathan M, Messi ML, Delbono O. Overexpression of IGF-1 exclusively in skeletal muscle prevents age-related decline in the number of dihydropyridine receptors. J Biol Chem. 1998;273:28845–28851. doi: 10.1074/jbc.273.44.28845. [DOI] [PubMed] [Google Scholar]
- Renganathan M, Messi ML, Schwartz R, Delbono O. Overexpression of hIGF-1 exclusively in skeletal muscle increases the number of dihydropyridine receptors in adult transgenic mice. FEBS Lett. 1997b;417:13–16. doi: 10.1016/s0014-5793(97)01225-8. [DOI] [PubMed] [Google Scholar]
- Schneider MF, Chandler WK. Voltage dependent charge movement of skeletal muscle: a possible step in excitation-contraction coupling. Nature. 1973;242:244–246. doi: 10.1038/242244a0. [DOI] [PubMed] [Google Scholar]
- Schultz AB. Muscle function and mobility biomechanics in the elderly: an overview of some recent research. J Gerontol Series A, Biol Sci Med Sci. 1995;50:60–63. doi: 10.1093/gerona/50a.special_issue.60. [DOI] [PubMed] [Google Scholar]
- Semsarian C, Wu MJ, Ju YK, Marciniec T, Yeoh T, Allen DG, Harvey RP, Graham RM. Skeletal muscle hypertrophy is mediated by a Ca2+-dependent calcineurin signaling pathway. Nature. 1999;400:576–581. doi: 10.1038/23054. [DOI] [PubMed] [Google Scholar]
- Sonntag WE, Steger RW, Forman LJ, Meites J. Decreased pulsatile release of growth hormone in old male rats. Endocrinol. 1980;107:1875–1879. doi: 10.1210/endo-107-6-1875. [DOI] [PubMed] [Google Scholar]
- Thompson LV, Brown M. Age-related changes in contractile properties of single skeletal fibers from the soleus muscle. J Appl Physiol. 1999;86:881–886. doi: 10.1152/jappl.1999.86.3.881. [DOI] [PubMed] [Google Scholar]
- Tsien RW, Pozzan T. Measurement of cytosolic free Ca2+ with quin2: practical aspects. Methods Enzymol. 1989;172:230–262. doi: 10.1016/s0076-6879(89)72017-6. [DOI] [PubMed] [Google Scholar]
- Vandenburgh HH, Karlisch P, Shansky J, Feldstein R. Insulin and IGF-I induce pronounced hypertrophy of skeletal myofibers in tissue culture. Am J Physiol. 1991;260:C475–484. doi: 10.1152/ajpcell.1991.260.3.C475. [DOI] [PubMed] [Google Scholar]
- Wang Z-M, Messi ML, Delbono O. L-type Ca2+ channel charge movement and intracellular Ca2+ in skeletal muscle fibers from aging mice. Biophys J. 2000;78:1947–1954. doi: 10.1016/S0006-3495(00)76742-7. [DOI] [PMC free article] [PubMed] [Google Scholar]
- Wang Z-M, Messi ML, Delbono O. Sustained overexpression of IGF-1 prevents age-dependent decrease in charge movement and intracellular calcium in mouse skeletal muscle. Biophys J. 2002;82:1338–1344. doi: 10.1016/S0006-3495(02)75489-1. [DOI] [PMC free article] [PubMed] [Google Scholar]
- Wang Z-M, Messi ML, Renganathan M, Delbono O. Insulin-like growth factor-1 enhances rat skeletal muscle L-type Ca2+ channel function by activating gene expression. J Physiol. 1999a;516:331–341. doi: 10.1111/j.1469-7793.1999.0331v.x. [DOI] [PMC free article] [PubMed] [Google Scholar]
- Wang Z-M, Messi ML, Renganathan M, Delbono O. Patch-clamp recording of charge movement, Ca2+ current, and Ca2+ transients in adult skeletal muscle fibers. Biophys J. 1999b;77:2709–2716. doi: 10.1016/s0006-3495(99)77104-3. [DOI] [PMC free article] [PubMed] [Google Scholar]
- Westerblad H, Allen DG. Changes of myoplasmic calcium concentration during fatigue in single mouse muscle fibers. J Gen Physiol. 1991;98:615–635. doi: 10.1085/jgp.98.3.615. [DOI] [PMC free article] [PubMed] [Google Scholar]
- Zheng Z, Messi ML, Delbono O. Age-dependent IGF-1 regulation of gene transcription of Ca2+ channels in skeletal muscle. Mech Ageing Dev. 2001;122:373–384. doi: 10.1016/s0047-6374(00)00236-0. [DOI] [PubMed] [Google Scholar]
- Zheng Z, Wang Z-M, Delbono O. Charge movement and transcription regulation of L-type calcium channel alpha-1S in skeletal muscle cells. J Physiol. 2002;540:397–409. doi: 10.1113/jphysiol.2001.013464. [DOI] [PMC free article] [PubMed] [Google Scholar]