

Abstract
In order to estimate the magnitude of electrostatic exclusion provided by the fixed negative charges of the skin and muscle interstitia of rat in vivo we measured the distribution volumes of two differently charged albumin probes within these tissues. An implanted osmotic pump was used to reach and maintain a steady-state extracellular concentration of a mixture containing two iodine-labelled probes: a charged-modified human serum albumin, cHSA (i.e. a positive probe, isoelectirc point (pI) = 7.6) and a native human serum albumin, HSA (i.e. a normally charged, negative probe, pI = 5.0). Steady-state tissue concentrations were achieved after intravenous infusion of probes for 5–7 days. At the end of this period the animals were nephrectomized and a bolus of 51Cr-EDTA was administered for estimating the extracellular volume. Plasma volumes were measured as 5-min distribution volume of 125I-HSA in separate experiments. The steady-state interstitial fluid concentrations of all probes were determined using nylon wicks implanted postmortem. Calculations of labelled probes were made for interstitial fluid volumes (Vi), extravascular albumin distribution volumes (Vav,a) and relative interstitial excluded volume fractions (Vex,a/Vi). We found that the positive probe is excluded from a significantly smaller fraction of the interstitium. Specifically, the average relative albumin exclusion fractions obtained were: 16% and 26% in skeletal muscle and 30% and 40% in skin, for cHSA and HSA, respectively. On average, the fixed negative charges of the interstitium are responsible for about 40% of the total albumin exclusion in skeletal muscle and 25% in the whole skin tissue and thus, contribute significantly to volume exclusion in these tissues.
The interstitium is made up of the connective and supporting tissues of the body and is spatially located outside the vasculature, parenchymal cells and the lymphatic vessels (for review see e.g. Aukland & Reed, 1993). Although the composition and structure of the interstitium varies from tissue to tissue, there are basic characteristics and functions that are representative of interstitia of most tissues. Therefore, as a generalized description, the interstitium can be thought of as a three-dimensional ‘meshwork’ composed of a complex aggregation of protein fibres, glycoconjugates and carbohydrate polymers. It can be essentially divided into two phases: the interstitial fluid and the structural molecules of the interstitial matrix.
The presence of numerous interstitial macromolecules, particularly glycosaminoglycans (GAGs) and collagen-based species, creates a macromolecular crowding of the interstitial space. Consequently, the fluid space available for other species diffusing through the interstitial media is less than the total interstitial fluid volume, i.e. a given interstitial solute will distribute itself in the fluid space outside the meshwork or, alternatively through those spaces of the meshwork that have dimensions larger than that of the solute. This phenomenon of geometrical, or steric interstitial exclusion was first described by Ogston & Phelps (1961) and refers to the fact that two solid structures cannot occupy the same confined volume at the same time (for review, see also Bert & Pearce, 1984). The geometrical exclusion phenomenon is relevant only for species with high hydrodynamic sizes such as proteins and not for small molecules such as water, small ions and nutrients. In addition to the steric exclusion, due to the fact that GAGs are negatively charged at physiological pH values, electrostatic factors might also be involved in selectively excluding other negatively charged macromolecules transported through the interstitium.
The magnitude of the excluded volume has important consequences in the dynamics of transcapillary exchange. Due to exclusion, the effective protein concentration in the interstitium is much higher than the value that would be estimated if it were assumed that all the fluid in the interstitium was available. As stated by Aukland & Reed (1993), the physiological importance of the exclusion phenomenon is two-fold: a more rapid approach to a new steady-state after a change in transcapillary fluid flow and less transfer of interstitial protein to plasma for a given capillary hyperfiltration. Interstitial exclusion thereby influences plasma volume regulation.
Previous studies stressed the importance of steric exclusion and showed that albumin, an important determinant of plasma and interstitial colloid osmotic pressures, is excluded from a large fraction of most interstitia (Bert et al. 1982, 1986; Wiig et al. 1992). In a recent in vitro study, Wiig et al. (2003) quantified the contribution of negative charges to volume exclusion of albumin. In this latter study, involving fully swollen dermis, it was shown that, although collagen is responsible for a contribution of about 60 % of the total albumin exclusion, the negatively charged tissue GAGs bring about a remaining contribution of about 40 %.
In the present investigation we wanted to extend these former studies and to test the hypothesis that fixed negative interstitial charges also have a significant effect on albumin exclusion in euhydrated animals in vivo. To this end we applied the continuous infusion method as used in previous in vivo studies (Wiig et al. 1992), in conjunction with the wick technique to collect all the necessary data for calculating the macromolecular distribution of two differently charged albumin probes within the fluid-phase of the interstitium. In this experiment, in vivo we were able to demonstrate that the fixed negative charges present in the interstitium are responsible for a significant volume exclusion effect, thereby, confirming the recently documented in vitro data that showed that GAGs have a significant effect as electrostatic excluding agents (Wiig et al. 2003).
METHODS
The experiments were performed on anaesthetized female Wistar rats, 220–250 g, fed on a standard laboratory diet. The rats had free access to food and water prior to any experimental procedure. Anaesthesia was induced by intraperitoneal injection of a mixture of Hypnorm/Dormicum and pentobarbital as specified below. While under anaesthesia, the body temperature of these animals was maintained constant at 37 ± 1°C by using a heating lamp. All animal experiments were conducted in accordance to the regulation of the Norwegian State Commission and with pre-approval from the ethical committee of University of Bergen.
The present method used for determination of available and excluded volume is based on reaching steady-state tracer, or probe, concentrations in the extracellular compartment by aid of an implantable osmotic pump. This method, applicable to in vivo studies was originally described by Wiig et al. (1992), and therefore only a brief description is given here.
Preparation of charge modified albumin
In this study we used two differently charged human serum albumin (HSA) probes. Charge modified human serum albumin, cHSA, was prepared by a method slightly modified from that described by Hoare & Koshland (1967). The principle of this method is based on activation of carboxyl groups within a protein by 1-ethyl-3(3-dimethylaminopropyl carbodiimide) hydrochloride (EDC) and their subsequent amidation by ethylenediamine (free base), as described in detail elsewhere (Wiig et al. 2003). The procedure can be described briefly as follows. 150 mg human serum (HSA) was dissolved in 15 ml of 0.133 m glycine methyl ester (Sigma). The pH of the mixture was adjusted to 4.75 by adding either HCl or NaCl as needed. The ‘cationization’ was started by adding 5 ml 0.04 m EDC (Sigma) to the reaction mixture. The level of cationization depends on the reaction time; i.e. the protein becomes more positive as a function of reaction time. By stopping the reaction at defined reaction times it is possible to obtain proteins of variable charge. All reactions were conducted at 20°C while stirring continuously.
We aimed to achieve a neutral or slightly positive pH. In previous experiments, Wiig et al. (2003) observed that such a pH value could be obtained from a reaction time of 45 min. Thus, the reaction was stopped by removing aliquots at 45 min and adding an equal volume of 4 m Na-acetate buffer to the soluton. The pI of the HSA was then determined as described below. After the charge modification the albumin solutions were dialysed against distilled water for at least 24 h before radiolabelling.
The pI of these probes was determined by isoelectric focusing on a commercially available mini-gel system (CBS Scientific). The isoelectric focusing gels (Novex, pH = 3–10) were run for 1 h at 100 mV, 1 h at 200 mV and 0.5 h at 500 mV at constant temperature (18°C). The gels were fixed for 60 min in a solution of 12 g trichloracetic acid and 3.5 g sulfosalilicylic acid in 100 ml distilled water and then stained with Novex colloidal blue. The pH gradient profile was determined with marker proteins (Pharmacia Biotech Broad pI Calibration Kit, pI = 3.5–9.3). Native HSA had an average pI of 5.0 whereas the slightly positive albumin, cHSA, had an average pI of 7.6. We had verified by autoradiography whether the radioactive label had a charge distribution that corresponded to that observed from the isoelectric focusing gel.
Preparation of radioactive tracer
The native and charge-modified human serum albumin were labelled with 125I or 131I by Iodo-Gen. Briefly, 5 mg 1,3,4,6-tetrachloro-3α,6α-diphenylglycouril (Sigma-Aldrich Co., product number T0656) was dissolved in 5 ml chloroform and 0.1 ml of this solution was dispersed in a 1.8 ml Nunc vial (Nunc-Kamstrup, Roskilde, Denmark). A film of the virtually water insoluble Iodo-Gen was formed in the Nunc vial by allowing the chloroform to evaporate to dryness under nitrogen. Then 1.5 mg of albumin dissolved in 1 ml 0.05 m PBS solution, pH 7.5, containing 10 MBq 125I or 131I (Institute for Energy Technology, Kjeller, Norway) and 15 μl 0.01 m NaI was added, and the iodinating tube gently agitated for 10 min before the reaction was terminated by removing the albumin solution. Unincorporated iodine-isotope accounting for 5–10 % of the total radioactivity as estimated by trichloroacetic acid (TCA) precipitation, was removed by dialysing the tracer against 1 l of 0.9 % saline containing 0.02 % azide. The stock solution was stored in the dark at 4°C and dialysed for at least 24 h before use.
Osmotic pump implantation
In order to establish steady-state tracer concentrations in tissues, the labelled probes were infused for 5 or 7 days at a constant flow rate of 1 μl h−1 with an implantable Alzet osmotic pump (model 2001), as described in detail previously (Wiig et al. 1992). Briefly, the day before implantation, the pump, with a reservoir capacity of 200–220 μl, was filled with the mixture of the isotope solution and then connected with a PE-60 catheter and incubated overnight at 37°C in a beaker containing 0.02 % sodium azide in 0.9 % NaCl solution. The following morning, the rat was anaesthetized intraperitoneally with a 1:1 mixture of Hypnorm (fentanyl/fluanisone)/Dormicum (midazolam), 2.5 ml kg−1. The same syringe used for filling the osmotic pump was connected to a catheter PE-60 that was previously filled with 25 μl of the isotope mixture. A bolus of 25 μl solution was administered through the syringe into the left jugular vein, the syringe removed and the catheter was connected with the previously incubated pump. The pump was then inserted into the intercapular region and the incision was closed with wound clips. The rat was monitored until recovery under a heat lamp and then transferred to a cage. All rats recovered from anaesthesia within a couple of hours after pump implantation. They were allowed free access to food and water for the remaining duration of the experiment.
Two days after the animals recovered, we started a blood sampling procedure. Blood samples were obtained by scalpel incision from one of the lateral tail veins at 24 h intervals for the entire remaining duration of the experiment. Each sample was collected proximal to the preceding one, starting from the tip of the tail. A volume of about 60 μl of blood was collected in haematocrit tubes. A volume of 20 μl of plasma from each sample was transferred in 1 ml of saline for isotope counting.
Measurement of the distribution volumes
On the last day of the infusion (i.e. the 5th or 7th day of the experiment), the rat was anaesthetized intraperitoneally with sodium pentobarbital, 2 ml kg−1. The kidney pedicles were ligated via flank incisions. Through a PE-50 catheter inserted into the right jugular vein, 51Cr-EDTA was injected intravenously for measurements of extracellular volume. To reduce potential errors involved in spillover corrections between 131I and 51Cr, the dose of 51Cr was chosen to give a concentration in the extracellular fluid about equal to that of 131I (usually 0.5 MBq in a volume of ≈0.15 ml). The tracer was allowed to equilibrate for 2 h. A final blood volume of ≈1 ml was collected by cardiac puncture and the rat was then killed with saturated KCl.
In a separate series of experiments (n = 9), plasma volume was measured as the distribution volume of 125I-HSA to be entered as a correction factor in the equations used for calculation of available and excluded volumes (see Appendix for calculations). After anaesthesia, ≈ 0.2 MBq of this tracer solution was injected i.v. and allowed to equilibrate for 5 min. At the end of this period, a ≈0.5 ml blood sample was taken by cardiac puncture and the rat killed by injection of KCl intracardially. Tissue samples were taken for determination of radioactivity as described above.
Interstitial fluid collection
All procedures required for interstitial fluid collections were performed in a humidified incubator kept at room temperature and 100 % humidity. Samples of the interstitial fluid were collected by implanting dry nylon wicks for 20 min in the rat back and hinlimb skin as well as in the medial (gastrocnemius and semimebraneous) and lateral (tibialis anterior) hindlimb muscles, as described in detail elsewhere (Wiig et al. 1988, 1991). After implantation, the wicks were removed from the animal, their ends along with potential portions of the wick that were bloodstained were cut off. The representative wick samples were transferred in vials containing 1 ml of 0.02 % sodium azide-0.9 % saline solution mixture and then counted for radioactivity.
Tissue sampling
Following the collection of interstitial fluid, the animal was taken out from the incubator and its hair was removed from the back and hindlimbs. Samples obtained from tissues designated for sampling, i.e. hindlimb and back skin along with lateral and medial muscles, were placed in tared covered vials and weighed. The sampling was done from both the right and left side of the animal.
Radioactivity measurements
For each rat, the radioactivity was measured in plasma, tissue and wick samples collected as described previously. Samples were counted in a LKB gamma counter (Model 1282 Compugamma) using window settings of 530–690 keV for 51Cr, 700–860 keV for 131I and 120–320 keV for 125I. Standards were counted in every experiment and spillover as well as background and decay during the period of measurement were automatically corrected for.
Elution of isotope from tissues
We suspected that charge modification of HSA might result in non-specific tissue binding of this particular probe. It is important to differentiate between the proportion of tracer that is free in the interstitial fluid versus the proportion that remains bound to the tissue. To determine this fraction for each tracer, tissue samples were subjected to elution with a mixture containing 0.02 % sodium azide in 0.9 % saline solution as described in detail in a previous publication (Wiig & Tenstad, 2001). All individual tissues were first minced and counted to determine their radioactivity. An aliquot of 10 ml eluent was then added to each sample and the mixture was left in an agitator at room temperature for 24 h. After centrifugation, the supernatant was removed, a new aliquot of 10 ml saline-azide solution was supplemented and the agitation procedure repeated. After another 24 h of elution, the individual supernatant-free tissues were counted again and corrected for isotope decay. The fraction of tracer remaining in the tissue after elution represents non-specific binding, and such binding was corrected for in all calculations of distribution volumes.
Characterization of isotopes
Analyses were undertaken in order to establish whether the mixture of 125I and 131I tracers in pumps maintain their labels and/or if the two tracers were potentially incorporated in the animal's plasma amino acids. Thus, samples of final plasma from rats (i.e. plasma collected at the end of the experiment after the 5th or 7th day of infusion) were subjected to chromatographic separation in an HPLC column. For separation, we used a Superose 12 column (Pharmacia) with a separation range 1–300 kDa. The elution solution used was a 0.005 m phosphate buffer in 0.15 m NaCl, pH = 7.4. The successive collection fractions exiting the column were counted in the gamma-counter.
Calculations
All distribution volumes and thus, available and excluded volumes, for probes were calculated as described in previous publications (see e.g. Wiig et al. 1992). For completeness these equations are presented briefly in the accompanying Appendix along with a list of symbols.
Statistics
For each of the tissues sampled, the values from the left and right side of the rat were paired and averaged. The average data for rats (n = 9) were compared through a paired two-tailed Student's t test. Differences were accepted as statistically significant at P < 0.05. Combined data for each tissue are given as means ±s.e.m.
RESULTS
Establishment of steady-state levels of tracer-labelled albumins
All rats recovered from anaesthesia within 1–2 h after osmotic pump implantation. Figure 1 shows the average relative concentrations of the two labelled probes (i.e. slightly positive, cHSA and negative HSA) in plasma for the duration of infusion that lasted 5–7 days. The individual plasma values, taken each 24 h after the second day post-implantation, were normalized to the corresponding plasma value sampled in the last day of experimentation, i.e. the 5-th (n = 4) or 7-th day (n = 5). We observed that the relative plasma concentration of both probes tended to be lower than 1.0 up to 48 h after starting the infusion. Nonetheless, both probes reached and maintained an apparent steady state at 72 h post-implant and until ending the experiment. Furthermore, none of the relative concentrations between 72 and168 h differed significantly from 1.0.
Figure 1. Plasma concentration of tracer vs. duration of experiment.
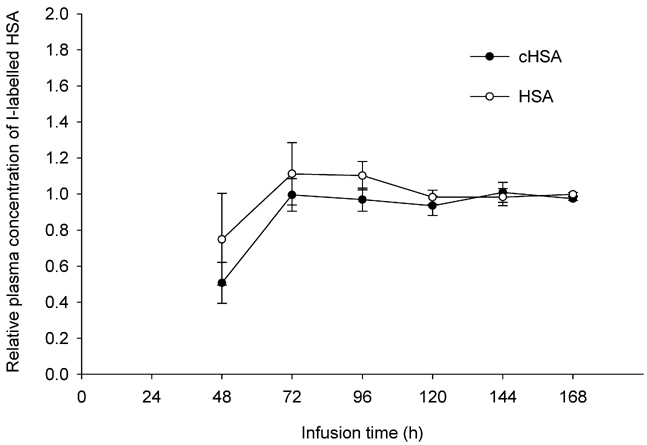
Relative plasma concentrations of cHSA (pI = 7.6, •) and HSA (pI = 5.0, ○). The duration of continuous infusion is t = 120 h (n = 4) and t = 168 h (n = 5). Values are given as means ±s.e.m.
To determine whether the tracer concentrations reached a steady state by the 5th day after starting the infusion, we harvested tissues at t = 120 h (n = 4) and t = 168 h (n = 5), i.e. the 5th and 7th days post-implant, and calculated the plasma equivalent tracer distribution volumes. Figure 2 presents the average tracer distribution values of the two differently charged probes, (HSA and cHSA), in the hindlimb and back skin together with the lateral and medial muscles. As presented in this figure, the distribution volumes for the positive probe (cHSA, pI = 7.6), expressed in (ml g−1), at t = 120 h and t = 168 h were: 0.08 and 0.07, 0.12 and 0.09, 0.44 and 0.42, 0.34 and 0.32, corresponding to lateral and medial muscle, hindlimb and back skin, respectively. The tissue distribution values of HSA (pI = 5.0), expressed in ml g−1, for lateral and medial muscle and, hindlimb and back skin at t = 120 h and t = 168 h were: 0.07 and 0.06, 0.10 and 0.08, 0.39 and 0.37, 0.29 and 0.26, respectively. As shown for both probes in this figure there is no significant difference between the distribution volumes for any particular tissue harvested on either the 5th day (n = 4) or the 7th (n = 5) day of continuous infusion (P < 0.05 for all comparisons). Thus, all the data collected at these times were pooled and used as such in all our calculations.
Figure 2. Distribution volumes related to time of tissue sampling.
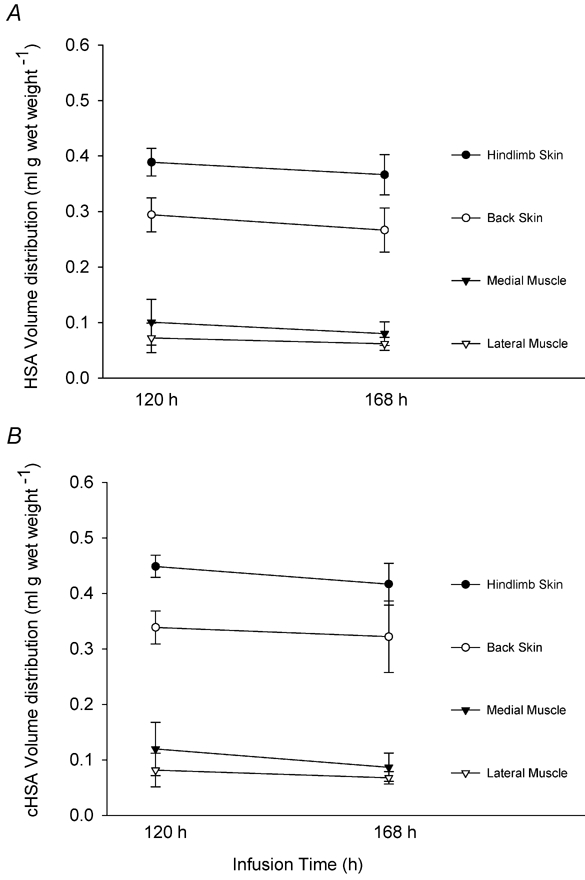
Distribution volumes of HSA (pI = 5.0) and cHSA (pI = 7.6) in skin and muscle tissues at the time of sampling, i.e. t = 120 h (n = 4) and t = 168 h (n = 5). Values are given as means ±s.e.m.
Tissue elution
All the tissue samples harvested from rats were eluted in order to assess the degree of binding of the three tracers, i.e. 51Cr, 131I and 125I labels. Table 1 presents data obtained after tissue elution. As shown here, on average about 97 % of the extracellular tracer, i.e. 51Cr-EDTA was eluted from all four tissues studied. The extraction fraction was not significantly different between muscle and skin tissues. HSA was extracted in a proportion of 95 % from muscle tissues and slightly less, 93 %, in skin tissues. We found however, that a certain degree of unspecified binding was associated with the charged-modified albumin cHSA. On average, 90 % of this probe was extracted from muscles while only 84 % and 81 % was extracted from hindlimb and back skin, respectively. The uneluted fractions were taken into account for corrections in all calculations of distribution volume (see Appendix for calculations). If the tracer binding to the tissue is not corrected for, all the calculated available interstitial distribution spaces would be overestimated with respect to the actual value.
Table 1.
Fraction extracted by elution
| Tissue | 51Cr- EDTA | Charge-modified albumin (cHSA) | Native albumin (HSA) |
|---|---|---|---|
| Lateral muscle | 0.971 ± 0.020 | 0.910 ± 0.019 | 0.953 ± 0.014 |
| Medial muscle | 0.962 ± 0.032 | 0.904 ± 0.031 | 0.951 ± 0.022 |
| Hindlimb skin | 0.984 ± 0.012 | 0.839 ± 0.039 | 0.940 ± 0.015 |
| Back skin | 0.965 ± 0.019 | 0.809 ± 0.041 | 0.938 ± 0.024 |
Values for charge-modified albumin (cHSA; pI = 7.6) and native albumin (HSA; pI = 5.0) are given as means ±s.e.m. The number of paired samples is n = 9.
Fluid distribution volumes
Table 2 presents the plasma, interstitial fluid and albumin distribution volumes in muscle and skin tissues for HSA and cHSA. Local plasma volumes were obtained in a separate series of experiments.
Table 2.
Albumin distribution volumes
| Tissue | Vp | Vi | Vav,a, HSA | Vav,a, cHSA |
|---|---|---|---|---|
| Lateral muscle | 0.0059 ± 0.0009 | 0.089 ± 0.007 | 0.066 ± 0.0 15 | 0.074 ± 0.017 |
| Medial muscle | 0.0059 ± 0.0014 | 0.124 ± 0.024 | 0.086 ± 0.024 | 0.100 ± 0.031 |
| Hindlimb skin | 0.0065 ± 0.0014 | 0.598 ± 0.040 | 0.376 ± 0.021 | 0.430 ± 0.025 |
| Back skin | 0.0052 ± 0.0014 | 0.482 ± 0.028 | 0.278 ± 0.024 | 0.329 ± 0.033 |
The values for charge-modified albumin (cHSA) and native albumin (HSA) are given as means ±s.e.m and are expressed in (ml (g wet weight)−1). The number of paired sample is n = 9. All data has been corrected for non-elutable fraction.
The fractional excluded interstitial volumes for HSA and cHSA are presented in Fig. 3. The average value of (Vex/Vi) corresponding to the negative probe, i.e. HSA are: 24.8 %, 27.3 %, 36.9 % and 42.2 % for medial and lateral muscle and hindlimb and back skin, respectively. The average values for either of the two sets of muscle and skin tissues are not significantly different (P > 0.05 for each pair). The corresponding exclusion values obtained for the modified, positive, cHSA are significantly lower for all tissues studied (P < 0.01 for medial and lateral muscle and hindlimb skin and P < 0.05 for back skin). As presented in Fig. 3 these values averaged 16.1 %, 15.7 %, 27.7 % and 32.6 % for medial and lateral muscle as well as hindlimb and back skin. The average values for the two types of muscle or skin tissues are not significantly different (P > 0.05).
Figure 3. Fractional excluded interstitial volumes.
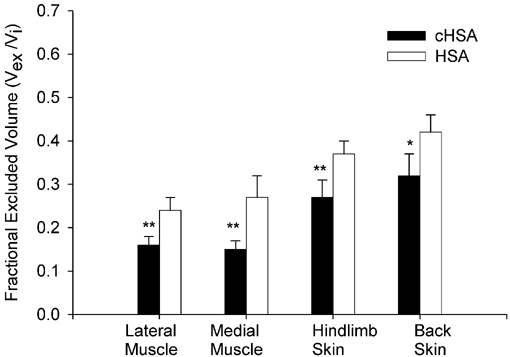
Fractional excluded interstitial volumes of cHSA and HSA. The number of rats is n = 9. Values are given as means ±s.e.m.*P < 0.05 and **P < 0.01 compared to the corresponding tissue involving uptake of albumin.
Characterization of tracers
Stock solutions and plasma finals after 120 h and 168 h of tracer infusion were applied to a Superose 12 column (Pharmacia). Figure 4 shows the HPLC effluent pattern for HSA and cHSA of plasma at 168 h of infusion. As determined by size exclusion chromatography, charge modification of HSA to our targeted pI did not affect the effective hydrodynamic size of the probe. During tracer equilibration, only small amounts of dimer accumulated for both tracers. The amount of dimer was similar for HSA and cHSA and was always less than 10 %. As shown in this figure the 125I and 131I tracers eluted in the same volumes with no significant occurrence of tracer degradation products. The final plasma samples collected were also analysed for free iodine, using a gel filtration column (Bio-Gel P-10). In all the samples the amount of free 125I and 131I was less than 1 %, therefore there was no indication that the free isotope content would increase with infusion time.
Figure 4. HPLC of final plasma after 168 h of tracer infusion.
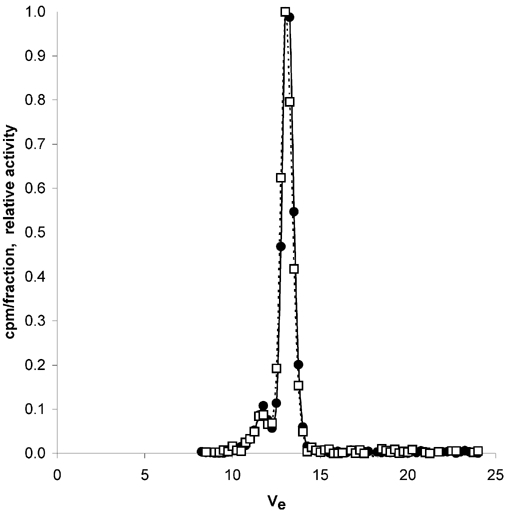
Radioactivity of cHSA (•) and HSA (□) in successive collections of excluded volume fractions Ve (ml) from a Superose 12 size exclusion column after applications of plasma final samples collected at t = 168 h of continuous infusion. The optimal separation range of the column is 1–300 kDa.
DISCUSSION
In a previous investigation by Wiig & Tenstad (2001) it was determined that, the exclusion volume of the negatively charged IgG4 (pI = 6.6) is almost twice that of the positively charged IgG1 (pI = 8.7). Furthermore, in a recent in vitro study, Wiig et al. (2003) were able to titrate the pI of albumin and could thereby study a graded effect of interstitial charge on exclusion. This latter study documented that, in fully swollen dermis, almost 40 % of the total albumin exclusion can be accounted for by the presence of negatively charged GAGs. These two studies are precursors of the present work, where we hypothesized that fixed interstitial negative charges have a significant contribution to excluding albumin from tissues of otherwise normally hydrated animals. In this study we used a charged modified albumin probe, cHSA with no net negative charge, and as such, not involved in electrostatic interaction with the polyanionic interstitial matrix constituents. By comparing directly its distribution volumes in selected tissues to the corresponding values of a normally charged HSA we were able to approximate the steric and electrostatic components of the total volume exclusion, and found that the excluded volume of cHSA in rat skeletal muscle and skin is about 40 % and 25 %, respectively, lower than the corresponding values for HSA.
In a study involving skin and muscle tissues in rabbits, Gandhi & Bell (1992) investigated in detail the transvascular transport of charge-modified albumin. On the other hand, to our knowledge, the effect of modifying the net electrical charge of albumin on the extravascular distribution of this species in vivo has been addressed only briefly before. Specifically, in an abstract, Bell (1985) presented that the interstitial exclusion volume of charge-modified albumin is lower than the corresponding one for native albumin. The present study is therefore the first thorough documentation of the electrostatic exclusion of albumin in vivo.
Methodological considerations
The experimental method employed here has been presented and evaluated in several series of experiments that established the volume distributions of rat serum albumin (RSA) and IgG (Wiig et al. 1992, 1994; Wiig & Tenstad, 2001). These publications discuss in detail the method and its important steps along with the potential sources of errors. In what follows, therefore, only some key points that are relevant to the present study will be mentioned.
Our accurate estimation of albumin distribution volume depends on a series of requirements that have to be satisfied and can be summarized as follows: the labelled albumin has to reach and maintain a steady-state distribution within tissues; the estimates of exclusion volumes have to account for the probe present only in the fluid-phase of the interstitium; the labelled macromolecule has to retain its label for the entire duration of infusion; the method of sampling interstitial fluid has to be reliable.
Achievement of steady state prior to tissue and fluid analysis is an important requirement in this study. As presented in Fig. 1, a 72 h infusion time, proved to be a duration sufficient for the establishment of a steady-state plasma tracer concentration for both probes. Nonetheless, to ensure that both tracers reached a steady state in the interstitium at the time of tissue sampling, we allowed for a longer tracer equilibration period, i.e. 5–7 days. As showed by Fig. 2, cHSA and HSA distribution volumes at t = 120 h and t = 168 h are not statistically different, suggesting no further uptake occurred during this point and that a steady state was achieved.
One concern in these experiments regarded the potential of non-specific tissue binding of the two macromolecular probes. As presented in Table 1, about 93–95 % of HSA (pI = 5.0) was eluted from the rat muscle and skin tissues. These results are similar to the ones reported for RSA by Wiig et al. (1992), a proof that the heterologous HSA protein does not have a higher tendency to bind to the tissue. cHSA (pI = 7.6), however, presented a slightly higher degree of non-specific binding. About 90 % of this probe was eluted from medial and lateral hindlimb rat muscles and slightly less, i.e. about 81 % and 84 % from hindlimb and back skin, respectively. In these experiments we experienced a lower degree of binding than reported in previous in vivo studies involving IgG (Wiig & Tenstad, 2001) or, the more recent in vitro study involving HSA (Wiig et al., 2003). Nevertheless, in agreement with these two previous reports we also observed that cHSA exhibits a higher degree of binding within tissues as opposed to the unmodified HSA, and furthermore that the degree of binding appears to be directly correlated with the increase in the pI of the probe.
Another problem that may arise when using long equilibration times is related to probe alteration and degradation during the infusion period. The low amount of free iodine (< 1 %) and the lack of significant probe degradation products (see Fig. 4) suggest that these problems were negligible. The stock solution of HSA was dimer-free, whereas cationization of HSA led to less than 5 % dimer formation in the stock solution. After circulation in the animal for 7 days, the amount of dimer increased up to a maximum of 10 % of total albumin amount for both tracers (see Fig. 4). Theoretically, the formation of dimers would lead to a slight underestimation of the absolute extravascular distribution volume. However, since the percentage of dimer is similar for both species, the effect of dimerization on the relative distribution of the probes will be negligible.
In this study we used heterologous HSA and not homologous rat serum albumin. Our choice was based on our experience that HSA is more stable and has a lower tendency to form dimers; these properties are important in experiments involving chemical modification of albumin. One potential problem with infusing this probe could have been related to the possibility of antibody development in response to heterologous HSA infusion. The immunological response is dependent on the amount of antigen infused and its persistence in the animal body (Modabber & Sercarz, 1970). Our experiments involved infusion of trace amounts of HSA and the duration of our experiments was relatively short, therefore the immunological responses might not play a dominant role in these experiments. As far as the HSA probe is concerned, it should be noted that this probe was eluted from tissues in the same proportion as RSA and furthermore, as will be discussed shortly, its distribution volume in rat tissue is very similar to that of RSA. Therefore, since there were negligible probe degradation products and no free iodine accumulated we conclude that use of heterologous albumin allowed for an accurate determination of the interstitial distribution volumes.
Interstitial fluid was sampled by post-mortem implantation of nylon wicks within selected tissues of rats. The wick method was evaluated and described in detail in experimental studies involving tissues such as skin (Aukland & Fadnes, 1973; Wiig et al. 1988) and muscle (Wiig et al. 1991). As shown in these earlier reports, samples obtained by implantable wicks are representative of the interstitial fluid. Furthermore, studies in rabbits have shown that the colloid osmotic pressure of wick fluid and lymph is similar under steady-state conditions (Fadnes, 1981), the latter being a more commonly used reference for interstitial fluid. Our protocol of sampling interstitial volumes was identical with the one documented in these studies, including the period of 20 min wick implantation; the duration was determined to be sufficient for interstitial fluid equilibration. Evaporation of wick fluid may be a potential problem that was controlled for by wick handling at 100 % relative humidity. Furthermore, it should be noted that available and excluded volumes of albumin are calculated as ratios of Vi, thereby cancelling out the volume of wick fluid from the equation (eqn (5)). Our evaluation of tracer distribution volumes is thus based on relative counts only and with gamma-emitting tracers of the entire tissue samples and wicks. Potential errors involved in evaporative losses and measurement of very small weights or volumes are thereby eliminated (Wiig et al. 1992).
Distribution volumes
Exclusion in rat muscle tissues
We determined that the charge-modified cHSA has a lower exclusion volume than the negative charge-bearing HSA. The average volume exclusion fraction for cHSA was 16 %. By comparison, the exclusion values for HSA were much higher, of the order of 25–27 % for lateral and medial muscle, respectively. The averages between the lateral and medial muscles showed no statistical difference, for either of the two probes infused.
There are no independent data that allow us to compare the exclusion volume for the positive probe in rat muscles. However, values for HSA parallel closely those reported in an earlier study by Wiig et al. (1992) for RSA, i.e. in the range of 24–29 % exclusion volumes. This finding suggests that there is no significant difference between the fractional distribution volume of the two types of probes, i.e. HSA and RSA.
Our modified probe, cHSA, does not bear a net negative charge, therefore, there is no electrostatic repulsion between this probe and the fixed negative charges within the interstitium. It can be assumed therefore, that the interstitial exclusion of cHSA is of steric nature. The difference in fractional exclusion between HSA and cHSA provides an indication of the relative importance of the geometrical vs. electrical factors in excluding macromolecules from their immediate environment. Of the total, 26 % exclusion fraction of HSA, about 16 % can be accounted by steric factors (i.e. the exclusion of uncharged cHSA) while the remaining 10 % results from electrostatic repulsions. Thus, it is reasonable to conclude that in normally hydrated muscle tissue, even though collagen is the main steric excluding agent, interstitial polyanions are also responsible for significant electrostatic repulsions. Based on our results, the contributions of steric and electrostatic exclusion are 60 and 40 %, respectively.
Exclusion in rat skin tissues
Similar to muscles, the results obtained for skin tissue indicate a much higher distribution volume of the positive probe. For hindlimb skin the exclusion volumes determined were 28 % and 37 %, for cHSA and HSA, respectively. The present exclusion value for HSA compares reasonably well to that of 41 % reported previously by Wiig et al. (1992) when estimating native RSA distribution.
The result for rat back skin appears to be somewhat higher than, but not statistically different from (P > 0.05), the corresponding ones for hindlimb skin for either cHSA or, HSA. The albumin exclusion volume in this tissue was 33 % for cHSA and 42 % for the HSA. The corresponding value for native RSA reported by Wiig et al. (1992) was 30 %. This is the only tissue where the present results differ from those documented earlier by Wiig et al. (1992). For the same tissue Reed et al. (1989) reported an exclusion of 45 %, a value comparable to what we have determined here. One possible reason for our results corroborating the latter report might be due to the fact that we used the same type of animals as in the study of Reed et al. (i.e. Wistar female rats with an average weight of 230 g). It is however difficult to estimate whether the interstitial matrix organization in back skin of the rat is so much different in animals of different gender and weights.
The relative contributions of steric vs. electrostatic volume exclusions can be determined by following the same analysis as for the muscle tissues. The average exclusion value for the negative HSA was 40 %. If we assume that the average exclusion value of 30 %, corresponding to cHSA, is of steric nature only, a remaining exclusion fraction of 10 % can be estimated to be due to the presence of negative charges. Thus, based on our results in rat skin, the negative charges of the interstitium account for 25 % of total albumin exclusion.
In order to better estimate the significance of volume exclusion, we compiled in Fig. 5 data from in vivo experiments involving HSA and IgG (Wiig & Tenstad, 2001). Thus Fig. 5 presents the exclusion effect of macromolecular charge and hydrodynamic radius for HSA (molecular mass = 69 kDa and Stokes-Einstein radius = 3.5 nm) and IgG (molecular mass = 160 kDa and Stokes-Einstein radius = 5.6 nm).
Figure 5. Fractional excluded interstitial volumes of differently charged HSA and IgG.
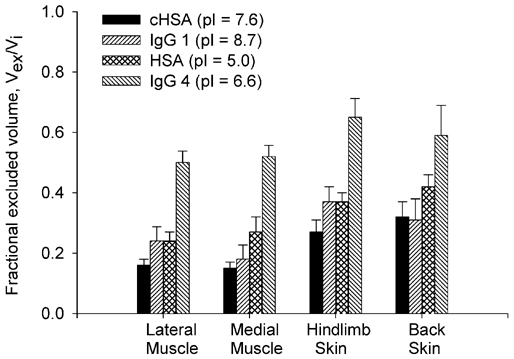
Comparison between fractional exclusions of charged-modified cHSA (pI = 7.6), negative HSA (pI = 5.0) with positive IgG1 (pI = 8.7) and negative IgG4 (pI = 6.6). The number of rats is n = 9. Values are given as means ±s.e.m.
As presented in this figure, the significant effect electrical charge has on interstitial exclusion is demonstrated for both types of probes. From the comparison between the positive IgG1 (pI = 8.7) with the negative IgG4 (pI = 6.6) it can be seen that on average, the negative probe is excluded from a volume about 60 % higher than that of the positive probe. Corroborating this trend, on average HSA (pI = 5.0) is excluded from a volume approximately 30 % higher than the charge-modified, cHSA (pI = 7.6).
The comparison between the slightly positively charged cHSA (pI = 7.6) and IgG1 (pI = 8.7) on the other hand, is more difficult to explain. As shown in Fig. 5, the exclusion volumes for the two macromolecules are quite similar; that is to say IgG, with a molecular mass more than twice that of HSA, is excluded from the same volume. Drawing any conclusion from the comparison of these two positive probes based on molecular mass is however, misleading. Steric exclusion comparisons between two positively charged probes should be thought of in terms of the effective hydrodynamic radii – radii that could be totally different from the ones calculated for probes that bear their normal charge at normal tissue pH. It is known that the smaller the molecular mass of a positive ion, the larger the hydration shell arround it i.e. the higher the Stokes-Einstein radii (see e.g. Rieger, 1987; Bockris & Reddy, 1998). It is possible that the smaller, positive, cHSA, has a relatively high hydration shell, therefore its effective hydrodynamic radius approaches that of IgG. For the purpose of our study it was useful to modify the albumin charge and compare it to the same probe that bears negative charges, in order to obtain an approximate estimate for the electrostatic exclusion. If nothing else, our ‘apparent’ steric exclusions of the positive probe are perhaps slightly overestimated, which would lead to the fact that the electrostatic exclusion contribution might actually be even larger than presented in this study.
The relevant case, where the effect of increased macromolecular size can be analysed, refers to the comparison between the negatively charge human HSA (pI = 5.0) and IgG4 (pI = 6.6). As presented in Fig. 5, the fractional exclusion of HSA is about half that of IgG. One of the reasons we can differentiate between the two negative probes is the fact that in the case of negative species, the hydration sheath arround them is weakly bound, and as a result they are loosing their hydration shells when involved in electrostatic interactions (see e.g. Rieger, 1987; Bockris & Reddy, 1998).
Conclusions
In this in vivo study in rats we determined that when albumin is made more positive its exclusion volume is significantly lower compared to that of a probe that bears its normal net negative charge of about −17. We were able to estimate here the magnitude of electrostatic interactions between the fixed negative charges present in the interstitial matrix and the exclusion of albumin from the fluid phase of the interstitium. Thus, in line with recent studies in vitro done in this group, in vivo measurements of volume distributions in normally hydrated tissues indicate that, on average, GAG's contribution to albumin exclusion from skeletal muscle and skin interstitia is in the range of 25–40 %; a contribution much higher than previously believed but in agreement with present in vitro data of Wiig et al. (2003).
Acknowledgments
This work was supported by The Research Council of Norway and Locus on Circulatory Research. Christina Gyenge is an NSERC postdoctoral fellow. The technical assistance provided by Odd Kolmannskog, Wibeke Skytterholm and Gerd Salversen is greatly appreciated.
APPENDIX
List of symbols
Vav,a (ml (g wet weight of tissue)−1): available volume
Vex,a (ml (g wet weight of tissue)−1): excluded volume
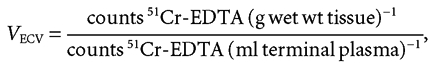
VECV (ml (g wet weight of tissue)−1): extracellular volume
Vi (ml (g wet weight of tissue)−1): interstitial volume
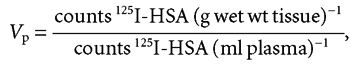
Vp (ml (g wet weight of tissue)−1): plasma intravascular volume
125I-and 131I: labels for modified albumin cHSA (pI = 7.6) or normally charged albumin (pI = 5.0)
Equations used to calculate distribution and excluded volumes
The vascular and extracellular volumes, Vp and VECV, respectively, were determined as the 5 and 120 min plasma equivalent space of 125I-HSA and 51Cr-EDTA, respectively, and Vi as the difference between these two volumes.
 |
(A1) |
 |
(A2) |
| (3) |
The extravascular albumin interstitial distribution volume Vav,a can be determined as:
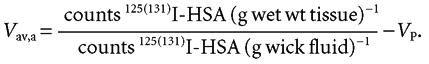 |
(4) |
Equation (4) assumes that the tracer activity in the available interstitial volume and the activity measured in wick fluid are equal.
A re-arrangement of eqn (4) such that, to eliminate potential errors related to wick fluid volume, measurements lead to the following equation expressing the fractional available volume for albumin:
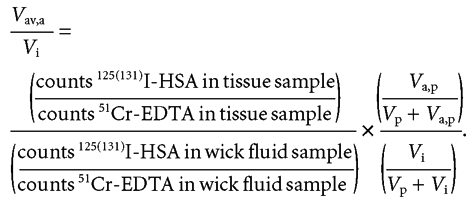 |
(5) |
Considering that, the interstitial fluid volume is given by the sum between the excluded and the available interstitial fluid volume, the albumin excluded volume Vex, a can be written as:
| (6a) |
or, alternatively expressed as a fractional excluded volume for either types of albumin:
 |
(6b) |
REFERENCES
- Aukland K, Fadnes HO. Protein concentration of interstitial fluid collected from rat skin by wick method. Acta Physiol Scand. 1973;88:350–358. doi: 10.1111/j.1748-1716.1973.tb05459.x. [DOI] [PubMed] [Google Scholar]
- Aukland K, Reed RK. Interstitial-lymphatic mechanisms in the control of extracellular volume. Physiol Rev. 1993;73:1–78. doi: 10.1152/physrev.1993.73.1.1. [DOI] [PubMed] [Google Scholar]
- Bell DR. Extravascular transport and distribution of charge-modified albumin in skin (Abstract) Microvasc Res. 1985;29:207. [Google Scholar]
- Bert JL, Mathieson JM, Pearce RH. The exclusion of human serum albumin by dermal collagenous fibers and within human dermis. Biochem J. 1982;201:395–403. doi: 10.1042/bj2010395. [DOI] [PMC free article] [PubMed] [Google Scholar]
- Bert JL, Pearce RH. Handbook of Physiology. The Cardiovascular System. Microcirculation. IV. Bethesda, MD: Blackwell Science Inc; 1984. The interstitium and microvascular exchange; pp. 521–547. Section 2, Part 1, Chapter 12, pp. [Google Scholar]
- Bert JL, Pearce RH, Mathieson JM. Concentration of plasma albumin in its accessible space in postmortem human dermis. Microvasc Res. 1986;32:211–223. doi: 10.1016/0026-2862(86)90055-5. [DOI] [PubMed] [Google Scholar]
- Bockris JO'M, Reddy AKN. Modern Electrochemistry 1, Ionics. 2. New York: Blackwell Science Inc; 1998. Ion-solvent interactions; pp. 225–347. [Google Scholar]
- Fadnes HO. Colloid osmotic pressure in interstitial fluid and lymph from rabbit subcutaneous tissue. Microvasc Res. 1981;21:390–392. doi: 10.1016/0026-2862(81)90022-4. [DOI] [PubMed] [Google Scholar]
- Gandhi RR, Bell DR. Importance of charge on transvascular albumin transport in skin and skeletal muscle. Am J Physiol. 1992;262:H999–1008. doi: 10.1152/ajpheart.1992.262.4.H999. [DOI] [PubMed] [Google Scholar]
- Hoare DG, Koshland DE. A method for the quantitative modification and estimation of carboxylic acid groups in proteins. J Biol Chem. 1967;242:2447–2453. [PubMed] [Google Scholar]
- Mathieson JM, Pearce RH, Bert JL. Size of a plasma protein affects its content in postpostmortem human dermis. Microvasc Res. 1986;32:224–229. doi: 10.1016/0026-2862(86)90056-7. [DOI] [PubMed] [Google Scholar]
- Modabber F, Sercarz E. Antigen binding and the immune response. I. The early primary response to a protein antigen. J Immunol. 1970;105:355–361. [PubMed] [Google Scholar]
- Ogston AG, Phelps CF. The partition of solutes between buffer solutions containing hyaluronic acid. Biochem J. 1961;78:827–833. doi: 10.1042/bj0780827. [DOI] [PMC free article] [PubMed] [Google Scholar]
- Reed RK, Lepsøe S, Wiig H. Interstitial exclusion of albumin in rat dermis and subcutis in over- and dehydration. Am J Physiol. 1989;257:H1819–1827. doi: 10.1152/ajpheart.1989.257.6.H1819. [DOI] [PubMed] [Google Scholar]
- Rieger P. Electrochemistry. Englewood Cliffs, NJ, USA: Blackwell Science Inc; 1987. Electrolytic conductance; pp. 142–145. [Google Scholar]
- Wiig H, DeCarlo M, Sibley L, Renkin EM. Interstitial exclusion of albumin in rat tissues measured by a continuous infusion method. Am J Physiol. 1992;263:H1222–1233. doi: 10.1152/ajpheart.1992.263.4.H1222. [DOI] [PubMed] [Google Scholar]
- Wiig H, Heir S, Aukland K. Colloid osmotic pressure of interstitial fluid in rat subcutis and skeletal muscle: comparison of various wick sampling techniques. Acta Physiol Scand. 1988;133:167–175. doi: 10.1111/j.1748-1716.1988.tb08396.x. [DOI] [PubMed] [Google Scholar]
- Wiig H, Kaysen GA, Al-Bander HA, DeCarlo M, Sibley L, Renkin EM. Interstitial exclusion of IgG in rat tissues estimated by continuous infusion. Am J Physiol. 1994;266:H212–219. doi: 10.1152/ajpheart.1994.266.1.H212. [DOI] [PubMed] [Google Scholar]
- Wiig H, Kolmannskog O, Tenstad O, Bert JL. Effect of charge on interstitial distribution of albumin in rat dermis in vitro. J Physiol. 2003;550:505–514. doi: 10.1113/jphysiol.2003.042713. [DOI] [PMC free article] [PubMed] [Google Scholar]
- Wiig H, Sibley L, DeCarlo M, Renkin EM. Sampling interstitial fluid from rat skeletal muscles by intermuscular wicks. Am J Physiol. 1991;261:H155–165. doi: 10.1152/ajpheart.1991.261.1.H155. [DOI] [PubMed] [Google Scholar]
- Wiig H, Tenstad O. Interstitial exclusion of positively and negatively charged IgG in rat skin and muscle. Am J Physiol. 2001;280:H1505–1512. doi: 10.1152/ajpheart.2001.280.4.H1505. [DOI] [PubMed] [Google Scholar]