Abstract
Previous investigations have reported linkage disequilibrium occurring between nearby polymorphisms, a block-like structure for such relationships, some instances where surprisingly few haplotypes are found and regions of extended homozygosity which are especially marked around centromeres and which are especially common on the X chromosome. We investigated the distribution and nature of regions of extended homozygosity in a sample of 1411 subjects included in a genome wide association study. Regions of extended homozygosity over 1Mb are common, with an average of 35.9 occurring per subject, and containing on average 73 homozygous markers. They have a markedly non-random distribution. They are relatively common on the X chromosome and are seen at centromeres but are also concentrated at other chromosomal regions where presumably recombination is rare. They seem to be a consequence of some haplotypes being very common in the population and although sometimes this reflects the effect of a very common haplotype we also note that there are examples of two or three common haplotypes, each very different from each other, underlying this effect. Regions of extended homozygosity are commoner than previously appreciated. They result from the presence of extended haplotypes with high population frequency. Such regions concentrate in particular locations. The haplotypes involved are sometimes markedly disparate from each other. These regions offer a valuable opportunity for further investigation, in particular with regard to their ancestral history.
Keywords: Homozygosity, extended haplotypes
Introduction
Previous investigations have examined linkage disequilibrium (LD) relationships between the polymorphisms which exist within the human genome. The HapMap Consortium produced a report on the haplotype structure of the human genome and LD relationships between polymorphisms genotyped in 269 subjects from four different geographic regions (The HapMap Consortium 2005). Probable haplotypes were assigned using the PHASE program, taking advantage of transmission information for the 180 subjects contained in trios. They noted that this procedure for the statistical reconstruction of haplotypes was remarkably accurate. A number of findings of interest were noted. In particular, in some instances there was surprisingly little diversity of haplotypes. For example, in a region of 36 contiguous SNPs with no obligate recombinants they reported only seven haplotypes being present among 120 CEU parental chromosomes. This finding was attributed to shared ancestry. Pair-wise measures of LD between SNPs were reported to occur in a block-like structure so that within blocks most SNPs would show high levels of LD with each other. This was illustrated with figures showing blocks ranging up to 100–200 kb in size. Some regions were reported to demonstrate long haplotypes of more than 500 SNPs extending over 1 or 2 cM which were found in at least 1% of subjects. At centromeres, haplotypes consisting of over 100 SNPs spanned several megabases and multiple regions with extensive haplotypes were found on the X chromosome although rarely on other chromosomes. It should be noted that 180 of the subjects in the HapMap sample were in trios and that subjects were recruited from four different geographic regions. This meant that there were only between 44 and 60 genetically independent subjects per geographic region.
More recent reports have highlighted the fact that subjects from outbred populations have perhaps surprisingly large regions of extended homozygosity. One of these studies was carried out using the 209 unrelated HapMap subjects (Gibson et al. 2006) and the other used 276 controls recruited for an association study of Parkinson's disease (Simon-Sanchez et al. 2007) and reported that such regions were found in areas of low recombination. These regions of extended homozygosity did not appear to be due to deletions. An earlier study with less densely spaced markers carried out in pedigrees (Broman & Weber 1999) had also found evidence for such regions and concluded that, since they did not violate Mendelian transmission, they were due to autozygosity. This meant that a single ancestral haplotype was inherited via both parents, rather than the loss of heterozygosity being due to chromosomal abnormalities such as uniparental isodisomy. A more recent study confirmed this finding using finely spaced SNPs and found no excess of apparent transmission errors in the regions of extended homozygosity (Curtis 2007).
We report here on results from 1411 subjects typed for 312,316 markers which were studied for regions of extended homozygosity to investigate the distribution of such regions and also the nature of the haplotypes which were involved.
Materials and Methods
The dataset consisted of 1411 subjects comprising brain donors from America and the Netherlands and living subjects obtained from the Mayo clinic who had been genotyped for 312,316 markers in the context of a GWA of late onset Alzheimer's diseases (Reiman et al. 2007). The dataset was downloaded from the Translational Genomics Research Institute website (http://www.tgen.org/neurogenomics/data).
Software was written to systematically identify regions of extended homozygosity which were defined as containing a minimum number of contiguous, genotyped homozygous SNPs and as extending over a minimum physical distance. For SNPs on the X chromosome, only female subjects were studied. A variety of criteria were chosen and for the present study we present the results for such regions defined by at least 10 homozygous SNPs stretching over at least 1 Mb. By contrast with the HapMap study subjects (Gibson et al. 2006), we did not include a criterion specifying a minimum marker density. For all subjects, any regions identified were graphed against chromosomal position. This highlighted an extremely non-random distribution for such regions.
Chromosomal locations in which such regions occurred commonly were subjected to further investigation. We identified markers which were included in a region of extended homozygosity in a certain proportion of subjects and for present purposes chose a threshold for this proportion of 0.3. For each location of interest this meant that there was a group of markers in which regions of extended homozygosity overlapped to occur in hundreds of different subjects. We selected a marker from within this group as being the one with maximal overlap, i.e. as being the one which occurred within a region of extended homozygosity in the most subjects. We then selected this marker and five on either side to investigate what 11-marker haplotypes were present and in what frequencies using the SNPHAP program (http://www.gene.cimr.cam.ac.uk/clayton/software/). In order to test whether or not more subjects were homozygous than would be expected by chance given the haplotype frequencies, we used the most probable haplotype assignments for each subject and treated these as if they were actual phased haplotypes (in almost all cases haplotypes were assigned with high probability). We then considered the 10 commonest haplotypes and “the rest” and calculated the expected number of subjects to have each haplotype combination based on the estimated haplotype frequencies. We totalled up the expected number of subjects to be homozygous for any haplotype and the expected number to be heterozygous and we then compared total expected numbers of homozygotes and heterozygotes with the numbers of subjects actually classed as homozygous or heterozygous based on the probable assignments. We used a chi-squared test with 1 df to compare these expected and observed counts at each location.
Results
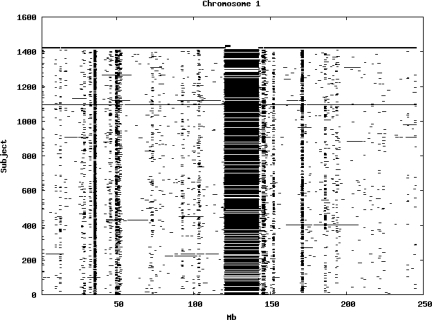
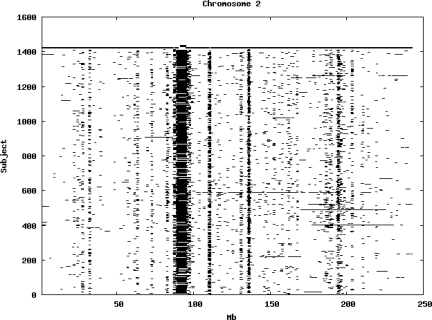
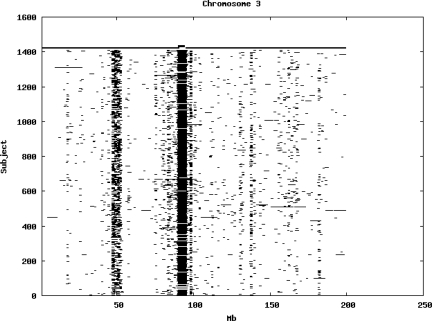
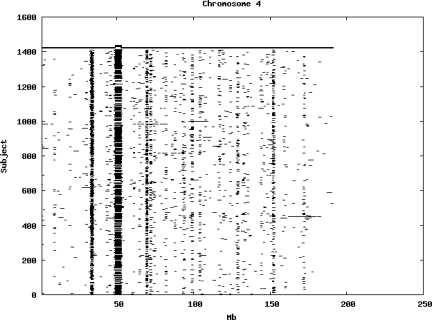
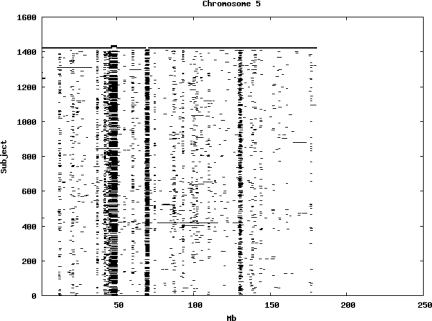
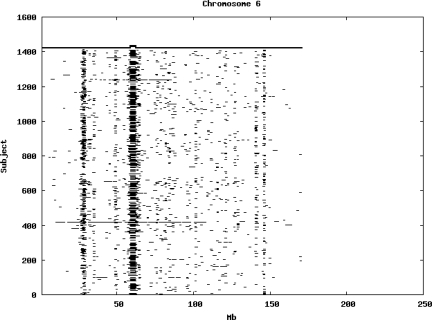
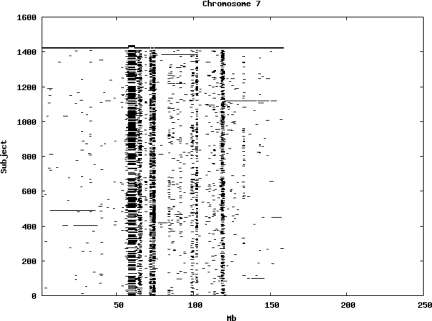
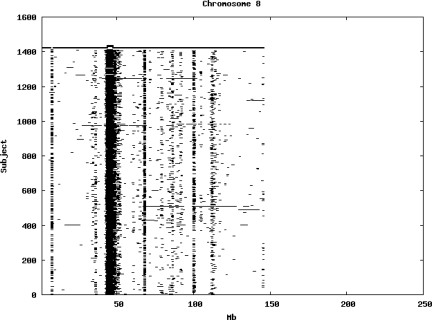
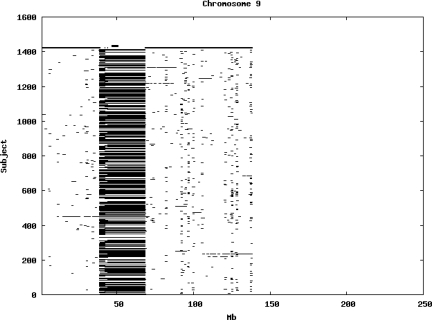
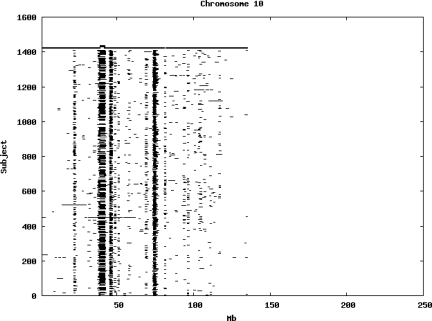
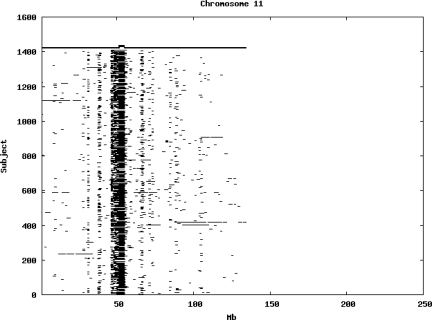
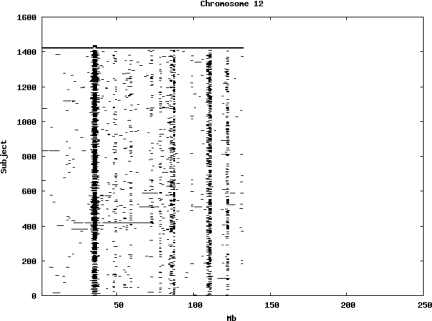
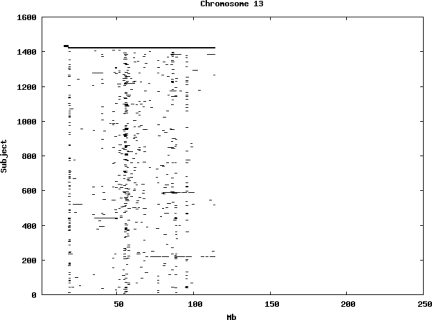
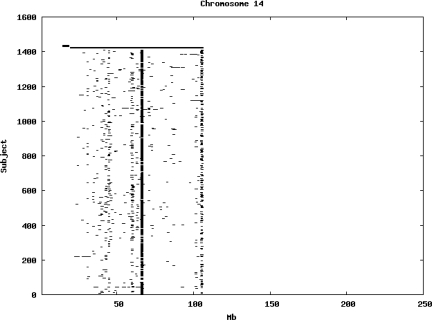
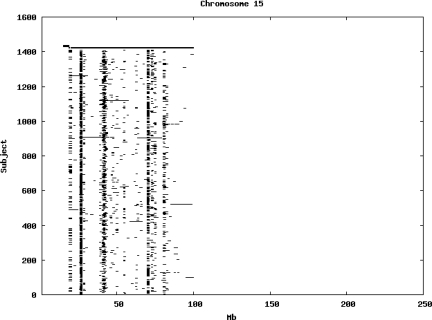
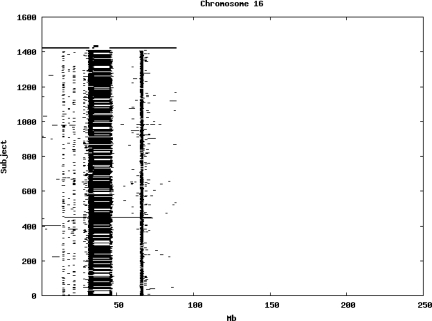
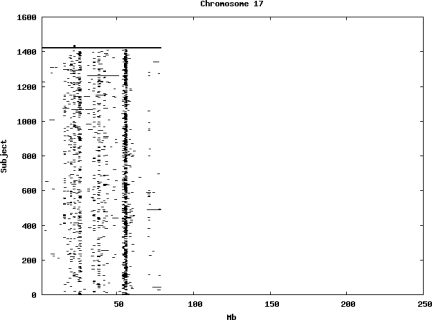
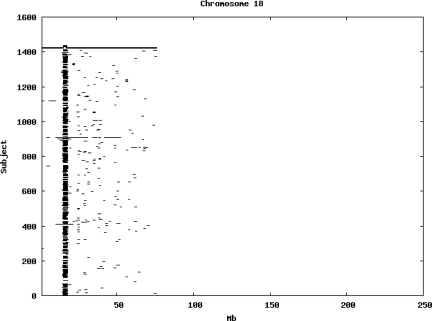
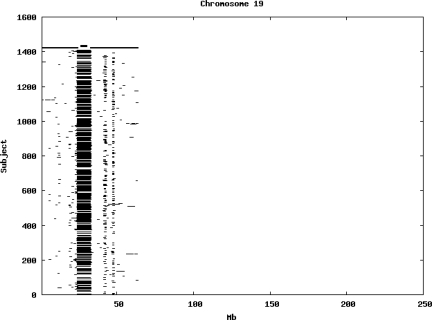
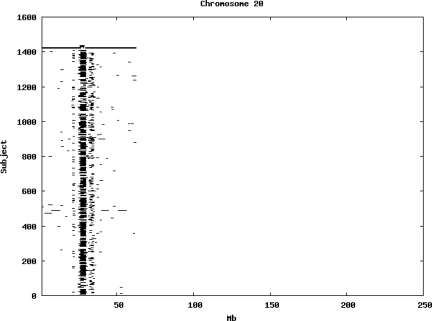
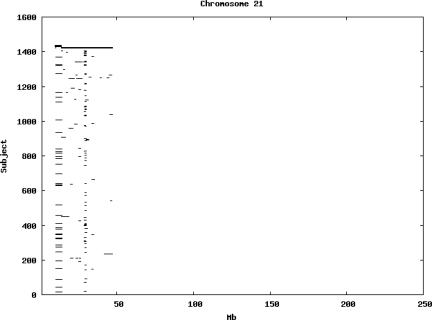
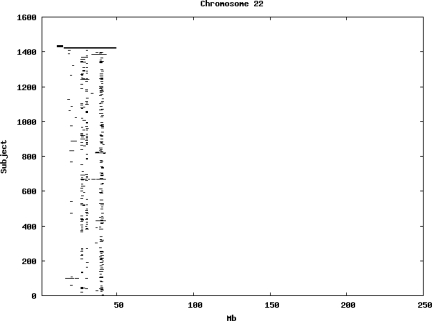
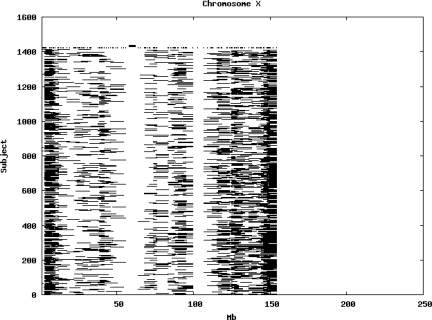
Using the criteria of a minimum of 10 consecutive, homozygous markers extending over 1 Mb we identified a total of 50,709 regions of extended homozygosity. Although we required a minimum of 10 homozygous markers to define such a region, in fact the average number was 73. The mean number of regions per subject was 35.9 (sd 12.5, range 4–115). Although no subjects were clear outliers the distribution was mildly positively skewed (skewness = 0.5) and 13 subjects had a number of such regions more than 3 standard deviations above the mean, suggesting that some subjects might have parents who were more closely related than the average for the population from which the sample was drawn. There was a very uneven distribution of such regions between chromosomes, as demonstrated in Table 1. This shows that for most chromosomes regions of extended homozygosity occurred with an average spacing of 49–115 Mb but for chromosomes 9, 13, 18, 21 and 22 these regions were relatively rare and were found on average only every 146–349 Mb. By contrast, they were exceptionally dense on the X chromosome, with an average spacing of only 35 Mb. Figure 1 shows that the distribution of these regions on each chromosome is extremely uneven. It can be seen that they are particularly prone to occur in certain chromosomal locations. For all chromosomes except 14, 22 and X these locations clearly include the centromere but for these three chromosomes none of the genotyped SNPs is centromeric so we are unable to tell whether or not their centromeres harbour such regions. All chromosomes with the exception of chromosome 18 have at least one non-centromeric location at which regions of extended homozygosity are especially likely to occur and for some chromosomes, most especially for chromosome 17, the tendency is stronger for these regions to cluster at a non-centromeric location than at the centromere itself.
Table 1.
Number of regions of extended homozygosity extending over 10 SNPs and 1 Mb per chromosome.
| Chromosome | Number of regions of extended homozygosity per chromosome per subject | Average distance between regions of extended homozygosity (Mb) |
|---|---|---|
| 1 | 3.4 | 72.3 |
| 2 | 3.3 | 73.5 |
| 3 | 2.5 | 79.9 |
| 4 | 2.3 | 84.9 |
| 5 | 2.3 | 78.7 |
| 6 | 1.5 | 115.4 |
| 7 | 2.0 | 77.8 |
| 8 | 2.7 | 53.7 |
| 9 | 0.8 | 178.0 |
| 10 | 2.0 | 66.3 |
| 11 | 1.5 | 88.5 |
| 12 | 1.6 | 83.7 |
| 13 | 0.5 | 212.9 |
| 14 | 1.0 | 84.2 |
| 15 | 1.5 | 55.5 |
| 16 | 1.8 | 48.8 |
| 17 | 1.0 | 79.2 |
| 18 | 0.5 | 146.4 |
| 19 | 0.6 | 100.1 |
| 20 | 0.6 | 98.8 |
| 21 | 0.1 | 349.2 |
| 22 | 0.2 | 146.7 |
| X | 4.3 | 35.4 |
Figure 1.
Distribution of regions of extended homozygosity of at least 10 SNPs extending over at least 1 Mb. The top bar shows the position of the centromere and the bar below shows positions of typed SNPs so that gaps in this bar represent regions where no markers are typed. Below are horizontal lines indicating regions of extended homozygosity in each individual subject.
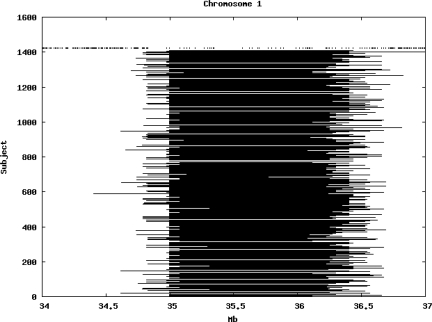
Figure 2 illustrates in detail the regions of extended homozygosity on chromosome 1 between 34 and 37 Mb. This shows that a number of such regions share common boundaries between subjects, likely reflecting ancestral recombination events.
Figure 2.
Detailed display of regions of extended homozygosity on chromosome 1 demonstrating extent of overlap and presence of some common boundaries between subjects.
There were 24 locations in which regions of extended homozygosity overlapped to occur in 30% of subjects or more. Haplotype frequencies of stretches of 11 SNPs from these locations were estimated and then tests for excess homozygosity were carried out using the probable haplotype assignments for each subject. These tests did not reveal that in general there were more homozygotes than would be expected from the haplotype frequencies. At 3 of the 24 locations there was a significant (p < 0.05) excess of homozygotes but at 5 there was a significant excess of heterozygotes. Thus, the observed regions of homozygosity appeared to occur simply as a consequence of some haplotypes having high frequency in the population rather than through some other mechanism which might drive excess homozygosity.
Estimated frequencies for the four commonest haplotypes from these locations are shown in Table 2. These results demonstrate some interesting features. In some cases there is one particularly common haplotype along with others which could have been derived from it by one or two mutational events. For example, at rs7543044 haplotype 12121122212 has frequency 0.86 and haplotype 22121122212 has frequency 0.08. However in other cases common haplotypes are very different from each other. A striking example of this is at rs1910740, where haplotype 21112111211 has frequency 0.51 and haplotype 12221222122 has frequency 0.26. At rs7042508 there are three common haplotypes which differ from each other at a number of different SNPs: 22211121222, 12111121112 and 22211112122 occur with frequencies 0.48, 0.16 and 0.12. Finally, the results at rs7532615 are compatible with a recombination event, in that haplotype 12222212121, which occurs with frequency 0.04, could have been formed by recombination between haplotypes 11111212121 and 12222121211, which have frequencies of 0.35 and 0.06.
Table 2.
Estimated haplotype frequency of four commonest 11-marker haplotypes at locations where many subjects (>30%) have a region of extended homozygosity. The table shows the central marker of each haplotype and its chromosomal location according to NCBI Build 35.
| SNP | Chromosome | Position | Haplotype | Frequency |
|---|---|---|---|---|
| rs7543044 | 1 | 35343404 | ||
| 12121122212 | 0.862 | |||
| 22121122212 | 0.077 | |||
| 12121221212 | 0.041 | |||
| 12121121212 | 0.020 | |||
| rs7532615 | 1 | 120784882 | ||
| 11111121211 | 0.515 | |||
| 11111212121 | 0.346 | |||
| 12222121211 | 0.064 | |||
| 12222212121 | 0.044 | |||
| rs842160 | 2 | 89937528 | ||
| 12222111111 | 0.549 | |||
| 12222122221 | 0.080 | |||
| 12212111121 | 0.070 | |||
| 12222111221 | 0.050 | |||
| rs1469950 | 2 | 135961986 | ||
| 12111112111 | 0.841 | |||
| 12111112112 | 0.097 | |||
| 22212222222 | 0.061 | |||
| rs9878394 | 3 | 90346746 | ||
| 11211211112 | 0.717 | |||
| 11211222112 | 0.085 | |||
| 11211211212 | 0.077 | |||
| 11211111212 | 0.049 | |||
| rs1373494 | 4 | 33571092 | ||
| 12121112211 | 0.910 | |||
| 21212221122 | 0.064 | |||
| 22121112211 | 0.026 | |||
| rs1910740 | 4 | 52539685 | ||
| 21112111211 | 0.510 | |||
| 12221222122 | 0.255 | |||
| 21111111211 | 0.235 | |||
| rs579279 | 5 | 49608899 | ||
| 12221221211 | 0.383 | |||
| 21112122122 | 0.201 | |||
| 21112112122 | 0.139 | |||
| 11221221211 | 0.136 | |||
| rs4423955 | 5 | 68603731 | ||
| 11211122111 | 0.322 | |||
| 21222211211 | 0.246 | |||
| 21222211212 | 0.132 | |||
| 11211122112 | 0.130 | |||
| rs2353200 | 8 | 47043376 | ||
| 21212121212 | 0.717 | |||
| 21212112111 | 0.242 | |||
| 21212111212 | 0.041 | |||
| rs7042508 | 9 | 38736451 | ||
| 22211121222 | 0.475 | |||
| 12111121112 | 0.155 | |||
| 22211112122 | 0.116 | |||
| 12211121112 | 0.077 | |||
| SNP_A-2000076 | 10 | 38669892 | ||
| 11222122212 | 0.460 | |||
| 12221122122 | 0.207 | |||
| 12111122122 | 0.130 | |||
| 12111121122 | 0.073 | |||
| rs7086046 | 10 | 45396241 | ||
| 21111222122 | 0.435 | |||
| 21112212122 | 0.260 | |||
| 11111121122 | 0.166 | |||
| 11111122122 | 0.096 | |||
| rs7078127 | 10 | 74517640 | ||
| 21212121222 | 0.631 | |||
| 22112121222 | 0.285 | |||
| 21211212111 | 0.048 | |||
| 12222121222 | 0.036 | |||
| rs492496 | 11 | 51313877 | ||
| 21212121211 | 0.613 | |||
| 11112121211 | 0.128 | |||
| 11111121111 | 0.122 | |||
| 12222122222 | 0.090 | |||
| rs3956186 | 12 | 36144018 | ||
| 22212111121 | 0.523 | |||
| 11121211222 | 0.395 | |||
| 22212111122 | 0.083 | |||
| rs2038398 | 14 | 66455481 | ||
| 12211111222 | 0.906 | |||
| 21112122221 | 0.071 | |||
| 21211111222 | 0.023 | |||
| rs2346050 | 15 | 26196279 | ||
| 22121122211 | 0.608 | |||
| 22121122221 | 0.107 | |||
| 22122122211 | 0.098 | |||
| 22121122212 | 0.077 | |||
| rs7500645 | 16 | 33847701 | ||
| 12121212112 | 0.325 | |||
| 12121211112 | 0.207 | |||
| 21121212112 | 0.112 | |||
| 12121212111 | 0.072 | |||
| rs2279023 | 16 | 66035752 | ||
| 21211211212 | 0.779 | |||
| 21211211211 | 0.107 | |||
| 21111211212 | 0.083 | |||
| 12212211212 | 0.031 | |||
| rs7218904 | 17 | 55836280 | ||
| 22121211121 | 0.739 | |||
| 22121211112 | 0.088 | |||
| 11221211221 | 0.070 | |||
| 22121211221 | 0.070 | |||
| rs288979 | 18 | 16865241 | ||
| 12212112111 | 0.291 | |||
| 12212122111 | 0.170 | |||
| 22212112111 | 0.158 | |||
| 11122122111 | 0.102 | |||
| rs1818976 | 19 | 24222331 | ||
| 11211111212 | 0.568 | |||
| 11111111222 | 0.135 | |||
| 22211121221 | 0.097 | |||
| 11211121221 | 0.056 | |||
| rs845787 | 20 | 26145931 | ||
| 12222112212 | 0.245 | |||
| 12211122112 | 0.244 | |||
| 12111222112 | 0.109 | |||
| 21221221112 | 0.108 |
Discussion
We believe that this investigation highlights aspects of the extent and nature of the occurrence of regions of extended homozygosity which were not fully apparent in reports from previous studies, which were based on smaller samples. From all the evidence we currently have available, these regions occur because there are extended haplotypes present in the population at a high enough frequency to sometimes be inherited by chance from both parents of a subject. For a sample size of 1,411 subjects we would expect this phenomenon to occur once for a given haplotype if the population frequency of the haplotype were in the region of 3%. Thus, each time we observe such a region of extended homozygosity we can interpret it as indicating that the haplotype concerned is fairly common. By contrast, the HapMap consortium mentions finding long haplotypes extending over 1 cM and having a frequency of “more than 1%” in the HLA region and in other places (The HapMap Consortium 2005). We feel that perhaps such reports have failed to convey just how common such extended haplotypes are. We have found locations where over 30% of subjects have a region of extended homozygosity, implying that the involved haplotypes are very common indeed. Likewise, although the other reports mention the uneven distribution of the locations in which extended homozygosity occurs, we were nevertheless surprised to see the extent to which there were very particular chromosomal locations where these were concentrated. Presumably these locations do indeed reflect suppression of recombination and we hope that highlighting the existence of these locations will stimulate further research into the underlying molecular mechanisms for this. We also note the marked variation between chromosomes, with a handful having relatively few such locations and with the X chromosome having very many. While the X chromosome has only half as many opportunities for recombination as the autosomes we cannot say whether this represents a full explanation for this phenomenon.
One might argue that we have used relatively lax criteria to define regions of extended homozygosity. In contrast with a previous report (Gibson et al. 2006) we did not incorporate a criterion for marker density. This means that a region with sparse markers might be included if as few 10 consecutive markers were homozygous by chance and this could apply particularly to centromeres, where there are long gaps between markers. This failure to include marker density as a criterion might partially explain the difference between the results we report and the impression gained from previous reports. However we emphasise that the average number of markers in the homozygous regions we identify is 73 and we would argue that finding such a large number of consecutive markers to be homozygous is more likely to indicate that the region as a whole is truly homozygous than that the observed markers happen to be homozygous by chance. One consequence of using a marker density criterion would have been to exclude the centromeres from consideration. Our study does not exclude these and for twenty chromosomes markers were genotyped on either side of the centromere leading to the centromere being classified as a region of extended homozygosity in many, but not all, subjects. Studies which excluded the centromeres would have reported a lower number of such regions. We also should note that the results we have obtained are dependent on the marker set we have used and that as higher density chips become available these will allow a more definite assessment of the extent and nature of these regions.
Perhaps more pertinent than the frequency and distribution of the regions of homozygosity is the nature of the haplotypes they consist of, which has not previously been reported on. It would be relatively easy to understand the occurrence of such regions if recombination were suppressed and if a single haplotype, along with others derived from it by recombination and mutation, were present at high frequency. This is by no means what we observe. Such a single, dominant haplotype would be consistent with there being a common ancestral haplotype or with selection pressure, as discussed previously (The HapMap Consortium 2005). However at more than one location we observe very common haplotypes which are quite different from each other at several SNPs. From a theoretical point of view one might observe this if there were a mechanism whereby several or many mutation events could occur in a common haplotype simultaneously, for example if there were some very local change in the chemical microenvironment around part of a chromosome leading to mutagenesis. Alternatively, this could happen if there were two or more separate ancestral populations in which the haplotypes had evolved independently. This does not coincide with current thinking about human ancestry. There has previously been discussion of “Yin-Yang” haplotypes, which differ from one another at every SNP (Zhang et al. 2003). As was reported, these would initially suggest “deep population splitting or maintenance of ancient lineages by selection”. However the authors reported that simulation showed that such haplotypes could be explained by strictly neutral evolution in a well-mixed population. The average length for these haplotypes was reported as being only 47 kb. It is more difficult to see how haplotypes extending over 1 Mb and which differ markedly from each other, albeit not necessarily at every SNP, could co-occur frequently as a result of such random mechanisms. One of the reviewers of this paper reports that his group has identified regions of high LD associated with inversions and suggests that these could account for the haplotype patterns we observe (M. Weale, personal communication). We propose that this topic is worthy of further investigation.
Perhaps the main point that we would like to make is that these very long regions of extended homozygosity offer an unprecedented opportunity for haplotype reconstruction which could be followed by systematic investigation of the transformative events, including mutation, recombination and admixture, which define the relations between haplotypes. We begin by stating the obvious fact that a subject homozygous for a string of consecutive SNPs can yield phased haplotypes with complete lack of ambiguity. Next, we note from our investigations above that such regions of homozygosity are, at particular locations, surprisingly common. This means not only that a large number of subjects can be assigned phase known haplotypes through being homozygous but also that a second wave of subjects can be phased through being seen to be, with high probability, heterozygous for one of these common haplotypes. This should lead rapidly to the situation where haplotypes consisting of dozens or hundreds of markers are identified as being present at substantial population frequencies. Statistical methods for assigning phased haplotypes have been compared by the HapMap consortium (Marchini et al. 2006) and it was found that the best-performing algorithm, implemented in the PHASED program, produced incorrect haplotypes in 5% of subjects using SNPs stretching over 1 cM. We believe that having genotypes for hundreds of subjects from areas of low recombination harbouring common extended haplotypes may represent an unprecedented opportunity to develop novel haplotyping algorithms. These should yield definitively phased haplotypes which could then be used to reconstruct the population history of these haplotypes using modern algorithms (Minichiello & Durbin 2006). Although haplotypes from these regions may not be typical of those throughout the genome if they have arisen through selection effects or other atypical mechanisms, they will nevertheless provide a valuable resource for further investigations. Particular insights will be gained if comparisons are made between haplotypes in different chromosomal regions, between different ethnic groups and between different species.
Abbreviations
LD – linkage disequilibrium.
Acknowledgments
The authors are grateful to the Translational Genomics Research Institute and all those who carried out the GWA study for making their data publicly available. AEV was supported by Wellcome Trust Project Grant, Grant No. 076392. JK was supported by an MRC Bioinformatics Training Fellowship, Grant No. G0501329. The authors are grateful to M Weale for suggestions made during the reviewing process.
Conflict of Interest Statement
The authors declare they have no conflict of interest.
References
- Broman K W, Weber J L. Long homozygous chromosomal segments in reference families from the centre d'Etude du polymorphisme humain. Am J Hum Genet. 1999;65(6):1493–500. doi: 10.1086/302661. [DOI] [PMC free article] [PubMed] [Google Scholar]
- Curtis D. Extended homozygosity is not usually due to cytogenetic abnormality. BMC Genetics. 2007;8:67. doi: 10.1186/1471-2156-8-67. [DOI] [PMC free article] [PubMed] [Google Scholar]
- Gibson J, Morton N E, et al. Extended tracts of homozygosity in outbred human populations. Hum Mol Genet. 2006;15(5):789–95. doi: 10.1093/hmg/ddi493. [DOI] [PubMed] [Google Scholar]
- Marchini J, Cutler D, et al. A comparison of phasing algorithms for trios and unrelated individuals. Am J Hum Genet. 2006;78(3):437–50. doi: 10.1086/500808. [DOI] [PMC free article] [PubMed] [Google Scholar]
- Minichiello M J, Durbin R. Mapping trait loci by use of inferred ancestral recombination graphs. Am J Hum Genet. 2006;79(5):910–22. doi: 10.1086/508901. [DOI] [PMC free article] [PubMed] [Google Scholar]
- Reiman E M, Webster J A, et al. GAB2 Alleles Modify Alzheimer's Risk in APOE varepsilon4 Carriers. Neuron. 2007;54(5):713–720. doi: 10.1016/j.neuron.2007.05.022. [DOI] [PMC free article] [PubMed] [Google Scholar]
- Simon-Sanchez J, Scholz S, et al. Genome-wide SNP assay reveals structural genomic variation, extended homozygosity and cell-line induced alterations in normal individuals. Hum Mol Genet. 2007;16(1):1–14. doi: 10.1093/hmg/ddl436. [DOI] [PubMed] [Google Scholar]
- The HapMap Consortium. A haplotype map of the human genome. Nature. 2005;437(7063):1299–320. doi: 10.1038/nature04226. [DOI] [PMC free article] [PubMed] [Google Scholar]
- Zhang J, Rowe W L, et al. Genomewide distribution of high-frequency, completely mismatching SNP haplotype pairs observed to be common across human populations. Am J Hum Genet. 2003;73(5):1073–81. doi: 10.1086/379154. [DOI] [PMC free article] [PubMed] [Google Scholar]


