Abstract
The cervico-ocular reflex (COR) is an ocular stabilization reflex that is elicited by rotation of the neck. It works in conjunction with the vestibulo-ocular reflex (VOR) and the optokinetic reflex (OKR) in order to prevent visual slip over the retina due to self-motion. The gains of the VOR and OKR are known to decrease with age. We have investigated whether the COR, a reflexive eye movement elicited by rotation of the neck, shows a compensatory increase and whether a synergy exists between the COR and the other ocular stabilization reflexes. In the present study 35 healthy subjects of varying age (20–86 years) were rotated in the dark in a trunk-to-head manner (the head fixed in spaced with the body passively rotated under it) at peak velocities between 2.1 and 12.6 deg s−1 as a COR stimulus. Another 15 were subjected to COR, VOR and OKR stimuli at frequencies between 0.04 and 0.1 Hz. Three subjects participated in both tests. The position of the eyes was recorded with an infrared recording technique. We found that the COR-gain increases with increasing age and that there is a significant covariation between the gains of the VOR and COR, meaning that when VOR increases, COR decreases and vice versa. A nearly constant phase lag between the COR and the VOR of about 25 deg existed at all stimulus frequencies.
The ocular stabilization reflexes serve to stabilize the visual image on the retina during head movements. Several sensory systems contribute to this process. The vestibulo-ocular reflex (VOR) moves the eyes on the basis of vestibular information opposite to the direction of head movement. It is mainly responsive to head movements with a high frequency (Tabak et al. 1997). The optokinetic reflex (OKR) responds to visual motion stimulation. It directs the eyes in the same direction as the visual slip on the retina. The cervico-ocular reflex (COR) is a reflexive eye response that is elicited by rotation of the neck. The proprioception of muscles and the facet joints of the cervical spine form the receptor part of this reflex (Hikosaka & Maeda, 1973). In contrast to the VOR, both the OKR and COR respond optimally to head movements with a low velocity (Van Die & Collewijn, 1986; Mergner et al. 1998). In an optimal situation these stabilization reflexes work in conjunction at all head velocities in order to optimize the ocular response.
A problem in the synergy of compensatory reflexes is that the VOR and the OKR decrease with old age (Mulch & Petermann, 1979; Aust, 1991; Paige, 1994). In this paper we investigate how the COR changes with age. The question is whether the COR declines, in a similar way to the other stabilization reflexes, or whether the COR increases in order to compensate for the loss of vestibular and optokinetic function. Because other factors, such as age-related changes in mobility of the neck, may have an effect on the sensitivity of the neck proprioceptors, we have also explicitly studied the synergy of COR, OKR and VOR.
In a recent paper Schweigart et al. (2002) present evidence that the proprioceptive gain of the neck increases with age. Psychophysical responses to passive neck rotation were larger in older subjects. Meanwhile the responses to pure vestibular stimulation decreased with age. Schweigart et al. (2002) hypothesize that the increase in the cervical response is a compensatory mechanism for the deterioration of vestibular function. Also in labyrinthine defective subjects the COR is substantially higher than in normal controls (Bronstein & Hood, 1986; Huygen et al. 1991; Heimbrand et al. 1996). This shows that the strength of the COR is apparently plastic and can indeed be upregulated in the absence of vestibular input.
METHODS
Stimulation
Cervical stimulation
In a laboratory situation an isolated COR response can only be elicited in the absence of visual or vestibular input by fixating the head in space in total darkness and by passive rotation of the body (trunk-to-head rotation). This situation is different from the situation in daily life where the body usually remains in the same position and the head rotates (head-to-trunk rotation). A further difference from the natural situation is that passive head movements are rare, so that muscle stiffness during natural head movement is presumably different from that during our stimulation.
For measurement of the COR a rotating chair was used. The subject's head was fixed in space by a custom made bite board using Lactona hardening silicone impression material (Dental Techno Benelux, Rotterdam, The Netherlands) and the trunk was fixed to the chair at the shoulders by a double belt system. The chair was rotated sinusoidally about the vertical axis at various amplitudes and frequencies. The setup was capable of generating sine waves without any backlash at the point where the chair rotation changed direction. A sensor connected to the chair recorded chair position. Chair position was stored on hard disk along with the eye position data (see below).
We used the Cervical Range Of Motion (CROM) device to determine if the bite board-fixed head was well stabilized in space. Rotation of the head was negligibly small. The Cervical Range of Motion device (CROM-device) is a device consisting of a magnet and three compass-like instruments situated in every direction of motion of the neck (lateroflexion, rotation, flexion-extension). It is used to determine the maximum range of motion of the different neck motions. The device has been validated in several studies (Capuano-Pucci et al. 1991; Youdas et al. 1991).
Vestibular stimulation
For the recording of the VOR the same chair was used. The only difference was that the bite board was now attached to the chair, rather than to the room, so that head and body moved together in space, but not with respect to each other. The position of the bite board was chosen so that the axis of rotation was under the midpoint of the interaural line. Like in the COR measurements, all vestibular stimulation was performed in darkness.
Optokinetic stimulation
Visual stimulation consisted of white dots that moved sinusoidally in a field that was 60 deg wide and 45 deg high. The dots were generated by a PC and back-projected on a translucent screen (235 cm broad and 170 cm wide) by means of an Infocus LP 335 data projector. The beam of this projector reflected on a mirror that was mounted on a Cambridge Technology step motor (model number 6900). Rotations of this mirror induced motion of the dots on the screen. The stimulus consisted of 50 dots that had a diameter of 0.8 deg. In order to minimize the contribution of foveal pursuit of a single dot in the pattern, all dots had a limited lifetime of 50 ms. The dots were homogeneously distributed over the screen, with the exception of an area of 6 deg in the centre where no dot appeared. The subjects were instructed to keep fixation within this area, in order to prevent visual motion in the (peri-)foveal region. The head and chair were both fixed with respect to the room.
Mirror position was stored on hard disk along with the eye position data (see below).
Recording of eye position
Eye position was recorded by using an infrared eye-tracking device (Eyelink, SMI; see van der Geest & Frens, 2002). After calibration of the device, both horizontal and vertical eye position could be recorded precisely with a resolution of 20 ‘’ of arc and a sampling frequency of 250 Hz. During the experiment the location of the eyes relative to the bite board-mounted cameras was continuously monitored to make sure the subject's head was well stabilized by the bite board.
Experimental procedure
We performed two sets of experiments. In the first set (‘the COR test’) we recorded the COR under a variety of stimulus parameters (amplitude and frequency) in a population of subjects balanced over a largely varying age. This test was intended to identify the optimal stimulus parameters for the COR, and to study the effect of ageing on this reflex. In the second set (‘the Synergy test’) we used a smaller range of stimulus parameters within the optimal range of the COR. In this range we tested not only the COR, but also the OKR and VOR. The main focus of this test was to test whether the gains of these reflexes correlate between subjects, and to investigate mutual phase relations.
COR test
For the cervical stimulation that was applied in the COR test, the chair was rotated at two different frequencies (0.1 and 0.067 Hz) and four different amplitudes (5, 10, 15 and 20 deg). All rotations were around the ‘straight ahead’ position (i.e. transverse planes though both ears and both shoulders parallel) as the middle of the range of motion.
With the lights switched off, five complete stimulus cycles were made in the dark, while the eye movements were recorded. As the COR is hypothesized to help in stabilization of the retinal image, the test subject was instructed to focus on an imaginary target located straight ahead at about 3 m distance, briefly indicated by a laser dot before rotations started. The procedure was repeated for each combination of amplitude and frequency.
Subjects were divided into four groups with either increasing or decreasing frequencies and increasing or decreasing amplitudes to exclude any effects of learning or fatigue on COR gain. Statistical analysis (Student's t test all P > 0.1) showed no difference between these groups. Therefore, for the remainder of the paper all data will be pooled across the order of frequencies and amplitudes.
Synergy test
In the synergy test we applied cervical, vestibular and optokinetic stimulation. All stimuli had an amplitude of 5 deg, and were applied in isolation (i.e. no combined visual/vestibular or cervical stimulation was given). Frequencies were 0.04, 0.06, 0.08, and 0.1 Hz. As in the COR test, all stimuli were applied with the head in the straight ahead position.
Subjects
In the experiments a total of 47 subjects participated; 35 subjects (15 female, 20 male) were measured in the COR test, and 15 (6 female, 9 male) participated in the synergy test. Three subjects did both tests.
In the COR test, the mean age was 44.9 ± 18.4 years (range 20-82 years). In the synergy test, the mean age was 34.2 ± 13.8 years (range 23-64 years). All subjects signed informed consent and filled out a medical questionnaire. None of the subjects had a history of vestibular problems or cervical complaints nor did they use any form of tranquilizing medication (benzodiazepines, antihistamines). The experiments were approved by the ethics committee of the Erasmus MC and have therefore been performed in accordance with the ethical standards laid down in the 1964 Declaration of Helsinki.
Data analysis
Eye velocity was calculated by taking the derivative of the horizontal eye position signal (Fig. 1). We removed blinks, saccades and fast phases using a 20 deg s−1 threshold. On average the subjects made between one and two nystagmus fast phases per second. A sine wave was fitted through the remaining eye velocity signal. Stimulus velocity was derived from chair position (COR and VOR measurement) and mirror position (OKR measurement) data.
Figure 1. Calculation of eye velocity.
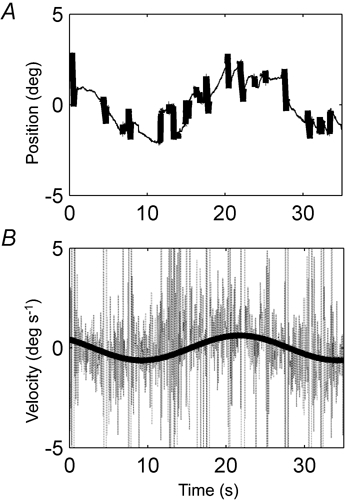
A, example of a raw horizontal eye position trace during stimulation at 0.04 Hz with an amplitude of 5 deg, taken from a 58-year-old subject. Detected blinks, saccades and fast phases are shown as thick lines. B, eye velocity derived from the positional data in A. Through the eye velocity a sinus is fitted with three free parameters (amplitude, phase, and offset). Data from blinks, saccades and fast phases were not used for the fit.
The gain of the response was defined as the amplitude of the eye velocity fit divided by the peak velocity of the stimulus movement. Phase differences were defined so that a movement with a difference of 0 deg was in phase with the stimulus, in the compensatory direction. Positive phase differences indicate a phase lag. All analyses were done with Matlab 6.1 (the Mathworks Inc.).
RESULTS
COR test
Figure 2 shows COR gains of all subjects as a function of either frequency (Fig. 2A) or stimulus peak velocity (Fig. 2B). As the COR gain data can be correlated in a single curve to the various peak velocities but not to the different frequencies, the COR appears to be better determined by peak velocity than by frequency. This becomes more evident when the mean gain data at a peak velocity of 6.3 deg s−1, which consist of two different combinations of frequencies and amplitudes (i.e. a combination of 0.067 Hz and 15 deg and a combination of 0.10 Hz and 10 deg), are subjected to a two-tailed t test. This test showed no difference between both mean gains (P = 0.136). This finding correlates with those of Mergner (1998). Therefore we will present our data as a function of peak velocity rather than of frequency.
Figure 2. Gains plotted against frequency and peak velocity.
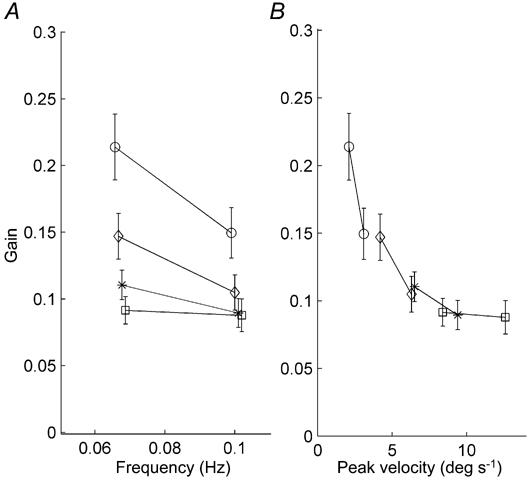
The error bars represent s.e.m. For clarity the data points at identical frequencies or peak velocities have been slightly shifted horizontally in both A and B. Symbols have been used to represent different stimulus amplitudes: ○, 5 deg; ⋄, 10 deg; *, 15 deg; and □, 20 deg. A, gains plotted for each frequency. Each stimulus amplitude is represented by an individual line. There is much variation in gains between the different amplitudes. The lowest amplitude has the largest gains, whereas the highest amplitudes have the lowest gains. B, gains plotted as a function of peak velocity. Each amplitude is again represented by an individual line. Note that all individual data points are on the same curve in panel B.
Mean gains were calculated for each peak velocity. The mean gain ± s.e.m. at the lowest peak velocity (2.1 deg s−1) was 0.21 ± 0.025 and this decreased with increasing peak velocities to 0.08 ± 0.010 at a peak velocity of 12.6 deg s−1. Because the relation saturates at higher peak velocities, two straight lines were fitted through the gains as function of the peak velocity (Fig. 3). For the peak velocities below 7 deg s−1 (continuous line) the fitted slope of -0.014 s deg−1 was significantly different from zero (P = 0.0016). For the peak velocities over 7 deg s−1 (dotted line) the slope was -0.0011 s deg−1, which is not significantly different from zero (P = 0.71). These results show that the COR is a low peak velocity system.
Figure 3. Gains plotted against peak velocity.
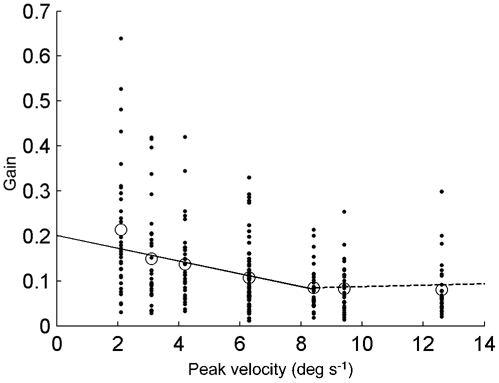
Each individual COR-gain is represented by a dot. Mean gains are represented by the circles. The dotted straight line is fitted through the individual data points having a stimulus peak velocity higher than 7 deg s−1. The continuous line is fitted through the other individual data points.
Figure 4 presents the same data as shown in Fig. 3 but now the subjects were assigned to one of four different age groups, i.e. younger than 30 years (n = 10, mean age 24.5 ± 2.5 years), between 30 and 45 years of age (n = 8, mean age 35.0 ± 4.2 years), between 45 and 60 years (n = 10, mean age 51.6 ± 5.3 years) and older than 60 years (n = 7, mean age 72.3 ± 5.6 years). The oldest group (older than 60 years) seems to have a higher COR-gain over all peak velocities.
Figure 4. Gains plotted against peak velocity for each age group.
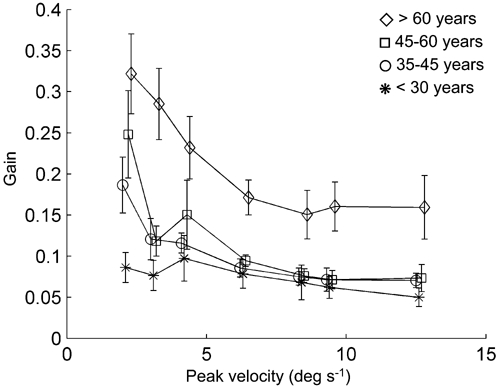
Each age group is represented by a line. The vertical lines represent the s.e.m. Note the upward shift of the curve at all velocities for age group > 60 years. For clarity the data points have been slightly shifted horizontally.
A multivariate analysis was carried out, having two factors: ‘age group’ with four levels (corresponding to the age groups), and ‘stimulus peak velocity’ with seven levels (2.1, 3.1, 4.2, 6.3, 8.4, 9.4 and 12.6 deg s−1). This showed that the main effect of ‘age group’ reached significance (F(3,30) = 7.39, P = 0.001). Least squares difference (LSD) post hoc analysis showed that the mean gains differed only between the group over 60 years and all other groups (P < 0.001 for each group). The main effect of peak velocity also reached significance (F(3,28) = 6.00, P = 0.003). This means that the oldest group had increased COR-gains at all peak velocities.
Synergy test
Figure 5 shows typical results of the synergy test of a typical subject, performed at 0.04 Hz. Note that the three reflexes result in qualitatively similar responses, that include smooth traces, interleaved with saccades and blinks. The occurrences of the latter two have about the same frequency in all reflex types.
Figure 5. Typical traces from the synergy test.
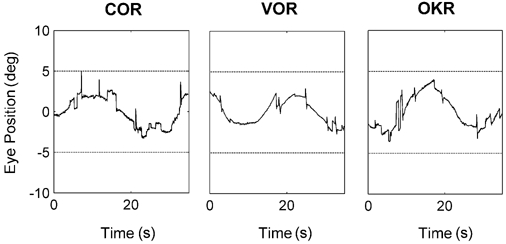
These graphs show horizontal position traces from a 26-year-old subject, in response to cervical (COR), vestibular (VOR) and optokinetic (OKR) stimulation. Horizontal lines indicate stimulus amplitude.
Figure 6 shows the gain and phase relations of the three reflexes. In Fig. 6A the average gains are shown. Note that, since we used a fixed stimulus position amplitude in the synergy test, there is now a one-to-one relation between stimulus peak velocity and frequency. All gains are quite stable over the stimulus range of the synergy test (Fig. 6A). The gain of the COR decreases slightly with stimulus frequency (P < 0.05), which is in line with the data of the COR test. The VOR slightly increases (P < 0.05). The OKR is more or less constant within this stimulus range. Despite the fact that the VOR is more sensitive at higher frequencies, its gain is still higher than the COR gain, even at the tested low stimulus velocities.
Figure 6. Gain (A) and phase difference (B) of the three stabilization reflexes as a function of stimulus frequency.
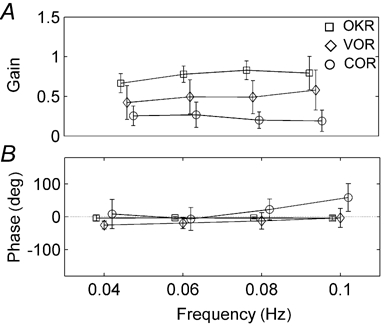
Note that, in panel A, at all frequencies the OKR is strongest, followed by the VOR and the COR.
In Fig. 6B a phase difference of 0 deg means that the reflex is compensatory (i.e. in phase with the stimulus for the COR and in counterphase with the stimulus for the VOR). As one can see, all three reflexes are roughly compensatory at all stimulation frequencies. A positive value indicates a phase lag with respect to the stimulus. The variability in the phase values at these low velocities is similar for the VOR and the COR. The variation is mutually uncorrelated, i.e. the phase of someone's VOR cannot be predicted from the COR or vice versa (not shown). At all frequencies, the OKR is almost perfectly compensatory. Meanwhile, both the phase difference of the VOR and the COR significantly change in the same direction (P < 0.05). The response increasingly lags the stimulus with increasing frequency in such a way that there is a more or less constant phase difference of about 25 deg between the reflexes at all frequencies.
The gain values of all subjects and at all frequencies are plotted in Fig. 7. Note that there is a negative correlation between the VOR-gain and the COR-gain (r = -0.42; P = 0.007; Fig. 7A). Meanwhile the OKR- and VOR-gains as well as the OKR-gain and COR-gain are mutually uncorrelated (r < 0.25; P > 0.1; Fig. 7B and C). In these correlations, age can be a confounding factor. Indeed, both the COR and the VOR vary with age in the investigated population (P < 0.05), while gain of the OKR remains constant (P > 0.05; Fig. 7D). There is an increase of COR-gain with age, which is in line with the results of the COR test. Meanwhile the VOR-gain decreases.
Figure 7. Correlations between the reflex gains (A-C) and between gain and age (D).
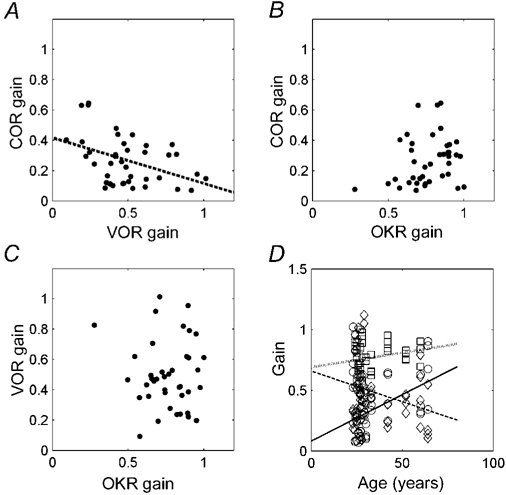
In A the dotted line is a linear fit. In D different symbols indicate the COR (continuous line, ○), the VOR (broken line, ⋄), and the OKR (dotted line, □).
In Table 1 the results of the synergy test are summarized for all frequencies separately. In general the trends that are observed for the pooled data (Fig. 7) can be generalized to the separate frequencies. The main exception to this are the data obtained at 0.1 Hz, where no correlations are found.
Table 1.
Correlation between the gains of the different reflexes split out for the four stimulation frequencies of the synergy test
| Frequency (Hz) | Correlation | ||
|---|---|---|---|
| 0.02 | VOR | OKR | 0.22 |
| COR | −0.45* | ||
| OKR | COR | 0.17 | |
| 0.04 | VOR | OKR | 0.24 |
| COR | −0.46* | ||
| OKR | COR | 0.29 | |
| 0.08 | VOR | OKR | −0.23 |
| COR | −0.38* | ||
| OKR | COR | −0.0056 | |
| 0.10 | VOR | OKR | −0.20 |
| COR | −0.20 | ||
| OKR | COR | 0.24 |
OKR, optokinetic reflex; VOR, vestibulo-ocular reflex.
Significant (P < 0.05).
DISCUSSION
The relation between age and the COR
There is a large variation between the COR-gains that have been reported in the literature (Barnes & Forbat, 1979; Barlow & Freedman, 1980; Bronstein & Hood, 1986; Huygen et al. 1991; Sawyer et al. 1994; Mergner et al. 1998). A possible explanation for this high variability could be a difference in subject characteristics between the groups that were investigated. Therefore, factors that may influence the COR-gain should be identified. We investigated the hypothesis that age is an important factor determining the magnitude of the COR-gain. This was inspired by the finding that there is an age-related decline in the other ocular stabilization processes, i.e. the VOR and OKR (Paige, 1994). This might either predict a similar decrease in the COR or an increase of COR-gain with age, as an adaptation to the decline in the other reflexes.
It has been shown before that the COR can adapt to new circumstances. Huygen et al. (1991) and Bronstein & Hood (1986) reported that COR takes over part of the VOR in labyrinthine defective subjects. Here we report significantly larger gains at all rotational velocities in the group with people aged over 60 years when compared to the other age groups. Although only two different frequencies were tested, our data support the suggestion made by Mergner et al. (1998) that the COR is a peak velocity system instead of a frequency-dependent system.
From our study it can be concluded that age plays an important role in the relation between peak velocity and COR-gain and hence, in unstratified populations, accounts for a significant part of the variation (Fig. 4). When doing research on COR in different patient groups, these groups should be stratified for age. This will lead to a smaller intersubject variation, which will make it easier to establish differences in the magnitude of COR-gain between different groups.
The increase in COR-gain with age can tell us something about the source of the decrease in VOR and OKR. Since the COR and the other reflexes share the same effector (the extraocular muscles), it is likely that the decrease in VOR and OKR is due to loss of sensory rather than motor function. Stronger proprioceptive signals accounting for the increase of the COR of the neck are in agreement with the psychophysical data of Schweigart et al. (2002; see introduction).
The relation between the COR and the other stabilization reflexes
Although it is tempting to ascribe the age-related changes in the COR to a compensation for the loss of other reflexes, other possible explanations exist. One such explanation could be the fact that elderly persons have a relatively stiffer neck in which the range of motion is smaller and the limits are reached earlier. Therefore the proprioception in the neck may be more important and thus more sensitive to neck rotation.
To test whether the COR strength is influenced by the strength of the other stabilization reflexes we tested the COR, VOR and OKR under a variety of identical experimental conditions. Within the frequency range tested there appeared to be a link between the properties of the COR and the VOR, but not between the OKR and the other reflexes.
Firstly, within the age range of the subjects of the synergy-test, both the VOR and the COR correlate with age. The VOR decreases, and the COR increases (Fig. 7D). At first sight this latter finding may seem to be at odds with the results of the COR test, where we concluded that only the oldest age group (> 60 years) significantly differed from the other subjects. This is probably due to the differences in stimulus parameters. The synergy test was focused on the range where the COR had a relatively high value in all ages.
Secondly, there is a significant covariation between the individual gain parameters of the VOR and COR (Fig. 7A and Table 1). This means that the strength of the COR can be partially predicted by the strength of the VOR. Again there is a negative relation: the higher the VOR, the lower the COR.
Thirdly, the phase of the VOR and COR response both shift in the same direction as a function of stimulus frequency, resulting in a more or less constant phase difference between the two reflexes (Fig. 6B).
Taken together, these data support the hypothesis that there is a synergistic function of the COR and the VOR. The most straightforward explanation would than be that the COR can compensate for loss of vestibular function. When the gain of the VOR is lower than desired, the COR can be upregulated. This is similar to the results observed in labirynthine patients (Bronstein & Hood, 1986; Huygen, 1991). This can even hold, despite the difference in dynamic properties of both reflexes. The COR is most responsive at low velocities, whereas the VOR is responsive at high frequencies. However, even at low velocities the VOR often has a higher gain than the COR (Fig. 6A). Such a compensation can obviously only be effective in the range where the COR is active, and will therefore not influence performance at high frequencies.
Acknowledgments
We thank M. Bruin and V. C. de Bruin for their help in the data acquisition, J. van der Burg and J. G. Velkers for their help in building the experimental setup and Dr L. J. J. M. Boumans and Ing. A. J. J. Maas for their critical review of the manuscript and helpful comments. During this research Dr J. N. van der Geest was sponsored by NWO-MW (grant 903-68-394) and by the Revolving Fund of the Erasmus MC (grant 00-157).
REFERENCES
- Aust G. Der Einfluss des Lebensalters auf vestibulo-okulare Reaktionen (The effect of age on vestibulo-ocular reactions) Laryngorhinootologie. 1991;70:132–137. doi: 10.1055/s-2007-998004. [DOI] [PubMed] [Google Scholar]
- Barlow D, Freedman W. Cervico-ocular reflex in the normal adult. Acta Otolaryngol. 1980;89:487–496. doi: 10.3109/00016488009127166. [DOI] [PubMed] [Google Scholar]
- Barnes GR, Forbat LN. Cervical and vestibular afferent control of oculomotor response in man. Acta Otolaryngol. 1979;88:79–87. doi: 10.3109/00016487909137143. [DOI] [PubMed] [Google Scholar]
- Bronstein AM, Hood JD. The cervico-ocular reflex in normal subjects and patients with absent vestibular function. Brain Res. 1986;373:399–408. doi: 10.1016/0006-8993(86)90355-0. [DOI] [PubMed] [Google Scholar]
- Capuano-Pucci D, Rheault W, Aukai J, Bracke M, Day R, Pastrick M. Intratester and intertester reliability of the cervical range of motion device. Arch Phys Med Rehabil. 1991;72:338–340. [PubMed] [Google Scholar]
- Heimbrand S, Bronstein AM, Gresty MA, Faldon ME. Optically induced plasticity of the cervico-ocular reflex in patients with bilateral absence of vestibular function. Exp Brain Res. 1996;112:372–380. doi: 10.1007/BF00227943. [DOI] [PubMed] [Google Scholar]
- Hikosaka O, Maeda M. Cervical effects on abducens motoneurons and their interaction with vestibulo-ocular reflex. Exp Brain Res. 1973;18:512–530. doi: 10.1007/BF00234135. [DOI] [PubMed] [Google Scholar]
- Huygen PL, Verhagen WI, Nicolasen MG. Cervico-ocular reflex enhancement in labyrinthine-defective and normal subjects. Exp Brain Res. 1991;87:457–464. doi: 10.1007/BF00231863. [DOI] [PubMed] [Google Scholar]
- Mergner T, Schweigart G, Botti F, Lehmann A. Eye movements evoked by proprioceptive stimulation along the body axis in humans. Exp Brain Res. 1998;120:450–460. doi: 10.1007/s002210050418. [DOI] [PubMed] [Google Scholar]
- Mulch G, Petermann W. Influence of age on results of vestibular function tests. Review of literature and presentation of caloric test results. Ann Otol Rhinol Laryngol. 1979;88(suppl.):1–17. doi: 10.1177/00034894790880s201. [DOI] [PubMed] [Google Scholar]
- Paige GD. Senescence of human visual-vestibular interactions: smooth pursuit, optokinetic, and vestibular control of eye movements with aging. Exp Brain Res. 1994;98:355–372. doi: 10.1007/BF00228423. [DOI] [PubMed] [Google Scholar]
- Sawyer RN, Thurston SE, Becker KR, Ackley CV, Seidman SH, Leigh RJ. The cervico-ocular reflex of normal human subjects in response to transient and sinusoidal trunk rotations. J Vestib Res. 1994;4:245–249. [PubMed] [Google Scholar]
- Schweigart G, Chien RD, Mergner T. Neck proprioception compensates for age-related deterioration of vestibular self-motion perception. Exp Brain Res. 2002;147:89–97. doi: 10.1007/s00221-002-1218-2. [DOI] [PubMed] [Google Scholar]
- Tabak S, Collewijn H, Boumans LJ, van der Steen J. Gain and delay of human vestibulo-ocular reflexes to oscillation and steps of the head by a reactive torque helmet. I. Normal subjects. Acta Otolaryngol. 1997;117:785–795. doi: 10.3109/00016489709114203. [DOI] [PubMed] [Google Scholar]
- van der Geest JN, Frens MA. Recording eye movements with video-oculography and scleral search coils: a direct comparison of two methods. J Neurosci Methods. 2002;114:185–195. doi: 10.1016/s0165-0270(01)00527-1. [DOI] [PubMed] [Google Scholar]
- Van Die GC, Collewijn H. Control of human optokinetic nystagmus by the central and peripheral retina: effects of partial visual field masking, scotopic vision and central retinal scotomata. Brain Res. 1986;24:185–194. doi: 10.1016/0006-8993(86)90019-3. [DOI] [PubMed] [Google Scholar]
- Youdas JW, Carey JR, Garrett TR. Reliability of measurements of cervical spine range of motion - comparison of three methods. Phys Ther. 1991;71:98–104. 105–106. doi: 10.1093/ptj/71.2.98. discussion. [DOI] [PubMed] [Google Scholar]


