

Abstract
Na+—Ca2+ exchanger (NCX) protein levels and activity were measured in myocardium from the basal region of the left ventricle of rabbit hearts with significant left ventricular dysfunction (LVD), 8–9 weeks after an apical infarction. NCX protein abundance was higher in the tissue homogenates (121 ± 11 %) and purified membrane fractions (143 ± 12 %) in the LVD compared to the sham-operated (sham) group. NCX mRNA was also higher in the LVD group (126 %). Lower NCX protein expression was observed in the membrane fractions from the epicardium compared to the endocardium in both the sham and LVD groups. Transmembrane currents were recorded in isolated cardiomyocytes by single-electrode voltage clamp; [Ca2+]i was measured using Fura-2. Rapid application of 10 mmol l−1 caffeine was used to induce Ca2+ release from the sarcoplasmic reticulum. The subsequent NCX-mediated Ca2+ efflux rate constant was lower (70 % of sham) in the LVD group. NCX currents were measured in cardiomyocytes dialysed with 250 nm Ca2+ (50 mmol l−1 EGTA). A lower NCX current (75 % of sham) was observed in the LVD group. Lower NCX activity was also observed in cardiomyocytes isolated from the epicardium compared to the endocardium; a transmural difference that was also seen in the LVD group. Reduced activity despite increased protein expression may result from reduced Ca2+ sensitivity of the allosteric regulation of NCX. However, measurements indicated increased Ca2+ sensitivity in the LVD group. Cardiomyocytes from LVD hearts displayed a marked reduction in the transverse tubule area (59 % of sham) and the surface area/volume ratio (80 % of sham). Disrupted transverse tubule structure may contribute to the decrease in NCX activity despite increased protein expression in LVD.
In cardiac muscle, the sarcolemmal Na+-Ca2+ exchanger (NCX) plays an essential role in regulating [Ca2+]i. Changes in the activity of NCX modulate the force of contraction (Terracciano et al. 1998; Schillinger et al. 2000), and may contribute to the poor mechanical function in heart failure. Furthermore, NCX activity is electrogenic and may generate pro-arrhythmic currents in normal and hypertrophic myocardium (Pogwizd et al. 1999). In many animal models of cardiac hypertrophy and heart failure, both NCX expression and activity are increased (Hatem et al. 1994; Studer et al. 1994; Hasenfuss, 1997; Hasenfuss et al. 1999; Pogwizd et al. 1999; Gomez et al. 2002). However, several studies have reported contrary findings (reviewed by Sipido et al. 2002). In a mouse aortic banding model of cardiac hypertrophy, NCX protein and RNA levels were increased but NCX current was decreased (Wang et al. 2001). In a rabbit model of pacing-induced heart failure, NCX expression and current were both decreased (Yao et al. 1997), and reduced NCX function was also seen in a rat infarct model of hypertrophy (Qin et al. 1996). In a recent study, asymmetrical changes in normal and reverse-mode NCX activity accompanied cardiac hypertrophy (Hobai & O'Rourke, 2000).
As well as differences between models of ventricular dysfunction, regional differences may also exist within the same heart. It has been shown that myocytes from the endocardial layer of the left ventricle show distinct changes in electrophysiology and Ca2+ signalling in hypertrophic myocardium that may have proarrhythmic effects (Bryant et al. 1997; McIntosh et al. 2000). In support of this, work by Pogwizd (1995) has indicated that the subendocardial region is the site of premature ventricular electrical complexes in a rabbit model of heart failure. In one study, no endocardial-epicardial gradients in NCX protein expression were observed in normal or failing human hearts (Prestle et al. 1999). However, few studies have examined directly regional NCX activity and expression. The present study presents measurements of NCX activity and expression levels in endocardial and epicardial myocardial samples taken from the base of the left ventricle in rabbit heart 8–9 weeks after an experimentally induced apical infarct, and compares these values with equivalent measurements from sham-operated (sham) hearts.
METHODS
Animal model
A well-characterised model of left ventricular dysfunction (LVD) induced by chronic myocardial infarction was used in this study (Mahaffey et al. 1995; Pye & Cobbe, 1996; Pye et al. 1996; Litwin & Bridge, 1997; Ng et al. 1998; Burton et al. 2000; McIntosh et al. 2000). Procedures were undertaken in accordance with the United Kingdom Animals (Scientific Procedures) Act 1986 and conformed to the Guide for the Care and Use of Laboratory Animals published by the US National Institutes of Health (NIH Publication No. 85-23, revised 1985). Adult male New Zealand White rabbits (2.5-3.0 kg) were given premedication with 0.4 ml kg−1 intramuscular Hypnorm (fentanyl citrate, 0.315 mg ml−1): fluanisone (10 mg ml−1; Janssen Pharmaceuticals). Anaesthesia was induced with 0.25-0.5 mg kg−1 midazolam (Hypnovel, Roche) given via an indwelling cannula in the marginal ear vein. The rabbits were intubated and ventilated using a Harvard small-animal ventilator with a 1:1 mixture of nitrous oxide and oxygen containing 1 % halothane, at a tidal volume of 50 ml and a frequency of 40 min−1. Preoperative antibiotic prophylaxis was given with 1 ml Amfipen (ampicillin 100 mg ml−1, Mycofarm UK) intramuscularly. A left thoracotomy was performed through the fourth intercostal space. Quinidine hydrochloride 10 mg kg−1 (Sigma Pharmaceuticals) was administered intravenously prior to coronary artery ligation, to reduce the incidence of ventricular fibrillation. The marginal branch of the left circumflex coronary artery, which supplies most of the left ventricular free wall, was ligated halfway between the atrioventricular groove and the cardiac apex to produce an ischaemic area of 30-40 % of the left ventricle. As there is relatively little collateral circulation in the rabbit, a homogenous apical infarct was produced occupying on average 14 % of the total endocardial and epicardial surfaces towards the apex of the left ventricle (Burton et al. 2000). Ventricular fibrillation occurred in approximately 30 % of cases, usually 8-12 min following occlusion, and defibrillation was undertaken by applying a 5-10 J epicardial DC shock. Once the animal was stable, the thoracotomy was closed. The animals were then given 20 ml of isotonic saline intravenously to replace perioperative fluid losses, and allowed to convalesce in a warm, clean environment with adequate monitoring for any early signs of distress. Analgesia was given with 0.04 mg kg−1 intramuscular Vetergesic (buprenorphine hydrochloride 0.3 mg ml−1, Reckitt & Colman Products) immediately after surgery and the next morning.
Sham animals underwent thoracotomy with the heart manipulated in a similar fashion except that the artery was not tied. At 8–9 weeks after the procedure, rabbits were given an intravenous injection of 500 U heparin together with an overdose of sodium pentobarbitone (100 mg kg−1) and their hearts were removed. The isolated hearts were subsequently used for isolated cell dissociation or biochemical analysis (see below).
Characteristics of the rabbit model of LVD
Echocardiography was performed 1 week prior to sacrifice to allow the assessment of cardiac function in vivo, using a 5 MHz paediatric probe with a Toshiba sonograph (Sonolayer 100). The rabbits were sedated with 0.3 mg kg−1 Hypnorm and a small area of the anterior chest wall was shaved to allow a satisfactory echo window. The coronary-ligated animals showed significant haemodynamic dysfunction in terms of increased left ventricular end-diastolic dimensions, left atrial dimensions and decreased ejection fraction (Pye et al. 1996; Ng et al. 1998; McIntosh et al. 2000). Evidence of congestion was manifest in significant increases in lung and liver wet weight present at the post-mortem examination. Previous work has shown that this animal model shows significant cardiac hypertrophy, evident as a 20-30 % increase in heart wet weight, left ventricular dry weight (Pye et al. 1996; Ng et al. 1998) and increased cardiomyocyte length (McIntosh et al. 2000). In vivo haemodynamic measurements in this model have revealed a normal cardiac output but raised end-diastolic pressure, and reduced response to an increased pre-load (Pye et al. 1996). Increased inducibility of arrhythmias and lowered fibrillation threshold were observed in vitro (Pye & Cobbe, 1996; Burton et al. 2000), suggesting accompanying electrophysiological dysfunction.
Immunoblot-based protein quantification
Epi- and endocardial samples were dissected from the basal region of the left ventricle, avoiding the infarct and peri-infarct region, in homogenised in ice-cold buffer (20 mmol l−1 Tris/HCl, pH 7.4, 1 mmol l−1 EDTA, 1 mmol l−1 DTT, 1 µg ml−1 leupeptin, 100 µg ml−1 aprotinin, 0.5 mmol l−1 4-(2-aminoethyl)-benzenesulphonyl fluoride, and frozen (−80 °C). SDS-PAGE was performed as described previously (Currie & Smith, 1999) but using the NuPAGE system (Invitrogen) with 4-12 % Bis-Tris gels followed by blotting onto a nitrocellulose membrane (Invitrogen). Membranes were then exposed to the primary antibody (antiserum raised in rabbit against canine cardiac sarcolemmal NCX; Swant, Switzerland, 1:5000). The secondary antibody was a goat anti-rabbit-horseradish peroxidase conjugate (Transduction Laboratories, 1:5000). SDS-PAGE was performed on total homogenate protein (0.5, 1 and 2 µg loads) from endocardium and epicardium (sham and LVD) on the same gel. This controlled for inter-gel variation. In all samples, an immunoreactive band at 120 kDa was evident, representing the mature NCX protein. Commonly, a weaker band was also observed at ≈ 70 kDa; this secondary band has been shown to be a proteolytic subfragment of the full-length NCX (McDonald et al. 2000). Analysis of band density was performed on both the 70 and 120 kDa signals and the two signals were summed to give the final NCX signal. The proportion of 70:120 kDa bands did not vary between the experimental groups. NCX protein abundance was quantified by scanning developed immunoblots using Quantity-One software (BioRad).
Membrane isolation protocol and antibody dilutions
Tissue homogenates were prepared as described above and subsequently centrifuged at 480 g. The resulting supernatant was filtered through two layers of gauze. The pellet was discarded and the supernatant was diluted with an equal volume of ice-cold 1 m KCl and stored on ice for 15 min with occasional mixing. Following centrifugation at 100 000 g for 30 min, the pellet was resuspended in homogenisation buffer. Immunoblotting was performed exactly as described above except that NCX protein was detected with mouse monoclonal anti-NCX1 (Novus-Biologicals, 1:5000).
RNA extraction, reverse transcription and real-time quantitative PCR
Tissue samples (30-50 mg) were placed in RNAlater (Qiagen), homogenised, and a single phenol:chloroform extraction was performed to remove the bulk of the protein and genomic DNA. RNA was isolated using the RNeasy kit (Qiagen). Reverse transcription was performed using 2 µg RNA from each sample with 1 µl Superscript II RT (200 U µl−1; Gibco-BRL), 1 µl random oligonucleotide primers (10 ng µl−1) and 1 µl dNTPs (25 mmol l−1; Promega) at 42 °C for 2 h. TaqMan PCR was performed in triplicate for each sample in an ABI PRISM 7700 Sequence Detection System. Details of the assay are given in the online data supplement.
Cardiomyocyte isolation
Isolated hearts were perfused retrogradely (25 ml min−1, 37 °C) with a nominally Ca2+-free Krebs-Henseleit solution containing 0.6 mg ml−1 collagenase (type 1, Worthington Chemical), 0.1 mg ml−1 protease (type XIV, Sigma) for 6-8 min. The left-ventricular free wall was isolated, and the infarct and neighbouring myocardium (1.5-2 mm border) was carefully dissected away. This procedure ensured that the remaining myocardium did not contain cardiomyocytes from the peri-infarct zone (Licata et al. 1997). The endocardial and epicardial layers of the free wall were isolated from the remaining tissue by dissecting a 1-1.5 mm layer from the epicardial and endocardial surfaces. These two layers of tissue were incubated separately for 5 min in enzyme solution containing 80 µmol l−1 CaCl2 and 4 % bovine serum albumin (BSA, fraction V, Sigma). The cardiomyocyte suspensions were obtained at the end of the incubation period. No differences in the percentage yield of cardiomyocytes was observed either between myocardium from different regions or between experimental groups.
Voltage-clamp and [Ca2+]i measurements
Isolated cardiomyocytes were superfused with a Hepes-based Tyrode's solution at 36-37 °C in a chamber mounted on the stage of an inverted microscope. Voltage clamp was achieved a using an Axoclamp 2A amplifier (Axon Instruments, Union City, CA, USA) in discontinuous (switch clamp) mode. Pipette resistance was 1-2 MΩ for NCX current density studies and 2-5 MΩ for Fura-2 studies. [Ca2+]i was estimated from Fura-2 fluorescence using a dual-wavelength spectrophotometric method (Eisner et al. 1989). Cytosolic loading of Fura-2 was achieved by incubating cells with 5 µm Fura-2-AM at room temperature for 10 min followed by 15 min in the absence of Fura-2-AM. The procedures used to convert Fura-2 fluorescence to [Ca2+]i are detailed in the online data supplement.
Solutions for voltage-clamp recording
The Tyrode's solution contained (mmol l−1): NaCl (140), KCl (4), Hepes (5), MgCl2 (1), CaCl2 (1.8) and glucose (11.1); pH 7.4 with NaOH. This solution was modified as appropriate for each experimental protocol. For NCX activity studies, the superfusate contained added 4-aminopyridine (5 mmol l−1) to block K+ currents) and niflumic acid (0.1 mmol l−1) to block Ca2+-activated Cl− currents). The pipette solution contained (mmol l−1): KCl (20), K aspartate (100), tetraethylammonium chloride (TEACl, 20), Hepes (10), MgCl2 (4.5, calculated free Mg2+ ≈ 0.9 mmol l−1), disodium ATP (4), disodium creatine phosphate (1) and EGTA (0.01); pH 7.25 with KOH. For studies of allosteric regulation of NCX, KCl was replaced with equimolar CsCl, with added strophanthidin (0.01 mmol l−1, to block the Na+/K+ pump), nifedipine (0.01 mmol l−1, to block ICa,L) and niflumic acid (0.1 mmol l−1). The pipette solution was as for NCX activity studies, but with Cs+ in place of K+. For NCX current density studies, the superfusate was also K+-free, containing CsCl instead of KCl, with added strophanthidin (0.01 mmol l−1) and nifedipine (0.01 mmol l−1). The pipette solution contained (mmol l−1): CsCl (45), EGTA/CaEGTA (Cs+ 100, EGTA 50, Ca2+ 25), Hepes (20), MgCl2 (11, calculated free Mg2+ ≈ 1.2 mmol l−1) and Na2ATP (10); pH 7.25. This pipette solution was designed to buffer [Ca2+]i to ≈ 250 nmol l−1 (conditions were confirmed in Fura-2-loaded cells, data not shown).
Electrophysiology protocols
NCX-mediated Ca2+ efflux
Cardiomyocytes were held at -80 mV and depolarised to 0 mV for 150 ms every 1 s for 30 s to achieve steady-state contractions. NCX activity was then estimated by rapidly switching to 10 mmol l−1 caffeine to cause Ca2+ release from the sarcoplasmic reticulum (SR), and examining the rate constant of Ca2+ decay (see Fig. 2). In the continued presence of caffeine, the SR is unable to re-accumulate Ca2+ and elimination of Ca2+ is mainly due to NCX. A correction was made for non-NCX Ca2+ removal mechanisms estimated from the Ca2+ decay obtained by rapidly switching to 10 mmol l−1 caffeine in the presence of 10 mmol l−1 Ni2+ (Diaz et al. 1997).
Figure 2. NCX-mediated Ca2+ efflux.
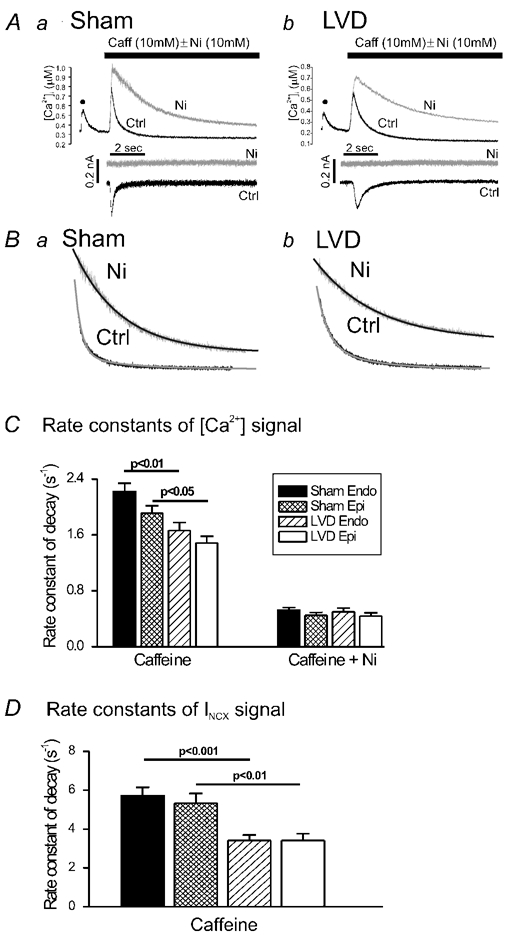
A, [Ca2+]i and membrane current records from single voltage-clamped cardiomyocytes after rapid application of 10 mmol l−1 caffeine (caff). The control trace (black) shows the [Ca2+]i signal in response to the last depolarisation (•) of a 30 s train of 1 Hz depolarising pulses (150 ms duration) followed by rapid application of 10 mmol l−1 caffeine (Ctrl). The superimposed [Ca2+]i signal (grey) occurred in response to caffeine in the presence of 10 mmol l−1 Ni2+ (Ni). Corresponding membrane current traces are shown below, with Ctrl and Ni traces displaced vertically for clarity. B, decay phases of the caffeine-induced Ca2+ signal and the best-fit, single-exponential decay curve. C, averaged Ca2+ decay rate constants in response to caffeine (10 mm) in cardiomyocytes isolated from sham endocardial (Sham Endo; n = 44), sham epicardial (Sham Epi; n = 43), LVD endocardial (LVD Endo; n = 51) and LVD epicardial (LVD Epi; n = 44) regions (statistically significant results are indicated above columns). The Ca2+ decay rate constants in response to caffeine in the presence of Ni2+ (10 mm) are shown on the right-hand panel: sham endocardial (n = 16), sham epicardial (n = 11), LVD endocardial (n = 11), LVD epicardial (n = 14). D, INCX rate constant of decay for each cell type: sham endocardial (n = 42), sham epicardial (n = 43), LVD endocardial (n = 44) and LVD epicardial (n = 40). The filled bar corresponds to that shown in C.
NCX current density
After achieving the whole-cell configuration, a period of 5-10 min was allowed for dialysis of the pipette solution into the cell. Currents were then measured in response to a 3 s ramp from -120 mV to +80 mV from the holding potential of -80 mV. An ascending ramp was chosen since this has been shown to cause less perturbation of subsarcolemmal [Ca2+] than a descending ramp, and the resulting currents are closer to those obtained using a voltage-step protocol (Convery & Hancox, 1999). The ramp protocol was performed at 0.1 Hz, when steady-state currents were achieved; data from 12 ramps were recorded for subsequent averaging.
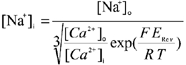
The protocol was repeated in the presence of 5 mmol l−1 Ni2+ to obtain the background current, and this was subtracted to obtain the current attributable to NCX (INCX; see Fig. 3). Current-voltage (I-V) curves were fitted using the model of NCX function given below. Since [Na+]i is hard to buffer, subsarcolemmal [Na+] was calculated based on the reversal potential of the NCX I-V curve using:
 |
(1) |
where ERev is the reversal potential, F = 96 500 C mol −1, R = 8.3143 J mol−1 K−1 and T = 310 K. The calculated value of [Na+]i for each cell was then used in the NCX model. There was no significant difference in measured reversal potential of INCX (and therefore the calculated [Na+]i) between control and LVD cardiomyocytes (17.3 ± 0.3 mmol l−1, n = 48vs. 17.7 ± 0.3 mmol l−1, n = 29). These values are close to the concentration of Na+ in the pipette (20 mmol l−1), indicating that subsarcolemmal [Na+]i is close to that intended.
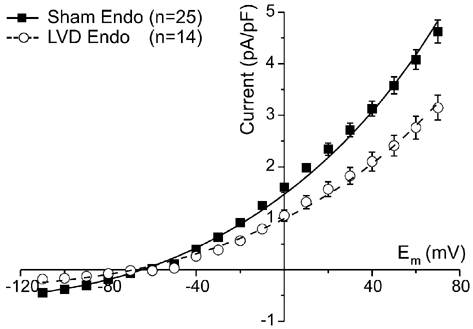
Figure 3. NCX I-V relationship.
A, the ascending voltage ramp protocol (−120 to +80 mV in 3 s) applied to a single ventricular cardiomyocyte and the associated membrane currents in the absence and presence of 5 mmol l−1 Ni2+ (the zero current level indicated by the horizontal line).The Ni2+-sensitive signal (lower panel) represents the current carried by NCX (INCX). This protocol was used to generate the average I-V relationships shown in B for sham endocardial cardiomyocytes (n = 25 cells from four hearts), sham epicardial myocytes (n = 23 cells from four hearts), LVD endocardial cardiomyocytes (n = 14 cells from four hearts) and LVD epicardial myocytes (n = 15 cells from four hearts). The average currents at -110 mV and +70 mV are shown in C. INCX is higher in myocytes from endocardial compared to epicardial samples of both sham and LVD groups (*P < 0.05, **P < 0.01, ***P < 0.001), although for LVD cells at -110 mV, this did not quite reach significance (P = 0.067). INCX is significantly lower in cardiomyocytes from corresponding regions of the LVD group compared to sham hearts (+P < 0.05, ++P < 0.01, +++P < 0.001).
Allosteric regulation of NCX
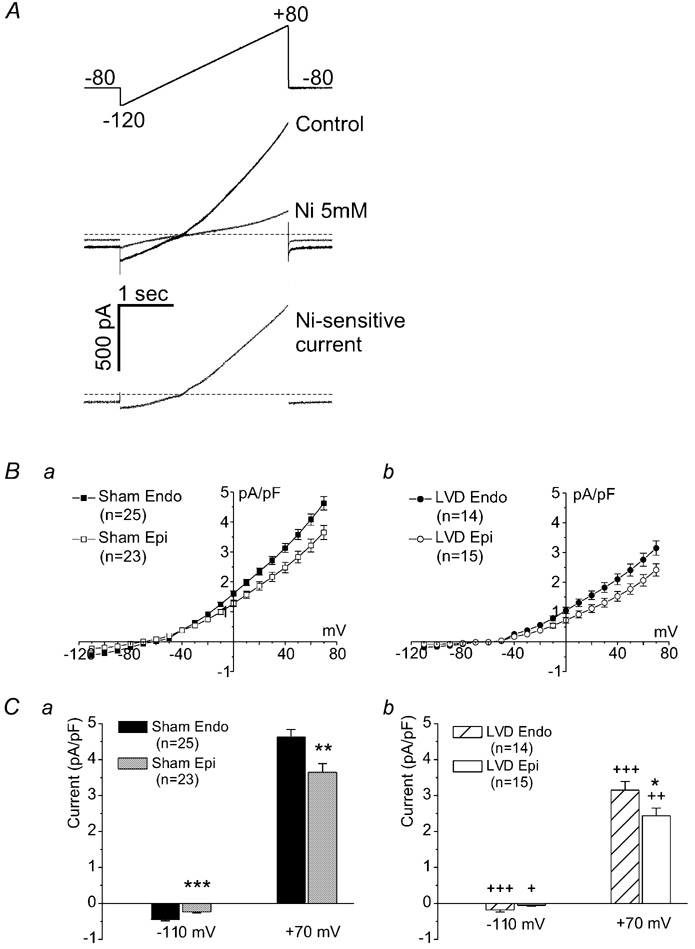
The protocol used to examine allosteric regulation of NCX was based on that of Weber et al. (2001). In the absence of allosteric regulation of NCX by [Ca2+]i, the outward (reverse-mode) INCX will fall as [Ca2+]i rises, since the gradient for Ca2+ across the membrane will be reduced. However, if allosteric regulation is present, then increasing [Ca2+]i will initially increase the outward current. Cells were pre-treated with 1 µm thapsigargin for 5 min to eliminate SR Ca2+ uptake. Caffeine (10 mmol l−1) was then applied to confirm that the SR was empty and function was disabled. Cardiomyocytes were held at -100 mV to lower [Ca2+]i and then stepped 20 times to +100 mV, with 100 ms intervals between each step. The duration of the voltage pulse (100 or 200 ms) was chosen for each cell to produce a rise in [Ca2+]i within a physiological range (see Fig. 5). The protocol was repeated in the presence of 10 mmol l−1 NiCl2 and the background current generated was subtracted. The resulting difference current and [Ca2+]i were averaged for each voltage step to yield a plot of current against [Ca2+]i.
Figure 5. Allosteric regulation of INCX.
Aa, voltage-clamp protocol used to investigate the allosteric regulation of NCX by [Ca2+]i. Cardiomyocytes were alternately clamped at -100 and +100 mV, as described in Methods. Ab, [Ca2+]i and current traces recorded on addition of 10 mmol l−1 Ni2+. The difference current is shown in Ac. B, for each voltage step, mean current was plotted against mean [Ca2+]i and the resulting data points were fitted using eqn (2) (see Methods) to generate a Km for Ca2+ activation (KmCaAct).
INCX simulation
Data from the studies of current density and allosteric regulation were fitted using the model of Weber et al. (2001; eqn (2). Briefly, INCX is taken as the product of an electrochemical factor and an allosteric factor. The electrochemical factor incorporates Vmax (the maximal turnover rate of NCX, which is assumed to be equal for forward and reverse flux), the internal and external concentrations of Ca2+ and Na+, the membrane voltage (V), the position of the energy barrier in the membrane electric field (ε) and dissociation constants (Km) for each ion on either side of the membrane. The allosteric factor represents regulation of NCX as an instantaneous Hill equation for Ca2+ binding to the regulatory site with an affinity constant KmCaAct.
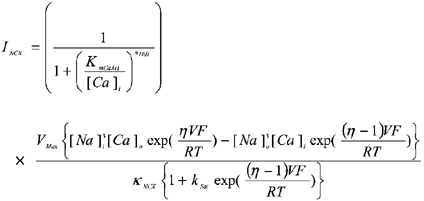 |
(2) |
 |
(2a) |
Details of the model are given elsewhere (Weber et al. 2001). The parameters used in this model are listed in Table 1. Fitting of INCX data to eqn (2) were performed using Origin (Microcal). Normally, only one constant (either Vmax, KNCX or KmCaAct) is allowed to vary. The best-fit parameter value is expressed with its computed asymptotic standard error.
Table 1.
Fixed terms used in NCX simulations
| Term | Value | Term | Value |
|---|---|---|---|
| KmNao | 87.5 mmol l−1* | [Na+]o | 140 mmol−1 |
| KmNai | 12.3 mmol l−1* | [Na+]i | 17.5 mmol l−1† |
| KmCao | 1.30 mmol l−1* | [Ca2+]o | 1.8 mmol l−1 |
| KmCai | 0.003 6 mmol l−1* | [Ca2+]i | 250 mmol l−1 |
| ksat | 0.27 mmol l−1* | — | — |
| η | 0.35* | — | — |
| ηHill | 2* | — | — |
Sources are described in Weber et al. (2001).
Based on the reversal potential of INCX. The patch-pipette solution contained 20 mM Na+.
Analysis of T-tubular density using di-8-ANEPPS staining
Isolated cardiomyocytes were suspended in Tyrode's solution containing 10 µmol l−1 4-[2-[6-(dioctylamino)-2-naphthalenyl]ethenyl]1-(3-sulfopropyl)-pyridinium (di-8-ANEPPS) for 10 min. After washing, the cells were placed on a coverslip-bottomed bath (200 µl volume) of a Nikon Eclipse inverted microscope using a Nikon × 40 oil-immersion objective (NA 1.4). Confocal images of di-8-ANEPPS fluorescence were obtained with a BioRad 2000 system using the 488 nm line of a Ar-Kr laser. The iris diameter was set at 1.9 mm, providing an axial (Z) resolution of ≈ 0.9 µm and X-Y resolution of ≈ 0.5 µm, based on full-width, half-maximal amplitude measurements of images of 0.1 µm fluorescent beads (Molecular probes). Data were acquired in image-scan mode at 2 ms line−1, 512 pixels scan−1, 512 lines image−1, each section was Kalman averaged four times. A series of images in the Z-axis was taken every 0.5 µm from the top surface of the cardiomyocyte to the bottom. Pixels associated with peripheral sarcolemma (i.e. around the edge of the cell, avoiding areas of intercalated discs) were sampled and the intensity distribution of these pixels was used to determine the threshold for pixels within the cell that could be attributed to the membrane. Pixels with an intensity of greater than or equal to the mean pixel value of the peripheral sarcolemma were attributed to the T-tubule. This criterion allowed the generation of a binary image of the cell, with white pixels presenting areas of internal membrane. Based on the original cell boundaries, the longitudinal axis of the cell was split into 10 equal segments and the percentage of pixels positive for di-8-ANEPPS staining was calculated relative to the total number of pixels occupied by the width of the cell in that segment. This analysis was applied to the central 10-15 sections (5-7.5 µm slice) in each cardiomyocyte, thus avoiding oblique sections on the upper and lower surfaces and ensuring that measurements were made from a region where cell length is approximately uniform.
Statistical analysis
Data from endo- and epicardial regions and from different experimental groups were compared using one-way ANOVA followed by Tukey-Kramer multiple comparisons post hoc test. Correlations were examined by linear regression analysis. Data are presented as mean ± s.e.m., and P < 0.05 was considered significant.
RESULTS
NCX protein and mRNA
Figure 1A indicates that NCX expression in epicardial membrane fractions was significantly lower than in endocardial samples (72 ± 0.9 and 73 ± 1.1 % for sham and LVD, respectively, P < 0.05). When comparisons were made between LVD and a sham sample, NCX was more abundant in the LVD groups (both endocardial 144 ± 11 % n = 6 and epicardial 142 ± 19 % n = 6, P < 0.05). Combining the relative change in NCX expression from endocardial and epicardial samples indicated a higher expression of NCX in the LVD group (143 ± 12 % n = 12, P < 0.05). Comparing LVD and sham tissue homogenate samples from each region, both endo- and epicardial samples indicated a trend towards higher levels, but the difference was not significant (results not shown). When the relative changes of NCX in both endo- and epicardial samples were combined, LVD NCX abundance was significantly greater than in sham animals (121 ± 0.11 %, P < 0.05). Figure 1B shows the results of mRNA measurements from tissue homogenates isolated from endocardial and epicardial regions, expressed relative to GAPDH mRNA levels. In neither region were the differences between sham and LVD significant, but combining endocardial and epicardial samples (Fig. 1Bb) indicates that mRNA was significantly increased in the LVD group (sham, 0.051 ± 0.05; LVD 0.064 ± 0.06, n = 12; P < 0.05).
Figure 1. NCX protein and mRNA measurements.
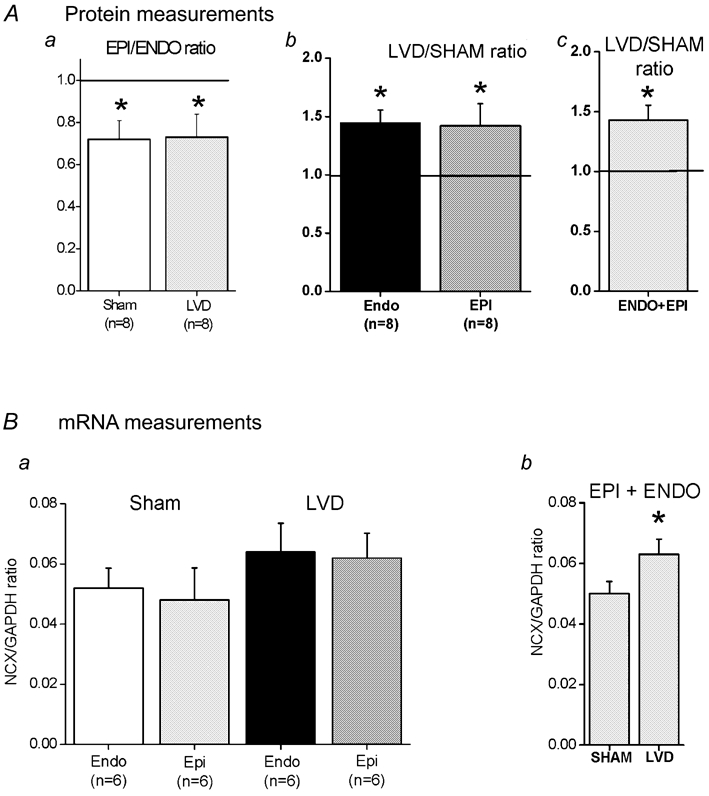
Aa, relative NCX protein abundance in epicardial myocardial membrane fractions compared to the corresponding endocardial sample (Epi/Endo). Separate values are shown for sham and LVD groups. Ab, relative NCX protein abundance in LVD myocardial membrane fractions compared to the corresponding region in a sham heart. Separate values are shown for endocardial (Endo) and epicardial (Epi) groups. Ac, the combined results of relative NCX protein abundance in LVD myocardial membrane fractions compared to sham samples (endocardial and epicardial samples combined). The ratio of 1.0 is marked as a horizontal line. Columns are means ± s.e.m. (the number of hearts in each group is shown below the column). Ba, NCX mRNA levels measured relative to GAPDH in myocardial homogenates in sham and LVD groups. Bb, combined NCX mRNA levels from both endocardial and epicardial samples in sham and LVD groups. *P < 0.05.
Measurements of NCX-mediated Ca2+ efflux
Figure 2A illustrates the protocol used to assess NCX-mediated Ca2+ efflux in isolated cardiac cardiomyocytes. Under these experimental conditions, the transient inward current accompanying the caffeine-induced Ca2+ release is due to Ca2+ extrusion via NCX. On repeating the protocol but applying 10 mmol l−1 Ni2+ just prior to caffeine, the caffeine-induced Ca2+ transient decayed more slowly (via Ca2+ efflux on sarcolemmal CaATPase) and the transient inward current was abolished. Both effects verify the complete inhibition of NCX by Ni2+. As shown in Fig. 2Ba and b, the decays of the caffeine-induced Ca2+ signals were fitted by a single exponential and the rate constant was used as a measure of the rate of extrusion of Ca2+ from the cytosol. The rate constant for both endocardial and epicardial cells in the LVD group was significantly less than in the sham group (Fig. 2C). In contrast, none of the efflux rate constants measured in the presence of Ni2+ were significantly different (Fig. 2C). These results suggest that NCX-mediated Ca2+ efflux rate was less in both endocardial and epicardial cardiomyocytes in the LVD group. In both the sham and LVD groups there was a trend towards lower efflux rates in cells isolated from the epicardium, but in neither region was this effect significant. Figure 2D indicates that the rate constant for the decay of INCX was significantly less in the LVD group; again there were no significant regional differences. Changes in the time course of INCX were accompanied by a significant decrease in the amplitude of the caffeine-induced current in LVD (2.53 ± 0.21 pA pF−1vs. 1.18 ± 0.11 pA pF−1, P < 0.0001); again, no significant regional differences in INCX amplitude were observed (results not shown).
NCX I–V relationship
Figure 3 documents measurements of the I-V relationship for NCX. Ascending ramp clamps (Fig. 3A) with and without 5 mmol l−1 Ni2+ were used to assess the Ni2+-sensitive current that was attributed to INCX. Figure 3B shows the average I-V relationships for cardiomyocytes isolated from endocardial and epicardial regions of sham (Ba) and LVD (Bb) groups. The currents measured at both negative and positive potentials indicate a larger INCX in endocardial cardiomyocytes compared to epicardial cells in both the sham and LVD groups (Fig. 3C), with mean data at representative voltages (−110 and +70 mV) illustrated in Fig. 3Ca (sham) and (Cb) (LVD). However, in cardiomyocytes from the LVD group, INCX was less (70-72 %) than in the equivalent regions in sham hearts.
Modelling of NCX
The basis for the divergent changes of protein and activity in LVD may be modification of the properties of NCX protein within the sarcolemma. The NCX I-V relationship was simulated to investigate whether changes in Vmax, KNCX and KmCaAct have equivalent effects on the I-V relationship of NCX. Figure 4 repeats experimental data from Fig. 3 for endocardial myocytes, indicating a reduced INCX in the LVD group. The sham data were fitted by eqn (2) (Methods) using values for KNCX and KmCaAct from the literature (Weber et al. 2001) and determining the best fit value of Vmax (Table 2, Sham). The LVD data set was fitted in three different ways: (1) by varying Vmax with constant KNCX and KmCaAct (LVD (a)), (2) by varying KNCX with constant Vmax and KmCaAct (LVD (b)) and (3) by varying the KmCaAct value with constant Vmax and KNCX (LVD (c)). All three manipulations produced equivalent changes in the I-V relationship and therefore suggest potential mechanisms for altered NCX activity in LVD.
Figure 4. Fitting of model to INCX measurements.
Averaged INCX data for endocardial cardiomyocytes from the sham and LVD groups. The solid and dashed lines are the best-fit simulated INCX curves generated by eqn (2) (see Methods). The Vmax required to fit the two data sets is shown in Table 2 assuming fixed constants KNCX and KmCaAct (Table 2, columns Sham and LVD (a)). The same curve through the LVD data could also be obtained by fixing the Vmax (16.7 pA pF−1) and KmCaAct (125 nm) and increasing the KNCX value (Table 2, column LVD (b)). Alternatively, the same curve could be obtained by fixing the Vmax and KNCX (47.3 nm) to that of the sham group and increasing KmCaAct (Table 2, column LVD (c)).
Table 2.
Terms used to fit NCX I–V data
| Parameter | Units | Sham | LVD(a) | LVD(b) | LVD(c) |
|---|---|---|---|---|---|
| Vmax | pA pF−1 | 16.7 | 10.8 | 16.7 | 16.7 |
| KNCX | mmol l−1 | 47.3* | 47.3* | 86.6 | 47.3* |
| KmCaAct | mmol l−1 | 125.0* | 125.0* | 125.0* | 246.2 |
Values from Weber et al. (2001). Numbers in bold are the values that provided the best fit curve to the data (see Fig. 4).
Measurement of the Ca2+ sensitivity of allosteric regulation of NCX
As shown above, one explanation for the divergent changes of NCX protein abundance and activity in the LVD model may be a decreased Ca2+ sensitivity of the allosteric regulation of NCX (KmCaAct). The following experiment was designed to measure the KmCaAct in sham and LVD cardiomyocytes. Figure 5A shows the protocol used to measure NCX activity at different values of [Ca2+]i. The train of voltage-clamp pulses caused a slow increase in [Ca2+]i and in the level of inward and outward currents. Background currents were measured by repeating the protocol in the presence of 10 mmol l−1 Ni2+ (Fig. 5Ab). Subtracting these currents (Fig. 5Ac) revealed the relationship between the Ni2+-sensitive current and [Ca2+]i (Fig. 5Ac). Results from individual cells were fitted to generate KmCaAct values (Fig. 5B). On average, the KmCaAct in sham cardiomyocytes was 375 ± 62.4 nmol l−1 (n = 22) compared with 206 ± 42.4 nmol l−1 (n = 18) in cardiomyocytes from the LVD group (P < 0.05). One potential mechanism to explain the lower NCX activity in LVD would be for the exchanger in LVD cells to have a lower sensitivity to allosteric regulation by Ca2+ (see Table 2). These data show that this was not the case; in fact the opposite was true - NCX was more sensitive to Ca2+ in LVD.
T-tubule density in cardiomyocytes
Measurements of T-tubule density were made using the fluorescent dye di-8-ANEPPS. Figure 6A shows confocal sections of stained cardiomyocytes. As detailed in Methods, eight-bit fluorescence images (e.g. Fig. 6Aa and b) were used to generate binary images of internal membranes staining positively with di-8-ANEPPS. This latter image was then divided into 10 equal segments, as indicated in Fig. 6Ba and b. These images were used to estimate the proportion of the original area of this segment containing T-tubule membrane. These measurements were repeated for 10-15 central sections of each cardiomyocyte to build up an average picture of the T-system staining in each cell. As shown in Fig. 6Bb, cells from the LVD group frequently displayed many areas devoid of T-tubules. Serial images of T-system structures throughout the depth of sample myocytes are shown in the online data supplement. When results from a number of cells were averaged, it became clear that the relative cell area containing membrane decreased from ≈ 20 % at the centre of the cardiomyocyte to ≈12 % at the end of the cell (Fig. 6B). A similar pattern was observed in the cells from the LVD group, but T-tubule staining was considerably lower, on average 59 % of sham cells.
Figure 6. T-tubular structure in cardiomyocytes from sham and LVD hearts.
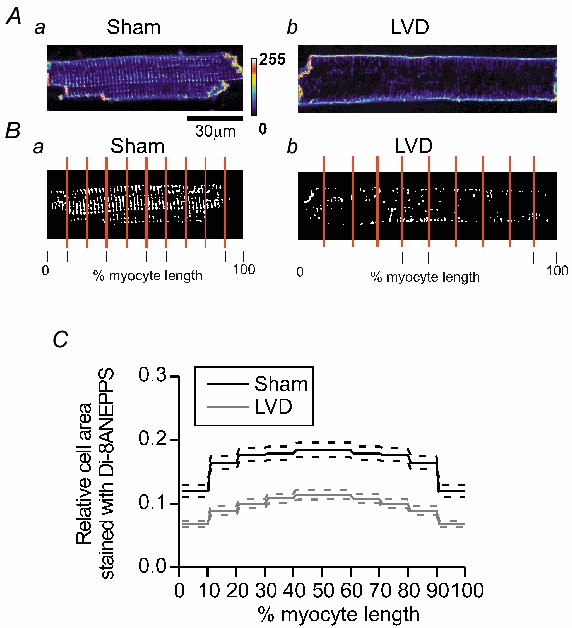
A and B, sample confocal images and the corresponding binary image of di-8-ANEPPS fluorescence from single cardiomyocytes isolated from the left ventricle of a sham heart, Aa and Ba, and an LVD heart, Ab and Bb. C, mean values for relative areas of membrane staining with di-8-ANEPPS in sham (n = 26 cells, five hearts) and LVD myocytes (n = 26 cells, six hearts) in five length segments from the mid-point to the end of the cell. The dashed lines represent ± s.e.m. values.
Membrane surface-area/cell-volume (SA/V) ratio in sham and LVD cardiomyocytes
Lowered T-tubule density in myocytes from the LVD group should be reflected in an altered relationship between cardiomyocyte membrane surface area and myocyte volume. This was examined by estimating cardiomyocyte volume from cell length and widths, assuming a cylindrical shape. This assumption is an over-simplification, since cardiomyocytes have an oval rather than circular cross-section, but major and minor diameters vary in parallel in both normal and hypertrophied hearts (Satoh et al. 1996). Therefore this method provides an estimate of the relative increase in myocyte volume. As shown in Table 3, myocytes isolated from the endocardium of sham hearts were significantly longer and wider than those isolated from the epicardium, and this difference was reflected in higher capacitance measurements (made in a separate group of myocytes prior to electrophysiological studies). These regional differences were diminished in the LVD group, reflecting the relatively greater increase in cell dimensions in epicardial myocytes in LVD. Cells from endocardial and epicardial regions in LVD had significantly larger dimensions and higher capacitances than cells from corresponding regions in sham hearts. Table 3 also shows that a similar SA/V ratio applies to endocardial and epicardial cells in sham hearts, despite differences in cell size. However, the SA/V ratio was reduced in the LVD group to 81-82 % of the sham group. This result is consistent with the reduced area of the T-tubule system observed in the LVD group (Fig. 6).
Table 3.
Average left ventricular (base) cell dimensions and capacitance
| Sham group | LVD group | |||
|---|---|---|---|---|
| Parameter | Epi | Endo | Epi | Endo |
| Length (μm) | 134.8 ± 0.3† | 140.4 ± 0.3 | 151.9 ± 0.4* | 153.8 ± 0.3* |
| Width (μm) | 27.3 ± 0. 1† | 29.5 ± 0.11 | 31.8 ± 0.1* | 31.0 ± 0.1* |
| Volume (pl)† | 78.7 ± 0.4† | 92.7 ± 0.4 | 121.2 ± 0.5* | 116.0 ± 0.4* |
| Capacitance (pF) | 116.2 ± 3.8† | 136.0 ± 4.6 | 147.0 ± 5.1* | 138.0 ± 5.0* |
| Surface-to-volume ratio (pF pl−1) | 1.47 | 1.46 | 1.21 | 1.19 |
Measurements of cell dimensions are based on the following cell numbers: sham epicardial (Epi), 334; sham endocardial (Endo), 368; LVD epicardial, 276; LVD endocardial, 325. Measurements of cell capacitance are based on the following cell numbers: sham epicardial, 49; sham endocardial, 46; LVD epicardial, 41; LVD endocardial, 40.
Significant difference between epicardial and endocardial cells in each experimental group, P < 0.05
significant difference between equivalent regions in Sham and LVD groups at the level of P < 0.05. Cell volumes are calculated assuming the myocyte has cylindrical geometry. A membrane surface area/cell volume ratio index (surface-to volume ration) was calculated by the ratio of mean cell capacitance to mean cell volume.
DISCUSSION
The aim of this study was to examine the relationship between NCX expression and activity in endocardial and epicardial regions of the base of the left ventricular free wall in both sham and LVD groups. Endocardial and epicardial regions were examined separately because previously published work suggested the existence of differential expression of NCX across the wall of the left ventricle (Prestle et al. 1999). In addition, it is possible that changes in the expression of NCX associated with LVD are different across the ventricular wall.
NCX expression
Measurements of NCX protein from tissue homogenates did not show a clear difference between endo- and epicardial regions. Overall, however, NCX expression was increased in the LVD group (121 ± 0.11 %). More detailed measurements on sarcolemmal membrane preparations using a monoclonal anti-NCX1 antibody revealed a much clearer increase in NCX protein in the LVD group. This was true for endocardial (144 %) and epicardial (142 %) samples. In addition, endocardial NCX protein levels were significantly greater than epicardial levels in sham (132 %) and LVD (137 %) tissue. Corresponding NCX mRNA measurements on left ventricular tissue showed an increase (126 % higher in LVD), supporting the conclusion that this model of LVD was associated with a moderate increase in NCX expression. Why more consistent differences in protein expression were obtained from the membrane fractions compared to tissue homogenates is unknown. The monoclonal antibody used to probe the membrane fraction produced less non-specific binding compared with the polyclonal antibody used on homogenate preparations. It is also possible that tissue homogenates may include NCX proteins from regions of the cell other than the sarcolemma. Evidence exists for NCX in the mitochondrial membrane in cardiac muscle (Gunter et al. 2000). Although structurally distinct, sufficient homology may exist to cross-react with the polyclonal antibody used in these measurements. The increase in NCX expression observed in this model of LVD is less than previously reported in other rabbit models (Pogwizd et al. 2001) and in human heart failure (Hasenfuss et al. 1999). However, these studies examined NCX expression and activity after a longer period of myocardial dysfunction (> 4 months). The values reported in this study may represent an earlier time-point in the development of heart failure.
Differences in NCX activity between the endo- and epicardium
No clear endocardial-epicardial differences emerged from the measurements of NCX-mediated Ca2+ extrusion (Fig. 2). However, in separate ramp-clamp experiments, a distinctly larger INCX was observed in endocardial compared to epicardial cardiomyocytes in both the sham and LVD groups (Fig. 3). This endocardial-epicardial difference in NCX activity parallels the difference in protein abundance measured in membrane fractions (Fig. 1C). The reason why regional differences in NCX activity were not observed in terms of Ca2+ efflux rate (or INCX decay rate constant) is unknown. One possibility is that the differences in NCX activity between endocardial and epicardial regions may be masked by regional differences of [Na+]i (Chamunorwa & O'Neill, 1995). Therefore, differences would only emerge when [Na+]i (and [Ca2+]) are standardised, as was the case during the measurements of the NCX I-V curve (Fig. 3). Since NCX contributes an outward current and inward Ca2+ flux during the action potential and yet is the predominant sarcolemmal Ca2+ efflux mechanism during diastole, the functional consequences of higher NCX activity in subendocardial myocytes compared to those in the subepicardial region are not clear. Currently no studies have examined specific downregulation of NCX; specific upregulation of NCX was accompanied by reduced SR Ca2+ content and negative inotropy in cultured rabbit myocytes stimulated at subphysiological rates (Schillinger et al. 2000), but the net effect may depend on species and stimulus rate (for review see Sipido et al. 2002). It is interesting to speculate that increased NCX activity may be necessary in subendocardial myocytes to counter the effects on cellular Ca2+ loading of the longer action potential duration observed in this region compared to subepicardial cells (McIntosh et al. 2000).
Altered NCX activity in LVD
NCX-mediated Ca2+ efflux and NCX current were significantly decreased in LVD (Fig. 2 and Fig. 3). This was observed in both endocardial and epicardial regions (to ≈ 75 % of sham values) and in both the forward and reverse modes of the exchanger (Fig. 3). No significant changes in the reversal potential of INCX were noted, suggesting that LVD is not associated with changes in the stoichiometry of NCX. The comparable downregulation of NCX-mediated Ca2+ efflux observed in stimulated myocytes with minimal intracellular dialysis (Fig. 2), and the NCX I-V curve obtained in myocytes dialysed with EGTA and 20 mm Na+ (Fig. 3) indicate that altered intracellular conditions, as may occur in LVD (e.g. raised [Na+]i or decreased pHi) is not a major cause of reduced NCX activity in this animal model. The consequences of reduced NCX activity on myocyte function in LVD is not examined in this study. As discussed above, specific upregulation of NCX led to a reduced SR Ca2+ content and myocyte contractility (Schillinger et al. 2000); therefore, reduced NCX activity may enhance SR Ca2+ load, enhance the amplitude of the Ca2+ transient and raise diastolic [Ca2+]. This latter effect may contribute to the diastolic dysfunction reported previously in this model (Ng et al. 1998) and seen commonly in human heart failure. Increased SR Ca2+ content as a consequence of reduced NCX activity may offset the effects of reduced sarcoplasmic/ endoplasmic reticulum Ca2+-ATPase expression observed in this model (Currie & Smith, 1999). However, enhanced cellular and SR Ca2+ loading may also increase the probability of spontaneous Ca2+ release from the SR, a cause of delayed after-depolarisation. Since the current generated by NCX is one of the main current sources for delayed after-depolarisations, the net effect of downregulation of NCX on the susceptibility to arrhythmias is difficult to predict. In the present study, the relative down-regulation of NCX activity was equivalent in both subepicardial and subendocardial regions; therefore this change would not selectively predispose either one of these regions to abnormal electrical or contractile activity.
Verification of NCX protein abundance and activity measurements
One way to explain the paradoxical increase in NCX protein but reduction in activity would be if either the Western blot assay or the electrophysiological measurements were not sensitive enough to reveal changes in NCX abundance/ activity and that other methodological factors generate the variation observed. To test this, cardiac cells were transfected with canine NCX (see Supplemental data). Western blots identical to those used for the sham and LVD experimental groups revealed an increase in the density of antibody binding at 120 kDa consistent with an increase in protein expression. Measurements of NCX activity using the ramp-clamp protocol revealed larger currents. This suggests that both assays are sufficiently sensitive. Taken with the parallel differences observed in endo-epicardial abundance and activity, these data suggest that it is highly unlikely that the divergence in NCX abundance and NCX activity observed in LVD is due to artefact.
Can changes in the intrinsic properties of NCX account for reduced activity?
Three alternative possibilities were considered in this study: (1) reduced Vmax of NCX in LVD, which would be equivalent to a reduced number of active NCX units or reduced turnover rate of individual units; (2) reduced affinity of NCX for Ca2+ and Na+ (KNCX); (3) reduced sensitivity of the allosteric regulation of NCX by Ca2+ (KmCaAct). As Fig. 4 shows, simulating these changes indicates that all three can cause identical changes in the shape of the I-V curve and therefore cannot be distinguished on the basis of the I-V curve alone. Separate measurement of Ca2+-dependent allosteric regulation suggests that the Ca2+ sensitivity of NCX is increased in LVD (Fig. 5). The value of KmCaAct measured in sham hearts is higher than those measured previously for ferret and dog NCX (Weber et al. 2001). The decreased KmCaAct value observed in the LVD group is the first reported change in allosteric regulation of NCX in an animal model of heart failure. Previous studies have shown that experimental mutation of residues close to the Ca2+ regulatory regions of the NCX protein dramatically alter the Ca2+ sensitivity of this site (Matsuoka et al. 1995). Therefore, one possible explanation for the increased Ca2+ sensitivity is expression of other isoforms of NCX in LVD (e.g. a splice variant of NCX other than the cardiac isoform, NCX1.1). For example, a recent report suggests that the renal isoform (NCX1.3) has a different Ca2+ sensitivity to the cardiac isoform (Ruknudin et al. 2000).
If the change in KmCaAct observed in LVD is factored into the simulation of NCX activity in LVD, the reduction in Vmax or ion affinity (KNCX) required to model the change in I-V is even more marked (≈ 40 % of sham values). Thus the increased sensitivity of NCX to allosteric Ca2+ regulation may act to partially compensate for the loss of the total number of NCX units available (Vmax). The alternative option of reduced affinity of NCX for Ca2+ and Na+ in LVD (i.e. lower KNCX in eqn (2)) was not tested experimentally in this study. Previous studies have suggested that the cardiac isoform (NCX1) is capable of being phosphorylated by both protein kinase A (Ruknudin et al. 2000) and protein kinase C (Iwamoto et al. 1996). Phosphorylation by either kinase increases NCX activity (Iwamoto et al. 1996; Perchenet et al. 2000; Ruknudin et al. 2000). Therefore, decreased phosphorylation of NCX could lead to a net reduction of NCX activity despite increased NCX expression. The phosphorylation status of proteins is altered in heart failure (Carr et al. 2002), for example phospholamban phosphorylation is decreased in some models of heart failure (Huang et al. 1999), but the phosphorylation state of NCX is unknown. An alternative explanation is the expression of a different isoform of NCX in LVD that is functionally distinct but cannot be differentiated by immunoblot techniques nor the NCX mRNA probe. These options require further investigation.
Is there a link between a disrupted T-tubule network and reduced NCX activity?
This study reported a diminished T-system staining by di-8-ANEPPS in the LVD group, suggesting that less of the T-tubule system has access to the extracellular space in LVD. A reduction in T-tubule membrane area has been reported previously in other animal models (He et al. 2002; Balijepalli et al. 2003) and in human heart failure (Soeller & Cannell, 1999). A reduction in the amount of functional T-tubule membrane was also indicated by the reduction in SA/V ratio noted in both endocardial and epicardial myocytes in LVD (Table 3). The reduced SA/V ratio is not simply a consequence of larger cardiomyocytes because, within the sham group, endocardial and epicardial myocytes had similar SA/V ratios despite significant differences in cell dimension.
Previous work has indicated that NCX is located almost exclusively in the T-tubule membrane network of cardiac cardiomyocytes (Frank et al. 1992; Yang et al. 2002), while others show a more uniform distribution (Kieval et al. 1992). These observations provide a further paradox: if NCX protein is expressed mainly in the T-system, how can the increased expression of NCX protein (to ≈ 140 %) and reduced T-system (to ≈ 60 %) be reconciled? In one study, de-tubulation of cardiomyocytes using an osmotic shock treatment abolished the Ni2+-sensitive current (INCX) and decreased the Ca2+ efflux rate from the rat cardiomyocyte (Yang et al. 2002). This treatment also dramatically reduced the T-system staining by di-8-ANEPPS. Yet the acute nature of the treatment meant that total NCX protein would not have been affected. Thus one possible explanation of the apparently contradictory observations made in the LVD group is increased expression of NCX in a partially de-tubulated T-tubule system. The NCX expressed in the T-system not connected to the extracellular space would not contribute to Ca2+ extrusion. On the basis of this hypothesis, the disruption of the T-tubule network structure would have to prevent approximately 66 % of the expressed NCX protein access to the extracellular space in LVD. Recently, pronounced depletion of T-system staining was noted in a tachycardia-induced heart failure model (Balijepalli et al. 2003) in intact and permeabilised myocytes. This result suggests that the loss of T-system staining was not the result of internalisation of T-system membranes. The study also measured an increased NCX expression in the sarcolemmal fraction of failing myocardium (Balijepalli et al. 2003). However, no functional measurements were included in the report. This work supports the current study by showing that increased NCX expression can accompany decreased T-system density in heart failure. The current study extends this observation to an infarct model of heart failure and also shows that increased protein expression does not necessarily translate into increased NCX activity. Work on a rat model of myocardial infarction (5-6 months after initial infarct) showed reduced SA/V ratio values and increased NCX expression and INCX, but normal rates of NCX-mediated Ca2+ extrusion (Gomez et al. 2002). Conceivably, the longer period after the initial infarct may allow NCX expression to increase further and/or alter the pattern of NCX expression to compensate for the altered cell structure.
Acknowledgments
The authors would like to thank Dr Martin Hicks, and Diane Smillie, Graeme Deuchar, Anne Ward and Aileen Rankin for technical assistance. Dr Jamie Vandenburg is thanked for his discussions and help with mRNA measurements. Dr Francis Burton is thanked for his comments on earlier versions of this manuscript. This work was supported financially by programme grant funding from the British Heart Foundation (BHF). FRQ held a BHF clinical PhD fellowship, AD held a BHF studentship.
REFERENCES
- Balijepalli RC, Lokuta AJ, Maertz NA, Buck JM, Haworth RA, Valdivia HH, Kamp TJ. Depletion of T-tubules and specific subcellular changes in sarcolemmal proteins in tachycardia-induced heart failure. Cardiovasc Res. 2003;59:67–77. doi: 10.1016/s0008-6363(03)00325-0. [DOI] [PubMed] [Google Scholar]
- Bryant SM, Shipsey SJ, Hart G. Regional differences in electrical and mechanical properties of myocytes from guinea-pig hearts with mild left ventricular hypertrophy. Cardiovasc Res. 1997;35:315–323. doi: 10.1016/s0008-6363(97)00111-9. [DOI] [PubMed] [Google Scholar]
- Burton FL, McPhaden AR, Cobbe SM. Ventricular fibrillation threshold and local dispersion of refractoriness in isolated rabbit hearts with left ventricular dysfunction. Basic Res Cardiol. 2000;95:359–367. doi: 10.1007/s003950070034. [DOI] [PubMed] [Google Scholar]
- Carr AN, Schmidt AG, Suzuki Y, Del Monte F, Sato Y, Lanner C, Breeden K, Jing SL, Allen PB, Greengard P, Yatani A, Hoit BD, Grupp IL, Hajjar RJ, Depaoli-Roach AA, Kranias EG. Type 1 phosphatase, a negative regulator of cardiac function. Mol Cell Biol. 2002;22:4124–4135. doi: 10.1128/MCB.22.12.4124-4135.2002. [DOI] [PMC free article] [PubMed] [Google Scholar]
- Chamunorwa JP, O'Neill SC. Regional differences in rest decay and recoveries of contraction and the calcium transient in rabbit ventricular muscle. Pflügers Arch. 1995;430:195–204. doi: 10.1007/BF00374650. [DOI] [PubMed] [Google Scholar]
- Convery MK, Hancox JC. Comparison of Na+-Ca2+ exchange current elicited from isolated rabbit ventricular myocytes by voltage ramp and step protocols. Pflügers Arch. 1999;437:944–954. doi: 10.1007/s004240050866. [DOI] [PubMed] [Google Scholar]
- Currie S, Smith GL. Enhanced phosphorylation of phospholamban and down regulation of SERCA 2 in cardiac sarcoplasmic reticulum from rabbits with heart failure. Cardiovasc Res. 1999;41:135–146. doi: 10.1016/s0008-6363(98)00241-7. [DOI] [PubMed] [Google Scholar]
- Diaz ME, Trafford AW, O'Neill SC, Eisner DA. Measurement of sarcoplasmic reticulum Ca2+ content and sarcolemmal Ca2+ fluxes in isolated rat ventricular myocytes during spontaneous Ca2+ release. J Physiol. 1997;501:3–16. doi: 10.1111/j.1469-7793.1997.003bo.x. [DOI] [PMC free article] [PubMed] [Google Scholar]
- Eisner DA, Nichols CG, O'Neill SC, Smith GL, Valdeolmillos M. The effects of metabolic inhibition on intracellular calcium and pH in isolated rat ventricular cells. J Physiol. 1989;411:393–418. doi: 10.1113/jphysiol.1989.sp017580. [DOI] [PMC free article] [PubMed] [Google Scholar]
- Frank JS, Mottino G, Reid D, Molday RS, Philipson KD. Distribution of the Na+-Ca2+ exchange protein in mammalian cardiac myocytes: an immunofluorescence and immunocolloidal gold-labeling study. J Cell Biol. 1992;117:337–345. doi: 10.1083/jcb.117.2.337. [DOI] [PMC free article] [PubMed] [Google Scholar]
- Gomez AM, Schwaller B, Porzig H, Vassort G, Niggli E, Egger M. Increased exchange current but normal Ca2+ transport via Na+-Ca2+ exchange during cardiac hypertrophy after myocardial infarction. Circ Res. 2002;91:323–330. doi: 10.1161/01.res.0000031384.55006.db. [DOI] [PubMed] [Google Scholar]
- Gunter TE, Buntinas L, Sparagna G, Eliseev R, Gunter K. Mitochondrial calcium transport: mechanisms and functions. Cell Calcium. 2000;28:285–295. doi: 10.1054/ceca.2000.0168. [DOI] [PubMed] [Google Scholar]
- Hasenfuss G. Alterations of calcium-regulatory proteins in heart failure. Cardiovasc Res. 1997;37:279–289. doi: 10.1016/s0008-6363(97)00277-0. [DOI] [PubMed] [Google Scholar]
- Hasenfuss G, Schillinger W, Lehnart SE, Preuss M, Pieske B, Maidan R, Prestle J, Minami K, Just H. Relationship between Na+-Ca2+-exchanger protein levels and diastolic function of failing human myocardium. Circulation. 1999;99:641–648. doi: 10.1161/01.cir.99.5.641. [DOI] [PubMed] [Google Scholar]
- Hatem SN, Sham JSK, Morad M. Enhanced Na+-Ca2+ exchange activity in cardiomyopathic Syrian hamster. Circ Res. 1994;74:253–261. doi: 10.1161/01.res.74.2.253. [DOI] [PubMed] [Google Scholar]
- He JQ, Foell JD, Wolff M, Haworth RA, Coronado R, Conklin MW, Kamp T. Reduction in density of transverse tubules in L-type Ca2+ channels in canine tachycardia-induced heart failure. Cardiovasc Res. 2002;49:298–307. doi: 10.1016/s0008-6363(00)00256-x. [DOI] [PubMed] [Google Scholar]
- Hobai IA, O'Rourke B. Enhanced Ca2+ -Activated Na+ -Ca2+ Exchange Activity in Canine Pacing-Induced Heart Failure. Circ Res. 2000;87:690–698. doi: 10.1161/01.res.87.8.690. [DOI] [PubMed] [Google Scholar]
- Huang B, Wang S, Qin D, Boutjdir M, El Sherif N. Diminished basal phosphorylation level of phospholamban in the postinfarction remodeled rat ventricle: role of beta-adrenergic pathway, G (i) protein, phosphodiesterase, and phosphatases. Circ Res. 1999;85:848–855. doi: 10.1161/01.res.85.9.848. [DOI] [PubMed] [Google Scholar]
- Iwamoto T, Pan Y, Wakabayashi S, Imagawa T, Yamanaka HI, Shigekawa M. Phosphorylation-dependent regulation of cardiac Na+/Ca2+ exchanger via protein kinase C. J Biol Chem. 1996;271:13609–13615. doi: 10.1074/jbc.271.23.13609. [DOI] [PubMed] [Google Scholar]
- Kieval RS, Bloch RJ, Lindenmayer GE, Ambesi A, Lederer WJ. Immunofluorescence localization of the Na-Ca exchanger in heart cells. Am J Physiol. 1992;263:C545–550. doi: 10.1152/ajpcell.1992.263.2.C545. [DOI] [PubMed] [Google Scholar]
- Licata A, Aggarwal R, Robinson RB, Boyden P. Frequency dependent effects of Cai transients and cell shortening in myocytes that survive the infarcted heart. Cardiovasc Res. 1997;33:341–350. doi: 10.1016/s0008-6363(96)00246-5. [DOI] [PubMed] [Google Scholar]
- Litwin SE, Bridge JHB. Enhanced Na+-Ca2+ exchange in the infarcted heart. Circ Res. 1997;81:1083–1093. doi: 10.1161/01.res.81.6.1083. [DOI] [PubMed] [Google Scholar]
- McDonald RL, Colyer J, Harrison SM. Quantitative analysis of Na+-Ca2+ exchanger expression in guinea-pig heart. Eur J Biochem. 2000;267:5142–5148. doi: 10.1046/j.1432-1327.2000.01579.x. [DOI] [PubMed] [Google Scholar]
- McIntosh MA, Cobbe SM, Smith GL. Heterogeneous changes in action potential duration and intracellular Ca2+ in left ventricular myocytes sub-types from rabbits with heart failure. Cardiovasc Res. 2000;45:379–409. doi: 10.1016/s0008-6363(99)00360-0. [DOI] [PubMed] [Google Scholar]
- Mahaffey KW, Rya TE, Pennock GD, Morkin E, Goldman S. Left ventricular remodeling in rabbits after myocardial infarction. Circ. 1995;91:794–801. doi: 10.1161/01.cir.91.3.794. [DOI] [PubMed] [Google Scholar]
- Matsuoka S, Nicoll DA, Hryshko LV, Levitsky DO, Weiss JN, Philipson KD. Regulation of the cardiac Na+-Ca2+ exchanger by Ca2+. Mutational analysis of the Ca2+-binding domain. J Gen Physiol. 1995;105:403–420. doi: 10.1085/jgp.105.3.403. [DOI] [PMC free article] [PubMed] [Google Scholar]
- Ng GA, Cobbe SM, Smith GL. Non-uniform prolongation of intracellular Ca2+ transients recorded from the epicardial surface of isolated hearts from rabbits with heart failure. Cardiovasc Res. 1998;37:489–502. doi: 10.1016/s0008-6363(97)00255-1. [DOI] [PubMed] [Google Scholar]
- Perchenet L, Hinde AK, Patel KC, Hancox JC, Levi AJ. Stimulation of Na/Ca exchange by the beta-adrenergic/protein kinase A pathway in guinea-pig ventricular myocytes at 37 °C. Pflügers Arch. 2000;439:822–828. doi: 10.1007/s004249900218. [DOI] [PubMed] [Google Scholar]
- Pogwizd SM. Nonreentrant mechanisms underlying spontaneous ventricular arrhythmias in a model of nonischaemic heart failure in rabbits. Circulation. 1995;92:1034–1048. doi: 10.1161/01.cir.92.4.1034. [DOI] [PubMed] [Google Scholar]
- Pogwizd SM, Schlotthauer K, Li L, Yuan W, Bers DM. Arrhythmogenesis and contractile dysfunction in heart failure: roles of sodium-calcium exchange, inward rectifier potassium current, and residual adrenergic responsiveness. Circ Res. 2001;88:1159–1167. doi: 10.1161/hh1101.091193. [DOI] [PubMed] [Google Scholar]
- Pogwizd SM, Yuan MQ, Samarel AM, Bers DM. Upregulation of Na/Ca exchanger expression and function in an arrhythmogenic rabbit model of heart failure. Circ Res. 1999;85:1009–1019. doi: 10.1161/01.res.85.11.1009. [DOI] [PubMed] [Google Scholar]
- Prestle J, Dieterich S, Preuss M, Bieligk U, Hasenfuss G. Heterogeneous transmural gene expression of calcium-handling proteins and natriuretic peptides in the failing human heart. Cardiovasc Res. 1999;43:323–331. doi: 10.1016/s0008-6363(99)00119-4. [DOI] [PubMed] [Google Scholar]
- Pye MP, Black M, Cobbe SM. Comparison of in vivo and in vitro hemodynamics function in experimental heart failure-use of echocardiography. Cardiovasc Res. 1996;31:873–881. [PubMed] [Google Scholar]
- Pye MP, Cobbe SM. Arrhythmogenesis in experimental models of heart failure: the role of increased load. Cardiovasc Res. 1996;32:248–257. doi: 10.1016/0008-6363(96)00080-6. [DOI] [PubMed] [Google Scholar]
- Qin D, Zhang Z, Caref EB, Boutjdir M, Jain P, El-Sherif N. Cellular and ionic basis of arrhythmias in postinfarction remodeled ventricular myocardium. Circ Res. 1996;79:461–473. doi: 10.1161/01.res.79.3.461. [DOI] [PubMed] [Google Scholar]
- Ruknudin A, He S, Lederer WJ, Schulze DH. Functional differences between cardiac and renal isoforms of the rat Na+-Ca2+ exchanger NCX1 expressed in Xenopus oocytes. J Physiol. 2000;529:599–610. doi: 10.1111/j.1469-7793.2000.00599.x. [DOI] [PMC free article] [PubMed] [Google Scholar]
- Satoh H, Delbridge LMD, Blatter LA, Bers DM. Surface: Volume relationship in cardiac myocytes studied with confocal microscopy and membrane capacitance measurements: species-dependence and developmental effects. Biophys J. 1996;70:1494–1504. doi: 10.1016/S0006-3495(96)79711-4. [DOI] [PMC free article] [PubMed] [Google Scholar]
- Schillinger W, Janssen PML, Emami S, Henderson SA, Ross RS, Teucher N, Zeitz O, Philipson KD, Prestle J, Hasenfuss G. Impaired contractile performance of cultured rabbit ventricular myocytes after adenoviral gene transfer of Na+-Ca2+ exchanger. Circ Res. 2000;87:581–587. doi: 10.1161/01.res.87.7.581. [DOI] [PubMed] [Google Scholar]
- Sipido KR, Volders PG, Vos MA, Verdonck F. Altered Na/Ca exchange activity in cardiac hypertrophy and heart failure: a new target for therapy? Cardiovasc Res. 2002;53:782–805. doi: 10.1016/s0008-6363(01)00470-9. [DOI] [PubMed] [Google Scholar]
- Soeller C, Cannell MB. Examination of the transverse tubular system in living cardiac rat myocytes by 2-photon microscopy and digital image-processing techniques. Circ Res. 1999;84:266–275. doi: 10.1161/01.res.84.3.266. [DOI] [PubMed] [Google Scholar]
- Studer R, Reinecke H, Bilger J, Eschenhagen T, Bohm M, Hasenfuss G. Gene expression of the Na+-Ca2+ exchanger in end stage human heart failure. Circ Res. 1994;75:443–453. doi: 10.1161/01.res.75.3.443. [DOI] [PubMed] [Google Scholar]
- Terracciano CMN, Souza AL, Philipson KD, Macleod KT. Na+-Ca2+-exchange and the sarcoplasmic reticular Ca2+ regulation in ventricular myocytes from transgenic mice over-expressing the Na+-Ca2+ exchanger. J Physiol. 1998;512:651–667. doi: 10.1111/j.1469-7793.1998.651bd.x. [DOI] [PMC free article] [PubMed] [Google Scholar]
- Wang Z, Nolan B, Kutschke W, Hill JA. Na+-Ca2+ exchanger remodeling in pressure overload cardiac hypertrophy. J Biol Chem. 2001;276:17706–17711. doi: 10.1074/jbc.M100544200. [DOI] [PubMed] [Google Scholar]
- Weber CR, Ginsburg KS, Philipson KD, Shannon TR, Bers DM. Allosteric regulation of Na/Ca exchange current by cytosolic Ca in intact cardiac myocytes. J Gen Physiol. 2001;117:119–131. doi: 10.1085/jgp.117.2.119. [DOI] [PMC free article] [PubMed] [Google Scholar]
- Yang Z, Pascarel C, Steele DS, Komukai K, Brette F, Orchard CH. Na+-Ca2+ exchange activity is localized in the T-tubules of rat ventricular myocytes. Circ Res. 2002;91:315–322. doi: 10.1161/01.res.0000030180.06028.23. [DOI] [PubMed] [Google Scholar]
- Yao A, Matsui H, Spitzer KW, Bridge JHB, Barry WH. Sarcoplasmic reticulum and Na+/Ca2+ exchanger function during early and late relaxation in ventricular myocytes. Am J Physiol. 1997;273:H2765–2773. doi: 10.1152/ajpheart.1997.273.6.H2765. [DOI] [PubMed] [Google Scholar]