

Abstract
Whole-cell voltage recordings were made in vivo from subsequently reconstructed pyramidal neurons (n = 30) in layer 3 (L3) and layer 2 (L2) of the barrel cortex of urethane-anaesthetised rats. Average resting membrane potentials were well below (15−40 mV) action potential (AP) initiation threshold. The average spontaneous AP activity (0.068 ± 0.22 APs s−1) was low. Principal whisker (PW) deflections evoked postsynaptic potentials (PSPs) in almost all cells of a PW column but evoked AP activity (0.031 ± 0.056 APs per PW stimulus 6 deg deflection) was low indicating ‘sparse’ coding by APs. Barrel-related cells (n = 16) have their soma located above a barrel and project their main axon through the barrel whereas septum-related cells (n = 8) are located above and project their main axon through the septum between barrels. Both classes of cell had broad subthreshold receptive fields (RFs) which comprised a PW and several (> 8) surround whiskers (SuW). Barrel-related cells had shorter PSP onset latencies (9.6 ± 4.6 ms) and larger amplitude PW stimulus responses (9.1 ± 4.5 mV) than septum-related cells (23.3 ± 16.5 ms and 5.0 ± 2.8 mV, respectively). The dendritic fields of barrel-related cells were restricted, in the horizontal plane, to the PW column width. Their axonal arbors projected horizontally into several SuW columns, preferentially those representing whiskers of the same row, suggesting that they are the major anatomical substrate for the broad subthreshold RFs. In barrel-related cells the response time course varied with whisker position and subthreshold RFs were highly dynamic, expanding in size from narrow single-whisker to broad multi-whisker RFs, elongated along rows within 10–150 ms following a deflection. The response time course in septum-related cells was much longer and almost independent of whisker position. Their broad subthreshold RF suggests that L2/3 cells integrate PSPs from several barrel columns. We conclude that the lemniscal (barrel-related) and paralemniscal (septum-related) afferent inputs remain anatomically and functionally segregated in L2/3.
A major aim of sensory physiology is to identify those synaptic connections in cortical representational areas (functional maps) by which sensory stimuli are transformed into a specific pattern of sub- (PSPs) and suprathreshold (APs) electrical activity. In the neocortex such maps consist of functional units, referred to as columns (Mountcastle, 1957; Hubel & Wiesel, 1962). These comprise the cells in different cortical layers that respond to a particular sensory stimulus. To understand sensory maps mechanistically and at a subcellular resolution, firstly the synaptic connections between cells that constitute a column and also those between different columns have to be identified in a layer-specific manner. Secondly the spatial and temporal transformations of PSP and AP patterns along sensory pathways and in the different cortical layers have to be understood.
The coarse layout of sensory information flow within a column is comparable across different sensory cortices. Afferent signals arrive in cortical layer 4 (L4) from thalamic nuclei. They are relayed from L4 to supragranular layers 3 (L3) and 2 (L2) as well as to infragranular layers (L5 and L6). Extracellular unit recording and anatomical work have compiled a detailed picture of the columnar cytoarchitecture and AP activity in columns of some sensory cortices. The detailed anatomy and synaptic mechanisms of the connections that generate specific patterns of PSPs and APs are, however, largely unclear. Few studies have determined both the soma location and the dendritic and axonal morphology of cortical cells as well as their sub- and suprathreshold RFs (e.g. Ito, 1992; Brecht & Sakmann, 2002a,b). Such measurements are, however, a prerequisite if one wants to infer how PSPs or APs represent a sensory stimulus in the different layers of the cortex.
L4 of the rodent somatosensory cortex contains aggregates of neuronal somata referred to as barrels, which are innervated in a strict topographical order by inputs representing individual facial whiskers (Woolsey & Van der Loos, 1970). Anatomical studies have demonstrated that barrel cells are targeted by thalamic inputs from the ventral posterior medial nucleus (VPM), which are part of the lemniscal pathway (Diamond, 1995), while the septa between barrels are innervated by thalamic afferents projecting from the posterior medial nucleus (POM), which belong to the paralemniscal pathway (Koralek et al. 1988; Lu & Lin, 1993). While most lemniscal afferents innervate the barrels, some VPM inputs also target the L5B/L6 border and paralemniscal POM afferents densely innervate L5A (Koralek et al. 1988; Lu & Lin, 1993). Barrel borders and the morphology of a cortical cell can be visualised simultaneously (Ito, 1992), such that the laminar position of a cell and its position relative to barrel column borders as well as its detailed dendritic and axonal morphology can be measured. Such techniques provided physiological evidence that lemniscal (the VPM/barrel projection) and paralemniscal (the POM/septum projection) pathways are largely segregated in L4 (Brecht & Sakmann, 2002a). Furthermore the RFs of barrel and septum cells are dynamic but are narrow and restricted to a PW and at most the first order SuWs.
The homogeneous appearance of L3 and L2 in the horizontal plane may indicate merging of the whisker-specific anatomical pathways, whose strict separation in L4 gives rise to the discontinuous appearance of barrels (Woolsey & Van der Loos, 1970). The projection pattern of L4 spiny neuron axons suggests, however, that selectively connected barrel columns also exist (Petersen & Sakmann, 2000; Petersen et al. 2003; Lübke et al. 2003). The convergence of whisker-evoked responses between columns is also suggested by unit recordings from unidentified cells (Simons, 1978, 1995; Armstrong-James & Fox, 1987; Armstrong-James et al. 1992; Armstrong-James, 1995). They show that suprathreshold RFs in L3 and L2 cells are larger in size than those of L4 cells. The work of Ahissar and colleagues on the representation of temporal frequencies in L2/3 cell spike trains suggests a merging of barrel and septum inputs in supragranular layers (Ahissar et al. 2001). Anatomical data, however, suggest that barrel and septal pathways also remain separate in L3 and L2 (Kim & Ebner, 1999).
We report here in vivo whole-cell voltage recordings of whisker-evoked PSPs and APs from cells in L2/3, combined with reconstruction of their dendritic and axonal arbors. We determined the horizontal and vertical position of these cells with reference to the barrel map to establish relationships between individual cell classes in L3 and L2 located above barrel and septa, and their sub- and suprathreshold RFs. The aim is to construct relationships between anatomical cell classes and their functional properties. Comparison with similar data from L4 cells (Brecht & Sakmann, 2002b) and incorporation of in vitro data (Feldmeyer et al. 2002; Lübke et al. 2003) on connectivity should allow a quantitative description of the flow of excitation through and between cortical barrel columns.
METHODS
Animals
Fifty-two Wistar rats of both sexes were used. The animals were between 28 and 36 days old. In 48 animals at least one cell was recorded. However not all of these cells could be recovered for reconstruction, and not all of the recovered cells were localised in the supragranular layers (see below). The anaesthesia and recording techniques were the same as described previously (Brecht & Sakmann, 2002a,b).
Preparation
Animals were prepared as described previously (Brecht & Sakmann, 2002a,b). In brief, rats were anaesthetised with an intraperitoneal injection of urethane (1-1.5 g kg−1). A 1 mm diameter hole was drilled in the skull at 5.5 mm lateral and 2.5 mm posterior to bregma. The dura was removed with a 30 gauge injection needle tip and the exposed cortex was superfused with warm Hepes-buffered artificial cerebrospinal fluid (ACSF) solution. All experimental procedures were carried out according to the animal welfare guidelines of the Max-Planck Society. On completion of the physiological recordings, animals received an overdose of urethane and were perfused transcardially with 0.1 m phosphate-buffered saline (PBS) followed by a solution of 4 % paraformaldehyde.
Anaesthesia
The depth of anaesthesia was assessed by monitoring pinch withdrawal, eyelid reflex, corneal reflex, respiration rate and vibrissae movements. In the recording conditions chosen here, pinch withdrawal and vibrissae movements were usually absent, but weak eyelid and corneal reflexes could be observed. Respiration rates were usually between 70 and 100 breaths min−1. During the whole experiment animals were anaesthetised with urethane, the depth of anaesthesia during recordings generally being lower than during the initial surgery. Occasionally, both vibrissae movements and withdrawal reflexes began to appear during the course of the experiment. In these cases an additional dose of urethane (20 % of the initial dose) was given. Taken together, these observations suggest that the depth of anaesthesia varied in our animals around anaesthetic state III-3 (Friedberg et al. 1999).
Whole-cell recording
Recordings were made with long taper patch pipettes with resistances of 4-7 MΩ pulled from borosilicate glass tubing on a Sutter puller (Science Products, Hofheim, Germany) in a three-stage pull. Pipettes were filled with (mm): potassium gluconate 130, sodium gluconate 10, Hepes 10, phosphocreatine 10, MgATP 4, Na2 ATP 2, GTP 0.3 and NaCl 4, with 0.4 % biocytin at pH 7.2.
Pipettes were lowered perpendicularly to the cortical surface into the barrel cortex. To prevent tip occlusion, pressure (200-300 mbar) was applied to the pipette interior. To establish the whole-cell recording configuration we applied conventional voltage clamp (Blanton et al. 1989; Margrie et al. 2002). Series resistances were between 10 and 75 MΩ. All data have been corrected for a +7 mV junction potential.
Sensory stimulation and RF maps
All stimulation procedures were as described previously by Brecht & Sakmann (2002a). Three types of whisker stimuli were delivered: whisker deflection by a handheld probe, by airpuffs and by a piezoelectric stimulator. The airpuff stimuli deflected four to eight whiskers in two to three whisker rows by up to 2 mm. A piezoelectric bimorph wafer with an attached glass capillary served for quantitative single-whisker stimulation (Simons, 1983). Steps elicited by the piezoelectric device had a 10-90 % rise time of 1 ms. The deflection point of the whisker was chosen to be 8-10 mm from the base of the vibrissa and if not otherwise noted the vibrissa was deflected backwards by 1 mm (roughly 6 deg deflection angle) for 200 ms at a frequency of 1 Hz. All cells were stimulated with piezoelectric stimulators and if not noted otherwise all displayed data refer to this type of stimulation.
Data analysis
The AP count during the initial 100 ms after stimulus onset was classified as the neuron's suprathreshold response. For the PSP response we classified the largest membrane depolarisation or hyperpolarisation during the initial 100 ms after stimulus onset in averaged traces. To quantify the directional tuning of various response components a directionality index was calculated as follows: (response in the preferred direction - response in the opposite direction)/(response in the preferred direction + response in the opposite direction). Thus, a value of 1 represents a completely directional response; a value of 0 represents a response without directional preference. For PSP latency measurements we determined the time point after whisker deflection onset where the postsynaptic potential reached 5 % of its peak amplitude.
Histological procedures and reconstruction
The analysis of dendritic field geometry was restricted to 2-D semi-coronal or tangential views, because cells appeared to be artificially flattened in the z-axis during staining and embedding. Brains were sectioned in 80 or 300 µm thick slices in two planes of section. Shrinkage in the z-direction was corrected taking into account the known thickness at which sections were cut. For cells from tangential sections we compared the corrected length of the dendritic arbor with the length estimated from the laminar position of the cell and we usually observed a good match. From roughly half of the brains tangential sections of barrel cortex were prepared. For remaining brains the semi-coronal plane of section was chosen. Here the plane of section was perpendicular to the cortical surface and tilted 45 deg away from the coronal plane towards the sagittal plane, whereby the section ran from anterior for the medial part of the brain to posterior for the lateral part. This angle of the section resulted in a cut perpendicular to rows of barrels and parallel to arcs of barrels. For simplicity we refer to this section as ‘coronal’. Cytochrome oxidase staining (Wong-Riley, 1979) was used to visualise the cortical layering and barrel structure. Slices were then processed with the avidin-biotin-peroxidase method (Horikawa & Armstrong, 1988) to reveal cell morphology and mounted on slides using Mowiol (Clariant, Sulzbach, Germany). The soma diameter was calculated as the mean of the maximal and the minimal soma diameter.
Barrel borders could be well visualised in the plane of section, but determining barrel borders in the complementary plane was difficult, particularly in the case of coronal sections. Thus, for cells reconstructed from coronal sections there was considerable uncertainty about the horizontal position relative to the barrels. Therefore we did not use 3-D reconstructions of cells from coronal sections in our horizontal projections of dendritic and axonal density (Figs 6B and C and 7B and C). On the other hand for cells from tangential sections it was often possible to determine their vertical position relative to barrels and in such cases 3-D reconstructions were used for both horizontal and vertical projections of dendritic and axonal density.
Figure 6. Sub- and suprathreshold RF map and dendritic and axonal segment density plots of L2/3 barrel-related pyramids.
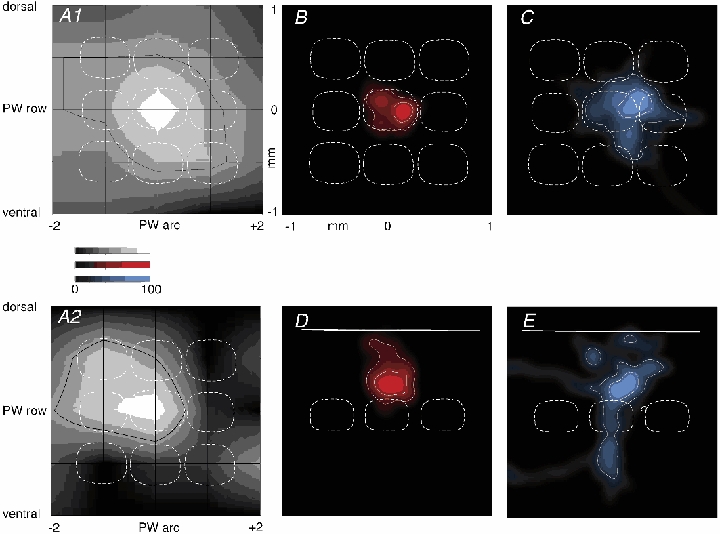
A1, average subthreshold (PSP) RF map for barrel-related cells (n = 16). The black grid indicates whisker positions, given with respect to the PW. Surround whisker positions are given by the intersection of horizontal and vertical lines. The number -2 refers to SuW located in the 2nd arc away from the PW in the caudal direction. The number +2 indicates whiskers in the second arc away from the PW in the rostral direction. ‘dorsal’, whisker positions on the whisker pad above the PW; ‘ventral’, whisker positions below the PW. The response amplitude is encoded by the brightness normalised to the peak of the PW deflection amplitude as determined in each individual experiment. The black contour line delineates an area on the RF map responding with > 50 % of the PW peak response amplitude. Outline of an average cytoarchitectonic L4 barrel field pattern (white dashed lines) in the horizontal plane is superimposed for comparison of the idealised columnar architecture with the average RF. Outlines above the PW barrel correspond to barrels located laterally. Outlines right to the PW barrel outline correspond to barrels located anterior to the PW barrel. A2, average suprathreshold (AP) RF map; conventions as in A1. B, average 2-D map of ‘dendritic length’ density (red, n = 9) projected onto a horizontal plane. An average barrel field projected into the horizontal plane (white dashed lines) is superimposed for comparison. Convention on location of barrels as in A. The inner white contour line delineates an area that contains densities that are equal to or larger than 50 % of the maximal density of dendrite segments. The outer white contour line delineates an area that includes 80 % of all dendritic segments. C, average 2-D map of ‘axon length’ density (blue, n = 8) projected onto a horizontal plane. Barrel field structure and white contour lines as described in B for dendritic segments. D, average 2-D map of dendritic length density (red, n = 12) projected onto a vertical plane. The dashed lines represent outlines of idealised averaged barrels. The outlines to the right of the PW barrel correspond to barrels located lateral to the PW barrel. White lines are contour lines as described in B. Continuous white line indicates approximate location of the pial surface. E, average 2-D map of axon length density (blue, n = 11). Projection onto a vertical, coronal plane along the arcs. Barrel outlines as in D, white lines are contour lines as described in B. Continuous white line indicates the pial surface. Cells reconstructed from tangential sections entered both horizontal and vertical projections, but cells reconstructed from coronal sections were used only in vertical projections (see Methods). Data from L3 and L2 cells are pooled.
Figure 7. Comparison of subthreshold RF map and dendrite and axon segment density plots of septum-related pyramids.
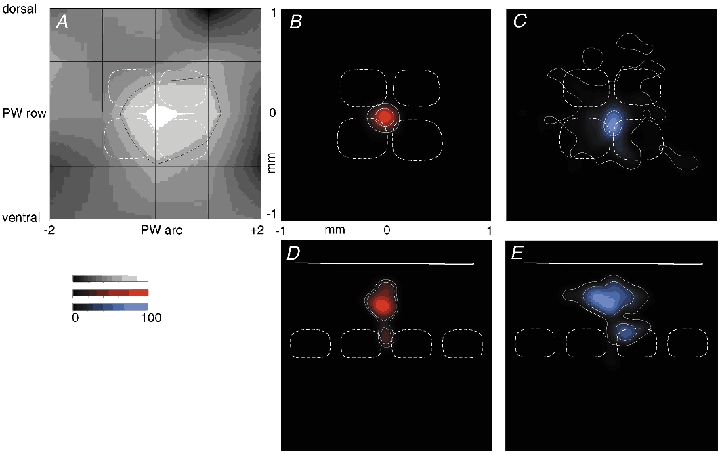
A, average subthreshold (PSP) RF map for septum-related cells (n = 8). The black grid indicates whisker positions, given with respect to the PW. Surround whisker positions are given by intersection of horizontal and vertical lines. The number -2 refers to SuW located in the 2nd arc away from the PW in the caudal direction. The number +2 indicates whiskers in the second arc away from the PW in the rostral direction. ‘dorsal’, whisker positions on the whisker pad above the PW; ‘ventral’, whisker positions below the PW. The response amplitude is encoded by the brightness normalised to the peak of the PW deflection amplitude as determined in each individual experiment. The black contour line delineates an area on the RF map responding with > 50 % of the PW peak response amplitude. An average cytoarchitectonic L4 barrel field pattern (white dashed lines) in the horizontal plane is superimposed for comparison of the average RF structure of a barrel cell with the cytoarchitectonic barrel structure. Outlines above the PW barrel correspond to barrels located laterally of the PW barrel. Outlines to the right of the PW barrel outline correspond to barrels located anterior to the PW barrel. B, average 2-D map of ‘dendritic length’ density (red, n = 6) projected onto a horizontal plane. An average cytoarchitectonic barrel field projected into the horizontal plane (white dashed lines) is superimposed for comparison with dendritic density map and barrel structure. Convention on location of barrels as in A. The inner white contour line delineates an area that contains densities that are equal to or larger than 50 % of the maximal density of dendrite segments. The outer white contour line delineates an area that includes 80 % of all dendritic segments. C, average 2-D map of ‘axon length’ density (blue, n = 6) projected onto a horizontal plane. Barrel field structure and white contour lines as described in B for dendritic segments. D, average 2-D map of dendritic length density (red, n = 7) projected onto a vertical plane. The dashed lines represent outlines of averaged barrels. The outlines to the right of the PW barrel correspond to barrels located lateral to the PW barrel. White lines are contour lines as described in B. Continuous white line indicates the approximate location of the pial surface. E, average 2-D map of axon length density (blue, n = 7). Projection onto a vertical, coronal plane along the arcs. Barrel outlines as in D; white lines are contour lines as described in B. Continuous white line indicates the pial surface. Cells reconstructed from tangential sections entered both horizontal and vertical projections, but cells reconstructed from coronal sections were used only in vertical projections (see Methods). Data from L3 and L2 cells were pooled.
Subpial depth and laminar distribution of cells
The micromanipulator angle (ca 35 deg tilt lateral from the vertical axis) was adjusted for a perpendicular penetration of cortical layers. The somata of recovered cells were found at a depth 0-250 µm less than the read-out of the micromanipulator. This observation suggests two conclusions. First it appears that with our type of pipette we did not record from apical dendrites, because contrary to our observations such recordings should have led to a recovery of cell somata at a depth in excess of the micromanipulator reading. Second, there appear to be systematic deviations that bias the micromanipulator depth estimate towards too high values. Such factors may include a not perfectly perpendicular penetration, tissue compression by the pipette, and a too shallow estimate of the pia position due to fluid residuals on the surface of the brain. Given the scatter in depth estimates based on the micromanipulator read-out we did not include any non-identified cells in our sample. The L3/L4 border was identified either by the granular appearance of L4 in the unstained tissue section or by a brown appearance of L4 in the cytochrome c oxidase stain. The most superficial L4 cell was encountered at a subpial depth of 595 µm (as indicated by the micromanipulator read-out). The deepest recording resulting in the recovery of a L3 cell was done at a depth of 799 µm. Between 600 and 750 µm mainly L3 cells were identified. All cells recovered at a depth read-out of the micromanipulator of less 300 µm were found to be L2 cells (see below).
The L2/L3 border was determined as follows. In coronal sections L2 can be recognised by its more granular appearance, which reflects the higher packing density of cells. For cells reconstructed from tangential sections we entirely relied on the histological depth of the soma, with the L2/L3 border being estimated at one-third of the depth of the distance between pia and barrel.
Relation of supragranular cells to L4 barrels and septa
L4 of the rodent vibrissae cortex is divided into barrel and septum regions (Woolsey & Van der Loos, 1970), and the sensory responses of cells in septa and barrels are strikingly different (Brecht & Sakmann, 2002b). We therefore investigated the relationship of supragranular neurons to L4 barrels and L4 septa by determining their horizontal position (above barrel vs. above septum) and their projection pattern (descending axon projecting through barrel vs. through septum). In 16 cases, where both the horizontal cell position and the projection pattern could be determined, we found the two criteria led to consistent results (cells located above barrels projecting through barrels, cells located above septa projecting through septa). In eight cases only the cell position or the projection pattern relative to barrels and septa could be determined. We refer to supragranular neurons located above and/or projecting through L4 barrels and septa as ‘barrel-related’ and ‘septum-related’ cells, respectively. One L2 cell located above a septum region seemed to project to both L4 septum and barrel, although the projection pattern could not be determined unambiguously in this experiment because of other nearby cells that were also labelled.
Plots of RFs and of dendritic and axonal densities
Smoothed RF plots were generated by linear interpolation. To generate 2-D maps of dendritic and axonal length densities, cell reconstructions generated in Neurolucida (MicroBrightField, Colchester, VT, USA) were converted to NEURON (Hines & Carnevale, 1997) format. Using NEURON, the total lengths of all dendrites or axons within voxels of 50 µm × 50 µm × 50 µm were calculated. The resulting 3-D density matrix was projected onto either a tangential or vertical plane resulting in a 2-D density matrix. This 2-D density matrix was read into Mathematica software and was spatially low-pass filtered by convolving it with a 2-D Gaussian kernel with a standard deviation of 50 µm. A bicubic interpolation of the filtered 2-D density matrix was performed to generate a 2-D density map. For averaging dendritic and axonal arborisations across cells, reconstructions were aligned relative to the centre of the respective barrel or septum.
RESULTS
The 30 neurons included in this study were located in L2/3 and responded with a regular pattern of APs upon depolarising current injection. Reconstruction showed that they were pyramidal cells having dendrites with numerous spines, characteristic of principal excitatory cells. Nineteen pyramidal cells were located in L3 and 11 cells were located in L2. Many L2 cells had apical dendrites, which branched close to the soma (< 100 µm). L3 cells, in contrast, always had a prominent apical dendrite, which branched further away from the soma.
In 15 of the 19 L3 cells we could determine the cell's position relative to L4 barrels, and the vast majority of cells (n = 13) had their soma located above a L4 barrel. Their axons projected through the barrels to infragranular layers. Two pyramidal cells in L3 were located above a L4 septum. The nine positionally identified L2 cells showed a different bias. Six cells were positioned above and projected through a septum (one of the six cells projected through both septum and barrel), and only three cells were located above a barrel. The occurrence of barrel- and septum-related cells was significantly different between L2 and L3 (chi-square test, P < 0.01).
All neurons had low rates of spontaneously occurring APs of 0.068 ± 0.21 APs s−1. In all cells, irrespective of layer and position, the pattern of ongoing subthreshold activity was characterised by alternating states: epochs of hyperpolarised membrane potentials (down-states), during which little or no synaptic background activity was observed, and 10-20 mV more depolarised membrane states (up-states) with synaptic background activity.
We will first describe the RF structure measured by response peak amplitudes for anatomically different cell classes and subsequently their time-dependent response properties.
RF structure of morphologically identified cells
All cells responded with membrane depolarisation to deflection of multiple whiskers and only neurons that were classified as pyramidal cells are included. None of 17 neurons tested showed a large (> 2 mV) response at short latency (< 100 ms) to ipsilateral multi-whisker (airpuff) stimulation.
RFs of barrel-related pyramidal cells
Records from a L3 pyramidal cell located above the C2 barrel (Fig. 1A) are shown in Fig. 1B and C. Deflection of both the principal whisker (PW, w C2, Fig. 1B) and a surround whisker (SuW, w D2, Fig. 1C) evoked large depolarisations, but APs only infrequently. Figure 1D shows the ongoing subthreshold activity of this neuron, which was characterized by alternating down-states and up-states with synaptic background activity. Figure 2 shows the RF and the dendritic (red) and axonal (blue) arbors of this cell in relation to the barrel borders in L4, with the dendrite and axonal arbors projected to a horizontal (Fig. 2C) and vertical plane (Fig. 2D). Deflection the PW and the SuW (Fig. 2B) elicited depolarisations indicating that the RF comprised multiple whiskers. The dendritic arbor of this cell was restricted to the horizontal outline of a barrel column (Fig. 2C). In the vertical plane the dendritic arbor extended between L3 and L1 and the axon projected through the L4 barrel (Fig. 2D). In contrast, the axonal arbor extended horizontally across several adjacent barrel columns (Fig. 2C). We refer to this class of pyramid as a barrel-related cell in L3, and Fig. 3 illustrates the morphology and the RF of a barrel-related cell in L2. The RF was also characterised by responses to multiple whiskers. The responses to deflections of different SuWs had similar amplitudes (Fig. 3B). Most L3 and L2 barrel-related cells had large PW responses. In 8 out of 16 barrel-related cells peak response amplitudes were larger than 10 mV.
Figure 1. Sensory responses of a barrel-related pyramidal cell in L3.
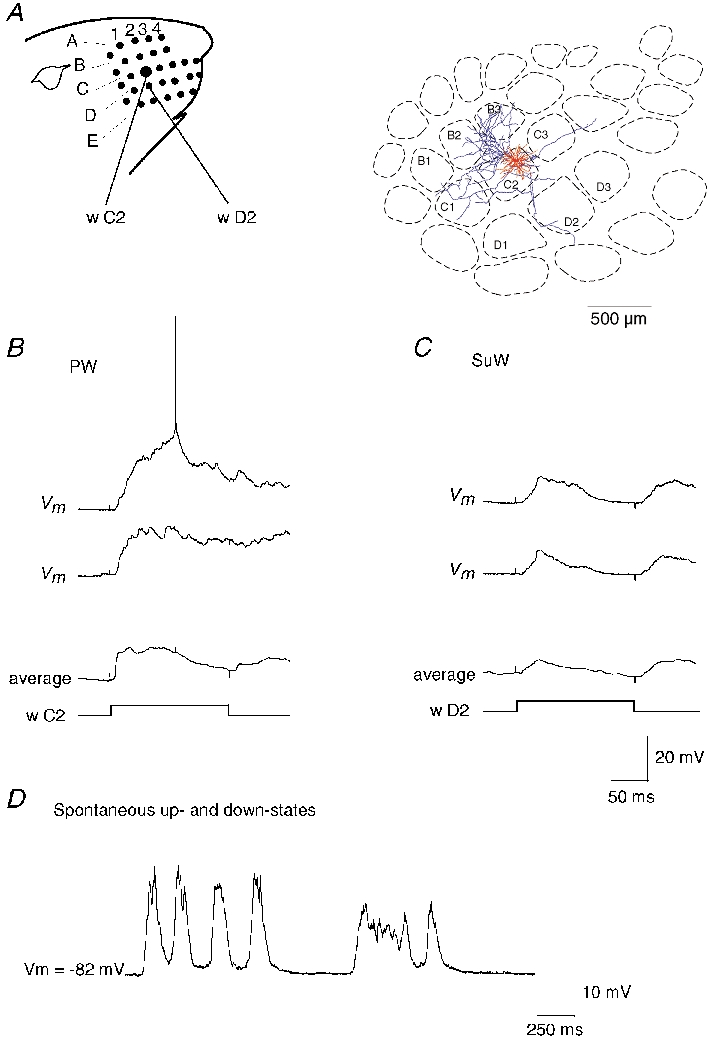
A, left: schematic representation of the whisker arrangement in the rat's face. A, right: horizontal projection of dendritic (red) and axonal arbors (blue) relative to the position of barrels in L4 of the L3 pyramidal cell. The cell was reconstructed from tangential sections. B, stimulation of principal whisker (PW, w C2). Upper traces: two successive responses (Vm) to PW deflection. The average membrane potential response (20 trials) is shown in the lower trace. Time course of whisker deflection (w C2) is shown schematically below the membrane potential records. C, stimulation of surround whisker (SuW, w D2). Two successive responses (Vm) to a surround whisker (w D2) deflection and averaged response (20 trials). Onset and offset stimulus artefacts appear in all records as small upward and downward deflections. Calibration bars refer to B and C. D, spontaneous subthreshold activity of the same neuron. The membrane potential fluctuated between hyperpolarised potentials (down-states), during which little or no synaptic background activity was observed, and 10-20 mV more depolarised membrane states (up-states) with synaptic background activity.
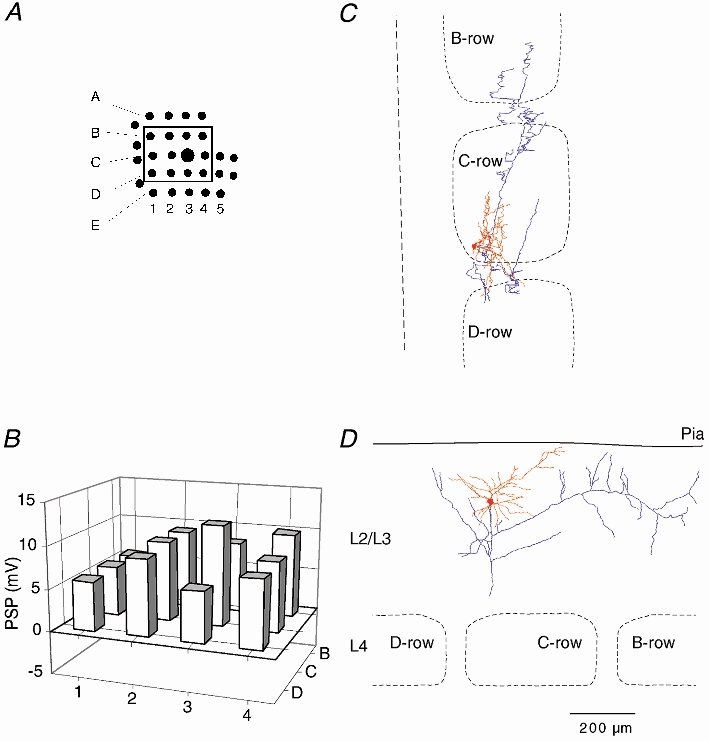
Figure 2. Subthreshold RF map and dendritic and axonal arborisation of a barrel-related pyramid in L3.
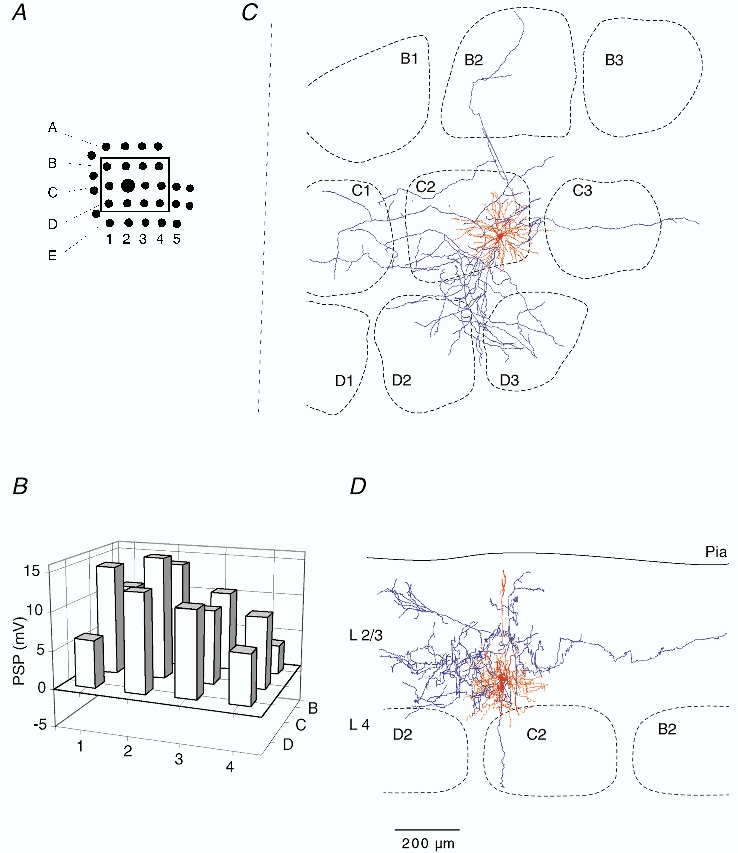
A, schematic drawing of the position of mapped whiskers. The box delineates those whiskers,that were deflected and whose Vm responses were quantified. B, subthreshold peak response to deflection onset of the whiskers shown in A. Height of each bar represents mean amplitude of the response. Position of the whisker is identified by the intersection of arc lines (1-4) and row lines (B-D). C, dendritic (red) and axonal (blue) arbors of the cell recorded from, when projected onto the horizontal plane, shown relative to barrel borders in the horizontal plane. D, same reconstruction projected onto a vertical plane, parallel to arc 2 (the projection plane is indicated in C by the dashed line). The cell was reconstructed from tangential sections.
Figure 3. Subthreshold RF map and arborisation of a barrel-related cell in L2.
A, position of mapped whiskers. The box delineates those whiskers whose Vm responses were quantified. B, subthreshold peak response to deflection onset of different whiskers. Height of each bar represents the mean peak amplitude. Position of the whisker is identified by the intersection of arc and row lines, as in Fig. 2. C, dendritic (red) and axonal (blue) arbors of the cell recorded from, when projected onto the horizontal plane, shown relative to barrel borders in the horizontal plane. D, same reconstruction projected onto a vertical plane, parallel to arc 2 (the projection plane is indicated in C by the dashed line). The cell was reconstructed from coronal sections.
RFs of septum-related pyramidal cells
The subthreshold RF and morphology of a L3 pyramid located above a septum are illustrated in Fig. 4. We refer to these pyramids as septum-related cells in L3. This cell responded to whisker deflection with depolarisations of small to intermediate amplitude (< 5 mV). The other septum-related cell in L3 barely responded to single-whisker stimuli (not shown). The dendritic arbors identified both cells as tufted pyramidal cells and their main axon projected through a septum.
Figure 4. Subthreshold RF map and arborisation of a septum-related cell in L3.
A, position of mapped whiskers. The box delineates those whiskers whose Vm responses were quantified. B, subthreshold peak response to deflection onset of different whiskers. Height of each bar represents the mean peak amplitude. Position of the whisker is identified by the intersection of arc and row lines, as in Fig. 2. C, dendritic (red) and axonal (blue) arbors of the cell recorded from, when projected onto the horizontal plane, shown relative to barrel borders in the horizontal plane. D, same reconstruction projected onto a vertical plane, parallel to arc 2 (the projection plane is indicated in C by the dashed line). The cell was reconstructed from tangential sections.
The subthreshold RF and morphology of a septum-related L2 cell are shown in Fig. 5. Like most of the septum-related cells it responded only weakly to stimulation of any of the whiskers and the responses lacked spatial tuning. The responses of all eight septum-related cells to PW deflection were < 10 mV. The axon arbors projected across multiple columns and the dendritic arbors extended into regions above neighbouring columns.
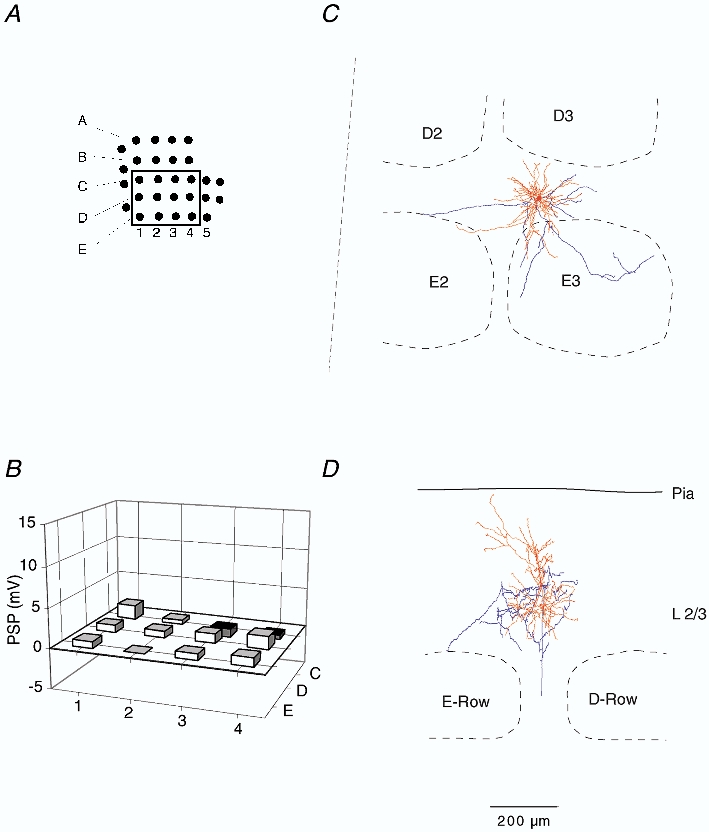
Figure 5. Subthreshold RF map and arborisation of a septum-related cell in L2.
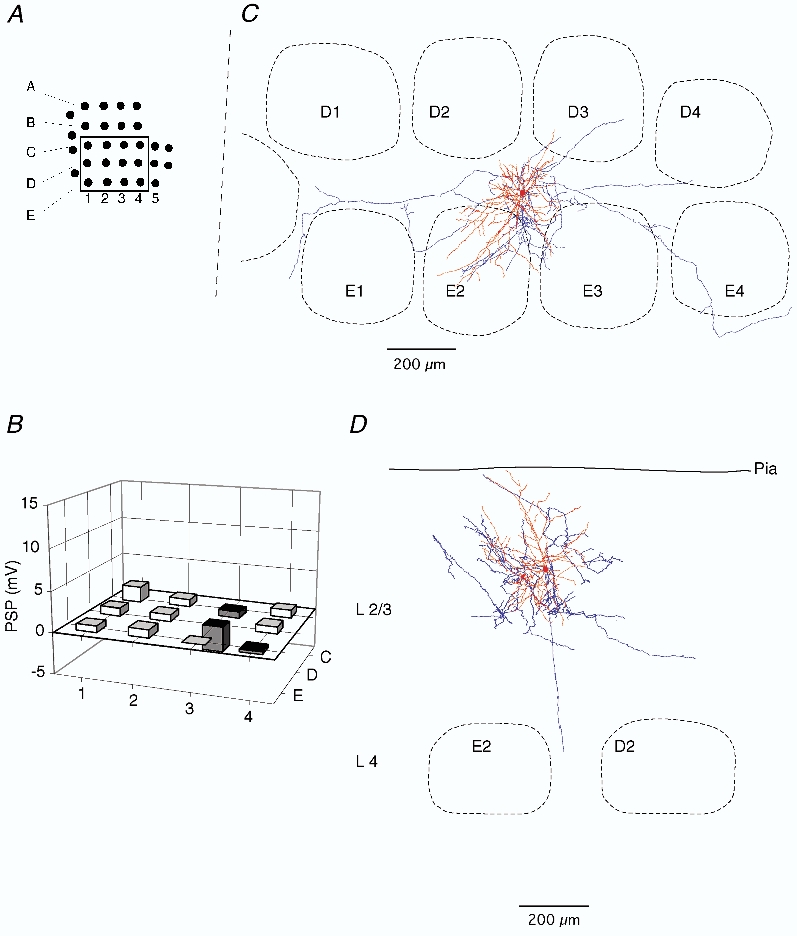
A, position of mapped whiskers. The box delineates those whiskers whose Vm responses were quantified. B, subthreshold peak response to deflection onset of different whiskers. Height of each bar represents the mean peak amplitude. Position of the whisker is identified by the intersection of arc and row lines, as in Fig. 2. C, dendritic (red) and (blue) axonal arbors of the cell recorded from, when projected onto the horizontal plane, shown relative to barrel borders in the horizontal plane. D, same reconstruction projected onto a vertical plane, parallel to arc 2 (the projection plane is indicated in C by the dashed line). The cell was reconstructed from tangential sections.
Dendritic and axonal arbor geometry and RF
Work on acute neocortical slices with paired recordings suggested that the axonal arbor of L4 spiny cells is matched to the dendritic arbor of L2/3 pyramids and both form a blob-like innervation zone comprising mostly their basal dendrites (Feldmeyer et al. 2002; Lübke et al. 2003). We therefore constructed averaged anatomical 2-D projection maps in the horizontal and in the vertical plane and compared these maps with the structure of the averaged subthreshold RF map. The aim was to find out how, on average, the geometry of L2/3 dendritic and axonal arbors may determine the shape of a RF.
Figure 6A1 illustrates the average subthreshold RF of barrel-related pyramids calculated from peak responses. Clearly the RFs comprise multiple whiskers. Thus barrel-related cells integrate inputs from multiple barrel columns as indicated by comparing the 50 % response amplitude contour (black) superimposed on the pattern of anatomical barrel columns (white, Fig. 6A1). Suprathreshold RFs are more sharply delineated with the 50 % response amplitude contour enclosing only about half of the area that is enclosed by the corresponding contour in the subthreshold RF (Fig. 6A2).
The dendritic arbors of barrel-related cells (Fig. 6B and D, red) extend, in the horizontal plane, roughly across only a single (PW) barrel column and thus cannot account for the large size of subthreshold RFs (Fig. 6A). Another anatomical substrate for the lateral borders of the area in L2/3 excited by a whisker deflection (and thus for RF size) could be the axonal arbors of L2/3 pyramids. The 2-D projection map of axonal arbors of barrel-related L2/3 pyramids (Figs. 6C and E, blue) illustrates that the axonal projection extends in the horizontal plane into all adjacent 1st order SuW columns in L2/3. In some neighbouring columns the density is too low to allow visualisation (Fig. 6C), but axonal arbors also extend to 2nd order SuW columns. The overlap of axonal arbors in L2/3 between PW and SuW columns could thus constitute one major anatomical determinant for multi-whisker RFs.
Figure 7A illustrates the average subthreshold RF of septum-related pyramids calculated from peak responses. As for barrel-related cells their RFs comprise multiple whiskers. The RFs and respective dendritic field 2-D projection maps for septum-related pyramids are illustrated in Fig. 7B and D (red). Here the basal dendritic arbor extends horizontally into several adjacent barrel columns, and the axonal arbors of septum-related neurons extend across multiple columns (Fig. 7C and E, blue), as in the case of barrel-related cells.
The dendritic arbors of barrel-related neurons were smaller than the dendritic trees of septum-related neurons (see Table 1). Compared to barrel-related cells the septum-related neurons had both a significantly larger horizontal dendritic field span (296 ± 45 vs. 411 ± 29 µm; P < 0.001, Student's unpaired t test) and a significantly larger total length of dendritic segments (5743 ± 1823 vs. 8277 ± 2600 µm; P < 0.02, unpaired t test). Thus, by their dendritic field span septum-related neurons almost fully extend across both septum and barrel and their dendrites overlap with dendritic segments of barrel-related cells.
Table 1.
Morphological characteristics of L2/3 cells
| All cells (n = 30) | Barrel-related L3 cells (n = 13) | Barrel-related L2 cells (n = 3) | Septum-related L3 cells (n = 2) | Septum-related L2 cells (n = 6) | |
|---|---|---|---|---|---|
| Cell-type classification | Pyramidal | Pyramidal | Pyramidal | Pyramidal | Pyramidal |
| Soma diameter (μm) | 16.1 ± 2.7 | 16.6 ± 2.3 | 16.5 ± 2.0 | 13.9 ± 0.3 | 16.0 ± 3.7 |
| Soma area (μm2) | 178 ± 60 | 201 ± 60 | 173 ± 65 | 141 ± 5 | 144 ± 60 |
| Number of dendrites | 6.8 ± 2.1 | 6.3 ± 2.3 | 6.5 ± 2.1 | 6.5 ± 0.7 | 8.2 ± 2.0 |
| Total dendrite length (μm) | 6708 ± 2439 | 6356 ± 1143 | 2375 ± 162 | 7506 ± 1409 | 8534 ± 2959 |
| Horizontal (along the arc of barrels) dendritic field span (μm) | 333 ± 68 | 295 ± 38 | 304 ± 33 | 413 ± 18 | 410 ± 36 |
| Vertical dendritic field span (μm) | 448 ± 144 | 527 ± 60 | 289 ± 54 | 620 ± 80 | 260 ± 66 |
Data are means ± s.d.
Sub- and suprathreshold RF maps
The AP responses of L2/3 pyramids to single-whisker stimulation were very weak and across cells the average spike count per PW stimulus was 0.031 ± 0.05 APs (n = 30). Figure 8 compares the averaged sub- and suprathreshold RF maps of barrel-related (Fig. 8A and B) and septum-related cells (Fig. 8C and D). RF response histograms were averaged across all cells of each type after aligning them with respect to the PW subthreshold response. Barrel-related cells (n = 16) had a PW depolarisation of 9.1 ± 4.5 mV and deflection of the PW caused a depolarisation that clearly exceeded average SuW-evoked depolarisations (Fig. 8B). PW-evoked depolarisations of septum-related cells (n = 8) were roughly half the size of the barrel-related responses (5.0 ± 2.8 mV, t test, P < 0.04) and subthreshold RFs were almost symmetric. For both ensembles of cells the AP responses were very small (barrel-related cells 0.026 ± 0.049 and septum-related cells 0.007 ± 0.017 APs per PW stimulus). In septum-related cells AP counts were so low that they could not be quantified with a reasonable number of entries. While sorting of responses according to barrel-related vs. septum-related location resulted in different average RFs, the sorting of responses according to laminar location did not (data not shown). In particular the amplitude of PW-evoked PSPs was not significantly different between L2 cells (6.7 ± 4.3 mV) and L3 cells (9.5 ± 4.8 mV; unpaired t test, P > 0.1).
Figure 8. Comparison of averaged sub- and suprathreshold RF maps.
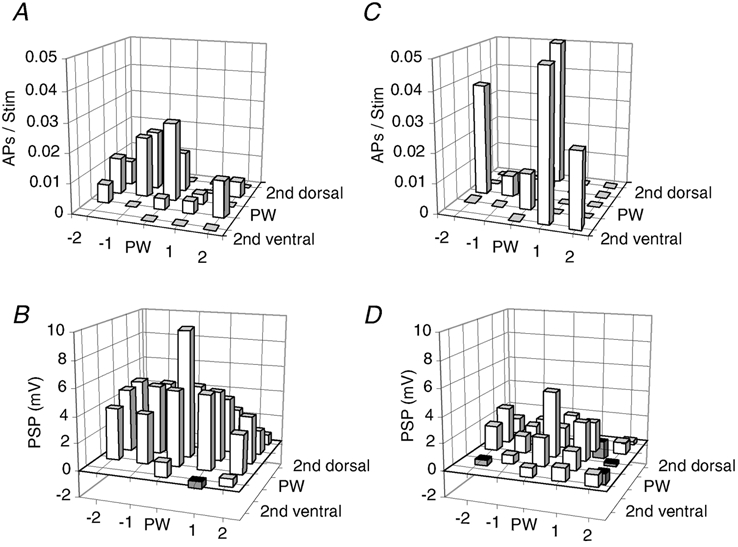
A, average suprathreshold (AP) RF map for barrel-related cells (n = 16). Prior to averaging RFs were aligned to the PW position determined by the subthreshold RF map. The position of a whisker is given by the intersection of horizontal and vertical lines. APs refers to average number of APs per deflection. B, average subthreshold (PSP) RF map for barrel-related cells (n = 16). C, average suprathreshold (AP) RF map for septum-related cells (n = 7). D, average subthreshold (PSP) RF map for septum-related cells (n = 5). To reveal the differential responsiveness of barrel and septum cells, the top two (A and C) and the bottom two graphs (B and D) have the same scale. Note that the plot shown in C is based on a small number of responses and is thus very noisy. B-D, conventions as in A.
Factors determining AP activity
To test whether the low AP counts were related to the loading of the cell with pipette solution during the whole-cell recording, we measured AP rates in the cell-attached recording configuration prior to whole-cell recording. Spontaneous AP rates were about twofold lower before break-in than after (see also Margrie et al. 2002), indicating that loading a cell with pipette solution increased rather than decreased its AP activity (data not shown). Evoked responses before and after break-in were similar (Margrie et al. 2002). AP rates could be low because the cell's membrane potential was well below (15-40 mV) the AP threshold (Table 2). This view is supported by current injection experiments. The current-AP frequency plots indicated that a depolarisation by 29 ± 5 mV generated APs.
Table 2.
Passive membrane properties of L2/3 cells
| All cells (n = 30) | Barrel-related L3 cells (n = 13) | Barrel-related L2 cells (n = 3) | Septum-related L3 cells (n = 2) | Septum-related L2 cells (n = 6) | |
|---|---|---|---|---|---|
| Resting membrane potential (mV) | −83.0 ± 4.0 | −83.4 ± 3.1 | −83.6 ± 7.1 | −83.7 ± 4.0 | −77.2 ± 4.7 |
| Steady state Rin (MΩ) | 31 ± 12 | 26 ± 9 | 38 ± 14 | 28 ± 11 | 37 ± 6 |
| Depolarisation required for AP initiation (mV) | 29 ± 5 | 29 ± 4 | 31 ± 10 | 25 ± 4 | 31 ± 7 |
Data are means ± s.d.Rin, input resistance.
Functional differences between morphologically identified classes of L2/3 cells
Direction sensitivity
Responses to stimuli from four different directions were measured in a subset of cells (n = 18). An example of a cell with direction-dependent response amplitudes is shown in Fig. 9A and B. Both barrel- and septum-related cells were only moderately direction selective (Fig. 9C). The average directionality index was 0.25 ± 0.15, significantly different from 0, with little difference between barrel-related and septum-related cells (P > 0.4, t test). The direction sensitivity data of all cells were pooled (Fig. 9D) and suggest on average a preferred synaptic response to deflection in the backward and downward direction.
Figure 9. Responses to stimuli from different directions.
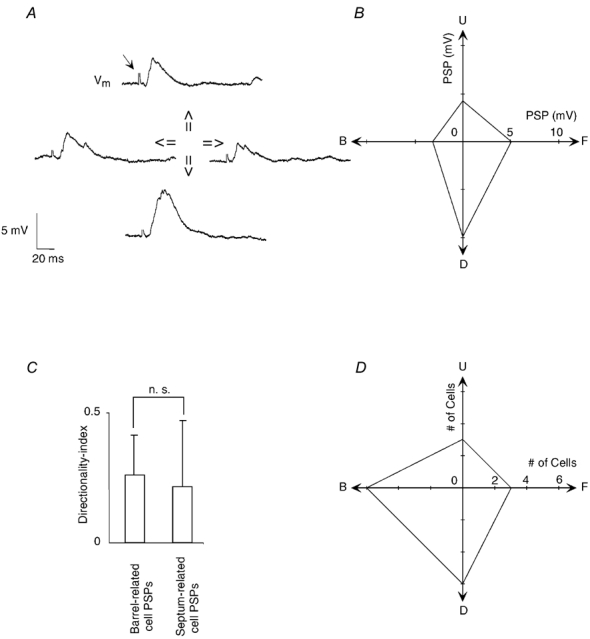
A, subthreshold responses of a barrel-related L3 pyramidal cell to varying stimulus directions. The stimulation artefact seen in all traces is indicated by the small arrow in the uppermost trace. B, direction tuning of PSPs, same cell as in A. Same scale for x- and y-axis. C, directionality indices for PSPs for all supragranular cells tested (n = 16). Unity value represents completely directional responses, value of 0 represent completely non-directional responses. Error bars represent 1 s.d.D, direction preferences of all recorded cells, convention for direction as in B. Same scale for x- and y-axis.
Multi-whisker and single-whisker deflection
In Fig. 10 the response amplitudes to optimally positioned multi-whisker deflection (an airpuff stimulus, which deflected 4-8 whiskers in 2-3 whisker rows by roughly 10 deg) are plotted against the response amplitudes evoked by single PW deflections (driven by the piezo). The overall range of responses evoked by an airpuff was similar to the range of responses evoked by deflection of a single whisker. Barrel-related cells showed significantly stronger airpuff responses than septum-related cells (unpaired t test, P < 0.05). L3 responses were larger than L2 responses but this difference was not significant (unpaired t test, P > 0.27) and may have resulted from the larger fraction of septum-related cells in the L2 sample. The response amplitudes to multi-whisker airpuff stimuli and to PW deflections were remarkably similar. In barrel-related cells a 10.6 mV airpuff response compares to a 9.1 mV PW response, in septum-related cells a 4.3 mV airpuff response compares to a 5.0 mV PW response. From Fig. 10 it is also clear that the response amplitude difference between barrel-related (b-rel) and septum-related (s-rel) cells is not simply a byproduct of the unequal laminar origin of the cell sample. Instead intralaminar comparisons of response amplitudes of barrel- and septum-related cells to airpuffs (L3 b-rel 10.2 mV vs. L3 s-rel 5.8 mV; L2 b-rel 12.7 mV vs. L2 s-rel 3.9 mV) and to PW piezo stimuli (L3 b-rel 9.7 mV vs. L3 s-rel 5.6 mV; L2 b-rel 6.8 mV vs. L2 s-rel 4.8 mV) lead to the same picture as comparisons where data are pooled across layers. Since the responses of septum-related cells to optimally positioned multi-whisker stimuli are slightly smaller than their PW responses, the overall unresponsiveness of septum-related cells cannot be attributed to the use of single-whisker stimuli.
Figure 10. Responses to single- and multi-whisker stimulation.
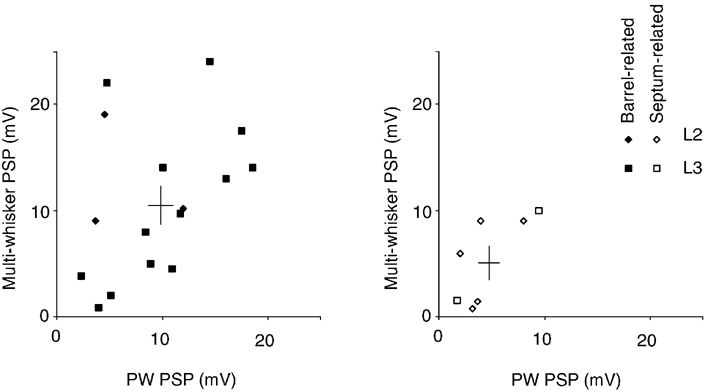
Left: barrel-related cells. Plot of multi-whisker response vs. PW response (n = 16). The two bars indicate the means ± s.e.m. Right: septum-related cells. Plot of multi-whisker response vs. PW response (n = 8).
Contribution of inhibitory inputs
Under our experimental conditions membrane potentials were close to the expected chloride reversal potential. As a consequence the contribution of inhibitory inputs to PSPs was difficult to assess. We compared the time course and amplitude of PW responses (n = 4) at their normal membrane potentials (in this sample around -80 mV, Table 2) with PW responses recorded while depolarising the same cells by current injection to a prestimulus membrane potential of -55 or -45 mV (data not shown). Inhibitory inputs should be hyperpolarising at this potential. Pre-depolarisation weakly reduced the response amplitude of PW-evoked synaptic responses during the initial 10 ms of the response and slightly increased the amplitude during later parts of the response. This suggests that inhibitory conductances were comparatively weak and acted primarily early in the response, and that during later parts of the PW response the effect of inhibitory inputs is balanced out by the contribution of NMDAR-dependent conductances. Somewhat larger effects of pre-depolarisation (and presumably inhibitory inputs) were revealed only with strong whisker stimuli (> 10 deg deflection, data not shown). SuW stimulation occasionally evoked hyperpolarising responses and this was particularly common in septum-related cells (Fig. 8D).
Temporal response properties
The different, morphologically identified neuron classes had different RFs when constructed from the peak PSP responses. The PSPs, however, also had a different time course on a time scale of about 150 ms. This means that the RF of a L2/3 cell and conversely the representation of a whisker deflection in L2/3 is dynamic (Brecht & Sakmann, 2002b; Petersen et al. 2003).
The left panels in Fig. 11 show superimposed traces of PW responses recorded in different classes of L2/3 cells, in examples that were selected to illustrate supra- and subthreshold responses of barrel- and septum-related cells. Spike responses showed, in most (Fig. 11A) but not all of the cases (Fig. 11B), substantial temporal scatter and were extremely sparse (Fig. 11E).
Figure 11. Suprathreshold responses of barrel- and septum-related cells.
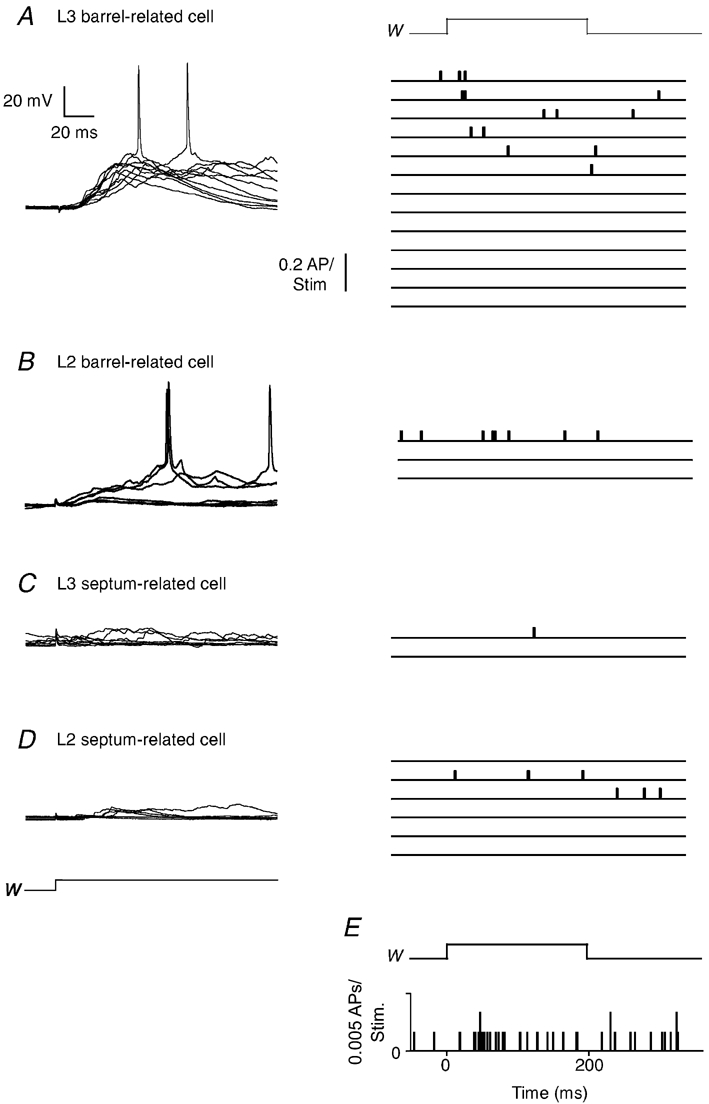
A, left: records of 10 superimposed responses of a barrel-related cell to PW deflection. Right: peristimulus time histograms (PSTHs) of 13 L3 barrel-related cells. Bin width of PSTHs is 0.5 ms. B, left: responses of a L2 barrel-related cell. Right: PSTHs of 3 L2 barrel-related cells. C, left: responses of a L3 septum-related cell. Right: PSTHs of 2 L3 septum-related cells. D, left responses of a L2 septum-related cell. Right: PSTHs of 6 L2 septum-related cells. E, population PSTHs of all cells (n = 30). Time course of PW deflection is above the PSTH (W).
Whisker position and response time course
Figure 12A shows traces of responses to stimulation of different whiskers recorded from barrel-related and septum-related cells. The latency to onset (Fig. 12B) and peak depolarisation (Fig. 12C) suggest that septum-related cells respond with longer peak latencies than barrel-related cells. Also, the response onset in septum-related cells begins later than in barrel-related cells (compare Fig. 12A top left and bottom left). This difference suggests that septum-related neurons receive only a small fraction of their input from barrel cells in L4 and from barrel-related cells in L3 and L2. The onset latency of the three L2 barrel-related cells was 11.7 ms, roughly 3 ms longer than the onset latencies of barrel-related L3 cells (compare Fig. 12A top left and top right, Fig. 12B). In barrel-related cells in both L2 and L3, the onset and peak latencies increased with the distance of the stimulated SuW whisker from the PW (Fig. 12B and C). In septum-related cells the peak latencies were independent of the stimulated whisker and on the position in the RF. The plot of onset latencies against peak latencies of PW-evoked responses (Fig. 12D) illustrates how different barrel- and septum-related cells were with respect to their response time course.
Figure 12. Latencies and time course of responses to PW and SuW deflection.
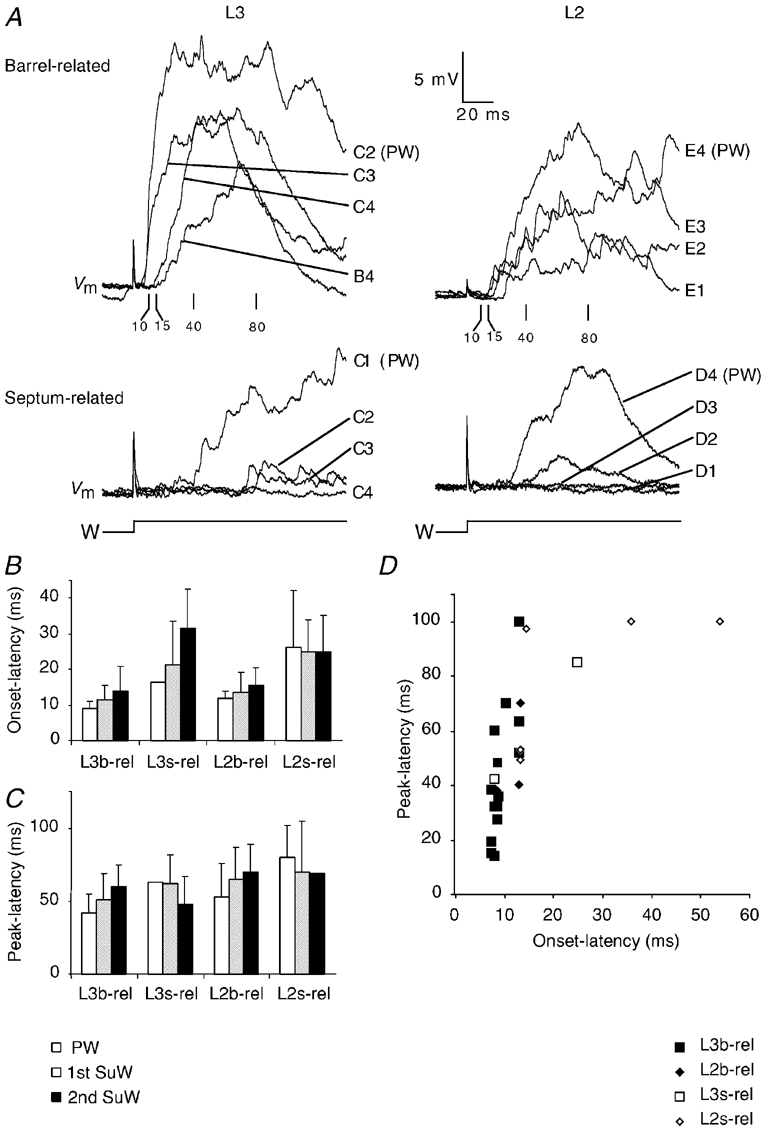
A, responses of barrel-related cells (upper family of traces) and septum-related cells (lower family of traces). Numbers below upper family of traces refer to poststimulus time (ms). B, onset latency differences to PW and SuW stimulation. Means ± s.d.C, peak latency differences to PW and SuW stimulation. Means ± s.d.D, plot of PW onset latencies against PW peak latencies. b-rel, barrel-related cells; s-rel, septum-related cells.
L3 and L2 cells were significantly different in onset (L3: 9.9 ± 4.0 ms, L2: 18.3 ± 14.8 ms, unpaired t test, P < 0.05) and peak latency (L3: 41.0 ± 21.4 ms, L2: 64.2 ± 22.2 ms, unpaired t test, P < 0.05). This interlaminar difference was much smaller than the respective difference between barrel- and septum-related cells. Onset latencies (b-rel: 9.6 ± 2.3 ms, s-rel: 23.3 ± 16.5 ms, unpaired t test, P < 0.005) and peak latencies (b-rel: 41.9 ± 19.9 ms, s-rel: 73.1 ± 23.3 ms, unpaired t test, P < 0.005) barely overlapped between barrel- and septum-related cells. From Fig. 12D it is also obvious that the timing difference between barrel- and septum-related cell responses is not accounted for by the unequal laminar origin of the cell sample. Instead intralaminar comparisons of onset latencies of barrel- and septum-related cells (L3 b-rel 9.0 ms vs. L3 s-rel 16.8 ms; L2 b-rel 11.6 ms vs. L2 s-rel 26.0 ms) and of peak latencies (L3 b-rel 40.1 ms vs. L3 s-rel 63.5 ms; L2 b-rel 49.3 ms vs. L2 s-rel 77.7 ms) suggest the same conclusion as comparisons where data were pooled across layers.
Figure 13 shows the response time course of averaged PW and SuW responses of barrel-related and septum-related cells. For barrel-related cells the SuW response time course is slower than that of the response to the PW deflection. For averaged responses the depolarisation time course of barrel-related cells (11.0 ms 20-80 % amplitude rise time; 32.3 ms peak latency; decay time constant 102.3 ms) clearly differed from that of septum-related cells (22.7 ms 20-80 % amplitude rise time; 82.9 ms peak latency; decay time constant 122.7 ms).
Figure 13. Average membrane potential changes after PW and SuW deflection in barrel-related and septum-related cells.
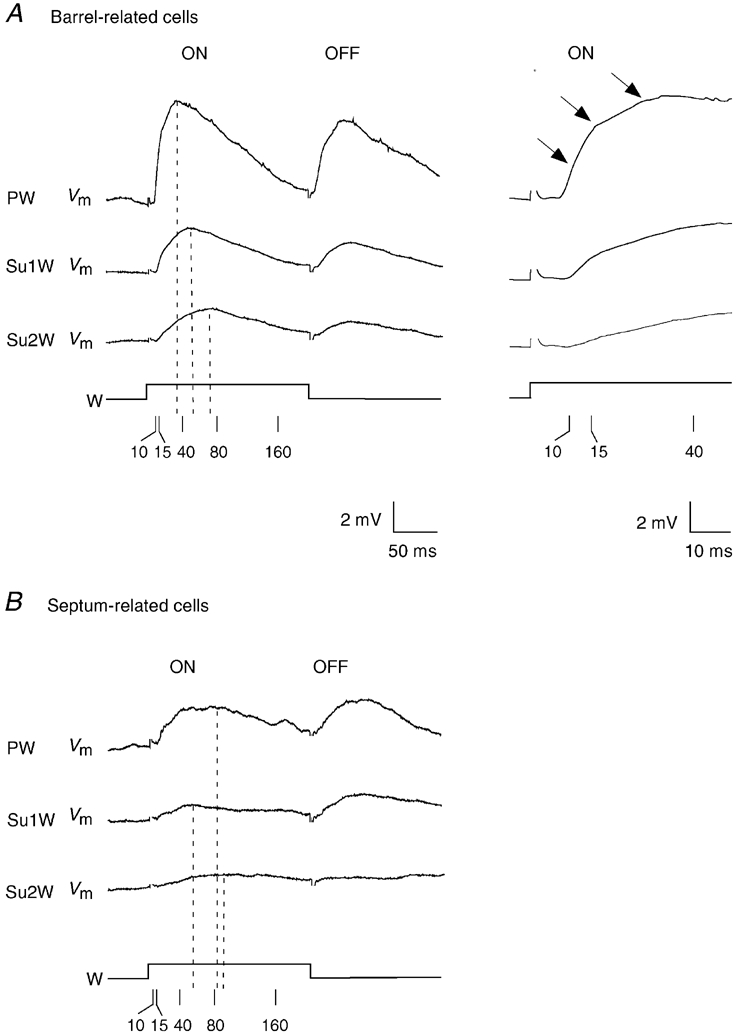
A, top left: average of all barrel-related cell (n = 16) onset and offset responses to PW, and first (Su1W) and second (Su2W) order SuW deflection. Top right: onset responses at higher temporal resolution. The arrows point to temporally distinct response components. B, average of all septum-related cell (n = 8) onset and offset responses to PW, and first (Su1W) and second (Su2W) order SuW deflection. Calibration as in A, left panel. Stimulus artefacts in A and B are partially blanked.
In the response average of barrel-related cells three components with different onset latencies and rise time can be differentiated (arrows in Fig. 13A). In individual stimulation trials the respective response components were often evoked in an all-or-none fashion and the response components depended differently on deflection amplitude (B. Sakmann & M. Brecht, manuscript in preparation; data not shown).
Time dependence of RF structure
The differences in time course between PW- and SuW-evoked responses indicate not only that a medium to strong whisker deflection is represented in a distributed, multi-columnar fashion but also that the cortical map is time dependent. Figure 14 illustrates the expansion and fading of subthreshold RFs of barrel-related and septum-related cells in the horizontal plane. The dynamic RFs also demonstrate a clear difference between barrel-related and septum-related cells. The barrel-related RFs are more dynamic (see also Fig. 13). Initial responses of barrel-related cells are observed at < 10 ms poststimulus time whereas in septum-related cells no activity is detected, supporting the view of a segregation of signalling in the two cell populations.
Figure 14. Time dependence of subthreshold RF structure.
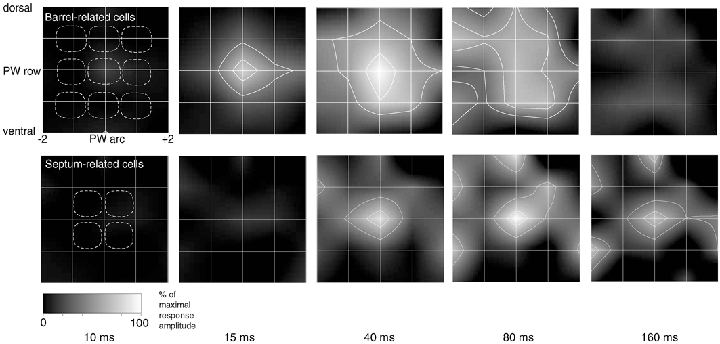
Subthreshold RFs plots. The grid of white lines represents the localisation of a whisker with respect to the PW as the intersection between horizontal and vertical lines. Response amplitudes are normalised with respect to the response to PW stimulation. The dashed white lines delineate the outlines of average anatomical barrels arranged around the PW barrel. Barrel representation as in Figs 6 and 7. Top panel: averaged and smoothed subthreshold RFs of barrel-related cells (n = 5) at different times ranging from 10 to 160 ms after whisker deflection. The same grey scaling applies to all RF plots. The white lines delineate the area of > 80 % and > 50 % of the maximal response to PW stimulation (maximal response at 15-20 ms for barrel cells and at 40 ms for septum cells). For clarity, the contour lines are shown only in those RF plots where the response reaches at least 50 % of the maximal amplitude. Bottom panel: time-resolved subthreshold RF plots for 5 septum-related cells (n = 5).
Short-term modification of responses during repetitive PW deflections
Rodents often engage their vibrissae in rhythmic whisking movements at frequencies between 5 and 15 Hz (Welker, 1964; Carvell & Simons, 1990). We stimulated PWs repetitively at a rate of 10 Hz. Figure 15A and B shows ensemble averages of the responses. Responses in L3 cells were only weakly depressing whereas in L2 they were depressed strongly (Fig. 15A-E). The difference in the ratio of the 1st to 10th response between L3 cells and L2 cells was significant (unpaired t test, P = 0.03). Barrel-related cells showed less depression than septum-related cells where at the end of the train (Fig. 15B) stimuli failed to evoke responses. Given the differential distribution of septum- and barrel-related cells in L2 and L3, it should be noted that the stronger depression in L2 cells was also observed when the L2/L3 comparison was restricted to barrel-related cells.
Figure 15. Responses to repetitive PW deflections (10 Hz trains).
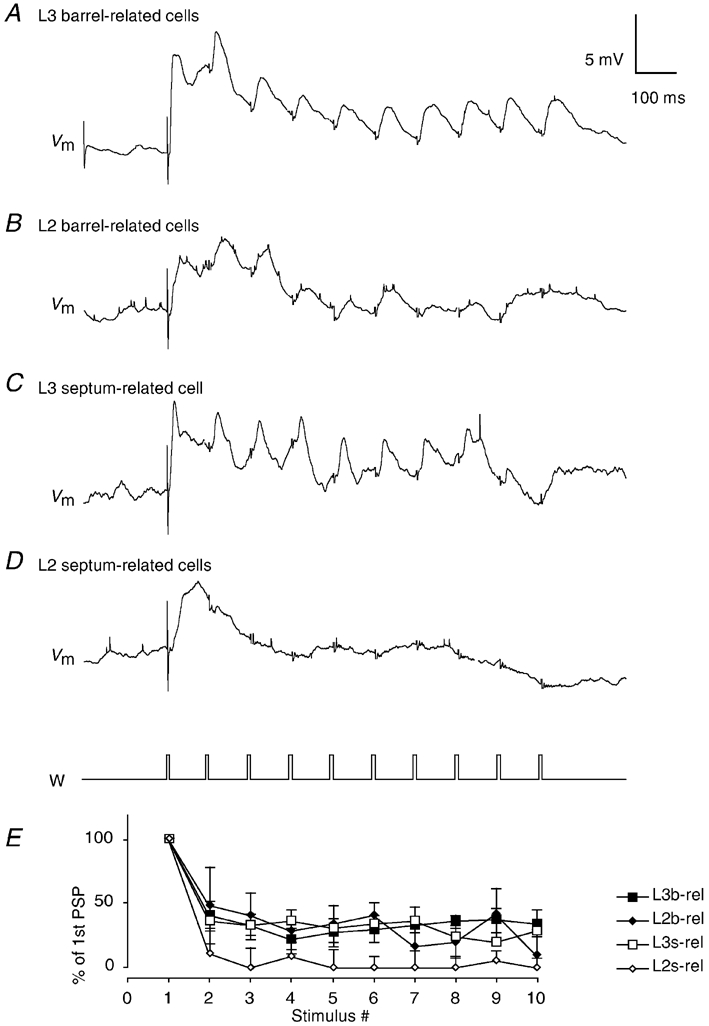
Stimuli were brief (2 ms) back and forth deflections (6 deg) applied at 10 Hz. All but the first needle-like stimulation artefacts in the respective traces (Vm) have been blanked. A, average response of 8 L3 barrel-related cells (average of 20 stimulation trials per cell) to repetitive stimuli. B, average response of 3 barrel-related L2 cells (average of 20 stimulation trials per cell). C, response of a septum-related L3 cell (average of 20 stimulation trials). D, response of 3 septum-related L2 cells (average of 20 stimulation trials per cell). E, average short-term modification of EPSPs during repetitive (10 Hz) deflection of whiskers in 4 classes of L2/3 neuron. Baseline to peak amplitudes are plotted. Only depolarising responses were quantified here, because with repetitive stimuli IPSPs cannot be distinguished from decaying excitatory responses. Means ± s.d.
DISCUSSION
Main findings
Layers 3 and 2 of rat barrel cortex contain of a network of two, anatomically and functionally separate, ensembles of cells - the barrel-related cells are located above barrels and in addition are probably less numerous than the septum-related cells that are located predominantly above septa. Both classes of cell receive inputs from a PW and from multiple, adjacent SuWs. Their subthreshold RFs measured with 6 deg deflections increase initially within a time span of tens of milliseconds from single-whisker to multi-whisker and then fade. Barrel-related pyramids show shorter onset and peak latencies and larger response amplitudes than septum-related cells, which barely respond with APs. It is noteworthy that, while the fraction of barrel-related cells is considerably larger in L3 than in L2, intralaminar comparisons indicate this difference in laminar distribution does not account for the different properties of barrel- and septum-related cells. In the following discussion we shall put these results into context with anatomical and functional properties of the columnar organisation of barrel cortex.
Barrel- and septum-related cells have different RFs
The separation between neuronal pathways projecting in the supragranular layers into barrel-related cells and septum-related cells with different RF sizes and dynamics is surprising because both L3 and L2 appear, at the level of cytoarchitecture, more homogeneous than L4 (Woolsey & Van der Loos, 1970). However ‘cell dense’ regions have been reported that are located above ‘rows’ of L4 barrels (Rice, 1995), possibly explaining why our sample of L3 cells is biased towards barrel-related cells. The segregation of excitation flow between barrel- and septum-related cells is in line with our observations of the properties of barrel and septum cells in L4, which show related differences in their response properties (Brecht & Sakmann, 2002b). The fact that barrel/septum pathways remain segregated in responses of L2/3 barrel- and septum-related cells is also surprising because the dendritic domains of these cells are clearly overlapping. This suggests that axons from barrels/septa do not connect in a purely probalistic manner to these cells but instead selectively target postsynaptic cells. A segregation of signalling between barrel- and septum-related cells is also supported by recent data from connectivity analysis in vitro (Shepherd et al. 2003) and by anatomical studies (see Kim & Ebner, 1999, for review). This view deviates from the suggestion that lemniscal and paralemniscal pathways merge in L2/3 as proposed by Ahissar et al. (2001).
The fact that PW- and SuW-evoked PSPs have different time-dependent amplitudes indicates that the representation of a whisker deflection at the subthreshold level in L2/3 is time dependent. Initially the RF is single-whisker dominated and then increases to a multi-whisker RF, in complete agreement with the cortical representational map measured by voltage-sensitive dye (VSD) imaging (Petersen et al. 2003).
When comparisons between L3 and L2 are restricted to barrel-related or septum-related pyramids, it is obvious that the size and the peak response amplitudes are comparable; however, L2 cells have longer onset latencies. This latency difference (≈3 ms) may arise from the fact that L3 cells, unlike L2 cells, can receive direct thalamic input, because their basal dendrites extend into L4 and because VPM afferents project into L3 (Jensen & Killackey, 1987; Arnold et al. 2001). In addition the latencies of peak depolarisations of both barrel-related and septum-related cells in L2 exceeded those of L3 cells by 10-40 ms. This interlaminar (L3 vs. L2) difference in peak response latency is far too large to be accounted for by conduction delays (Feldmeyer et al. 2002), suggesting that it is mediated by synaptic excitation of L2/3 pyramids by L2/3 pyramids located within the same barrel column.
Comparison with previous studies
Previous whole-cell recordings from unidentified cells in L2/3 reported broad subthreshold RFs when measured by the peak PSP amplitude (Moore & Nelson, 1998; Zhu & Connors, 1999). Whole-cell recordings from spiny cells in L4 also indicated dynamic RFs, which were, however, narrower than those of L2/3 cells. The representation of a deflection by PSPs faded more rapidly because at 80 ms poststimulus time PSPs are back to baseline (Brecht & Sakmann, 2002b). This clearly indicates that the late excitation of L2/3 pyramids was generated mostly by excitation within L2/3.
Cortical inhibition
While we observed hyperpolarising PSPs in a subset of SuW responses, PW-evoked hyperpolarisation was, in most cells, weak. Larger inhibition was revealed only with strong stimuli (> 10 deg whisker deflection) and when measuring responses at -45 mV membrane potential. These data suggest only a minor contribution of inhibition to PSPs under our stimulus conditions. These findings are in line with the results from in vivo targeted whole-cell recordings from L2/3 parvalbumin-positive interneurons, which demonstrated that these cells show relatively weak stimulus-evoked AP responses (Margrie et al. 2003). However, recordings from unidentified neurons (Moore & Nelson, 1998; Zhu & Connors, 1999) suggested a more prominent contribution of inhibition to responses in L2/3.
Microcircuits and signal flow arriving from L4 and propagating within L2/3
RFs of L2/3 cells comprise, depending on the amplitude of the whisker deflection and on the poststimulus time, one PW and then can expand to comprise multiple SuWs. These multi-whisker RFs are elongated along the rows of columns, in agreement with the single- and multi-columnar excitation measured by VSD imaging (Orbach et al. 1985; Petersen et al. 2003) and the results from multi-site unit recordings from non-identified barrel cortex cells (Petersen & Diamond, 2000). The temporal evolution of L2/3 responses we demonstrate here for two classes of L2/3 pyramids has been inferred by single- and multi-unit recordings in the supragranular layers of barrel cortex (Armstrong-James & Fox, 1987; Armstrong-James et al. 1992; Ahissar et al. 2001).
Thus, L2/3 pyramidal cell RFs when mapped by the peak response and with intermediately strong stimuli are much broader than L4 spiny cell RFs (compare Fig. 6A1 to Fig. 7A of Brecht & Sakmann, 2002b), suggesting that L2/3 is one locus of intercolumnar integration, in line with findings of single-unit studies on L2/3 response properties (Simons, 1978, 1995; Armstrong-James & Fox, 1987; Armstrong-James et al. 1992; Armstrong-James, 1995) and with findings from whole-cell recordings (Moore & Nelson, 1998; Zhu & Connors, 1999).
Anatomical substrate of RFs
What are the anatomical determinants for the early single- and late multi-whisker subthreshold RFs of barrel-related L2/3 pyramids? L4 cell axon collaterals of a column form synapses mostly on dendritic arbors of barrel-related pyramids in L2/3 (Feldmeyer et al. 2002; Lübke et al. 2003). The predominantly column-restricted L4 to L2/3 projections and the horizontally restricted average receptive field of the basal dendritic arbor of L2/3 pyramids (Brecht & Sakmann, 2002b; Lübke et al. 2003) can account for the PW-restricted RF measured early during the response or when the RF is measured by small deflections, in accordance with the single-column-restricted excitation measured by VSD imaging (Petersen et al. 2003).
The anatomical substrate of multi-whisker RFs seen later during a large response could be severalfold. (i) The axonal projections within L2/3, where the long horizontal axonal arbor collaterals of barrel-related L2/3 pyramids cross the borders of their home (PW) column mostly in L2/3. These axonal arbors seem to be the major anatomical substrate for the multi-whisker RFs of L2/3 pyramids and they are, most probably, responsible for the late intercolumnar spread of excitation evoked by a moderate or strong deflection (> 2 deg) (Lübke et al. 2003; Petersen et al. 2003). Dendritic and axonal segments of barrel-related L2/3 pyramidal cells in different columns extensively overlap and the axonal architecture of L2/3 cells is strikingly different from that of L4 cells (compare Fig. 6C with Fig. 7C of Brecht & Sakmann, 2002b). (ii) The axonal arbors of L4 barrel cells show small overlap with adjacent columns in L2/3 and even within L4 there are few intercolumnar connections (see Fig. 5 of Brecht & Sakmann, 2002b). (iii) The multi-whisker RFs could arise from the divergence of VPM axon collaterals in several L4 barrels (Arnold et al. 2001). (iv) VPM multi-whisker excitation (MWE) cells (Brecht & Sakmann, 2002a) could be a source of multi-whisker inputs.
Representation of whisker deflection by sub- and suprathreshold signals
RFs constructed from PSPs and APs in L2/3 are substantially different. The septum-related cells barely show evoked AP activity, while they all respond with subthreshold responses. The suprathreshold RF of barrel-related cells is much narrower than the subthreshold RF. Thus the representation of a whisker deflection in supragranular cells is very different depending on whether it is measured at the input (PSP) or the output (AP) stage of the ensemble of L2/3 pyramids.
Low AP activity of L2/3 cells
The supragranular neurons described here generated APs only at a very low rate. Cell-attached recordings from cortical cells indicate that low AP rates in the present work did not result from the loading of cells with high K+ pipette solution (Margrie et al. 2002). In whole-cell recordings of L2/3 cells in awake animals, low firing rates are also observed, which are only slightly higher than the ones observed here (Margrie et al. 2002; M. Brecht & B. Sakmann, unpublished data). Thus the overall unresponsiveness of supragranular layers cannot be attributed to the effects of urethane anaesthesia. In line with previous in vivo whole-cell recording studies (Moore & Nelson, 1998; Zhu & Connors, 1999; for a detailed discussion see Brecht & Sakmann, 2002b), we argue that unit recording with extracellular electrodes on the one hand and whole-cell recording with patch pipettes on the other may result in very different estimates of the percentage of cells responding with APs. A possible cause is a sampling bias of unit recordings against the seemingly numerous cortical cells with low spontaneous and evoked AP rates. Given the low spike counts we observe it is all the more surprising that the timing of PSP and of extracellularly recorded APs in L2/3 is often in good correspondence. This is particularly obvious for our observations on PSPs evoked by repetitive stimuli, which show a time course similar to that of extracellularly recorded APs evoked by repetitive stimuli (Ahissar et al. 2001).
PSP and AP generation in L2/3
Virtually all L2/3 cells responded with PSPs upon deflection of the PW. Based on cell density (Keller & Carlson, 1999) and L2/3 volume of a barrel column (Gottlieb & Keller, 1997) we estimate that ≈4000 pyramids are located in L2/3 of a barrel column. In addition to the PW at least eight SuWs elicited PSPs. This must mean that a strong whisker deflection activated ≈40 000 pyramids in L2/3 at the PSP level. Only a small fraction of L2/3 cells in a column also generated APs, of the order of 3 %. Assuming that whole-cell recording gives an unbiased estimate of the AP-generating cells, this would indicate that out of the ≈4000 pyramids in L2/3 of a PW column only about 120 pyramids generate APs. As SuW stimulation generated APs less frequently, an upper estimate of the number of pyramids in L2/3 that generate APs in response to a whisker deflection would not exceed 200-300.
The observation that AP rates in L2/3 are very low is inconsistent with the idea that L2/3 neurons are close to AP threshold and receive a large number (> 1000) of excitatory inputs that are balanced by inhibitory inputs (a ‘high input’ regime, as has been proposed for monkey visual cortex; Shadlen & Newsome, 1998). Instead sensory responses with few APs may reflect a ‘selective input’ mechanism (Brecht & Sakmann, 2002b) that determines the output of L2/3 cells. Relatively few and precisely timed combinations of unitary synaptic inputs from L4, in the order of a few tens per cell, generate a stimulus-specific AP response in a small fraction of pyramids in L2/3.
Such well-timed combinations of inputs that fire the pyramid could be enhanced by back-propagating APs (Waters et al. 2003) being part of spike timing-dependent mechanisms of synaptic plasticity. Given the low AP rates of most cells it will be essential to delineate the significance of the wide spread of subthreshold PSPs in the cortical representation of sensory stimuli.
Acknowledgments
We would like to thank Troy Margrie for technical advice, and Fritjof Helmchen, Troy Margrie, Carl Petersen and Nathan Urban for comments on the manuscript. Marlies Kaiser, Rolf Rödel, Peter Mayer and Karl Schmidt provided excellent technical assistance. We are grateful for the help of Andreas Krauss and Laleh Sinai-Esfahani in cell staining and reconstruction.
REFERENCES
- Ahissar E, Sosnik R, Bagdasarian K, Haidarliu S. Temporal frequency of whisker movement. II. Laminar organization of cortical representations. J Neurophysiol. 2001;86:354–367. doi: 10.1152/jn.2001.86.1.354. [DOI] [PubMed] [Google Scholar]
- Armstrong-James M. The nature and plasticity of sensory processing within adult rat barrel cortex. In: Jones EG, Diamond IT, editors. The Barrel Cortex of Rodents. New York: Plenum Press; 1995. pp. 333–374. [Google Scholar]
- Armstrong-James M, Fox K. Spatio-temporal divergence and convergence in the rat "barrel" cortex. J Comp Neurol. 1987;263:265–281. doi: 10.1002/cne.902630209. [DOI] [PubMed] [Google Scholar]
- Armstrong-James M, Fox K, Das-Gupta A. Flow of excitation within rat barrel cortex on striking a single vibrissa. J Neurophysiol. 1992;68:1345–1358. doi: 10.1152/jn.1992.68.4.1345. [DOI] [PubMed] [Google Scholar]
- Arnold PB, Li CX, Waters RS. Thalamocortical arbors extend beyond single cortical barrels: an in vivo tracing study in the rat. Exp Brain Res. 2001;136:152–168. doi: 10.1007/s002210000570. [DOI] [PubMed] [Google Scholar]
- Blanton MG, Lo Turco LL, Kriegstein AR. Whole cell recording from neurons in slices of reptilian and mammalian cerebral cortex. J Neurosci Meth. 1989;30:203–210. doi: 10.1016/0165-0270(89)90131-3. [DOI] [PubMed] [Google Scholar]
- Brecht M, Sakmann B. Whisker maps of neuronal subclasses in the rat ventral posterior medial (VPM) thalamus identified by whole-cell voltage recording and morphological reconstruction. J Physiol. 2002a;538:495–515. doi: 10.1113/jphysiol.2001.012334. [DOI] [PMC free article] [PubMed] [Google Scholar]
- Brecht M, Sakmann B. Dynamic representation of whisker deflection by postsynaptic potentials in morphologically reconstructed spiny stellate and pyramidal cells in the barrels and septa of layer 4 in rat somatosensory cortex. J Physiol. 2002b;543:49–70. doi: 10.1113/jphysiol.2002.018465. [DOI] [PMC free article] [PubMed] [Google Scholar]
- Carvell GE, Simons DJ. Biometric analyses of vibrissal tactile discrimination in the rat. J Neurosci. 1990;10:2638–2648. doi: 10.1523/JNEUROSCI.10-08-02638.1990. [DOI] [PMC free article] [PubMed] [Google Scholar]
- Diamond ME. Somatosensory thalamus of the rat. In: Jones EG, Diamond IT, editors. The Barrel Cortex of Rodents. New York: Plenum Press; 1995. pp. 189–219. [Google Scholar]
- Feldmeyer D, Lübke J, Silver RA, Sakmann B. Synaptic connections between layer 4 spiny neurone-layer 2/3 pyramidal cell pairs in juvenile rat barrel cortex: physiology and anatomy of interlaminar signaling within a cortical column. J Physiol. 2002;538:803–822. doi: 10.1113/jphysiol.2001.012959. [DOI] [PMC free article] [PubMed] [Google Scholar]
- Friedberg MH, Lee SM, Ebner FF. Modulation of receptive field properties of thalamic somatosensory neurons by the depth of anaesthesia. J Neurophysiol. 1999;81:2243–2252. doi: 10.1152/jn.1999.81.5.2243. [DOI] [PubMed] [Google Scholar]
- Gottlieb JP, Keller A. Intrinsic circuitry and physiological properties of pyramidal neurons in rat barrel cortex. Exp Brain Res. 1997;115:47–60. doi: 10.1007/pl00005684. [DOI] [PubMed] [Google Scholar]
- Hines ML, Carnevale NT. The NEURON simulation environment. Neural Comp. 1997;9:1179–1209. doi: 10.1162/neco.1997.9.6.1179. [DOI] [PubMed] [Google Scholar]
- Horikawa K, Armstrong WE. A versatile means of intracellular labeling: injection of biocytin and its detection with avidin conjugates. J Neurosci Meth. 1988;25:1–11. doi: 10.1016/0165-0270(88)90114-8. [DOI] [PubMed] [Google Scholar]
- Hubel DH, Wiesel TN. Receptive fields, binocular interaction and functional architecture in the cat's visual cortex. J Physiol. 1962;148:106–154. doi: 10.1113/jphysiol.1962.sp006837. [DOI] [PMC free article] [PubMed] [Google Scholar]
- Ito M. Simultaneous visualization of cortical barrels and horseradish peroxidase injected layer 5b vibrissa neurons in the rat. J Physiol. 1992;454:247–265. doi: 10.1113/jphysiol.1992.sp019263. [DOI] [PMC free article] [PubMed] [Google Scholar]
- Jensen KF, Killackey HP. Terminal arbors of axons projecting to the somatosensory cortex of the adult rat. I. The normal morphology of specific thalamocortical afferents. J Neurosci. 1987;11:3529–3543. doi: 10.1523/JNEUROSCI.07-11-03529.1987. [DOI] [PMC free article] [PubMed] [Google Scholar]
- Keller A, Carlson GC. Neonatal whisker clipping alters intracortical, but not thalamocortical projections, in rat barrel cortex. J Comp Neurol. 1999;412:83–94. doi: 10.1002/(sici)1096-9861(19990913)412:1<83::aid-cne6>3.0.co;2-7. [DOI] [PubMed] [Google Scholar]
- Kim U, Ebner FF. Barrels and septa: separate circuits in rat barrels field cortex. J Comp Neurol. 1999;408:489–505. [PubMed] [Google Scholar]
- Koralek KA, Jensen KF, Killackey HP. Evidence for two complementary patterns of thalamic input to the rat somatosensory cortex. Brain Res. 1988;463:346–351. doi: 10.1016/0006-8993(88)90408-8. [DOI] [PubMed] [Google Scholar]
- Lu SM, Lin RC. Thalamic afferents of the rat barrel cortex: a light- and electron-microscopic study using Phaseolus vulgaris leucoagglutinin as an anterograde tracer. Somatosens Mot Res. 1993;10:1–16. doi: 10.3109/08990229309028819. [DOI] [PubMed] [Google Scholar]
- Lübke J, Roth A, Feldmeyer D, Sakmann B. Morphometric analysis of the columnar innervation domain of neurones connecting Layer 4 and Layer 2/3 of juvenile rat barrel cortex. Cereb cortex. 2003;13:1051–1063. doi: 10.1093/cercor/13.10.1051. [DOI] [PubMed] [Google Scholar]
- Margrie TW, Brecht M, Sakmann B. In vivo low resistance whole-cell recordings from neurons in the awake and anaesthetized and awake mammalian brain. Pflüg Arch. 2002;444:491–498. doi: 10.1007/s00424-002-0831-z. [DOI] [PubMed] [Google Scholar]
- Margrie TW, Meyer A, Caputi A, Monyer H, Hasan M, Schaefer AT, Denk W, Brecht M. Targeted whole-cell recordings in the mammalian brain in vivo. Neuron. 2003;39:911–918. doi: 10.1016/j.neuron.2003.08.012. [DOI] [PubMed] [Google Scholar]
- Moore CI, Nelson SB. Spatio-temporal subthreshold receptive fields in the vibrissa representation of rat primary somatosensory cortex. J Neurophysiol. 1998;80:2882–2892. doi: 10.1152/jn.1998.80.6.2882. [DOI] [PubMed] [Google Scholar]
- Mountcastle VB. Modality and topographic properties of single neurons of cat's somatosensory cortex. J Neurophysiol. 1957;20:403–434. doi: 10.1152/jn.1957.20.4.408. [DOI] [PubMed] [Google Scholar]
- Orbach HS, Cohen LB, Grinvald A. Optical mapping of electrical activity in rat somatosensory and visual cortex. J Neurosci. 1985;7:1886–1895. doi: 10.1523/JNEUROSCI.05-07-01886.1985. [DOI] [PMC free article] [PubMed] [Google Scholar]
- Petersen CCH, Sakmann B. The excitatory neuronal network of rat layer 4 barrel cortex. J Neurosci. 2000;20:7579–7586. doi: 10.1523/JNEUROSCI.20-20-07579.2000. [DOI] [PMC free article] [PubMed] [Google Scholar]
- Petersen CCH, Grinvald A, Sakmann B. Spatiotemporal dynamics of sensory responses in layer 2/3 of rat barrel cortex measured in vivo by voltage-sensitive dye imaging combined with whole-cell voltage recordings and neuron reconstructions. J Neurosci. 2003;23:1298–1309. doi: 10.1523/JNEUROSCI.23-04-01298.2003. [DOI] [PMC free article] [PubMed] [Google Scholar]
- Petersen RS, Diamond ME. Spatial-temporal distribution of whisker-evoked activity in rat somatosensory cortex and the coding of stimulus location. J Neurosci. 2000;20:6135–6143. doi: 10.1523/JNEUROSCI.20-16-06135.2000. [DOI] [PMC free article] [PubMed] [Google Scholar]
- Rice FL. Comparative aspects of barrel structure and development. In: Jones EG, Diamond IT, editors. The Barrel Cortex of Rodents. New York: Plenum Press; 1995. pp. 1–76. [Google Scholar]
- Shadlen MN, Newsome WT. The variable discharge of cortical neurons: implications for connectivity, computation, and information coding. J Neurosci. 1998;18:3870–3896. doi: 10.1523/JNEUROSCI.18-10-03870.1998. [DOI] [PMC free article] [PubMed] [Google Scholar]
- Shepherd GMG, Pologruto TA, Svoboda K. Circuit analysis of experience-dependent plasticity in the developing rat barrel cortex. Neuron. 2003;38:277–289. doi: 10.1016/s0896-6273(03)00152-1. [DOI] [PubMed] [Google Scholar]
- Simons DJ. Response properties of vibrissa units in rat SI somatosensory neocortex. J Neurophysiol. 1978;41:798–820. doi: 10.1152/jn.1978.41.3.798. [DOI] [PubMed] [Google Scholar]
- Simons DJ. Multi-whisker stimulation and its effects on vibrissa units in rat SmI barrel cortex. Brain Res. 1983;276:178–182. doi: 10.1016/0006-8993(83)90561-9. [DOI] [PubMed] [Google Scholar]
- Simons DJ. Neuronal integration in the somatosensory whisker/barrel cortex. In: Jones EG, Diamond IT, editors. The Barrel Cortex of Rodents. New York: Plenum Press; 1995. pp. 262–298. [Google Scholar]
- Waters J, Larkum M, Sakmann B, Helmchen F. Supralinear Ca2+ influx into dendritic tufts of layer 2/3 neocortical pyramidal neurons in vitro and in vivo. J Neurosci. 2003;23:8558–8567. doi: 10.1523/JNEUROSCI.23-24-08558.2003. [DOI] [PMC free article] [PubMed] [Google Scholar]
- Welker WI. Analysis of sniffing of the albino rat. Behaviour. 1964;22:223–244. [Google Scholar]
- Wong-Riley M. Changes in the visual system of monocularly sutured or enucleated cats demonstratable with cytochrome oxidase. Brain Res. 1979;171:11–28. doi: 10.1016/0006-8993(79)90728-5. [DOI] [PubMed] [Google Scholar]
- Woolsey TA, Van der Loos H. The description of a cortical field composed of discrete cytoarchitectonic units. Brain Res. 1970;17:205–242. doi: 10.1016/0006-8993(70)90079-x. [DOI] [PubMed] [Google Scholar]
- Zhu JJ, Connors BW. Intrinsic firing patterns and whisker-evoked synaptic responses of neurons in the rat barrel cortex. J Neurophysiol. 1999;81:1171–1183. doi: 10.1152/jn.1999.81.3.1171. [DOI] [PubMed] [Google Scholar]