

Abstract
This study tested the hypothesis that acidic pH inhibits oxidative ATP supply during exercise in hand (first dorsal interosseus, FDI) and lower limb (leg anterior compartment, LEG) muscles. We measured oxidative flux and estimated mitochondrial capacity using the changes in creatine phosphate concentration ([PCr]) and pH as detected by 31P magnetic resonance (MR) spectroscopy during isometric exercise and recovery. The highest oxidative ATP flux in sustained exercise was about half the estimated mitochondrial capacity in the LEG (0.38 ± 0.06 vs. 0.90 ± 0.14 mm ATP s−1, respectively), but at the estimated capacity in the FDI (0.61 ± 0.05 vs. 0.61 ± 0.09 mm ATP s−1, respectively). During sustained exercise at a higher contraction rate, intracellular acidosis (pH < 6.88) prevented a rise in oxidative flux in the LEG and FDI despite significantly increased [ADP]. We tested whether oxidative flux could increase above that achieved in sustained exercise by raising [ADP] (> 0.24 mm) and avoiding acidosis using burst exercise. This exercise raised oxidative flux (0.69 ± 0.05 mm ATP s−1) to nearly twice that found with sustained exercise in the LEG and matched (0.65 ± 0.11 mm ATP s−1) the near maximal flux seen during sustained exercise in the FDI. Thus both muscles reached their highest oxidative fluxes in the absence of acidosis. These results show that acidosis inhibits oxidative phosphorylation in vivo and can limit ATP supply in exercising muscle to below the mitochondrial capacity.
The highest sustainable oxygen consumption (V̇O2) by animals during exercise is well below the aerobic maximum (Hammond & Diamond, 1997). For human exercise, the sustainable V̇O2 is typically < 80 % of the maximum oxygen consumption (V̇O2,max) (Hoppeler et al. 1985). Maximum oxygen consumption rates are achieved only transiently and are accompanied by considerable accumulation of H+ and lactate (Gladden, 1996; Richardson et al. 1998). One important factor limiting sustained oxygen consumption may be acidosis resulting from this accumulation of H+. Intracellular acidification has been found to slow oxidative phosphorylation, and possibly reduce the mitochondrial oxidative capacity, in isolated fibres (Walsh et al. 2002) and muscles (Harkema & Meyer, 1997), as well as in vivo muscle (Walter et al. 1997). Thus, one explanation for the apparent inability to sustain V̇O2,max in muscles is that accumulation of [H+] at high exercise levels inhibits oxidative ATP supply and prevents achievement of the mitochondrial capacity.
The mechanisms by which [H+] could restrict ATP supply include an indirect effect via a reduction in a signal for oxidative phosphorylation (e.g. [ADP] or phosphorylation potential, [ATP]/([ADP][Pi])) or a direct effect on mitochondrial function itself. Acidosis reduces [ADP] due to a pH-induced shift in the creatine kinase (CK) equilibrium, resulting in a lower signal for mitochondrial ATP supply (Tonkonogi & Sahlin, 1999; Conley et al. 2001). Evidence for this indirect effect on ATP supply comes from magnetic resonance studies of both isolated and intact exercising muscle showing that [ADP] usually fails to rise high enough to elicit the oxidative capacity in steady-state exercise (Hochachka & Matheson, 1992; Conley et al. 2001). A second possibility is a direct effect of acidosis on mitochondrial function. Such a direct effect has been reported for isolated skeletal muscle fibres (Walsh et al. 2002), isolated cat muscles (Harkema & Meyer, 1997) and perfused heart (Suleymanlar et al. 1992). Thus the drop in pH that accompanies exercise could inhibit oxidative ATP flux by at least two mechanisms: restricting the rise in [ADP] and reduction of mitochondrial capacity.
This study tested the hypothesis that acidic intracellular pH inhibits oxidative ATP supply. The first goal was to examine whether pH constrained oxidative flux during sustained exercise in hand (first dorsal interosseus, FDI) and lower limb (leg anterior compartment, LEG) muscles. The second goal was to determine if elevating [ADP] in the absence of acidosis raised oxidative flux above the level measured in sustained exercise. To achieve this second goal, we used a rapid, high intensity exercise to drop creatine phosphate concentration ([PCr]) and elevate [ADP] prior to significant acidification. We monitored the recovery rate of [PCr] following exercise to measure the oxidative phosphorylation rate and to estimate the muscle's mitochondrial oxidative capacity.
Methods
Subjects
We studied five healthy subjects (1 female, 4 male) ranging in age from 25 to 63 years (mean = 38 ± 16.3 s.d.). One subject was sedentary, three were regularly active and one was in training as a competitive distance runner. All subjects gave written informed consent to participate in this protocol in accordance with the Declaration of Helsinki and the university's Human Subjects Division.
Muscles and experimental setup
We collected data from the FDI muscle of the hand and the anterior compartment muscles of the leg (LEG: tibialis anterior, extensor digitorum longus and extensor hallicis longus). For the LEG experiments, the subject's right leg was placed in a moulded plastic brace with the foot held in 125 deg of plantarflexion. The brace apparatus had an adjustable articulation (Bledsoe Brace Systems, Grand Prairie, TX, USA) at the ankle, and the axis of rotation of the articulation closely approximated the ankle's axis of rotation. Dorsiflexion by the subject resulted in a nearly isometric force being applied to a load coil incorporated into the apparatus near the ankle. An opening in the anterolateral aspect of the brace allowed placement of a radiofrequency (RF) coil over the muscles of interest. The entire brace was fixed into a plastic half-cylinder that assured both proper positioning of the subject's leg within the bore of the magnet and stabilization of the leg and foot during exercise.
For experiments on the FDI, the subject's right hand was secured palm down to a platform with the fingers extended and the thumb hanging loosely through a large hole cut in the platform. The proximal interphalangeal joint of the subject's second digit was positioned between a load coil and a vertical plate that prevented finger adduction. Abduction of the second digit resulted in a nearly isometric force being applied to the load coil. An RF coil was secured over the FDI muscle. The platform apparatus assured both proper positioning of the subject's hand in the magnet and stabilization of the hand and wrist during exercise.
Exercise protocols
The experimental sessions were spread over 5–9 test days per subject. Subjects performed two exercise protocols using ballistic contractions as defined by the time to peak force (< 200 ms (LEG) or < 150 ms (FDI)). We used ballistic contractions to achieve recruitment of all muscle fibres (Desmedt & Godaux, 1977, 1978; Crowther & Gronka, 2002). Subjects were trained to perform ballistic contractions before the start of the exercise tests. We chose peak force targets based on pilot data showing these forces would result in an adequate PCr breakdown with the range of contraction rates that could be achieved by subjects. Subjects watched an LED display for real-time feedback of their force production. Contraction frequency was paced with a metronome.
Sustained exercise
This protocol was used to determine oxidative flux, phosphorus metabolite levels and pH during sustained exercise. The subjects performed exercise at a constant peak force for 7 min at a single contraction rate for each bout. Between four and nine steady-state exercise bouts for each limb were needed to determine the range of exercise rates (0.25–1.5 Hz) at which subjects could maintain a constant peak force output. There was a minimum of 8 min between the end of one exercise bout and the start of the next.
Burst exercise
This protocol was designed to drive subjects’ [PCr] down with minimal acidification to achieve a high [ADP] and maximize oxidative phosphorylation, as previously described (Walter et al. 1997). In this bout, subjects were instructed to perform strong contractions at the highest rate possible for 24 s. These self-guided contractions were within ≈45–90 % of maximum voluntary contraction (MVC) force and were performed at a frequency of ≈2–3 Hz. The burst exercise was followed by 10.4 min of aerobic recovery.
Magnetic resonance spectroscopy
The spectrometry system consisted of a 4.7 Tesla Bruker magnet interfaced with a GE Omega console. A surface RF coil tuned to 31P was placed over the anterior compartment of the leg (coil dimensions: 8.5 cm × 5 cm) or over the FDI (2 cm diameter). We shimmed on the water proton signal to optimize B0 field homogeneity, and then collected a fully-relaxed, high resolution 31P spectrum of the resting muscle (16 free-induction decays (FID) with a 16 s interpulse delay, spectral width of ±1750 Hz and 1024 data points). A standard one pulse experiment under partially saturated conditions (1.5 s interpulse delay) was used to determine the levels of PCr, ATP, Pi and pH throughout the experiment. Four FIDs were averaged per spectrum, yielding a time resolution of 6 s.
The FIDs were line-broadened with the half-height width of the resting PCr peak and Fourier-transformed into spectra. Changes in PCr and Pi peak areas during the exercise experiments were analysed as previously described (Blei et al. 1993; Crowther et al. 2002a). PCr, Pi and ATP peak areas in the fully relaxed spectra were determined by integration using the GE Omega software. We expressed areas of the PCr and Pi peaks relative to the ATP peak, for which we used the published value of 8.2 mm (Sjøgaard & Saltin, 1982). pH was determined from the chemical shift of the Pi peak relative to the PCr peak (Taylor et al. 1983). Free [ADP] was calculated from the CK equilibrium with correction of the equilibrium constant for pH (Lawson & Veech, 1979; Golding et al. 1995).
We defined energetic steady state as no change in [PCr] for a minimum of 2 min. Stable [PCr] indicates that the supply of ATP matches the demand for ATP. To determine whether a particular exercise test achieved energetic steady state, we used regression analysis to examine [PCr] during the final 2 min of exercise. A significant decline in [PCr] indicated the muscle was not in steady state.
Calculations
Glycolysis
Glycolytic ATP production was calculated from changes in muscle pH, [PCr] and [Pi] during recovery, as previously described (Crowther et al. 2002b). In brief, H+ generation by glycolysis is measured as the [H+] buffered in the cell (ΔpH × βtot) and that consumed in the breakdown of PCr ((-γ) × Δ[PCr]):
| (1) |
where ΔpH is the change in muscle pH, βtot is the total muscle buffer capacity (sum of intracellular and inorganic phosphate buffers (see Conley et al. 1997)), γ is the proton stoichiometric coefficient of PCr hydrolysis (Kushmerick, 1997) and Δ[PCr] is the change in [PCr]. The glycolytic PCr synthesis (Δ[PCr]glycol) was calculated from Δ[H+]glycol using the stoichiometry of [ATP] production per [H+] generation (1.5) for glycogenolysis, which provides the majority of substrate for glycolysis in exercise (Raguso et al. 1995).
Oxidative properties
PCr resynthesis after exercise is used to determine the oxidative flux rate in muscle during exercise and also to estimate the oxidative capacity of the muscle (Conley et al. 2000a). Since glycolysis persists many seconds after exercise (Crowther et al. 2002b), PCr resynthesis due to glycolytic and oxidative production must be separated. We determined the oxidative flux elicited by the exercise bouts by quantifying [PCr] and pH changes from 0 to 9 s of aerobic recovery from exercise. Glycolytic PCr resynthesis (Δ[PCr]glycol) was subtracted from the total PCr resynthesis (Δ[PCr]total) to yield PCr resynthesis by oxidative phosphorylation (Δ[PCr]ox phos):
| (2) |
The oxidative flux is thus equal to Δ[PCr]ox phos divided by the 9 s measurement period, which represents the average rate during this initial recovery period. We also calculated [ADP] from the [PCr] and pH at each time point:
| (3) |
where [Cr] is the free creatine concentration, [H+] is the proton concentration and Keq is the creatine kinase equilibrium constant.
Mitochondrial oxidative capacity was estimated for each subject using the average PCr recovery rate constant (kPCr) from the subject's steady-state exercise bouts with pH > 6.9. This rate constant was calculated as the average initial phosphorylation rate during the first 9 s of recovery (Δ[PCr]ox phos/Δt) divided by the change in PCr between rest and exercise (Δ[PCr]rest − ex):
| (4) |
The mean kPCr × [PCr] in resting muscle provides our measure of the maximum oxidative phosphorylation rate (oxidative capacity, M.ox cap), as previously described (Conley et al. 2000a):
| (5) |
Force
We measured the force output of the LEG and FDI muscles with 445 N and 45 N load coils (Interface, Inc., Scottsdale, AZ, USA), respectively. Output from the load coils was recorded digitally using LabView software (National Instruments, Inc., Austin, TX, USA) with an A-D scan rate of 300 Hz following 10 kHz filtering of the analog signal. The signal from the load coils was calibrated against known masses and analysed using LabView software to determine each contraction's peak force and time to peak force.
Statistics
Values reported are means ± s.e.m. unless otherwise indicated. We used one-tailed paired t tests to evaluate expected differences between means. Two-tailed paired t tests were used in cases in which the direction of change could not be specified. A significance level of P < 0.05 was used in all comparisons.
Results
Sustained exercise
Metabolite levels and pH at rest and exercise
Figure 1 shows spectra from the LEG and FDI of the same subject at rest (left) and at sustained exercise with the highest oxidative flux (right; see Oxidative flux below). Typical signal-to-noise for PCr in line-broadened spectra from LEG at rest was 100, and from FDI was 40. Table 1 shows that the muscles had similar metabolite and pH levels at rest.
Figure 1. 31P MR spectra from the leg anterior compartment (LEG) and first dorsal interosseous (FDI) muscles of one subject.
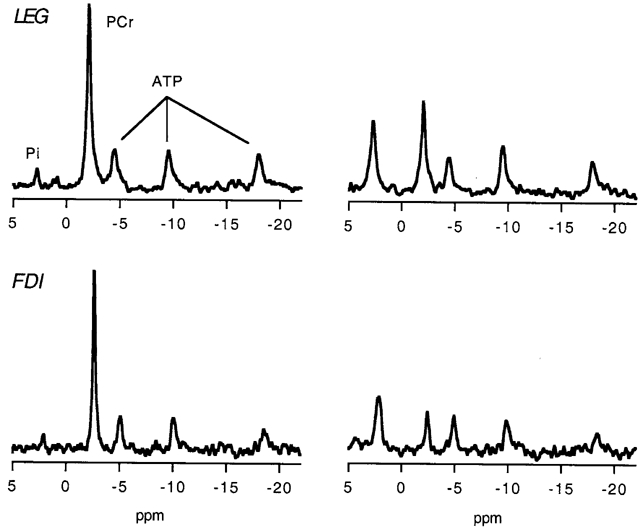
Spectra shown are from muscle at rest (left) and during sustained exercise with the highest oxidative flux (right).
Table 1.
Phosphorus compounds and pH at rest and at the end of sustained exercise with the highest oxidative flux (sustained) and maximal burst exercise (burst)
| Rest | End-exercise | |||
|---|---|---|---|---|
| LEG | FDI | LEG | FDI | |
| Sustained | ||||
| [PCr] (mM) | 34.2 ± 0.8 | 34.0 ± 1.6 | 18.6 ± 2.2 | 8.8 ± 1.3 |
| [ADP] (mM) | 0.014 ± 0.002 | 0.017 ± 0.004 | 0.081 ± 0.01 | 0.201 ± 0.03 |
| pH | 7.00 ± 0.01 | 7.05 ± 0.02 | 7.00 ± 0.01 | 6.92 ± 0.04 |
| Burst | ||||
| [PCr] (mM) | 37.9 ± 0.8 | 33.5 ± 1.7 | 5.6 ± 1.1 | 6.3 ± 0.6 |
| [ADP] (mM) | 0.006 ± 0.001 | 0.020 ± 0.005 | 0.247 ± 0.030 | 0.289 ± 0.047 |
| pH | 7.00 ± 0.02 | 7.10 ± 0.01 | 6.88 ± 0.05 | 6.90 ± 0.04 |
Values are means ± s.e.m. for 5 subjects.
Force production
Subjects were able to maintain peak force (181.5 ± 12.3 and 20.1 ± 1.5 N, for LEG and FDI respectively) and ballistic contractions (time to peak force 180 ± 9 and 149 ± 10 ms, respectively) throughout all exercise bouts unless otherwise noted.
Oxidative flux
The time course of changes in [PCr] during rest, exercise and recovery are shown for the LEG and FDI of the same subject in Fig. 2. In this example, the LEG could not maintain stable [PCr] below about 25 mm, while stable [PCr] was maintained by the FDI in exercise to near complete depletion of [PCr]. The oxidative flux at each exercise level was determined from the initial changes in [PCr] and pH during recovery from exercise, as shown in Fig. 3. The [PCr] change measures the phosphorylation rate during exercise while the changes in pH and PCr are used to calculate (eqn (1)) and subtract the glycolytic contribution to this ATP production (eqn (2)). The exercise bout with the highest oxidative flux and steady-state [PCr] was identified for each individual and muscle, and used as the reference for all other exercise bouts. Figure 4 shows the oxidative flux at two exercise levels leading up to (steps 1 and 2) and at the sustained exercise with the highest oxidative flux (step 3), and at the next exercise level (step 4). The oxidative flux in step 3 was lower in the LEG (0.38 ± 0.06 mm ATP s−1) vs. FDI (0.61 ± 0.05 mm ATP s−1; two-tailed t test, P =; 0.02), but there was no significant difference in the contraction rates (0.80 ± 0.14 Hz (LEG) and 1.03 ± 0.10 Hz (FDI)) or fraction of MVC (0.52 ± 0.01 MVC (LEG) and 0.57 ± 0.02 (FDI)).
Figure 2. [PCr] in the LEG and FDI of one subject during sustained exercise bouts.
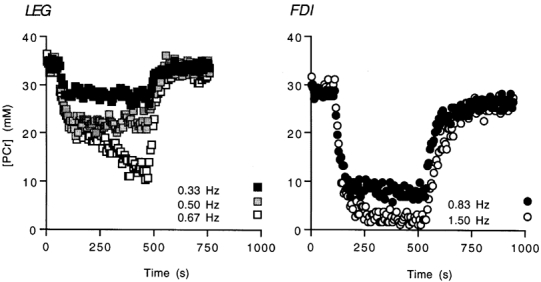
Exercise intensity was incremented by increasing the rate of muscle contractions.
Figure 3. Initial [PCr] and pH in the LEG of one subject after sustained exercise.
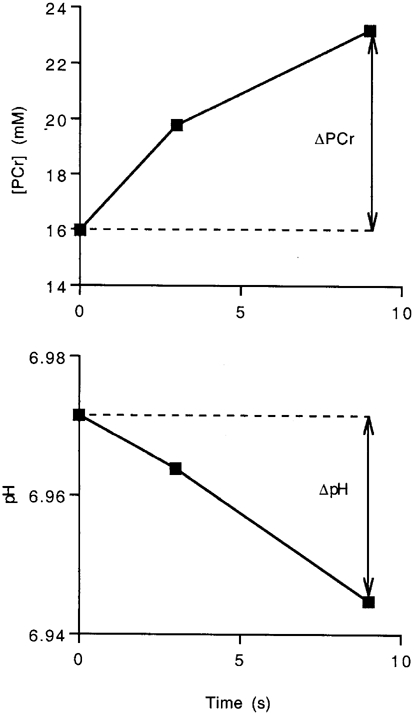
These data were used to calculate the glycolytic (eqn (1)) and oxidative fluxes (eqn (2)). Time 0 is the end of exercise and data are collected at 6 s intervals. The first recovery point represents an average over 6 s and is reported at 3 s. Each subsequent data point thereafter is reported in 6 s intervals.
Figure 4. Oxidative flux in the LEG and FDI at the end of sustained exercise bouts.
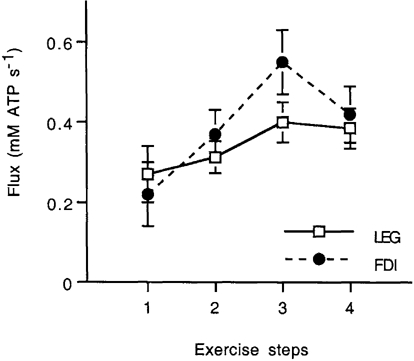
Exercise intensity was incremented by increasing the rate of muscle contractions. This figure shows the resulting oxidative flux at two exercise levels below (steps 1 and 2) and at the sustained exercise with the highest oxidative flux (step 3), as well as at the next higher exercise level (step 4). Data are group means ±s.e.m.
Figure 5 shows the average timecourse of [PCr], [ADP] and pH for LEG and FDI during sustained exercise with the highest oxidative flux (step 3, Fig. 4) and at the next greater exercise rate (step 4, Fig. 4). Table 1 shows a drop in [PCr] in exercise at step 3 to about half the resting level in the LEG but near complete depletion in the FDI. A higher exercise level (step 4) resulted in decreased pH and increased [ADP] but no increase in oxidative flux in either muscle (see below). One subject could not maintain peak force for the full 7 min of exercise at the highest exercise rate and is not included in this figure.
Figure 5. [PCr], [ADP] and pH during sustained exercise of the LEG and FDI.
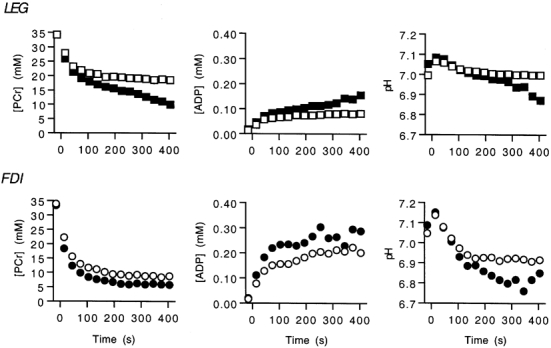
Data points represent 30 s averages. The open symbols are the sustained exercise with the highest oxidative flux and the filled symbols are for a higher exercise level. Values are group means; error bars are omitted for clarity.
Oxidative capacity
The PCr recoveries from sustained exercise bouts in which the end-exercise pH was above 6.9 were used to determine the rate constant of PCr recovery (kPCr) according to eqn (4). All exercise bouts through step 3 (Fig. 4) met this criterion for the LEG and all but two bouts in step 3 had pH > 6.9 in the FDI. The majority of bouts had pH < 6.9 in both muscles in step 4. We used the average kPCr determined after sustained exercise without acidosis (acidosis is hereafter defined as pH < 6.88) because this rate constant declines with intracellular acidosis (Paganini et al. 1997; Walter et al. 1997). Traditionally, kPCr is calculated from the time constant (τ) of the PCr recovery from exercise (kPCr =; 1/τ) (Paganini et al. 1997; Walter et al. 1997). We determined kPCr based on the initial [PCr] and pH changes during recovery, as shown in Fig. 3, for two reasons. First, residual glycolytic ATP production contaminates the PCr recovery time course used to fit τ (Crowther et al. 2002b), but this contribution can be subtracted from the initial PCr recovery used to calculate kPCr (using eqn (4)). Second, the oxidative flux measurement is made at a pH close to that in exercise. This determination avoids the acidosis that often accompanies the extensive PCr resynthesis via the CK reaction and affects the estimation of τ (Paganini et al. 1997; Walter et al. 1997). The result of our kPCr determination is that there was no difference in the LEG (0.026 ± 0.004 s−1) vs. FDI (0.018 ± 0.003 s−1). The product of kPCr and resting [PCr] yielded the estimated oxidative capacity (eqn (5) 0.90 ± 0.14 mm ATP s−1 (LEG) vs. 0.61 ± 0.09 mm ATP s−1 (FDI)). The highest oxidative flux during sustained exercise in the LEG was only about half of its oxidative capacity (0.38 vs. 0.90 mm ATP s−1, respectively). This is in sharp contrast to the FDI, which reached the estimated oxidative capacity during sustained exercise (0.61 vs. 0.61 mm ATP s−1, respectively).
Oxidative flux vs. pH
We tested the hypothesis that acidic pH inhibited oxidative flux at the higher exercise intensities. Figure 6 compares the oxidative flux, [ADP] and pH in the sustained exercise with the highest oxidative flux (step 3, Fig. 4) and at one higher exercise level (step 4, Fig. 4). No significant change in oxidative flux occurred at the higher exercise intensity in either muscle, although the trend in both muscles was for a decline in flux (Fig. 6). We found that both muscles had significantly lower pH in the more intense exercise bout (P < 0.05 (LEG) and P < 0.01 (FDI)). We also found that a rise in [ADP] occurred in the more intense exercise bout in both muscles (P < 0.04 (LEG) and P < 0.01 (FDI)). Thus no change in oxidative flux was found in either muscle at the higher exercise intensity in the presence of reduced pH despite an elevation in [ADP].
Figure 6. Oxidative flux, [ADP] and pH at the end of exercise for the LEG and FDI.
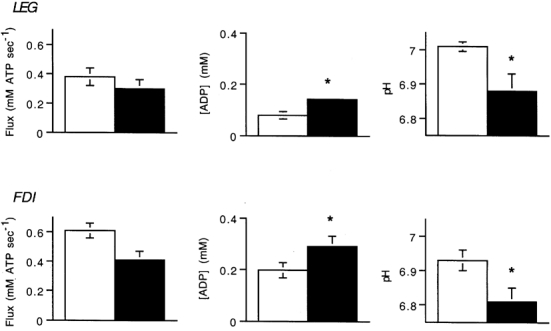
Open bars are the sustained exercise with the highest oxidative flux and filled bars are a higher exercise level. Values are means; * significant difference between the two exercise conditions.
Burst exercise
We used burst exercise to elevate [ADP] without muscle acidification. Figure 7 shows a typical burst exercise bout in which [PCr] fell rapidly due to the high rate of ATP use. Muscle pH remained relatively alkaline during the bout, dipping below 7 only in the last few seconds of exercise. Thus, the burst exercise achieved near-complete [PCr] depletion with only a small drop in pH relative to rest (Table 1). The end result of this combination of low [PCr] and high pH resulted in [ADP] rising to > 247 µm in both muscles by the end of the exercise bout.
Figure 7. [PCr], pH and [ADP] during a typical 24 s bout of burst exercise by the LEG.
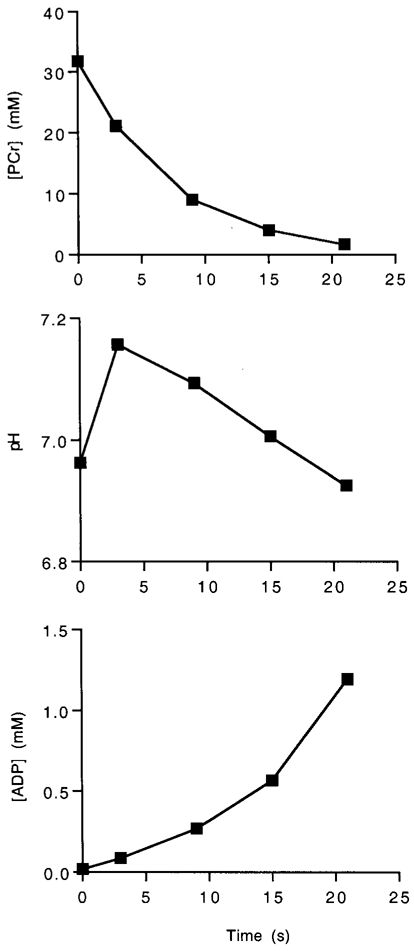
Time 0 is the onset of exercise. The first time point represents an average over 6 s and is reported at 3 s. Each subsequent data point is reported at 6 s intervals.
Burst vs. sustained exercise
Figure 8 shows the oxidative flux, ADP and pH achieved after sustained exercise with the highest flux and after burst exercise. Significantly higher oxidative flux (P < 0.02) and [ADP] (P < 0.01) were elicited in the LEG by burst exercise as compared to sustained exercise. The [ADP] in the LEG was 3-fold higher after burst exercise than after sustained exercise. Thus the combination of very low [PCr] with no significant intracellular acidification resulted in an [ADP] above the level achieved during sustained exercise. In contrast, [ADP] in the FDI was similar in the two exercise bouts. Both burst and sustained exercise raised [ADP] to high levels and therefore no difference was found in the oxidative flux under the two conditions. The broken horizontal line in Fig. 8 shows the estimated oxidative capacity for the LEG. This capacity is far greater than the highest oxidative flux in the sustained exercise but much closer to the oxidative flux after burst exercise. This line is not seen for the FDI since it coincides with the tops of the sustained and burst exercise columns. The estimated oxidative capacities were not different from the measured oxidative fluxes during burst exercise, indicating that the muscles approached (LEG) or reached (FDI) the oxidative capacity of the mitochondria in the absence of intracellular acidosis.
Figure 8. Oxidative flux, [ADP] and pH for the sustained exercise with the highest oxidative flux (open bars) and for the burst exercise (filled bars).
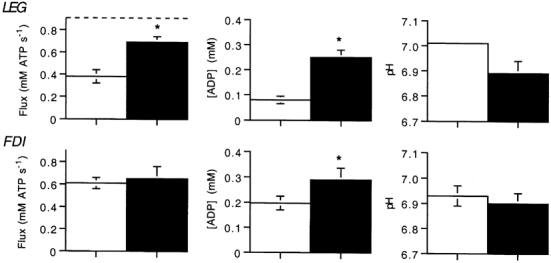
The dashed horizontal line indicates the estimated mitochondrial oxidative capacity (see eqn (4)). This line is not seen for the FDI since it corresponds to the top of the columns for both exercise protocols. Values are means; * significant difference between the two exercise conditions.
Discussion
This study tested the hypothesis that intracellular acidosis inhibits oxidative ATP supply in exercising muscle. Our first finding was that the highest oxidative flux during sustained exercise occurred in bouts without acidosis and that the drop in pH accompanying higher exercise levels prevented increases in oxidative flux. Our second finding was that avoiding acidosis and elevating [ADP] permitted both LEG and FDI to approach their estimated oxidative capacities. These results suggest that intracellular acidosis inhibits mitochondrial function and may limit sustained oxidative flux to below the mitochondrial capacity.
Phosphorus metabolites and sustained exercise
The LEG and FDI were well suited for testing the effect of pH on oxidative flux because of the striking difference in their PCr and ADP levels during sustained exercise. Less than half of [PCr] was depleted in the LEG prior to failure of energetic steady state during sustained exercise (Fig. 2 and Fig. 5), similar to the PCr levels typically found at the highest sustained exercise in mammalian muscle (see Conley et al. 2001). However, the FDI nearly depleted PCr during sustained exercise without significant acidosis or muscle fatigue (defined as a drop in force output). Such a large and sustained PCr depletion is unique among the results of previous muscle studies, including a study of the FDI (Newham & Cady, 1990) that used a higher duty cycle (i.e. a greater contraction vs. relaxation period than in this study) which generated a lower pH and less PCr depletion in sustained exercise.
The importance of raising [ADP] lies in its role in activating oxidative phosphorylation. The exact signal regulating oxidative phosphorylation is controversial (Meyer & Foley, 1996), but all of the proposed mechanisms have a common link in [ADP] (Jeneson et al. 1996). The modest PCr depletion in the LEG during sustained exercise with the highest oxidative flux resulted in an [ADP] well below levels that maximally stimulate mitochondrial respiration in vitro. However, this concentration (0.08 mm) is similar to that found in most mammalian muscles at the highest sustained exercise rate (i.e. < 100 µm: Conley et al. 2001). Higher levels of exercise resulted in failure of metabolite steady state in the LEG (Fig. 5) and no elevation in oxidative flux despite higher [ADP] (Fig. 6). Thus the highest oxidative flux in sustained exercise came at a relatively low [ADP] in this muscle and was well below the estimated mitochondrial capacity (42 % of capacity; Fig. 8).
A much higher [ADP] (0.2 mm, Table 1) was generated by the FDI during sustained exercise as the result of a near depletion of PCr without significant acidosis. An [ADP] of 0.2 mm is reported to activate > 80 % of the oxidative phosphorylation capacity in isolated mitochondria (Mootha et al. 1997) and is exceptionally high compared to levels reported for mammalian muscles during sustained exercise (Conley et al. 2001). The measured oxidative flux in the FDI was similar to the estimated mitochondrial capacity, which indicates that the [ADP] generated during sustained exercise approached saturating levels for mitochondrial respiration. Thus the FDI appears to be unusual in its ability to raise oxidative phosphorylation during sustained exercise to levels that are close to those expected to activate the mitochondrial capacity.
Effects of acidosis
The highest oxidative flux during sustained exercise in both muscles occurred in the bout just prior to the onset of acidosis (Fig. 4 and Fig. 5). For the LEG, acidosis occurred at a relatively low [ADP] and resulted in eliciting only a small fraction of the oxidative capacity. In contrast, the FDI was able to generate a far higher [ADP] and fraction of the oxidative capacity prior to significant acidification. To determine whether low pH inhibited oxidative phosphorylation and was responsible for limiting the rise in oxidative flux, we compared oxidative flux and [ADP] during sustained exercise above and below pH 6.9. Figure 6 shows that oxidative flux did not rise in either muscle despite a significant elevation of [ADP] in exercise eliciting a significant pH drop to below pH 6.9. In fact, the trend in both muscles was for oxidative flux to decline at the lower pH. Thus the steady rise in oxidative phosphorylation with exercise (steps 1–3, Fig. 4) ceased in the presence of acidosis. This finding suggests that low pH counteracted the effect of a rise in [ADP] on mitochondrial oxidative phosphorylation and prevented the rise of oxidative flux with exercise.
To independently test that acidosis inhibits oxidative flux, we used an exercise protocol that elevated [ADP] without acidosis. The burst exercise protocol rapidly depleted [PCr] and resulted in only a small decline in intracellular pH from the resting level (Fig. 7 and Table 1). The oxidative flux during burst exercise is compared to the highest flux during sustained exercise in Fig. 8. The similar oxidative flux under the two exercise conditions in the FDI agrees with the high [ADP] found in both sustained and burst exercise. In contrast, the LEG achieved a much higher [ADP] with burst vs. sustained exercise and had a corresponding increase in oxidative flux. This result shows that in the absence of acidosis in the LEG, increased [ADP] was accompanied by greater oxidative flux. Thus the role of pH in inhibiting oxidative flux suggested by the results from sustained exercise was confirmed by the higher oxidative flux achieved when acidosis was avoided using burst exercise.
Prevention of acidification resulted in an oxidative flux that approached the oxidative capacity of each muscle (Fig. 8). We have shown previously that the estimate of oxidative capacity based on PCr content and recovery dynamics (eqn (5)) agrees with that determined from the muscle's mitochondrial content (Conley et al. 2000a). Our present results indicate that increasing [ADP] to high levels without acidification elicits an oxidative flux close to the muscle's mitochondrial capacity. For the FDI, high [ADP] and oxidative flux were achieved in both sustained and burst exercise. For the LEG, burst exercise that avoided acidosis was able to raise [ADP] to levels that elicited an oxidative flux that approached the oxidative capacity. Thus, the large fraction of the oxidative capacity elicited at neutral pH – but not at lower pH – suggests that acidosis is an important factor determining whether oxidative capacity is achieved during sustained exercise.
pH inhibition of oxidative flux
Our results reject the hypothesis that acidosis indirectly inhibits the rise in oxidative flux by limiting the rise in [ADP] via the creatine kinase equilibrium (Conley et al. 2001). Instead, a direct effect of pH on mitochondrial function is indicated by the failure of oxidative flux to increase in exercise that generated acidosis despite a significant rise in [ADP] (Fig. 6). A direct pH effect was also apparent in the lower oxygen consumption at a given [ADP] in isolated, perfused cat muscle under acidosis reported by Harkema & Meyer (1997). but this direct effect has not been consistently found in studies of isolated mitochondria and muscle fibres (see Tonkonogi & Sahlin, 1999). This discrepancy may reflect a trade-off in the effects of [ADP] and pH on mitochondrial function. Walsh et al. (2002) found reduced oxidative phosphorylation at physiological [ADP] (100 µm) but not supra-physiological [ADP] (4 mm) in isolated skeletal muscle fibres exposed to acidosis. Thus a high signal for oxidative phosphorylation appears to counteract the effects of acidosis and may account for the reported range of effects of acidosis on mitochondrial function.
Sustained vs. maximal V̇O2
The ability to generate high [ADP] and overcome the effects of acidosis on oxidative flux may be why an exercise test that progressively increases work is successful in eliciting the muscle's oxidative capacity (Astrand & Rodahl, 1986). Richardson et al. (1995) achieved high [ADP] by dropping PCr to very low levels (≈3 mm) in a progressive exercise test of the human quadriceps (see ADP calculations in Conley et al. 2001). Simultaneous measurements of muscle V̇O2 in their study demonstrated an increase in quadriceps V̇O2 with each work rate up to a maximum at the [ADP] expected to elicit the mitochondrial capacity (i.e., [ADP] > 0.25 mm). In contrast, sustained-load exercise by the LEG in this study resulted in acidification without the sharp decline in PCr needed to substantially raise [ADP] (Fig. 5). This intracellular acidification inhibited oxidative flux more than the rise in [ADP] elevates flux, with the result that the highest flux elicited by sustained-load exercise fell short of the mitochondrial capacity in the LEG. Thus the high [ADP] required to elicit V̇O2,max is possible in a progressive-load exercise test because increasing work levels continue to drop PCr in the face of intracellular acidification. The failure, then, to achieve the maximal oxidative flux during sustained exercise reflects the inability to raise [ADP] sufficiently to counteract the effects of acidification.
Do the same mechanisms operate during whole-body exercise such as bicycling? The lack of non-invasive measurements in this exercise and the limitations of muscle biopsies prevent a direct answer to this question. However, two lines of evidence suggest that intracellular mechanisms determine oxidative flux during exercise on a cycle ergometer, as they do in exercise of small muscle groups. The first evidence is the finding that the cardiovascular system is not limiting to oxygen delivery in non-athletic subjects. A similar V̇O2,max is found when breathing room air (21 % O2) or hyperoxic air (100 % O2) in exercise involving either small muscle groups or cycling in untrained subjects (Cardus et al. 1998; Pedersen et al. 1999). The second line of evidence of an intracellular regulation of flux is the finding that quadriceps muscles appear to work at their mitochondrial oxidative capacity during cycle exercise that elicits the whole-body V̇O2,max (Hoppeler et al. 1985; Conley et al. 2000a). For example, exercise training was found by Hoppeler et al. (1985) to elicit similar increases in maximal leg V̇O2 estimated from leg power output vs. that from quadriceps mitochondrial volume. This agreement may seem surprising given the fact that the total content of mitochondria in the musculature has a capacity to consume far more O2 than attained at whole-body V̇O2,max (Rowell, 1993). However, only a fraction of the muscles of the body are recruited in cycling exercise (Hoppeler, 1990) and therefore only a fraction of the total mitochondrial pool is expected to consume O2 at the aerobic capacity (see Conley et al. 2000b for analysis).
This quantitative agreement of the oxidative cost of leg work at V̇O2,max with the mitochondrial oxidative capacity is in contrast to findings that the enzymatic capacity can far exceed the maximum oxidative flux (Gollnick et al. 1985). However, Blomstrand et al. (1997) found agreement in the maximum flux of one mitochondrial enzyme but excess capacity by two other enzymes relative to the maximum oxygen consumption of the quadriceps. This disparity in enzyme activity relative to maximum in vivo flux can be reconciled by the fact that certain enzymes can be pace setters and others have a capacity that exceeds the maximal flux through a pathway (see Suarez et al. 1997). Taken together, these studies indicate that muscles can reach the oxidative capacity of their mitochondria during cycle exercise, and thus any limitation during sustained cycle exercise is likely to be intracellular rather than cardiovascular in origin. Thus, the results demonstrating an intracellular basis to the limitation to sustained oxidative flux in single muscle exercise probably reflects the limitation during exercise with larger muscle groups as well.
In summary, this study demonstrated that acidosis inhibits oxidative phosphorylation in exercising muscle in vivo. Relatively mild acidosis (pH 6.8≈6.9) prevented a rise in oxidative flux despite a substantial rise in [ADP]. Exercise that avoided acidosis but elevated [ADP] to high levels elicited an oxidative flux close to the mitochondrial capacity in both muscles. Thus muscle acidosis may be an important factor limiting oxidative phosphorylation to below the mitochondrial capacity during exercise.
Acknowledgments
Helpful comments on this manuscript were provided by Drs Catherine Amara, Martin Kushmerick and David Marcinek. This work was supported by NIH grants AR-41928 and AR-45184.
References
- Astrand P-O, Rodahl K. New York: McGraw-Hill; 1986. Textbook of Work Physiology; pp. 300–303. [Google Scholar]
- Blei ML, Conley KE, Kushmerick MJ. Separate measures of ATP utilization and recovery in human skeletal muscle. J Physiol. 1993;465:203–222. doi: 10.1113/jphysiol.1993.sp019673. (erratum: J Physiol 475, 548) [DOI] [PMC free article] [PubMed] [Google Scholar]
- Blomstrand E, Radegran G, Saltin B. Maximum rate of oxygen uptake by human skeletal muscle in relation to maximal activities of enzymes in the Krebs cycle. J Physiol. 1997;501:455–460. doi: 10.1111/j.1469-7793.1997.455bn.x. [DOI] [PMC free article] [PubMed] [Google Scholar]
- Cardus J, Marrades RM, Roca J, Barbera JA, Diaz O, Masclans JR, Rodriguez-Roisin R, Wagner PD. Effects of FIO2 on leg V̇O2 during cycle ergometry in sedentary subjects. Med Sci Sports Exerc. 1998;30:697–703. doi: 10.1097/00005768-199805000-00009. [DOI] [PubMed] [Google Scholar]
- Conley KE, Blei ML, Richards TL, Kushmerick MJ, Jubrias SA. Activation of glycolysis in human muscle in vivo. Am J Physiol. 1997;273:C306–315. doi: 10.1152/ajpcell.1997.273.1.C306. (erratum: Am J Physiol 276 (3 Pt 1): section C) [DOI] [PubMed] [Google Scholar]
- Conley KE, Esselman PE, Jubrias SA, Cress ME, Inglin B, Mogadam C, Schoene RS. Aging, muscle properties and maximum O2 uptake in humans. J Physiol. 2000b;526:211–217. doi: 10.1111/j.1469-7793.2000.00211.x. [DOI] [PMC free article] [PubMed] [Google Scholar]
- Conley KE, Jubrias SA, Esselman PE. Oxidative capacity and aging in human muscle. J Physiol. 2000a;526:203–210. doi: 10.1111/j.1469-7793.2000.t01-1-00203.x. (erratum: J Physiol 533, 921) [DOI] [PMC free article] [PubMed] [Google Scholar]
- Conley KE, Kemper WF, Crowther GJ. Limits to sustainable muscle performance: interaction of glycolysis and respiration. J Exp Biol. 2001;204:3189–3194. doi: 10.1242/jeb.204.18.3189. [DOI] [PubMed] [Google Scholar]
- Crowther GJ, Carey MF, Kemper WF, Conley KE. Control of glycolysis in contracting skeletal muscle. I. Turning it on. Am J Physiol Endocrinol Metab. 2002a;282:E67–73. doi: 10.1152/ajpendo.2002.282.1.E67. [DOI] [PubMed] [Google Scholar]
- Crowther GJ, Gronka RK. Fiber recruitment affects oxidative recovery measurements of human muscle in vivo. Med Sci Sports Exerc. 2002;34:1733–1737. doi: 10.1097/00005768-200211000-00007. [DOI] [PubMed] [Google Scholar]
- Crowther GJ, Kemper WF, Carey MF, Conley KE. Control of glycolysis in contracting skeletal muscle. II. Turning it off. Am J Physiol Endocrinol Metab. 2002b;282:E74–79. doi: 10.1152/ajpendo.2002.282.1.E74. [DOI] [PubMed] [Google Scholar]
- Desmedt JE, Godaux E. Ballistic contractions in man: characteristic recruitment pattern of single motor units of the tibialis anterior muscle. J Physiol. 1977;264:673–693. doi: 10.1113/jphysiol.1977.sp011689. [DOI] [PMC free article] [PubMed] [Google Scholar]
- Desmedt JE, Godaux E. Ballistic contractions in fast or slow human muscles: discharge patterns of single motor units. J Physiol. 1978;285:185–196. doi: 10.1113/jphysiol.1978.sp012566. [DOI] [PMC free article] [PubMed] [Google Scholar]
- Gladden LB. Lactate transport and exchange during exercise. In: Rowell RB, Shepherd JT, editors. Exercise: Regulation and Integration of Multiple Systems. New York: Oxford University Press; 1996. pp. 614–648. [Google Scholar]
- Golding EM, Teague WE, Dobson GP. Adjustment of K' to varying pH and pMg for the creatine kinase, adenylate kinase and ATP hydrolysis equilibria permitting quantitative bioenergetic assessment. J Exp Biol. 1995;198:1775–1782. doi: 10.1242/jeb.198.8.1775. [DOI] [PubMed] [Google Scholar]
- Gollnick PD, Riedy M, Quintinskie JJ, Bertocci LA. Differences in metabolic potential of skeletal muscle fibers and their significance for metabolic control. J Exp Biol. 1985;115:191–199. doi: 10.1242/jeb.115.1.191. [DOI] [PubMed] [Google Scholar]
- Hammond KA, Diamond J. Maximal sustained energy budgets in humans and animals. Nature. 1997;386:457–462. doi: 10.1038/386457a0. [DOI] [PubMed] [Google Scholar]
- Harkema SJ, Meyer RA. Effect of acidosis on control of respiration in skeletal muscle. Am J Physiol. 1997;272:C491–500. doi: 10.1152/ajpcell.1997.272.2.C491. [DOI] [PubMed] [Google Scholar]
- Hochachka PW, Matheson GO. Regulation ATP turnover rates over broad dynamic work ranges in skeletal muscles. J Appl Physiol. 1992;73:1697–1703. doi: 10.1152/jappl.1992.73.5.1697. [DOI] [PubMed] [Google Scholar]
-
Hoppeler H. The different relationship of
 to muscle mitochondria in humans and quadrupedal animals. Respir Physiol. 1990;80:137–145. doi: 10.1016/0034-5687(90)90077-c. [DOI] [PubMed] [Google Scholar]
 - Hoppeler H, Howald H, Conley KE, Lindstedt SL, Claassen H, Vock P, Weibel ER. Endurance training in humans: aerobic capacity and structure of skeletal muscle. J Appl Physiol. 1985;59:320–327. doi: 10.1152/jappl.1985.59.2.320. [DOI] [PubMed] [Google Scholar]
- Jeneson JAL, Wiseman RW, Westerhoff HV, Kushmerick MJ. The signal transduction function for oxidative phosphorylation is at least second order in ADP. J Biol Chem. 1996;271:27995–27998. doi: 10.1074/jbc.271.45.27995. [DOI] [PubMed] [Google Scholar]
- Kushmerick MJ. Multiple equilibria of cations with metabolites in muscle bioenergetics. Am J Physiol. 1997;272:C1739–1747. doi: 10.1152/ajpcell.1997.272.5.C1739. [DOI] [PubMed] [Google Scholar]
- Lawson JW, Veech RL. Effects of pH and free Mg2+ on the Keq of the creatine kinases reaction and other phosphate hydrolyses and phosphate transfer reactions. J Biol Chem. 1979;254:6528–6537. [PubMed] [Google Scholar]
- Meyer RA, Foley JM. Cellular processes integrating the metabolic response to exercise. In: Rowell LB, Shepherd JT, editors. Exercise: Regulation and Integration of Multiple Systems. New York: Oxford University Press; 1996. pp. 841–869. [Google Scholar]
- Mootha VK, Arai AE, Balaban RS. Maximum oxidative phosphorylation capacity of the mammalian heart. Am J Physiol. 1997;272:H769–775. doi: 10.1152/ajpheart.1997.272.2.H769. [DOI] [PubMed] [Google Scholar]
- Newham D, Cady E. A 31P study of fatigue and metabolism in human skeletal muscle with voluntary, intermittent contractions at different forces. NMR Biomed. 1990;3:211–219. doi: 10.1002/nbm.1940030504. [DOI] [PubMed] [Google Scholar]
- Paganini AT, Foley JM, Meyer RA. Linear dependence of muscle phosphocreatine kinetics on oxidative capacity. Am J Physiol. 1997;272:C501–510. doi: 10.1152/ajpcell.1997.272.2.C501. [DOI] [PubMed] [Google Scholar]
- Pedersen PK, Kiens B, Saltin B. Hyperoxia does not increase peak muscle oxygen uptake in small muscle group exercise. Acta Physiol Scand. 1999;166:309–318. doi: 10.1046/j.1365-201x.1999.00575.x. [DOI] [PubMed] [Google Scholar]
- Raguso CA, Coggan AR, Gastaldelli A, Sidossis LS, Bastyr EJ 3rd, Wolfe RR. Lipid and carbohydrate metabolism in IDDM during moderate and intense exercise. Diabetes. 1995;44:1066–1074. doi: 10.2337/diab.44.9.1066. [DOI] [PubMed] [Google Scholar]
- Richardson RS, Noyszewski EA, Kendrick KF, Leigh JS, Wagner PD. Myoglobin O2 desaturation during exercise. Evidence of limited O2 transport. J Clin Invest. 1995;96:1916–1926. doi: 10.1172/JCI118237. [DOI] [PMC free article] [PubMed] [Google Scholar]
- Richardson RS, Noyszewski EA, Leigh JS, Wagner PD. Lactate efflux from exercising human skeletal muscle: role of intracellular PO2. J Appl Physiol. 1998;85:627–634. doi: 10.1152/jappl.1998.85.2.627. [DOI] [PubMed] [Google Scholar]
- Rowell LB. Human Cardiovascular Control. New York: Oxford University Press; 1993. Limitations in skeletal muscle metabolism; pp. 360–367. [Google Scholar]
- Sjøgaard G, Saltin B. Extra- and intracellular water spaces in muscles of man at rest and with dynamic exercise. Am J Physiol. 1982;243:R271–280. doi: 10.1152/ajpregu.1982.243.3.R271. [DOI] [PubMed] [Google Scholar]
- Suarez RK, Staples JF, Lighton JR, West TG. Relationships between enzymatic flux capacities and metabolic flux rates: nonequilibrium reactions in muscle glycolysis. Proc Natl Acad Sci U S A. 1997;94:7065–7069. doi: 10.1073/pnas.94.13.7065. [DOI] [PMC free article] [PubMed] [Google Scholar]
- Suleymanlar G, Zhou HZ, McCormack M, Elkins N, Kucera R, Reiss OK, Shapiro JI. Mechanism of impaired energy metabolism during acidosis: role of oxidative metabolism. Am J Physiol. 1992;262:H1818–1822. doi: 10.1152/ajpheart.1992.262.6.H1818. [DOI] [PubMed] [Google Scholar]
- Taylor DJ, Bore PJ, Styles P, Gadian DG, Radda GK. Bioenergetics of intact human muscle. A 31P nuclear magnetic resonance study. Mol Biol Med. 1983;1:77–94. [PubMed] [Google Scholar]
- Tonkonogi M, Sahlin K. Actively phosphorylating mitochondria are more resistant to lactic acidosis than inactive mitochondria. Am J Physiol. 1999;277:C288–293. doi: 10.1152/ajpcell.1999.277.2.C288. [DOI] [PubMed] [Google Scholar]
- Walsh B, Tiivel T, Tonkonogi M, Sahlin K. Increased concentrations of P(i) and lactic acid reduce creatine-stimulated respiration in muscle fibers. J Appl Physiol. 2002;92:2273–2276. doi: 10.1152/japplphysiol.01132.2001. [DOI] [PubMed] [Google Scholar]
- Walter G, Vandenborne K, McCully KK, Leigh JS. Noninvasive measurement of phosphocreatine recovery kinetics in single human muscles. Am J Physiol. 1997;272:C525–534. doi: 10.1152/ajpcell.1997.272.2.C525. [DOI] [PubMed] [Google Scholar]