

Abstract
Ionotropic glycine receptors (GlyRs) are present in the central nervous system well before the establishment of synaptic contacts. Immature nerve cells are known, at least in the spinal cord, to express α2 homomeric GlyRs, the properties of which are relatively unknown compared to those of the adult synaptic form of the GlyR (mainly α1/β heteromeres). Here, the kinetics properties of GlyRs at the single-channel level have been recorded in real-time by means of the patch-clamp technique in the outside-out configuration coupled with an ultra-fast flow application system (< 100 µs). Recordings were performed on chinese hamster ovary (CHO) cells stably transfected with the α2 GlyR subunit. We show that the onset, the relaxation and the desensitisation of α2 homomeric GlyR-mediated currents are slower by one or two orders of magnitude compared to synaptic mature GlyRs and to other ligand-gated ionotropic channels involved in fast synaptic transmission. First latency analysis performed on single GlyR channels revealed that their slow activation time course was due to delayed openings. When synaptic release of glycine was mimicked (1 mm glycine; 1 ms pulse duration), the opening probability of α2 homomeric GlyRs was low (Po ≈ 0.1) when compared to mature synaptic GlyRs (Po = 0.9). This low Po is likely to be a direct consequence of the relatively slow activation kinetics of α2 homomeric GlyRs when compared to the activation kinetics of mature α1/β GlyRs. Such slow kinetics suggest that embryonic α2 homomeric GlyRs cannot be activated by fast neurotransmitter release at mature synapses but rather could be suited for a non-synaptic paracrine-like release of agonist, which is known to occur in the embryo.
In the brainstem and spinal cord of mammals, glycine receptors (GlyR) are primarily involved in fast inhibitory synaptic transmission. Additionally, it has long been thought that GlyR and other ligand-gated ion channels (LGICs) could also play a crucial role during early CNS development. Indeed, functional LGICs are expressed by immature neurones well before synapse formation (Ben-Ari, 2001) and by different types of neural precursor cells (Nguyen et al. 2001). Moreover, the existence of an early paracrine activation of LGICs has already been described in slices, for GlyRs and NMDA receptors, during neocortical development (LoTurco et al. 1991; Flint et al. 1998) and for GABAA receptors in immature CA1 pyramidal neurones (Demarque et al. 2002). As opposed to the adult brain, the activation of GlyR has an excitatory action in immature neural cells resulting from a depolarised chloride equilibrium potential. GlyR-mediated depolarisation of immature neurones induces a calcium entry through voltage-gated calcium channels (Flint et al. 1998; Reichling et al. 1994), which may modulate cell proliferation, migration and differentiation in neural precursors (Nguyen et al. 2001; Ben-Ari, 2001) and, later, maturation of the inhibitory synapse (Kneussel & Betz, 2000).
This early trophic function of GlyR seems to be correlated with the expression of a specific GlyR subtype during embryogenesis, i.e. the α2 homomeric GlyR. In spinal cord and brainstem, this GlyR subtype is mainly expressed during fetal development and is progressively replaced by an adult α1/β heteromeric GlyR during the two first postnatal weeks in rodents (Akagi & Miledi, 1988; Malosio et al. 1991; Singer et al. 1998). Previous data suggest a non-synaptic function of the α2 homomeric GlyR. Firstly, its location is likely to be outside the synapse since it lacks β subunits which interact with gephyrin (Kirsch et al. 1995; Meyer et al. 1995), a submembrane protein anchoring GlyRs at postsynaptic sites (Kneussel & Betz, 2000). Secondly, it is expressed in brain regions that lack glycinergic synaptic transmission (Virginio & Cherubini, 1997; Flint et al. 1998; Mangin et al. 2002) as well as in neural stem and progenitors cells (Nguyen et al. 2002, 2003a) and in non-neuronal cells like astrocytes and oligodendrocytes (Pastor et al. 1995; Belachew et al. 1998). Hence, one can reasonably hypothesise that α2 homomeric GlyRs would mediate non-synaptic cell-cell communication during early brain development, independently of the synaptic function of GlyR. However, the functional properties of α2 homomeric GlyRs need to be determined to better understand their cellular function during embryogenesis.
In the present study, we have characterised the kinetic properties (activation, desensitisation and deactivation) of α2 homomeric GlyRs stably expressed in chinese hamster ovary (CHO) cells by means of outside-out patch-clamp recordings using an ultra-fast flow application system. We show that the kinetic properties of α2 homomeric GlyRs make this receptor inefficient when activated at physiological agonist concentration (≤ 1 mm). Our experimental data suggest that the α2 homomeric GlyR will be poorly efficient if synaptically activated. On the contrary, it could be adapted to sustained and slow paracrine-like release of agonist, as described in embryos.
Methods
Cell culture chinese hamster ovary cells (CHO-K1, ATCC no. CCL61) were maintained in a 95 % air-5 % CO2 humidified incubator at 35 °C in Dulbecco's modified Eagle's medium (DMEM) supplemented with 0.11 g l−1 sodium pyruvate, 6 g l−1d-glucose, 10 % (v/v) heat-inactivated fetal bovine serum (all from GIBCO BRL). Cells were passed every 5–6 days (up to 20 times). For electrophysiological recordings, cells were seeded onto glass coverslips coated with poly-d-lysine (0.1 mg ml−1).
GlyR α2 cloning and transfection
Samples of 1 µg of total RNA extracted from adult rat spinal cord were reversely transcribed using Superscript (Invitrogen) and oligodT as primers. The obtained cDNA was used as template in a PCR reaction containing 2.5 u of High Fidelity enzyme (Roche), 1.5 mm of MgCl2, the forward primer (ATCACGGAAACAGGAATGAAC) and the reverse primer (CATCTATTTCTTGTGGACATC) for the rat GlyR α2 subunit (access no. X61159). The PCR reaction was performed in a MJ-Rsearch PTC-200 thermal cycler (after a 2 min denaturation initial step, 10 cycles at 94 °C for 15 s, at 50 °C for 30 s and at 72 °C for 2 min were followed by 20 cycles at 94 °C for 15 s, at 60 °C for 30 s and at 72 °C for 2 min with five additional seconds per cycle and by final extension at 72 °C for 2 min). PCR product was purified on an agarose gel and cloned in a pCRII-TOPO vector (Invitrogen). The sequence was checked and the GlyR α2 subunit was then subcloned in pTRACER-CMV vector (Invitrogen) in BstXI sites. The various constructs and their orientations were verified by sequencing. The constructs were transfected into CHO cells using the DAC30 lipofection reagent (Eurogentec, Liège, Belgium) selected with Zeocin 500 µg ml−1 48 h later (Invitrogen). Selected recombinant CHO cells were then cloned by dilution and several clones were tested and selected for the expression of the GlyR α2 subunit.
Whole-cell and outside-out recordings
Standard whole-cell and outside-out recordings (Hamill et al. 1981) were achieved under direct visualisation on α2 GlyR-transfected CHO cells. Cells were continuously perfused at room temperature (20 °C) with bathing solution (2 ml min−1) containing (mm): NaCl 145, KCl 1.5, CaCl2 2, MgCl2 1, Hepes 10, glucose 15 (pH 7.3, osmolarity 330 mosmol l−1). Patch-clamp electrodes were pulled from thick-wall borosilicate glass (whole-cell recordings, 2–3 MΩ; outside-out recordings, 5–10 MΩ). They were fire-polished and filled with (mm): CsCl 135, MgCl2 2, Na3ATP 4, EGTA 10, Hepes 10 (pH 7.2, osmolarity 290 mosmol l−1). During whole-cell recordings, the series resistance (4–9 MΩ) was monitored by applying 2 mV hyperpolarising pulses and compensated up to 70–95 %. To ensure cell dialysis, measurements were made on data obtained at least 3–5 min after the whole-cell configuration was established. Currents were recorded using an Axopatch 1D amplifier (Axon instruments, Foster City, CA, USA), and stored using a digital recorder (DAT DTR 1201, Sony, Tokyo, Japan). Recordings were filtered at 10 kHz using an eight-pole bessel filter (Frequency Devices), sampled at 50 kHz and stored on a PC computer using pCLAMP software 6.03 (Axon Instruments).
Drug delivery
During whole-cell recordings, drugs were applied to the preparation via a pressure-driven system with three parallel square tubes placed immediately above the recorded cell. Medium exchange was achieved by rapid lateral movement (≈10–20 ms) of the tubes performed by a computer-driven fast-exchange system (SF 77A Perfusion Fast-Step, USA). Drugs were dissolved in bathing solution. Outside-out single-channel currents were evoked using a fast-flow operating system (Franke et al. 1987; Legendre, 1998). Control and drug solution were gravity-fed into two channels of a thin-wall glass theta tube (2 mm outer diameter; Hilgenberg) pulled and broken to obtain a 200 µm tip diameter. The outside-out patch was positioned (45 deg angle) 100 µm away from the theta tubing, to be close to the interface formed between the flowing control and drug solutions. One lumen of the theta tube was connected to reservoirs filled with solutions containing different glycine concentrations. The solution exchange was performed by rapidly moving the solution interface across the tip of the patch pipette, using a piezo-electric translator (model P245.30, Physic Instrument). Concentration steps of glycine lasting 1–10000 ms were applied every 15–30 s. Exchange time of 10–90 % (< 100 µs) was determined before each set of experiments by monitoring the change in the liquid junction potential evoked by the application of a 10 %-diluted control solution on the open tip of the patch pipette (Legendre, 1998).
Whole-cell and outside-out analysis
Whole-cell and outside-out currents were analysed off-line on a G4 Macintoch using Axograph 4.8 software (Axon Instruments, USA). Normalised concentration–response curves were fitted using the Hill equation :
where I/Imax is the normalised response amplitude, EC50 is the glycine concentration producing half of the maximal response and nH is the Hill coefficient. For each concentration tested, the amplitude of the current, I, was measured at the peak of the response.
The activation time constants of glycine-evoked currents were estimated by fitting the onset of the responses with a sum of exponential curves using Axograph 4.8 software. The initial onset of the outside-out currents evoked by low concentrations of glycine was determined on the same patch based on the onset of the response evoked by a saturating concentration of the agonist (30–100 mm). Decay time constants were obtained by fitting the first 750 ms of the decay phase with a sum of exponential curves using Axograph 4.8 software. The presence of one or more exponential components was tested by comparing the sum of squared errors of the fits (Clements & Westbrook, 1991; Legendre, 1998).
For single-channel analysis, open and closed time durations were analysed manually using Axograph 4.8 software. For display purposes, open and closed time histograms show the distribution in log intervals with the ordinate on a square root scale. These distributions were fitted with the sum of several exponential curves. The fit was optimised with the least square method (Sigworth & Sine, 1987). The number of exponential components was determined by comparing the sum of squared errors of the fits.
Nonstationary variance analysis (Sigworth, 1980) was used to estimate the maximal opening probability of channels (PO,max). The point-per-point relationship between variance (σ2) and current (I) of the outside-out current decay phase was fitted by:
where i is the elementary current, I the macroscopic current, and N the total number of available channels in the patch (Sigworth & Sine, 1987; Legendre, 1998)
The number of active channels in a patch was determined by the stacking of unitary events over the course of 400–3000 ms sweeps at saturating glycine concentrations (3–30 mm) which is a good estimator for n < 4 (Horn, 1991; Burkat et al. 2001). Patches with less than three functional GlyRs were analysed. When more than one channel was present in the patch, distribution functions were nth rooted to compensate for n channel patches (Aldrich et al. 1983). Patches were included only if channel activity was stable over sweeps. First latencies were measured manually using Axograph 4.8 software. First latencies distributions were created using standard histogram techniques (Aldrich et al. 1983).
Averaged data are expressed as mean ± s.d., except when stated otherwise. Statistical significance of the data was assessed from Student's t tests or one-way analysis of variance (ANOVA) followed by Dunnett's multiple-comparison post tests (DMCT) when significance was reached.
Results
Concentration–response curves in whole-cell and outside-out glycine-evoked currents mediated by α2 homomeric GlyRs
We analysed the efficacy of glycine in activating recombinant α2 homomeric GlyRs in CHO cells stably expressing the rat α2 GlyR subunit. Figure 1 illustrates inward currents (VH = −50 mV) evoked by different concentrations of glycine during whole-cell (Fig. 1Aa) and outside-out (Fig. 1Ba) recordings. Four to seven different concentrations of glycine were tested for each cell or patch and the response amplitude was normalised with respect to the amplitude of the response obtained with 1 mm glycine. Figure 1 shows concentration–response curves obtained by averaging responses obtained in eight whole-cell experiments (Fig. 1Ab) and in seven outside-out experiments (Fig. 1Bb). Concentration–response curves were fitted with the Hill equation (see Methods) giving an EC50 of 182 µm and a Hill coefficient of 1.8 for averaged whole-cell experiments and an EC50 of 186 µm and a Hill coefficient of 1.8 for averaged outside-out experiments. The EC50 and Hill coefficient variability was estimated by fitting individual concentration-response curves obtained for each cell. Individual fits gave a mean EC50 of 199 ± 31 µm and a Hill coefficient of 1.9 ± 0.16 for whole-cell experiments (n = 8) and a mean EC50 of 172 ± 31 µm and a Hill coefficient of 1.8 ± 0.1 for outside-out experiments (n = 7). There are no significant differences between the values obtained in whole-cell experiments and those calculated from outside-out currents (unpaired t test, P > 0.05),
Figure 1. Concentration-response curves for glycine of α2 homomeric GlyRs in the whole-cell and the outside-out configurations.
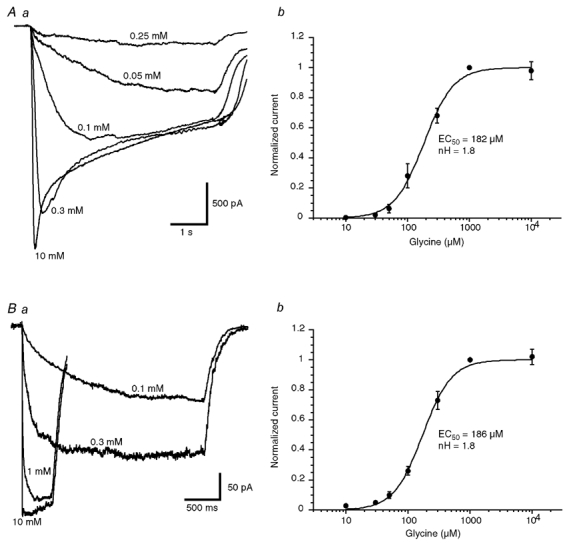
Aa, examples of currents evoked by step applications of the indicated concentrations of glycine during a whole-cell recording in a CHO cell transfected with the α2 GlyR subunit (holding potential (VH) = −50 mV). Ab, concentration-response curve of data obtained from eight cells. Response amplitudes were normalised to the ones obtained in the presence of 1 mm glycine in each cell. Data were fitted with the Hill equation giving an EC50 of 182 µm and a Hill coefficient of 1.8. Ba, responses of a patch to step applications of different concentrations of glycine. The duration of the application was adjusted to obtain a steady-state amplitude of the responses. Each trace represents the average of 15 responses. Bb, concentration-response curve of data obtained from seven outside-out patches. Response amplitudes were normalised to the ones obtained in the presence of 1 mm glycine in each cell. Data were fitted with the Hill equation giving an EC50 of 186 µm and a Hill coefficient of 1.8. See text for values from individual cells.
Slow desensitisation of α2 homomeric GlyRs
The desensitisation properties of currents mediated by recombinant α2 homomeric GlyRs were investigated in whole-cell and outside-out recordings. Figure 2 illustrates desensitising responses observed during a 10 s application of 10 mm glycine during whole-cell (Fig. 2A) and outside-out experiments (Fig. 2B). The time course of desensitisation was well fitted by a single exponential function in both configurations with time constant values of 2.8 ± 1.5 s (n = 11) in the whole-cell configuration and 6.1 ± 1.6 s (n = 6) in the outside-out configuration. The desensitisation time constant was significantly slower in the outside-out configuration than in the whole-cell configuration (unpaired t test, P < 0.01), which may suggest an unknown intracellular regulation of the α2 homomeric GlyRs as previously suggested for α1 homomeric GlyRs (Fucile et al. 2000; Gentet & Clements, 2002). The ratio of the steady-state to peak current amplitudes was 37 ± 16 % (n = 11) in whole-cell recordings and 46 ± 10 % (n = 6) in outside-out recordings. Recovery from desensitisation of recombinant α2 homomeric GlyRs was analysed in the whole-cell configuration only using a paired pulse protocol. During paired pulse experiments, a 6 s prepulse (10 mm glycine) followed by a 1 s test pulse was applied at various intervals (0.5–90 s) (Fig. 2Ba). A 3 min interval was observed between paired pulses to ensure complete recovery from desensitisation. Rundown of the responses sometimes occurred during the experiment. Cells with current rundown exceeding 10 % between the initial and final pulses were discarded. Rundowns ≤ 10 % were compensated by normalising each paired pulse response at the peak of the initial response amplitude. The relative amplitude of the test pulses was estimated from the residual current measured at the end of the 6 s glycine pre-application. For all experiments (n = 5), the recovery could be fitted with a single exponential function with a time constant value of 10 ± 2.8 s (n = 5).
Figure 2. Desensitisation kinetics of currents mediated by α2 homomeric GlyRs.
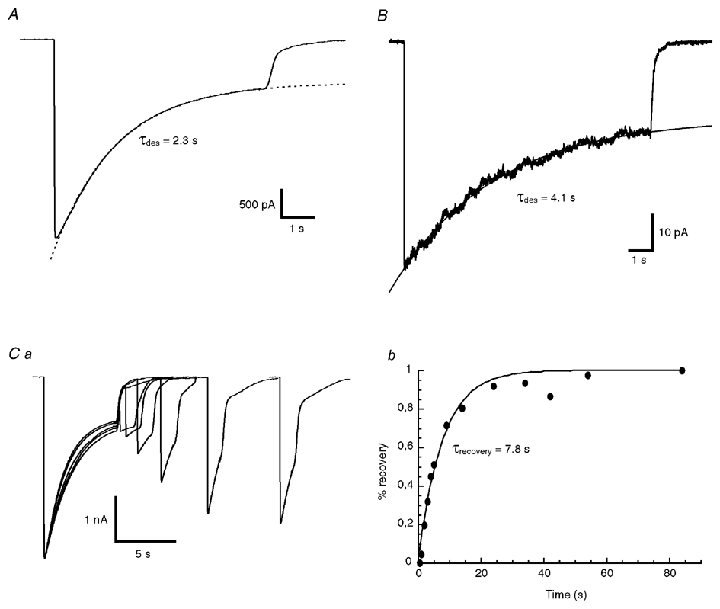
A, example of a whole-cell current obtained in response to a 10 s step application of 10 mm glycine. The desensitisation time course (τdes) was fitted by a single exponential function (dotted line) with a time constant value of 1.9 s. B, example of an averaged outside-out patch current obtained in response to a 10 s step application of 10 mm glycine. The desensitisation time course was fitted by a single exponential function (smooth line) with a time constant value of 4.1 s. Ca, example of recovery from receptor desensitisation induced by a 6 s step prepulse of 10 mm glycine during a whole-cell experiment. Test pulses (10 mm, 1 s) were applied at different intervals ranging from 500 ms to 80 s after the end of the prepulse. Cb, the time course of recovery of the peak response of recording shown in Ca was fitted with a single exponential function with a time constant value (τrecovery) of 7.8 s.
Onset of macroscopic currents mediated by α2 homomeric GlyRs
The activation phase of currents evoked by concentration steps of an agonist gives information on the activation kinetics of the receptor channel. The rising phase of currents evoked by glycine on α2 homomeric GlyRs was analysed on outside-out patches (see Methods). For each concentration of glycine, a series of 15–50 trials evoked with a ≥ 10 s interval was used to generate macroscopic averaged traces, as exemplified in Fig. 3A.
Figure 3. Activation time course of glycine-evoked responses.
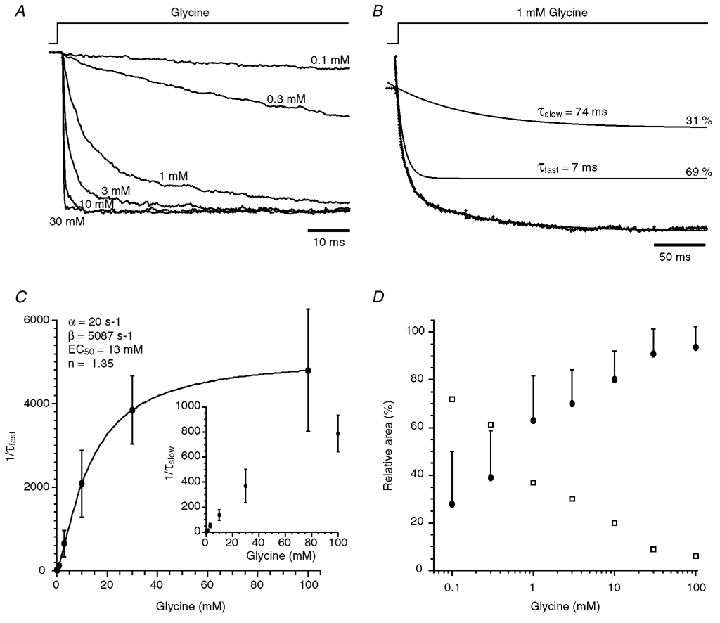
A, averaged traces of currents (n = 15–50) obtained in different patches showing the activation phase of the responses evoked by the application of 0.1, 0.3, 1, 3, 10 and 30 mm glycine. Traces were normalised to their maximum amplitudes. B, normalised averaged current from 20 responses evoked by step applications of 1 mm glycine. Note that the activation phase has two components with a fast time constant τfast = 7 ms (69 %) and a slow time constant τslow = 74 ms (31 %). C, the plot of fast rising rates (1/τfast) versus glycine concentrations was fitted with the equation 1/τfast =α+β([glycine]n/([glycine]n+rEC50n)), giving: α= 20 s−1, β= 5087 s−1, rEC50 = 13 mm and n = 1.35. Insert shows a similar plot for the slow rising rate (1/τslow). Note that the slow rising rate was equally concentration dependent. Each point of both plots represents the average of 5–19 experiments. D, plot of the relative proportion of the fast (•) and the slow (□) rising phase components versus glycine concentration. The relative proportion of the slow component decreased when the concentration of glycine increased. Each point is the average of 5–19 experiments. Standard deviations are identical for both component areas and are thus only indicated for the fast component area.
As shown in Fig. 3A, the rise time of the glycine-evoked currents decreased when the agonist concentration increased, to reach a minimum at a glycine concentration of 100 mm (Fig. 3C). For each concentration, the pulse duration was adjusted (0.4–3 s) in order to obtain a steady-state current. The rising phases of the outside-out currents evoked by the application of ≤ 10 mm glycine were best fitted with the sum of two exponential curves. In three out of the seven patches tested with 30 mm glycine concentration steps, and in four out of the seven patches tested with 100 mm glycine, the outside-out current exhibited an activation phase that was best fitted by a single exponential function. Figure 3B shows a representative onset of an averaged patch current evoked by a 1 mm glycine concentration step. In this example, the rising phase was fitted with the sum of two exponential curves giving time constants, τfast = 7 ms (69 %) and τslow = 74 ms. As shown in Fig. 3C and D, the time constant values and relative areas of the fast and slow components were dependent on the agonist concentration. Plot of the τfastversus concentration was fitted with the following equation (Legendre, 1998):
where α is an approximation of the closing rate constant, β is an approximation of the opening rate constant, n is the number of binding sites, and rEC50 is the concentration of glycine that give half of the maximum opening rate constant (Colquhoun & Hawkes, 1995). The fast component increased with a slope factor n of 1.35 from a minimal rate constant of 20 s−1 to a maximal rate constant of 5087 s−1 suggesting that the opening rate constant β of the channel is considerably higher than the closing rate constant α. rEC50 was 13 mm. The efficacy of the receptor (E) could therefore be estimated ≈255 since E =β/α (Colquhoun, 1998). Accordingly, the efficacy of the α2 homomeric GlyRs could be > 20 higher than the E value estimated for synaptic heteromeric α1/β GlyRs (E = 11; Legendre, 1998).
To confirm this point, we have analysed the open and close time distribution in single receptor bursts of openings in response to short (1 ms) concentration pulses of glycine near GlyR saturation (30 mm). To perform this analysis, patches with a single functional GlyR were selected. As shown in Fig. 4A, a GlyR opens in bursts of long openings interrupted by very short closures. Single openings and closures were manually detected and measured using a filter cut-off frequency of 5 kHz. Opening and closing time constants were estimated by pooling measurements made on 110 sweeps from three patches. The open time histogram was best fitted by a single exponential curve (Fig. 4Ba) giving a open time constant value of τo = 49.6 ms. The closed time histogram was also best fitted with a single exponential curve (Fig. 4Bb) with time constant τc = 0.19 ms. This analysis gave an estimation of the closing rate constant α as α= 1/τo. Accordingly, α= 20.1 s−1, a value closely similar to the value obtained by analysing the activation rate constant of averaged outside-out currents.
Figure 4. Open time and closed time distribution of the α2 homomeric GlyR.
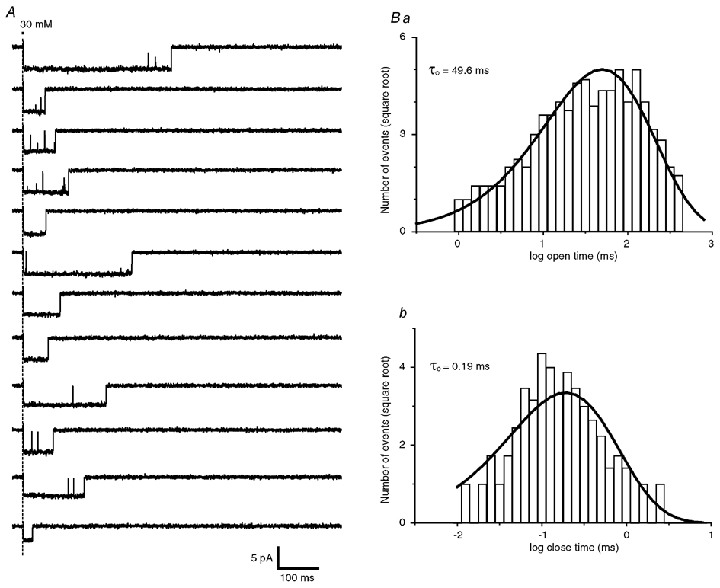
A, example of single-channel recordings obtained in response to 1 ms step application of 30 mm glycine (cut-off filter frequency = 2 kHz for display purposes; VH = −50 mV). Ba and b, open time (Ba) and closed time (Bb) distribution obtained by pooling single-channel currents (110 trials) obtained in response to 1 ms step application of 10–30 mm glycine in three different experiments. Distribution histograms are shown as a function of log interval with the ordinates on a square root scale. Both distribution were best fitted with a single exponential function giving an open time constant τo = 49.6 ms and a closed time constant τc = 0.19 ms.
Closed time histogram reveals the presence of a single closed time constant suggesting a simple mechanism underlying channel reopening within a burst. Assuming a simple Markov model with several liganded closed states, the number of openings per burst will depend both on the dissociation rate constant (koff) linking the liganded closed state near the open state to another liganded closed state and on the opening rate constant β linking the liganded closed state to the open state. Accordingly, the number of openings per burst No = 1+β/koff. On 110 trials analysed, the average number of openings per bursts was 2.7 indicating that koff is ≈2 times slower than β. Therefore, contrasting with its complex activation behaviour, the deactivation of the α2 homomeric GlyR seems to be governed by a very simple mechanism which can be reduced to a single closing/opening rate equilibrium governed by the open rate and the dissociation rate ratio.
To further characterise the kinetic properties of the α2 homomeric GlyR, we have investigated the deactivation properties of this receptor when activated by the application of different concentrations of glycine. The decay phase of outside-out currents evoked by short pulses (1 ms) of 10 mm of glycine (Fig. 5) could be systematically fitted with a single exponential function, giving a mean time constant of 159 ± 70 ms (n = 13). No significant differences were observed between experiments using 1, 10 and 30 mm glycine (P > 0.05 using one-way ANOVA). Because of the poor opening probability of GlyRs in response to short pulses of glycine at concentration ≤ 1 mm (see below), we could not test short pulses with lower concentrations of glycine. Nevertheless, the decay phases of currents evoked by long pulses (0.4–3 s) of 0.1–30 mm were equally fitted by single exponential curves with time constant values of ≈160 ms, which were not significantly different between long and short pulses or between concentrations (P > 0.05 using two-way ANOVA). These results suggest that the deactivation of α2 homomeric GlyR opening is underlied by bursts arising from a single open state. However, we cannot completely exclude the presence of other open states linked to other liganded closed state if they have nearly similar opening and closing rate constants.
Figure 5. Slow decay time constant of currents mediated by α2 homomeric GlyRs.
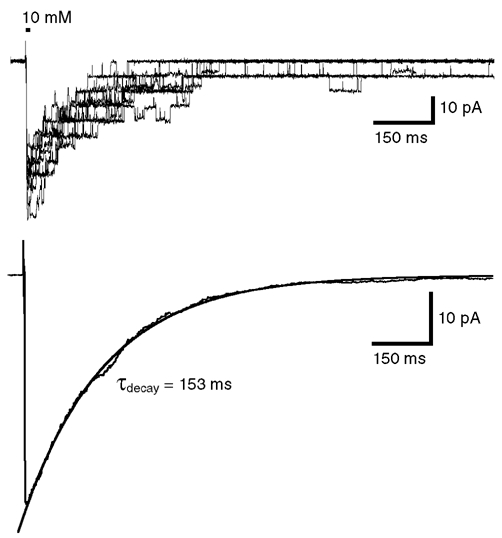
Superimposed traces of 10 responses obtained from a set of 50 individual currents evoked by identical step applications of 10 mm glycine (1 ms, VH = −50 mV). The lower trace represents the average of the 50 responses and was fitted with a single exponential function with a time constant value τdecay = 153 ms.
Single-channel first latency analysis reveals a slow and bimodal activation of α2 homomeric GlyRs
To determine the microscopic determinants of the slow and biphasic onset of macroscopic GlyR currents, we analysed the activation of the α2 homomeric GlyR in outside-out patches containing 1–3 active GlyRs (see Methods). Figure 6 shows the activation of a single receptor in response to repetitive step applications at different concentrations of glycine and in different patches. Averaged single-channel responses (80–200 trials) produce ensemble currents with time courses similar to the ones observed for macroscopic currents previously described (see Fig. 3). At all concentrations tested (0.1–30 mm), the ensemble averaged currents exhibit a biphasic rising phase with fast and slow components similar to macroscopic currents. To determine if the biphasic component of the activation phase reflects a complex GlyR behaviour occurring before the GlyR channel opens, we have analysed the distribution of initial closed times leading to the first opening (first latencies). As shown in Fig. 6, the increase in the activation time of the averaged macroscopic current obtained when the glycine concentration was decreased appeared to be related with an increase in the first latency (FL) duration. The FL cumulative distribution was clearly bimodal as shown in the example of Fig. 7A. In this example, the activation of a single GlyR was evoked by 1 mm glycine application and the FL distribution was fitted by the sum of two exponential functions with time constants τfast = 4.9 ms (68 %) and τslow = 71 ms. The corresponding averaged ensemble current exhibited a rising phase with τfast = 4.9 ms (67 %) and τslow = 75 ms, suggesting that the biphasic activation phase of the ensemble current could be determined by changes in GlyR conformation leading to channel openings. Accordingly, FL distribution of single-channel openings evoked by other concentrations of glycine (0.1–30 mm) equally exhibited two components (Fig. 7B and C). As previously observed for the analysis of activation rate constants, the two FL rate constants decreased when glycine concentration increased, and the fast component became dominant for glycine concentrations ≥ 1 mm (Fig. 7D).
Figure 6. The first latency of activation decreases when the glycine concentration increases.
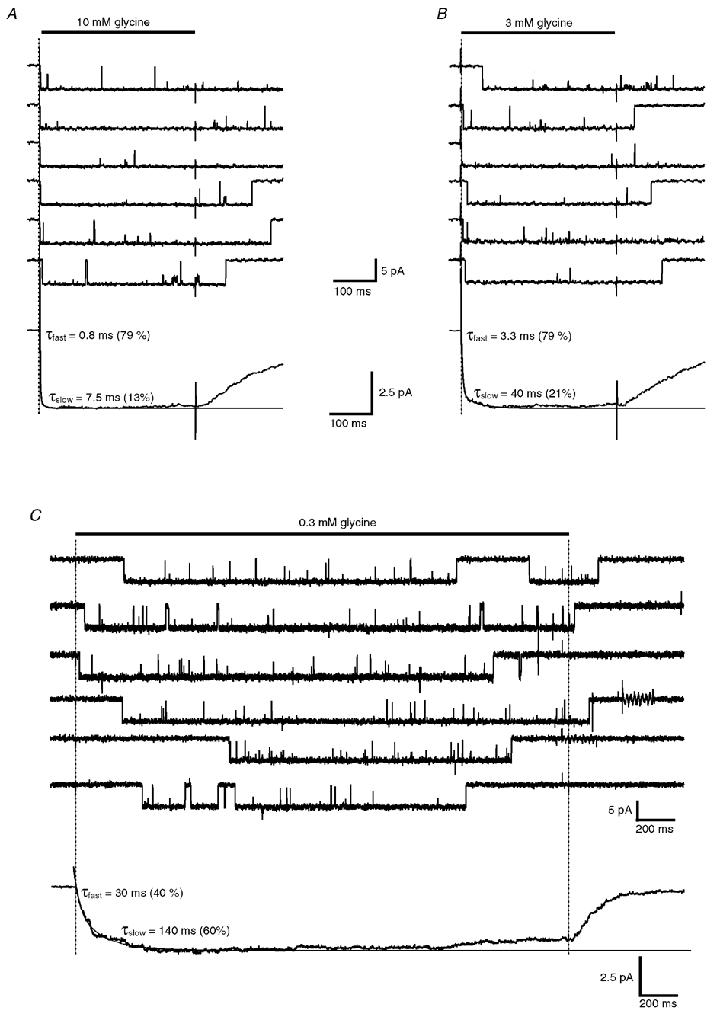
A and B, representative, non-consecutive, single-channel openings of a single α2 homomeric GlyR evoked by a 400 ms step application of 10 mm glycine (A) and 3 mm glycine (B) on the same patch. Ensemble average currents (lower traces, n = 150 for each concentration) were best fitted with a bi-exponential function (smooth lines). Fast and slow time constant and their relative areas are indicated for both concentrations. C, representative, non-consecutive single-channel openings evoked by a 3 s step application of 0.3 mm glycine. The ensemble average current (lower trace, n = 80) was best fitted with a bi-exponential function (smooth line) with time constants and relative weights as indicated.
Figure 7. First latency analysis of α2 homomeric GlyRs.
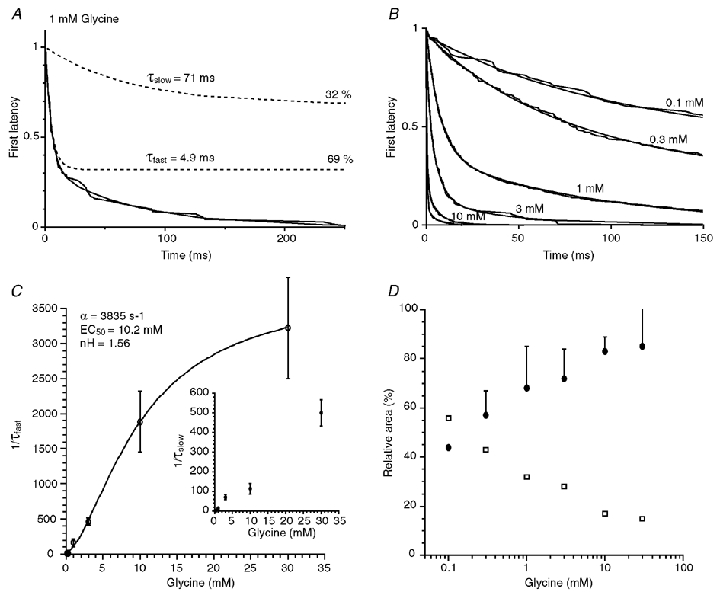
A, example of a first latency distribution obtained at 1 mm glycine in a single-channel experiment. This first latency distribution was best fitted by the sum of two exponential functions (smooth line). Broken lines represent each exponential function with their time constant values and their relative areas indicated on the right. B, example of first latency distributions obtained at different glycine concentrations (0.1–30 mm) from different patches. The number of first latencies pooled ranges from 100 to 200 events for each concentration. All first latency distributions were best fitted by sums of two exponential functions (smooth lines). C, plot of the fast (1/τfast) and slow (1/τslow) rate constants versus glycine concentration. The fast rate was fitted with the equation 1/τfast = β([glycine]n/([glycine]n+rEC50n)), with β = 3835 s−1, rEC50 = 10.2 mm and n = 1.56. D, plot of the relative proportion of the fast (•) and the slow (□) rising phase components versus glycine concentration. The relative proportion of the slow component decreased when the concentration of glycine increased. Each point is the average of 2–7 experiments. Standard deviations apply to both slow and fast components and are indicated only for the fast component for all concentrations analysed except for 0.1 mm (n = 2).
The plot of the fast FL rate versus glycine concentration was fitted with the following equation:
This equation only differs from the equation previously used for macroscopic current onset by the absence of the added constant α since the closing rate constant (channel opening time constant) was not involved in first latency. This fit gave an opening rate constant β of 3853 s−1, a rEC50 of 10.2 mm and a slope factor n of 1.56. These values are very similar to the ones obtained with macroscopic currents. This further suggests that the rising phase of the currents evoked by glycine concentrations ≥ 0.03 mm is likely to be governed by conformational changes between closed state before channel openings.
The presence of a slow FL component could suggest the existence of a desensitised state with a fast desensitisation rate and a fast recovery rate linked to a partially liganded closed state. As the slow FL rate constant was concentration-dependent, this partially liganded closed state is unlikely to be directly linked to the single open state we determined. Indeed, if this closed state was directly linked to the putative desensitised state and to the open state, the slow FL rate constant would be independent of agonist concentration (Burkat et al. 2001).
To further determine if a desensitised state is linked to a liganded closed state, distally located to the fully liganded closed state leading to channel openings, we used a protocol derived from experiments demonstrated by Mozrzymas et al. (2003) to show the existence of a mono-liganded desensitised state in the GABAA receptor. This experiment consists of analysing the consequences of the outside-out patch pre-incubation using an infra-liminar concentration of agonist on the responses evoked by the application of a near-saturating concentration of glycine. Pre-incubation with an infra-liminar concentration of agonist should accumulate receptors in partially liganded states. If a desensitised state is linked to a partially liganded closed state, pre-incubation will result in a decrease in the amplitude of the responses evoked by a high concentration of agonist (Mozrzymas et al. 2003). To perform these experiments, patches were pre-incubated with 10 µm glycine. At this concentration, we did not observed any channel openings for a period of time > 1 min (data not shown), which confirms the weak ability of GlyRs to reach a liganded closed state linked to an open state at such concentrations. As shown in Fig. 8, the pre-incubation with 10 µm glycine depresses the current evoked by 30 mm of glycine by 47 ± 15 % (n = 6) when compared to control responses evoked in the absence of pre-incubation with 10 µm glycine. This result further suggests the presence of a desensitised state linked to a partially liganded closed state.
Figure 8. Pre-equilibration of receptors at a low glycine concentration depresses the current responses evoked by a saturating glycine concentration.
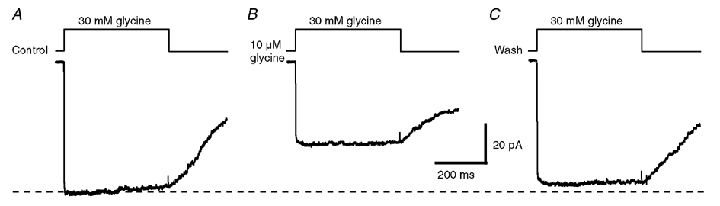
Ensemble averaged currents (n = 20) obtained in response to 400 ms step application of 30 mm glycine in normal saline solution (A), after a pre-equilibration with 10 µm glycine for ≥ 1 min (B) and after washing with normal saline solution (C) in the same patch.
α2 homomeric GlyRs have a low open probability when activated by a synaptic-like application
According to the opening (β) and the closing (α) rate constant values that we obtained (α≈ 20 s−1 and β≈ 5000 s−1), the maximum open probability (PO,max) of the homomeric α2 GlyR should be very high. Indeed, PO,max = β/(α+β), which predicts a PO,max close to 1 (0.996). To confirm this point, non-stationary variance-amplitude analysis (Sigworth & Sine, 1987) was used to estimate the maximal open probability of the receptor (see Methods). Maximal open probability of the receptor was analysed on responses evoked by 30 mm glycine applications. Figure 9B shows an example of a variance-amplitude plot computed from 50 responses obtained from a single channel in response to 400 ms step applications of 30 mm glycine. The duration of the application was set to obtain a maximum response amplitude. The variance-amplitude plot was fitted with the following equation (Sigworth & Sine, 1987):
where i is the elementary current, I the averaged macroscopic current and N the total number of available receptors. The maximal open probability (PO,max) of the receptor corresponds to the maximal amplitude observed for the averaged macroscopic current divided by the theoretical maximal current iN. At 30 mm glycine, the mean PO,max calculated from four different experiments was 0.94 ± 0.04. This is close to the predicted value calculated with α≈ 20 s−1 and β≈ 5000 s−1.
Figure 9. Maximal open probability of the α2 homomeric GlyR.
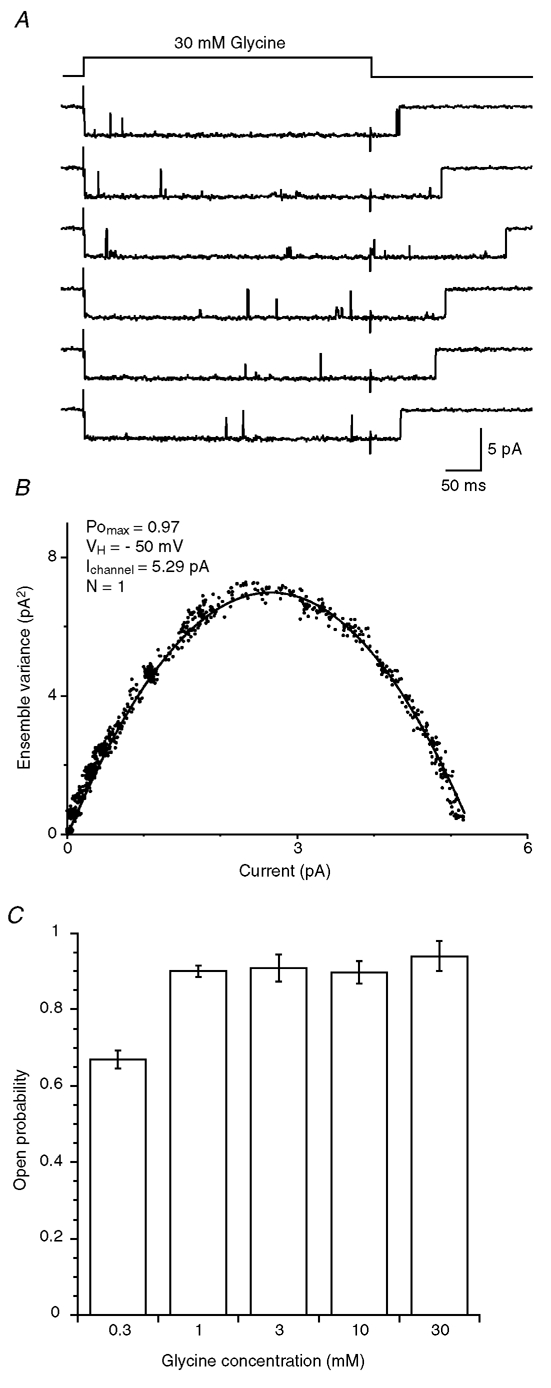
A, traces illustrating six representative recordings from 50 responses used to construct the variance–amplitude plot in B. B, variance-amplitude plot computed from 50 responses obtained from a single channel activated by 400 ms step application of 30 mm glycine. The black curve represents the fitted model σ2 = iI− (I2/N), with i = 5.29 pA and N = 1. The estimated maximal open probability is PO,max = Ipeak/(iN) = 0.97. C, bar graph of the open probability at the peak of GlyR currents obtained in response to long application (0.4–3 s) at 0.3 mm glycine (n = 4), 1 mm glycine (n = 4), 3 mm glycine (n = 3), 10 mm glycine (n = 4) and 30 mm glycine (n = 4).
Agonist clearance at the synaptic cleft is usually fast (< 0.2 ms; Clements, 1996) but despite a high maximal open probability, the ability of a synaptic release to fully activate postsynaptic receptors also depends on the receptor activation properties and on the concentration of neurotransmitter released in the synaptic cleft. The activation kinetics of the α2 homomeric GlyR current appears to be slow at concentrations ≤ 10 mm, which may suggest that those GlyRs will be inefficient in response to a brief synaptic release. To address this question, we have mimicked the synaptic release of glycine by applying short pulses (1 ms) of 1 mm glycine on outside-out patches assuming that the peak concentration of glycine released in the synaptic cleft is ≤ 1 mm (Legendre et al. 1998; Suwa et al. 2001). As shown in Fig. 10Ab, the amplitude of the current evoked by 1 ms step application of 1 mm glycine (black trace) is considerably reduced compared to the amplitude of the response evoked by a 400 ms step application (grey trace). When a 1 ms concentration pulse of 30 mm was applied, we were not able to fully activate the receptor (Fig. 10Aa). To estimate the open probability of the channel in response to a 1 ms pulse of 1 mm glycine, we first performed non-stationary noise analysis on outside-out responses evoked by 1 ms application of 30 mm glycine. By fitting the plot of the variance versus the amplitude of the responses (see above) (Fig. 10Ba), we were able to estimate a Po = 0.75 ± 0.05 (n = 5) for responses evoked by 1 ms concentration pulse of 30 mm glycine. In three of these experiments, we could also estimate in the same patch the GlyR Po in response to a 1 ms pulse of 1 mm glycine by using the parabolic fit obtained from the 30 mm glycine application. In these cases, the Po was estimated by dividing the maximum amplitude current, obtained experimentally when GlyRs were activated by a 1 ms pulse of 1 mm glycine, by the maximum estimated current given by the parabolic fit (Fig. 10Bb). This approach gave a mean Po of 0.1 ± 0.03 for GlyR activated by 1 mm synaptic-like pulses, which suggests that homomeric α2 GlyR would be inefficient if they were postsynaptically located and activated by a single vesicle release.
Figure 10. Activation of α2 homomeric GlyRs by brief pulses of glycine mimicking synaptic transmission.
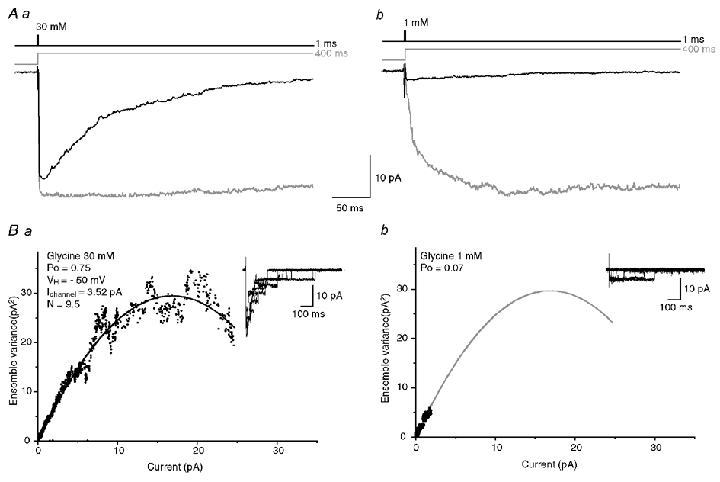
Aa and b, average of currents obtained in response to brief (1 ms; black traces; 50 trials averaged) and long (400 ms; grey traces; 15 trials averaged) step applications of 30 mm glycine (Aa) and 1 mm glycine (Ab) in the same patch. Ba and b variance-amplitude plot computed from 50 current transients obtained in response to brief pulses of 30 mm glycine (Ba) and 1 mm glycine (Bb) in the same patch, corresponding to traces in Aa and A2, respectively. The amplitude and the variance were computed for a period of 750 ms starting at the peak of the averaged response. The black curve (Ba) represents the fitted model σ2 = iI− (I2/N), with i = 3.52 pA and n = 9.5. The open probability at the peak of the response was: Po = 0.75. The fit obtained in Ba was used in Bb (grey curve) to estimate the open probability of the receptor in response to brief pulse of 1 mm glycine giving Po = 0.07.
Discussion
In this study, we describe the functional properties of α2 homomeric GlyRs using a combination of ultra-fast drug application to outside-out patches and non-stationary single-channel analysis. Based on our results, we suggest that the activation and the deactivation properties of α2 homomeric GlyRs are functionally better adapted to a paracrine neurotransmitter release than to a synaptic one.
α2 homomeric GlyR conductance levels
The α2 homomeric GlyR displays multiple-conductance openings with a main conductance state of 90–110 pS and subconductance states ranging from 20 to 80 pS (Takahashi et al. 1992; Bormann et al. 1993; De Saint Jan et al. 2001). The main conductance state of the α2 homomeric GlyR represents between 60 % and 90 % of the total open time during steady-state single-channel recordings (Takahashi et al. 1992; Bormann et al. 1993). In our study, large conductance levels were dominant in non-stationary conditions at all agonist concentrations tested. When subconductances occurred, they did not influence the time course of the activation phase of the outside-out currents since omitting sweeps with subconductance levels did not change the activation time course of the averaged current. The predominance of large conductance levels was also attested by non-stationary variance-amplitude analysis of large outside-out currents in which the estimated mean unitary conductance was 100 ± 24 pS (n = 6). Accordingly, the subconductance states were not considered as determinant in modulating the kinetics behaviour of α2 homomeric GlyR.
Activation rate and open state
The presence of single open time and single closed time components suggests the existence of a single open state in the α2 homomeric GlyR. Such a unique open state contrasts with the three to five different open states proposed for the α1 homomeric GlyR (Twyman & Macdonald, 1991 Beato et al. 2002; Lewis et al. 2003). In these studies, each open state occurred from differently liganded states of the receptor. The detection of a single open time constant, the mono-exponential and concentration-independent deactivation rate of the α2 homomeric GlyR make the presence of differently liganded open state with distinct kinetics properties for this receptor unlikely. Therefore, the most likely hypothesis will be to consider a single open state linked to the fully liganded close state.
First latency, receptor efficacy and channel open probability
The first latency distribution parallels the activation time course of outside-out currents suggesting that the slow GlyR activation is underlied by receptor conformational transitions occurring before channel openings. The slower component, which was both observed in the distribution of first latencies and in the activation phase of macroscopic currents, is likely to represent transitions between a liganded closed state and a desensitised closed state (Burkat et al. 2001). However, it is unlikely that this ‘fast’ desensitised state can significantly influence the fast rising phase component of the current evoked by a saturating concentration of glycine, as suggested by first latency analysis (Burkat et al. 2001). Accordingly, the maximum rising phase of outside-out currents evoked by a saturating concentration of agonist can be related to a first order reaction between a fully liganded closed state and the open state (Lewis et al. 2003). Hence, the corresponding activation time constant will depend on the opening rate constant β and on the closing rate constant α (τ = 1/(α+β)). As the mean open time of the channel is long (giving a closing rate constant estimated at 20 s−1), the opening rate constant of the channel, β, will be close to 5000 s−1. This was confirmed by the analysis of first latency distributions that showed a similar mono-exponential distribution at saturation, giving an open rate constant closely similar to the value obtained by analysing the activation rate of macroscopic currents.
Our estimation of the opening and closing rate constants would correspond to a very high open probability of the receptor, PO,max = β/(α+β), even being close to 1. This was confirmed by our experimental estimation of PO,max using non-stationary variance-amplitude analysis (PO,max≈ 0.94). Accordingly, the efficacy (E) of α2 homomeric GlyRs – defined as the ratio of the channel opening rate β to the closing rate α (E = β/α) – is high, being close to 250. This value is more than tenfold higher that the efficacy of glycine at recombinant α1 homomeric GlyRs expressed in HEK293 cells (E≈ 16; Lewis et al. 2003) and at native α1/β heteromeric GlyRs expressed in the zebrafish (E≈ 11, Legendre, 1998).
This very high efficacy value can partly explain the discrepancy observed between the EC50 value (potency) of concentration-response curves (186 µm) and the rEC50 value (10–13 mm) obtained from rising rate constant-concentration plots. In a simple Markov model with two equivalent binding sites and a single open state, the first latency rEC50 value gives an estimation of the microscopic dissociation constant KA and the EC50 of concentration-response curves depends both on KA and E values EC50 = KA/(1 +E) (Colquhoun, 1998). According to the EC50 values of concentration-response curves, such a calculation will gave a KA value of 46.7 mm, while KA values estimated from first latency analysis are in the range 10–13 mm. The differences between these two KA estimations could suggest that GlyR behaviour cannot be fully described by a simple Markov model with two equivalent binding sites and a single open state (see below).
Desensitisation properties of α2 homomeric GlyRs
Contrasting with the desensitisation behaviour reported for α1 homomeric GlyRs (Gentet & Clements, 2002) and for α1/β heteromeric GlyRs (Legendre, 1998; Harty & Manis, 1998; Singer & Berger, 1999), the α2 homomeric GlyR exhibits a single slow desensitisation component in the presence of a saturating concentration of glycine. The difference in the desensitisation time constant values between whole-cell (2.8 ± 1.5 s) and outside-out experiments (6.1 ± 1.6 s) could reflect the loss of an intracellular regulation, such as a dephosphorylation which is known to decrease the desensitisation kinetics in α1 homomeric GlyRs (Gentet & Clements, 2002). This could also reflect a loss of cytoskeletal regulations during outside-out recordings (Van Zundert et al. 2002). In whole-cell experiments, the time course of recovery from desensitisation was also fitted by a single exponential curve, again suggesting that a single desensitised closed state with slow kinetics controls GlyR activity. Moreover, the amount of desensitised current increases with glycine concentration, suggesting that this desensitised closed state is likely to reflect the existence of a desensitised state linked to a fully liganded closed state, as previously reported for α1 homomeric GlyRs (Gentet & Clements, 2002) or GABAAR (Mozrzymas et al. 2003). Therefore, the recovery rate constant (r) value from this desensitised state could be estimated from the recovery time constant τr from τr = 1/r. In whole-cell experiments, the mean τr was 10 s, giving a r value of 0.1 s−1. The desensitisation time constant, τd, will depend on the rate of entry, d, and the rate of exit, r, from the desensitised state as well as on the opening and closing transition rates, α and β, if one assumes that the fully liganded closed state is linked to the open state. The relation between these parameters is described by 1/τ≈r + d(1/1 +E), where E is the efficacy (Mozrzymas et al. 2003). This allowed us to estimate a desensitisation rate constant, d, for whole-cell currents close to 63 s−1 (r = 0.1 s−1 and E = 250).
In addition to this slow desensitised state associated with the fully liganded state, we propose the existence of a desensitised state linked to a partially liganded closed state. A mono-liganded desensitised state has already been described in GABAARs (Mozrzymas et al. 2003) and is present in several Markov models proposed for the α1 homomeric GlyR (Gentet & Clements, 2002; Breitinger & Becker, 2002). This desensitised closed state linked to a partially liganded close state was demonstrated by pre-incubating the patch with an infra-liminar glycine concentration. Those experiments also suggest that the partially liganded closed state linked to the desensitised closed state cannot lead to channel openings (Mozrzymas et al. 2003) since the pre-incubation with 10 µm did not evoke any channel openings The existence of a partially liganded fast desensitised state is likely to explain the biphasic rise time and the first latency distribution observed at non-saturating glycine concentrations. In GABAARs, such a fast desensitised state has already been reported and is responsible for the slow component observed in the biphasic distribution of first latencies. In this case, however, the time constants and their relative amplitudes were independent on the agonist concentration (Burkat et al. 2001). In our experiments, both parameters were dependent on the agonist concentration, which further suggests that this desensitised state is distally positioned from the fully liganded closed state leading to channel openings.
Number of binding steps
The α2 homomeric GlyR, like the α1 homomeric GlyR, is composed of five equivalent α subunits, each of them being able to bind the agonist. According to the Hill coefficient values obtained either by fitting dose-response curves (1.8) or by analysing the relationship between the agonist concentration and the fast activation rate constant (1.35) or analysing the relationship between the agonist concentration and the first latency rate constant (1.56), we propose a minimal Markov model for α2 homomeric GlyRs with two functional binding sites, as also previously proposed by Gentet & Clements (2002) for α1 homomeric GlyRs. This is in apparent contradiction with the postulated five structural binding sites for homomeric GlyRs (for review see Legendre, 2001). However, the number of functional binding sites versus the number of structural binding sites of homomeric GlyRs still remains controversial. For example, the kinetic model developed by Gentet & Clements on the α1 homomeric GlyR supposes that only two glycine binding steps are necessary to open the channel in non-stationary conditions, the three remaining sites being silent due to a possible negative cooperativity (Gentet & Clements, 2002). In contrast, the model developed by Beato et al. (2002) to describe the α1 homomeric GlyR activity in the presence of a low agonist concentration supposes that the five putative binding sites are functional, each binding site leading to a distinct opening state. Both models account for their respective corresponding experimental data, but cannot be generalised to each other. For example, the model of Beato et al. (2002) underestimated the GlyR potency and overestimated the Hill coefficient when compared to his experimental dose-response curves obtained from macroscopic currents.
A minimal Markov model for the α2 homomeric GlyR
According to our experimental data, a minimal Markov model for the α2 homomeric GlyR should possess two binding sites, two desensitised closed states linked to different binding states and a single open state (Fig. 11). The desensitised state with a slow rate should be linked to the doubly liganded closed state, while the fast desensitised close state accounting for the complex activation time course of the outside-out currents should be linked to the mono-liganded closed state. Finally, the open state is likely to be a doubly liganded open state.
Figure 11. Proposed Markov model for α2 homomeric GlyR.
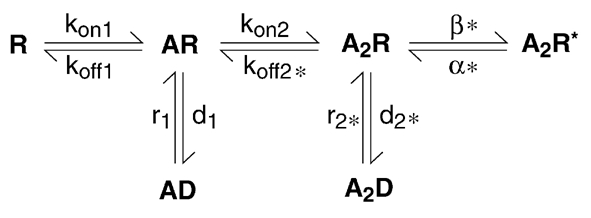
The model includes two sequential binding steps, two desensitised states linked to each binding step and one open state linked to the di-liganded closed state. With this model, a good fit of experimental data was obtained with kon1 = 0.32 s−1, koff1 = 411 s−1, kon2 = 0.64 s−1, koff2 = 2273 s−1, d1 = 20 s−1, r1 = 373 s−1, d2 = 0.05 s−1, r2 = 16 s−1, β = 5000 s−1 and α = 20 s−1. Rate constants labelled with * were directly determined from our experimental data and fixed, whereas non-labelled rate constants were set as free variables during the fitting procedure.
Several rate constants could be directly determined from our experimental measurements (see above): the slow desensitisation rate constant, the corresponding recovery rate, the opening rate constant of the channel and the closing rate constant of the channel. The value of the dissociation rate constant (koff2) between the doubly liganded closed state and the single liganded closed state can be approximated from the deactivation time constant (τoff) of current evoked by a short pulse of glycine (Colquhoun & Hawkes, 1995). This can be made since the deactivation time constant was independent on the glycine concentration, since β ≫ α and since the gap duration within a burst was short (Colquhoun & Hawkes, 1995). In this case,
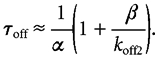 |
The koff2 value was estimated to be ≈2273 s−1 with β = 5000 s−1, α = 20 s−1 and τoff = 160 ms.
To obtain an estimate of the values of the association rate constant, of the dissociation rate constant from the single liganded closed state and of the desensitisation rate constant and the recovery rate constant of the single liganded desensitised state, we fitted experimental traces obtained by a long concentration step of 1 mm (n = 5 patches) using the kinetics model described above (Gentet & Clements, 2002). All the unknown parameters, were set as free variables. The fits were performed using a chemical modelling program (Axograph 4.8, Axon instruments, Union city USA). To account for the slower desensitisation time courses observed in outside-out currents, the slow desensitisation and recovery rate constant values were set to 16 s−1 and 0.05 s−1, respectively. This fitting procedure gave an optimal first association rate constant value (from unliganded to monoliganded closed states) and an optimal second association rate constant value (from monoliganded to doubly liganded closed states) of 0.32 µm−1 s−1 and of 0.63 µm−1 s−1, respectively. The optimal monoliganded dissociation rate constant value was 411.2 s−1, the optimal desensitisation rate constant value was 373. 7 s−1 and the optimal recovery rate constant value was 20.7 s−1. To further test this model, we performed simulations of outside-out currents. The theoretical and the experimental data were subsequently compared. This Markov model predicts an EC50 of 181.9 µm and a Hill coefficient of 1.57 for the concentration-response amplitude relationship and an rEC50 of 15.3 mm and a Hill coefficient of 1.34 for the fast rising rate-concentration relationship. These theoretical values are in good agreement with our experimental data. This model also predicted a bi-exponential rising phase for outside-out currents evoked by < 30 mm glycine, a time constant of the deactivation phase of 160 ms, a PO,max close to 1 and a Po≈ 0.05 when GlyRs were activated by 1 ms concentration steps of 1 mm glycine. This was also in good agreement with our experimental data. It should however be noted that this model had a tendency to underestimate the time constant values of the rising phase of the currents evoked by glycine concentration ≤ 100 µm.
Physiological significance
When activated by a 1 ms concentration step of glycine, α2 homomeric GlyRs became inefficient in being activated by agonist concentrations ≤ 1 mm, as demonstrated by non-stationary variance analysis. This contrasts with the reported behaviour of α1 homomeric GlyRs (Gentet & Clements, 2002) and of α1/β heteromeric zebrafish GlyRs (Legendre, 1998), the latter being postsynaptically activated. The relatively slow rising phase of the responses evoked by ≤ 1 mm glycine certainly accounts for this inefficiency and is likely to be due to the poor affinity of α2 homomeric GlyRs for glycine. This should render α2 homomeric GlyRs completely inefficient if and/or when postsynaptically located. Indeed, the clearance speed at synapses is in the 0.1 ms range whereas the postulated peak concentration of agonist is supposed to be ≤ 1 mm (Clements, 1996). In such a context, α2 homomeric GlyRs would be efficient at a synapse only in the case of long sustained bursts of synaptic vesicular release with a high intraburst frequency.
The high efficacy of α2 homomeric GlyRs can allow them to respond to a sustained release of a relatively low concentration of neurotransmitters, as observed in the embryo for glycine, GABA and glutamate (LoTurco et al. 1991; Flint et al. 1998; Demarque et al. 2002). Accordingly, α2 homomeric GlyRs, which are known to be expressed prior to synaptogenesis (for review see Legendre, 2001), might be involved in a paracrine function of GlyRs if the concentration of the released agonist is high enough. Such a paracrine function of GlyRs has been observed during cortical development (Flint et al. 1998) and has been suggested to regulate the neuritogenesis of lateral superior olive neurones (Sanes & Hafidi, 1996), of spinal cord neuroblasts (Tapia et al. 2001) and of cerebellar Purkinje neurones (Furuya et al. 2000). A paracrine intercellular communication occurring prior to synapse formation has also been described for other ligand-gated channels and their agonists, e.g. for GABA and glutamate in CA1 hippocampal pyramidal neurones (Demarque et al. 2002) and for GABA in neuronal progenitors of the striatum (Nguyen et al. 2003b).
To our knowledge, the α2 homomeric GlyR is the first example of a ligand-gated ionotropic receptor subtype whose kinetic properties are more adapted to a paracrine neurotransmitter release.
Acknowledgments
This work was supported by INSERM, by CNRS, by an INSERM-Communauté française de Belgique agreement (P. Legendre and J. M. Rigo), by the Belgian Fonds National de la Recherche Scientifique (B. Rogister) and by a PhD grant from the French Foundation pour la recherche médicale (J. M. Mangin). We would like to thank Patricia Ernst-Gengoux for her technical expertise.
J. M. Rigo and P. Legendre contributed equally to this work.
References
- Akagi H, Miledi R. Heterogeneity of glycine receptors and their messenger RNAs in rat brain and spinal cord. Science. 1988;242:270–273. doi: 10.1126/science.2845580. [DOI] [PubMed] [Google Scholar]
- Aldrich RW, Corey DP, Stevens CF. A reinterpretation of mammalian sodium channel gating based on single channel recording. Nature. 1983;306:436–441. doi: 10.1038/306436a0. [DOI] [PubMed] [Google Scholar]
- Beato M, Groot-Kormelink PJ, Colquhoun D, Sivilotti LG. Openings of the rat recombinant alpha 1 homomeric glycine receptor as a function of the number of agonist molecules bound. J Gen Physiol. 2002;119:443–466. doi: 10.1085/jgp.20028530. [DOI] [PMC free article] [PubMed] [Google Scholar]
- Belachew S, Rogister B, Rigo JM, Malgrange B, Mazy-Servais C, Xhauflaire G, Coucke P, Moonen G. Cultured oligodendrocyte progenitors derived from cerebral cortex express a glycine receptor which is pharmacologically distinct from the neuronal isoform. Eur J Neurosci. 1998;10:3556–3564. doi: 10.1046/j.1460-9568.1998.00369.x. [DOI] [PubMed] [Google Scholar]
- Ben-Ari Y. Developing networks play a similar melody. Trends Neurosci. 2001;24:353–360. doi: 10.1016/s0166-2236(00)01813-0. [DOI] [PubMed] [Google Scholar]
- Bormann J, Rundstrom N, Betz H, Langosch D. Residues within transmembrane segment M2 determine chloride conductance of glycine receptor homo- and hetero-oligomers. EMBO J. 1993;12:3729–3737. doi: 10.1002/j.1460-2075.1993.tb06050.x. [DOI] [PMC free article] [PubMed] [Google Scholar]
- Breitinger HG, Becker CM. The inhibitory glycine receptor-simple views of a complicated channel. Chembiochem. 2002;3:1042–1052. doi: 10.1002/1439-7633(20021104)3:11<1042::AID-CBIC1042>3.0.CO;2-7. [DOI] [PubMed] [Google Scholar]
- Burkat PM, Yang J, Gingrich KJ. Dominant gating governing transient GABA(A) receptor activity: a first latency and Po/o analysis. J Neurosci. 2001;21:7026–7036. doi: 10.1523/JNEUROSCI.21-18-07026.2001. [DOI] [PMC free article] [PubMed] [Google Scholar]
- Clements JD. Transmitter timecourse in the synaptic cleft: its role in central synaptic function. Trends Neurosci. 1996;19:163–171. doi: 10.1016/s0166-2236(96)10024-2. [DOI] [PubMed] [Google Scholar]
- Clements JD, Westbrook GL. Activation kinetics reveal the number of glutamate and glycine binding sites on the N-methyl-d-aspartate receptor. Neuron. 1991;7:605–613. doi: 10.1016/0896-6273(91)90373-8. [DOI] [PubMed] [Google Scholar]
- Colquhoun D. Binding, gating, affinity and efficacy: the interpretation of structure-activity relationships for agonists and of the effects of mutating receptors. Br J Pharmacol. 1998;125:924–947. doi: 10.1038/sj.bjp.0702164. [DOI] [PMC free article] [PubMed] [Google Scholar]
- Colquhoun D, Hawkes AG. Desensitization of N-methyl-d-aspartate receptors: a problem of interpretation. Proc Natl Acad Sci U S A. 1995;92:10327–10329. doi: 10.1073/pnas.92.22.10327. [DOI] [PMC free article] [PubMed] [Google Scholar]
- De Saint Jan D, David-Watine B, Korn H, Bregestovski P. Activation of human α1 and α2 homomeric glycine receptors by taurine and GABA. J Physiol. 2001;535:741–755. doi: 10.1111/j.1469-7793.2001.t01-1-00741.x. [DOI] [PMC free article] [PubMed] [Google Scholar]
- Demarque M, Represa A, Becq H, Khalilov I, Ben-Ari Y, Aniksztejn L. Paracrine intercellular communication by a Ca2+- and SNARE-independent release of GABA and glutamate prior to synapse formation. Neuron. 2002;36:1051–1061. doi: 10.1016/s0896-6273(02)01053-x. [DOI] [PubMed] [Google Scholar]
- Flint AC, Liu X, Kriegstein AR. Nonsynaptic glycine receptor activation during early neocortical development. Neuron. 1998;20:43–53. doi: 10.1016/s0896-6273(00)80433-x. [DOI] [PubMed] [Google Scholar]
- Franke C, Hatt H, Dudel J. Liquid filament switch for ultra-fast exchanges of solutions at excised patches of synaptic membrane of crayfish muscle. Neurosci Lett. 1987;77:199–204. doi: 10.1016/0304-3940(87)90586-6. [DOI] [PubMed] [Google Scholar]
- Fucile S, De Saint Jan D, Prado De Carvalho L, Bregestovski P. Fast potentiation of glycine receptor channels of intracellular calcium in neurons and transfected cells. Neuron. 2000;28:571–583. doi: 10.1016/s0896-6273(00)00134-3. [DOI] [PubMed] [Google Scholar]
- Furuya S, Tabata T, Mitoma J, Yamada K, Yamasaki M, Makino A, Yamamoto T, Watanabe M, Kano M, Hirabayashi Y. L-serine and glycine serve as major astroglia-derived trophic factors for cerebellar Purkinje neurons. Proc Natl Acad Sci U S A. 2000;97:11528–11533. doi: 10.1073/pnas.200364497. [DOI] [PMC free article] [PubMed] [Google Scholar]
- Gentet LJ, Clements JD. Binding site stoichiometry and the effects of phosphorylation on human alpha1 homomeric glycine receptors. J Physiol. 2002;544:97–106. doi: 10.1113/jphysiol.2001.015321. [DOI] [PMC free article] [PubMed] [Google Scholar]
- Hamill OP, Marty A, Neher E, Sakmann B, Sigworth FJ. Improved patch-clamp techniques for high-resolution current recording from cells and cell-free membrane patches. Pflugers Arch. 1981;391:85–100. doi: 10.1007/BF00656997. [DOI] [PubMed] [Google Scholar]
- Harty TP, Manis PB. Kinetic analysis of glycine receptor currents in ventral cochlear nucleus. J Neurophysiol. 1998;79:1891–1901. doi: 10.1152/jn.1998.79.4.1891. [DOI] [PubMed] [Google Scholar]
- Horn R. Estimating the number of channels in patch recordings. Biophys J. 1991;60:433–439. doi: 10.1016/S0006-3495(91)82069-0. [DOI] [PMC free article] [PubMed] [Google Scholar]
- Kirsch J, Kuhse J, Betz H. Targeting of glycine receptor subunits to gephyrin-rich domains in transfected human embryonic kidney cells. Mol Cell Neurosci. 1995;6:450–461. doi: 10.1006/mcne.1995.1033. [DOI] [PubMed] [Google Scholar]
- Kneussel M, Betz H. Clustering of inhibitory neurotransmitter receptors at developing postsynaptic sites: the membrane activation model. Trends Neurosci. 2000;23:429–435. doi: 10.1016/s0166-2236(00)01627-1. [DOI] [PubMed] [Google Scholar]
- Legendre P. A reluctant gating mode of glycine receptor channels determines the time course of inhibitory miniature synaptic events in zebrafish hindbrain neurons. J Neurosci. 1998;18:2856–2870. doi: 10.1523/JNEUROSCI.18-08-02856.1998. [DOI] [PMC free article] [PubMed] [Google Scholar]
- Legendre P. The glycinergic inhibitory synapse. Cell Mol Life Sci. 2001;58:760–793. doi: 10.1007/PL00000899. [DOI] [PMC free article] [PubMed] [Google Scholar]
- Lewis TM, Schofield PR, McClellan AM. Kinetic determinants of agonist action at the recombinant human glycine receptor. J Physiol. 2003;549:361–374. doi: 10.1113/jphysiol.2002.037796. [DOI] [PMC free article] [PubMed] [Google Scholar]
- Loturco JJ, Blanton MG, Kriegstein AR. Initial expression and endogenous activation of NMDA channels in early neocortical development. J Neurosci. 1991;11:792–799. doi: 10.1523/JNEUROSCI.11-03-00792.1991. [DOI] [PMC free article] [PubMed] [Google Scholar]
- Malosio ML, Marqueze-Pouey B, Kuhse J, Betz H. Widespread expression of glycine receptor subunit mRNAs in the adult and developing rat brain. EMBO J. 1991;10:2401–2409. doi: 10.1002/j.1460-2075.1991.tb07779.x. [DOI] [PMC free article] [PubMed] [Google Scholar]
- Mangin JM, Guyon A, Eugene D, Paupardin-tritsch D, Legendre P. Functional glycine receptor maturation in the absence of glycinergic input in dopaminergic neurones of the rat substantia nigra. J Physiol. 2002;542:685–697. doi: 10.1113/jphysiol.2002.018978. [DOI] [PMC free article] [PubMed] [Google Scholar]
- Meyer G, Kirsch J, Betz H, Langosch D. Identification of a gephyrin binding motif on the glycine receptor beta subunit. Neuron. 1995;15:563–572. doi: 10.1016/0896-6273(95)90145-0. [DOI] [PubMed] [Google Scholar]
- Mozrzymas JW, Barberis A, Mercik K, Zarnowska ED. Binding sites, singly bound states, and conformation coupling shape GABA-evoked currents. J Neurophysiol. 2003;89:871–883. doi: 10.1152/jn.00951.2002. [DOI] [PubMed] [Google Scholar]
- Nguyen L, Rigo JM, Rocher V, Belachew S, Malgrange B, Rogister B, Leprince P, Moonen G. Neurotransmitters as early signals for central nervous system development. Cell Tissue Res. 2001;305:187–202. doi: 10.1007/s004410000343. [DOI] [PubMed] [Google Scholar]
- Nguyen L, Malgrange B, Belachew S, Rogister B, Rocher V, Moonen G, Rigo JM. Functional glycine receptors are expressed by postnatal nestin-positive neural stem/progenitor cells. Eur J Neurosci. 2002;15:1299–1305. doi: 10.1046/j.1460-9568.2002.01966.x. [DOI] [PubMed] [Google Scholar]
- Nguyen L, Malgrange B, Breuskin I, Bettendorff L, Moonen G, Belachew S, Rigo JM. Autocrine/paracrine activation of the GABA(A) receptor inhibits the proliferation of neurogenic polysialylated neural cell adhesion molecule-positive (PSA-NCAM+) precursor cells from postnatal striatum. J Neurosci. 2003b;23:3278–3294. doi: 10.1523/JNEUROSCI.23-08-03278.2003. [DOI] [PMC free article] [PubMed] [Google Scholar]
- Nguyen L, Malgrange B, Breuskin I, Lallemend F, Hans G, Moonen G, Belachew S, Rigo JM. Striatal PSA-NCAM+ precusor cells from the newborn rat express functional glycine receptors. Neuroreport. 2003a doi: 10.1097/00001756-200403220-00003. (in the press) [DOI] [PubMed] [Google Scholar]
- Pastor A, Chvatal A, Sykova E, Kettenmann H. Glycine- and GABA-activated currents in identified glial cells of the developing rat spinal cord slice. Eur J Neurosci. 1995;7:1188–1198. doi: 10.1111/j.1460-9568.1995.tb01109.x. [DOI] [PubMed] [Google Scholar]
- Reichling DB, Kyrozis A, Wang J, MacDermott AB. Mechanisms of GABA and glycine depolarization-induced calcium transients in rat dorsal horn neurons. J Physiol. 1994;476:411–421. doi: 10.1113/jphysiol.1994.sp020142. [DOI] [PMC free article] [PubMed] [Google Scholar]
- Sanes DH, Hafidi A. Glycinergic transmission regulates dendrite size in organotypic culture. J Neurobiol. 1996;31:503–511. doi: 10.1002/(SICI)1097-4695(199612)31:4<503::AID-NEU9>3.0.CO;2-D. [DOI] [PubMed] [Google Scholar]
- Sigworth FJ. The variance of sodium current fluctuations at the node of Ranvier. J Physiol. 1980;307:97–129. doi: 10.1113/jphysiol.1980.sp013426. [DOI] [PMC free article] [PubMed] [Google Scholar]
- Sigworth FJ, Sine SM. Data transformations for improved display and fitting of single-channel dwell time histograms. Biophys J. 1987;52:1047–1054. doi: 10.1016/S0006-3495(87)83298-8. [DOI] [PMC free article] [PubMed] [Google Scholar]
- Singer JH, Berger AJ. Contribution of single-channel properties to the time course and amplitude variance of quantal glycine currents recorded in rat motoneurons. J Neurophysiol. 1999;81:1608–1616. doi: 10.1152/jn.1999.81.4.1608. [DOI] [PubMed] [Google Scholar]
- Singer JH, Talley EM, Bayliss DA, Berger AJ. Development of glycinergic synaptic transmission to rat brain stem motoneurons. J Neurophysiol. 1998;80:2608–2620. doi: 10.1152/jn.1998.80.5.2608. [DOI] [PubMed] [Google Scholar]
- Suwa H, Saint-Amant L, Triller A, Drapeau P, Legendre P. High-affinity zinc potentiation of inhibitory postsynaptic glycinergic currents in the zebrafish hindbrain. J Neurophysiol. 2001;85:912–925. doi: 10.1152/jn.2001.85.2.912. [DOI] [PubMed] [Google Scholar]
- Takahashi T, Momiyama A, Hirai K, Hishinuma F, Akagi H. Functional correlation of fetal and adult forms of glycine receptors with developmental changes in inhibitory synaptic receptor channels. Neuron. 1992;9:1155–1161. doi: 10.1016/0896-6273(92)90073-m. [DOI] [PubMed] [Google Scholar]
- Tapia JC, Mentis GZ, Navarrete R, Nualart F, Figueroa E, Sanchez A, Aguayo LG. Early expression of glycine and GABA(A) receptors in developing spinal cord neurons. Effects on neurite outgrowth. Neuroscience. 2001;108:493–506. doi: 10.1016/s0306-4522(01)00348-7. [DOI] [PubMed] [Google Scholar]
- Twyman RE, Macdonald RL. Kinetic properties of the glycine receptor main- and sub-conductance states of mouse spinal cord neurones in culture. J Physiol. 1991;435:303–331. doi: 10.1113/jphysiol.1991.sp018512. [DOI] [PMC free article] [PubMed] [Google Scholar]
- Van Zundert B, Alvarez FJ, Yevenes GE, Carcamo JG, Vera JC, Aguayo LG. Glycine receptors involved in synaptic transmission are selectively regulated by the cytoskeleton in mouse spinal neurons. J Neurophysiol. 2002;87:640–644. doi: 10.1152/jn.00455.2001. [DOI] [PubMed] [Google Scholar]
- Virginio C, Cherubini E. Glycine-activated whole cell and single channel currents in rat cerebellar granule cells in culture. Brain Res Dev Brain Res. 1997;98:30–40. doi: 10.1016/s0165-3806(96)00164-2. [DOI] [PubMed] [Google Scholar]