

Abstract
Transcranial magnetic stimulation (TMS) has become a well established procedure for testing and modulating the neuronal excitability of human brain areas, but relatively little is known about the cellular processes induced by this rather coarse stimulus. In a first attempt, we performed extracellular single-unit recordings in the primary visual cortex (area 17) of the anaesthetised and paralysed cat, with the stimulating magnetic field centred at the recording site (2 × 70 mm figure-of-eight coil). The effect of single biphasic TMS pulses, which induce a lateral-to-medial electric current within the occipital pole of the right hemisphere, was tested for spontaneous as well as visually evoked activity. For cat visual cortex we found that a single TMS pulse elicited distinct episodes of enhanced and suppressed activity: in general, a facilitation of activity was found during the first 500 ms, followed thereafter by a suppression of activity lasting up to a few seconds. Strong stimuli exceeding 50 % of maximal stimulator output could also lead to an early suppression of activity during the first 100–200 ms, followed by stronger (rebound) facilitation. Early suppression and facilitation of activity may be related to a more or less direct stimulation of inhibitory and excitatory interneurons, probably with different thresholds. The late, long-lasting suppression is more likely to be related to metabotropic or metabolic processes, or even vascular responses. The time course of facilitation/inhibition may provide clues regarding the action of repetitive TMS application.
Since 1985 (Barker et al. 1985), transcranial magnetic stimulation (TMS) has been the preferred method by which to stimulate cortical tissue in humans because it is not accompanied by painful sensations, as produced with electrical transcranial stimulation (Merton & Morton, 1980). The magnetic field penetrates epicortical structures with little distortion and induces an electric field oriented within the plane of the stimulation coil but with the opposite polarity. In addition to its strength, the orientation of the electric field is critical for the amount of de- or hyperpolarisation of neuronal membranes (Roth et al. 1990; Maccabee et al. 1993, 1998). Compartments of neurons oriented along the electric field, like long-range projecting intracortical axons and axons within the subcortical white matter running parallel to the cortical surface within the gyri, are likely to be more strongly polarised than neuronal profiles that cross the electric field at right angles and those projecting into the depth of a sulcus (Rushton, 1927; Roth et al. 1990; Amassian et al. 1992). This might be a plausible explanation for the phenomenon that motor threshold (the stimulus strength needed to elicit a response within the corticospinal system) is dependent on the direction of the induced current (Brasil-Neto et al. 1992; Mills et al. 1992; Kaneko et al. 1996; Niehaus et al. 2000; Kammer et al. 2001), with a posterior-to-anterior current direction being more effective than any other current direction. A similar observation was made recently for the phosphene threshold when stimulating the human occipital cortex; in that case a preference for lateral-to-medial induced current is evident (Meyer et al. 1991; Kammer et al. 2001). Therefore, we have also chosen this current direction to stimulate the cat visual cortex.
It is reasonable to suggest that a single TMS pulse will induce a distinct temporal sequence of facilitation and suppression at a given cell, which will be related either to direct stimulation of the cell or, more likely in cortical structures, activation of excitatory or inhibitory inputs within the local network. The strength and time course of the evoked activity will depend on the strength of the magnetic stimulus, but may also be affected by the functional state of the network. In a first attempt, we therefore applied single TMS pulses to area 17 of anaesthetised cats while making extracellular recordings of the action potential activity of single cells with and without visual stimulation. Although in humans TMS is more frequently applied to the motor cortex than the visual cortex, we have chosen the cat visual system for our study because we could then apply precisely timed combinations of TMS and visual stimuli to analyse the interaction between TMS and sensory evoked activity at the cortical level.
Methods
General procedures
Under deep anaesthesia induced by a combination of ketamine (20 mg kg−1i.m., Ketanest, Parke-Davies, Germany) and xylazine (2 mg kg−1i.m., Rompun, Bayer, Germany), cats (n = 7) were fixed into position using standard stereotaxic methods. All incisions and pressure points were also locally anaesthetised by xylocaine (2 %, Astra Chemicals, Germany). Craniotomies provided access to area 17 of the right hemisphere for single-unit recording, and to area 18 of the left hemisphere for epidural EEG recording, via a 0.5 mm silver ball electrode. Relaxation to enable artificial ventilation of the lungs was achieved with alcuronium chloride (0.15 mg kg−1 h−1, Alloferin 10, Hoffmann-La Roche, Germany) in 1 % glucose-Ringer solution, infused via the femoral artery. Continuous anaesthesia during recording sessions was achieved by artificial respiration with N2O-O2 (70 %-30 %) and halothane (0.6–2.5 % Fluothane, ICI-Pharma, Germany). Halothane was increased to 2.0 % or more during any potentially painful procedure like handling the contact lenses or performing a new electrode penetration through the dura mater. During the recording sessions the level of anaesthesia was lowered to 0.6–1.0 % halothane to reduce intoxication of the liver during the long-lasting experiments (4–5 days). Blood pressure, heart rate and the EEG were monitored continuously, and the level of anaesthesia was increased (halothane 1.0–2.0 %) when increases in blood pressure or heart rate, or a loss of EEG delta waves signalled distress of the animal. To our knowledge, these procedures are sufficient to prevent the experimental animal from suffering pain.
To maintain the physiological state of the animal, the end-expiratory CO2 was kept almost constant at about 4.0 %, the body temperature was held at 38.5 °C and infections were prevented by application of broad-band antibiotics (Tardomyocel, 0.5 ml i.m.; Chassot, Germany, and Isoptomax, applied topically to the cornea; Alcon Pharma, Germany). Recordings were performed as long as the mean arterial blood pressure was above 90 mmHg. A reduction in blood pressure below the level normally measured close to the end of the experiment could partly be prevented by increasing the vascular volume with Ringer solution. The corneae were protected with zero-power contact lenses and the optics were corrected with spectacle lenses of D = 5–7 for a viewing distance of 56 cm. Atropine sulphate (1 %, Atropin-Pos, Ursapharm, Germany) and phenylephrine hydrochloride (5 %, Neosynephrin-Pos, Ursapharm) were applied topically for mydriasis and retraction of the nictitating membranes. All experimental procedures followed the guidelines of the animal welfare laws, were permitted by the local government (No. 50.8735/81.6) and conform with legal requirements in the UK (Animals (Scientific Procedures) Act, 1986) and the United States.
Recordings and visual stimulation
Single-unit spike activity was recorded from area 17 using either glass micropipettes (about 3 µm outer tip diameter, filled with 3 m KCl) or insulated tungsten electrodes (about 1 MΩ). Electrodes were either lowered vertically into the cortex by moving them through one hole of the figure-of-eight coil, or at an angle of 45 deg tangential to the lower surface of the coil. All recordings were made within area 17 at the top of the gyrus, corresponding to visual field positions around 5 deg inferior and 5 deg lateral to the area centralis. After conventional electronic amplification (Cyberamp 380, Axon Instruments, CA, USA), and filtering (band-pass of 300–3000 Hz), action potentials were separated from noise, converted to +5 V pulses with the aid of a window discriminator and fed to the Spike2 analysis software (Cambridge Electronic Design, UK) via a laboratory interface (Model 1401 plus, Cambridge Electronic Design) with a temporal resolution of 125 µs. Amplification of spike signals was performed in a stepwise manner to avoid saturation of the amplifier. In addition, we sampled the analog EEG signal (amplification × 10 000–20 000, band-pass filtered between 0.1 and 100 Hz) at a rate of 250 Hz, and periods corresponding to sequences of single-unit recordings were stored on hard disc. Noise deriving from the power supply was efficiently reduced with a ‘Hum Bug’ system (Quest Scientific, Canada).
We categorised the neurons into simple and complex cells on the basis of their neuronal responses, the level of spontaneous activity and the spatial overlap of receptive-field subunits responding to bright and dark stimuli. Clearly separate subfield responses or the presence of only one response type (on or off) and a low level of spontaneous activity was interpreted as a simple cell property.
Optimally sized (0.2–0.5 deg × 3–6 deg) and oriented (preferred orientation) bright or dark bars (contrast +33 or −33 %, (100 × (Ibar − Ibackgr)/(Ibar+Ibackgr)) were presented monocularly on a 21 inch (52 cm) colour monitor (Iiyama Vision Master 500) with a refresh rate of 100 Hz. The brightness and spatiotemporal characteristics of the stimuli were controlled by a PC-based visual stimulator (‘Leonardo’ system, Lohmann Research Equipment, Germany). Bars were either flashed on and off within the receptive field of the cortical neuron, or were moved across it at a suitable velocity (see also TMS stimulation protocols).
TMS protocols and data analysis
Single magnetic pulses were generated with a MagStim rapid equipped with two boosters (The Magstim Company, Whitland, Dyfed, UK) and applied to the occipital cortex of cats via a figure-of-eight coil (2 × 70 mm in one plane, The Magstim Company). The midpoint of the coil was centred over area 17 of the right hemisphere. Therefore, the coil was fixed at an angle of about 45 deg behind the cat's head, with the handle of the coil pointing to the left (see Fig. 1). Thus, the first upstroke of the biphasic pulse was carried by current directed to the handle of the coil. Due to a longer time constant, the second phase of the pulse with the opposite current direction more effectively induces an electric current within the cortical tissue, which is in the lateral-to-medial direction within the occipital pole of the right hemisphere in the configuration used. For methodological reasons, neither the position of the coil nor the current direction (by turning the coil) was changed during these experiments. The distance between the outer surface of the coil and the cortical surface was about 10 mm. At this distance, a stimulus of maximal output strength (100 %) produces a peak magnetic field of 1.25 T and an electric field gradient of 375 V m−1. Both values vary proportionally with the percentage of maximal stimulus strength (i.e. 50 % TMS strength will result in a magnetic field of 0.625 T and an electrical field gradient of 187.5 V m−1). Cables connecting the electrode with the probe of the amplifier were placed at right angles to the induced electric field to reduce the amplitude of the stimulus artefact.
Figure 1. Coil position and example of action potential recordings during TMS.
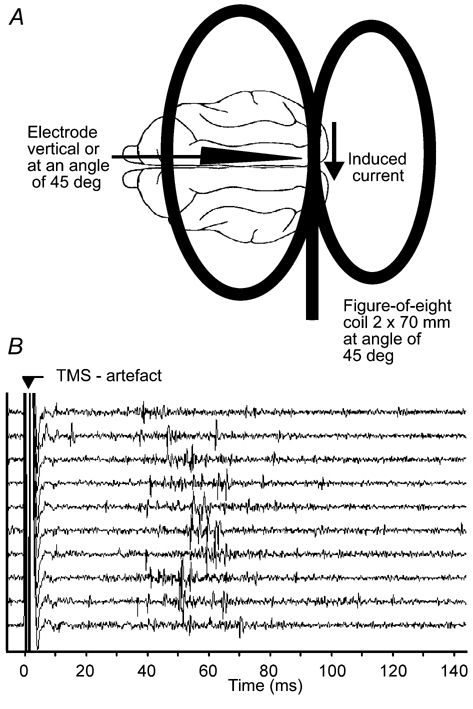
A, sketch showing the position of the figure-of-eight coil (2 × 70 mm) relative to the cat's brain. The coil is tilted by 45 deg in an anterior-posterior direction and the junction of the two coils (where magnetic field is maximal) is placed above area 17/18 of the right hemisphere. Spikes were recorded from area 17 within the centre of the magnetic field. B, analog signal traces of 10 consecutive recordings showing the huge, but short electrical artefact produced by the TMS pulse and extracellularly recorded action potentials.
Two different stimulation protocols were used to test the effect of single pulse TMS on spontaneous and visually evoked activity in cat area 17.
Protocol I
Single pulses were applied at different strengths (20–100 % of maximal strength in steps of 10 %) at an interstimulus interval (ISI) of 6 s during either spontaneous activity of a cell or, if spontaneous activity was too low to detect inhibitory influences, during visually elevated activity. To achieve that, a bright bar was flashed at a frequency of about 2 Hz within the centre of the receptive field of the recorded cell (the flicker frequency was slightly different from 2 Hz to avoided phase-locking with the power supply). The phase of stimulus contrast was also uncorrelated to TMS to achieve an almost constant level of activity in the peristimulus-time histograms (PSTHs) that was similar to spontaneous activity. PSTHs were calculated from 20 stimulus repetitions (trials) and referred to the time point of TMS. This protocol was intended to test the effect of TMS strength on neuronal activity on a long time scale.
Protocol II
Single TMS pulses were applied at different times relative to an evoked visual response. In this case the visual stimulus was a bright or dark bar moving back and forth across the receptive field of the cell within either 1.5 or 3 s, corresponding to a velocity of 16 or 8 deg s−1, respectively (usually 1.5 s trials were used, 3 s only for a few cells that preferred a slow stimulus motion). The time point of TMS was varied systematically, starting with a position at trial onset and then first approaching the first visual response (forward moving bar), hitting the response and then approaching the second visual response (backward motion of the bar) in the same way. This way, up to 16 different time points of TMS were tested for a given cell and because of the explosion of possible combinations, only a limited number of different TMS strengths could be tested in the same cell (10–30 %: n = 39; 40–50 %: n = 48; 60–70 %: n = 28; 80–100 %: n = 7). PSTHs were calculated relative to the onset of visual stimulation (onset of bar motion) and thus the TMS artefact appears at different times within the PSTH and at different positions relative to the visual responses evoked by forward and backward motion of the bar (see Fig. 5). This protocol allowed a better temporal resolution of early excitatory and inhibitory influences evoked by the TMS pulse because of the higher level of activity evoked by a moving bar (on average 82.7 spikes s−1 compared to a mean spontaneous activity rate of 12.8 spikes s−1). In addition, this protocol allowed for a better differentiation of suprathreshold activity elicited by the TMS and facilitating influences on subthreshold visual activity. Therefore, three different stimulation protocols (sweeps) were applied for a given time point of TMS, in an interleaved fashion: (1) visual stimulation alone for the first sweep, (2) combined visual stimulation and TMS for the second sweep and (3) TMS alone for the third sweep. Each protocol was applied 32 times to achieve sufficiently smooth PSTHs. Interleaving these protocols also reduced the otherwise unavoidable effects of changing neuronal responsiveness due to global state changes. To quantify the effect of the TMS on visual activity, the PSTHs obtained from the first sweeps were subtracted from the PSTH obtained from the second sweeps. To distinguish further between activity elicited directly by the TMS pulse (suprathreshold TMS) and facilitated visual activity (TMS subthreshold), we subtracted the PSTH obtained with TMS alone (with correction for spontaneous activity, otherwise spontaneous activity would be subtracted twice).
Figure 5. TMS pulses given at different times relative to the visual response.
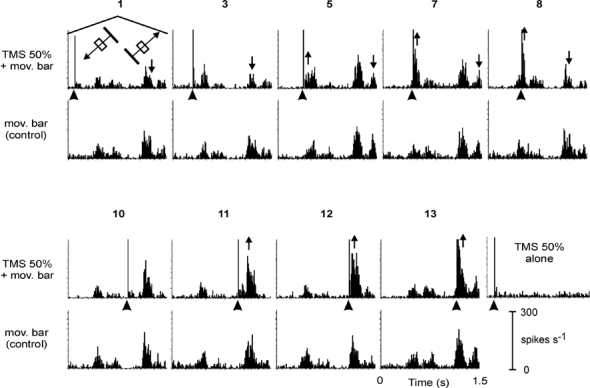
Subset of a series of measurements (nine out of 14) with the TMS pulse given at different times relative to the first and second visual response of a simple cell (depth 1867 µm) to a bright bar crossing its receptive field (mov. bar) in two, opposing directions. Upper rows: combined TMS (arrowheads) and visual stimulation; lower rows: visual stimulation alone (control). No additional activity was evoked by TMS alone (diagram to the right of the lower block). The numbers on top of the diagrams refer to the traces shown in Fig. 6B. Upward- or downward-directed arrows indicate an increase or decrease of visual activity, respectively.
Application of TMS to experimental cats was permitted by our ethics committee and the local government (50.8735/81.6) and is in line with the animal welfare laws. According to safety studies in humans, both of the TMS protocols applied in this study are of very little risk to the animal. When applied to healthy tissue, single pulses applied at ISIs of at least 5 s are safe with regard to prevention of epileptiform activity and long-lasting changes in metabolic and electrical neuronal activity (for an overview see Wassermann, 2002). None of the animals suffered seizures during the experiments.
Results
With suitable steps of signal amplification and filter settings we could avoid an overload of the amplifier and thus reduce the duration of the TMS artefact to allow reliable spike detection about 5–10 ms after TMS onset. Figure 1B shows traces of the analog signal including the TMS artefact and extracellularly recorded action potentials. Figure 1A shows the position and orientation of the coil relative to the cat's brain and the recording site. In total, the effects of TMS on single-unit activity were studied in 85 neurons of cat primary visual cortex with one or both of the two stimulus protocols described in Methods. The sample includes cells of both the simple and complex type distributed over layers 2–6 of the visual cortex. All cells were pooled because we found no significant differences in the TMS effect for cell type and recording depth in this sample.
Protocol I: the effect of TMS on spontaneous activity
With stimulus protocol I we systematically tested the effect of single TMS pulses of different strength on spontaneous activity. In a few cases, when spontaneous activity was very low, a flickering bar was presented to the receptive field of the neuron to elevate activity. The ISI was 6 s to enable the analysis of long-lasting effects. Examples for the effect of single TMS pulses of different strength on spontaneous or visually elevated activity are shown in Fig. 2. Common to all examples is a strong facilitation of spike activity during the first 500 ms for stimuli stronger than 40 % and a subsequent long-lasting suppression of activity, the duration of which increases with stimulus strength. Shorter and earlier episodes of facilitation were also evident with lower stimulus strength (see Fig. 2A and B). Often, an early and strong suppression of activity occurred with TMS strength exceeding 40 %. This suppression had a maximal duration of 200 ms from TMS onset (Fig. 2C and D; sometimes between 50 and 100 ms, Fig. 2B) and seemed to cancel out the early part of facilitation already evoked with lower stimulus strengths. The increased activity following this early suppression may be in part related to rebound excitation as the result of release from inhibition. The sharp peaks in Fig. 2D are very likely be produced by such a rebound process and consist of high-frequency bursts of action potentials. In some cases, as shown in Fig. 2B and C, the episode of facilitation showed multiple peaks of activity, indicating an oscillation of neuronal activity. The peaks occurred at intervals of about 100 ms, corresponding to an oscillatory activity within the EEG alpha range (≈10 Hz). An oscillation within this frequency is known to develop in a visual cortex deprived of sensory input, and thus it is likely that the TMS pulse acts as a phase reset, causing a stronger oscillation thereafter. Trials with different TMS strengths could not be performed in an interleaved manner because stimulator output strength could not be controlled by remote. Therefore, some variations in activity levels between traces result from fluctuations in cell activity over time, which were usually correlated with changes in EEG pattern (arousal state) and are typical for this kind of anaesthesia (Li et al. 1999). This could be one explanation for a discontinuous increase in the strength of facilitation or suppression with increasing TMS strength, including cases where the TMS effect was weaker at a stimulus strength of 90 or 100 % compared to 80 %. On the other hand, there might be a shift in the balance of suppressive and facilitating processes. On average, there was no decline of the TMS effect at high stimulus strength, but probably some saturation at around 80–90 %.
Figure 2. Effect of TMS pulses of different strengths on spontaneous or visually evoked activity.
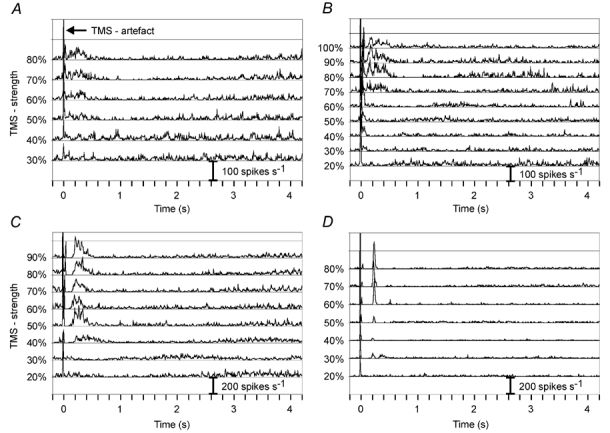
TMS was applied either during spontaneous activity (B-D) or during visually evoked activity by uncorrelated flicker of a bright bar (A). Data from two simple cells are shown in A and D, and from two complex cells in B and C. The cortical recording depths were 777 µm (A), 1100 µm (B), 1427 µm (C) and 185 µm (D). For further explanation see Results.
Figure 3A shows the spontaneous activity averaged for 20 cells. The mean spontaneous activity level prior to the TMS pulse was set to zero to emphasise increased and decreased post-stimulus episodes (black filled areas). Mean (± s.d.) spontaneous activity was 12.8 ± 8.06 spikes s−1 (n = 72 records, range 3.6–40.9 spikes s−1). For cells with very low spontaneous activity (< 3 spikes s−1), a flickering bar stimulus within the receptive field elevated activity to 13.9 ± 8.6 spikes s−1 (n = 47 records, range 4.9–50.1 spikes s−1). The thin line depicts the standard deviation for every data point of the mean spontaneous activity. While moderate stimuli (20–30 %) caused short early facilitation (up to 100 ms) followed by a long-lasting suppression (about 1 s), stronger stimuli (60–100 %) generated sequences of stronger and longer facilitation (up to 500 ms) that were interrupted by an early suppression of activity (100–200 ms). The ensuing late suppression was prolonged (could exceed 5 s). The early suppression was less pronounced in this grand average due to the inclusion of cells with and without early inhibition. Nevertheless, even the standard deviation shows a clear dip at around this time. The very early peak of activity directly following the TMS artefact is in part due to the facilitation of activity, but is also contaminated by a recharge artefact of the MagStim rapid, which occurred at around that time with strong stimuli (70–100 %). This recharge artefact is visible in the upper traces of Fig. 2A-D. Therefore, the very early part of the facilitation was occluded from further quantitative analysis.
Figure 3. Grand average and statistics of TMS effect on spontaneous activity.
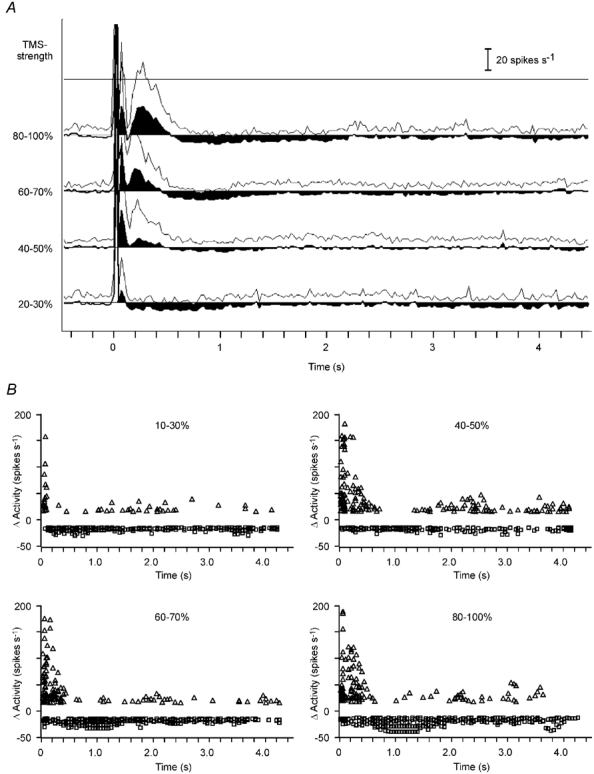
A, grand average of records obtained with different TMS strengths during spontaneous activity. The mean level of spontaneous activity prior to TMS was set to zero to emphasise increases and decreases in activity (black filled areas). The thin line depicts the standard deviation. B, scatter plots showing the strength and time of increase (triangles) and decrease (squares) in activity relative to the pre-TMS level of spontaneous activity. A threshold was set at +15 and −15 spikes s−1, corresponding to two times the standard deviation of spontaneous activity. Data of the same records as those averaged in A are shown for different strengths of TMS pulse. PSTHs (A) and scatter plots (B) were obtained from 20 cells, in only 18 of which was a range of 80–100 % calculated. Total number of records analysed: 10–30 %, 36; 40–50 %, 36; 60–70 %, 37; 80–100 %, 32.
The scatter plots shown in Fig. 3B show the temporal distribution of changes in activity based on measurements of single trials. To include only significant changes, a threshold for changes in activity was set to ± 15 spikes s−1, which is close to two times the standard deviation for spontaneous activity without TMS. It is evident that facilitation prevailed during the first 500 ms from TMS onset (TMS at 0), while the late suppression was almost continuous, but strongest after 500 ms. Facilitation and suppression increased with increasing stimulus strength and the peak of late suppression also shifted from about 0.5 s to about 1.2 s. With a 40–50 % stimulus strength, the late suppression caused less strong reductions in activity, but data points are much more frequent at around 1 s than later. Suppression of activity (in spikes s−1) seems to be weak compared to facilitation, however, it has to be taken into account that spontaneous activity rates were low and spike activity cannot be negative. The data points indicating an increase in activity after about 1 s should not be interpreted as a real excitation. Single bursts of activity occurred during the late suppression or at its termination possibly as a result of a rebound process, but suppression of spontaneous activity prevailed at that time.
Protocol II: the effect of TMS on visually induced activity
In this case a moving bright or dark bar was combined with a single TMS pulse. The moving bar is better suited to stimulate area 17 cells and allows the stimulation of the peripheral and central aspects of the receptive field subsequently, and, when using opposite motion directions, aspects of direction specificity could be studied (but is not a topic of this report because of the small sample of direction-specific cells). Orientation tuning was not investigated systematically because it is too time consuming when different strengths and the timing of the TMS pulse have to be tested. TMS was only tested for bars of optimal orientation. Usually, only three different stimulus strengths were tested for one cell (20–30 %, 40–50 % and 60–70 %; a few cells were tested with 80–100 %) because this stimulus protocol was intended to test primarily the effect of different temporal intervals between TMS and the visual response. Therefore, the TMS pulse was given at different time points during the motion trajectory of the bar stimulus, thus appearing at different times relative to the response induced by the visual stimulus. Initially, the TMS pulse was given at the onset of bar motion, and visual activity followed the TMS pulse by some 100 ms. The temporal difference between TMS and the onset of the visual response was then reduced in a stepwise manner. First, when the temporal interval between TMS and the visual response was large, it was reduced in steps of 100 ms. Closer to the visual response and during it, the steps were reduced to 50 ms and less to achieve a better temporal resolution for effects directly following the TMS. The same procedure was usually performed for both visual responses, those elicited by forward motion of the bar and those evoked by backward motion. Each interval between TMS and the visual response was tested 32 times, and trials with visual stimulation alone, TMS alone and a combination of both were interleaved. This was done to test, by subtraction of the different activities, whether the TMS pulse by itself elicited suprathreshold activity or whether it facilitated subthreshold visual inputs.
Figure 4 and Figure 5 give examples of interactions between TMS and visual activity for two different cells. In a reduced form, Fig. 4 shows only four different situations: pure visual stimulation (A), pure TMS (B) and combined visual stimulation and TMS at different time points of TMS (C and D). Only the response to forward motion of the bar is shown. TMS alone at moderate strength (30 %) evoked only a few action potentials early after the pulse (asterisk, Fig. 4B), as was found for other applications during spontaneous activity. TMS pulses given prior to the visual response caused a facilitation of the visual response within a time window of less than 100 ms from TMS onset (Fig. 4C and D). In both cases the facilitation exceeded the algebraic sum of activity evoked by visual stimulation (Fig. 4A) and TMS alone (Fig. 4B), indicating that subthreshold visual activity had been pushed above threshold. This holds both for the peak response and for the previously weak activity evoked at the periphery of the receptive field (compare Fig. 4A and D, time point indicated by the diamond).
Figure 4. Effect of TMS on visual responses to moving bars.
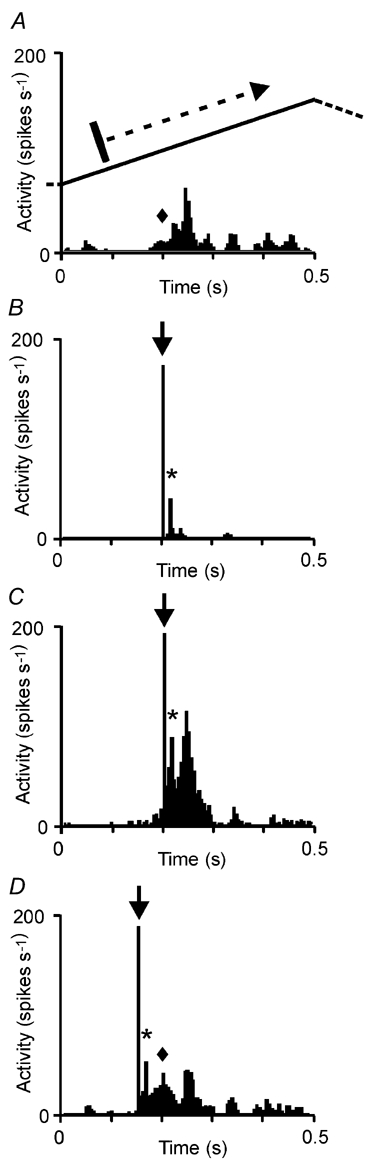
Visual response of a cortical neuron (simple cell) to a bar moving across its receptive field. For simplicity, only the response to one direction of bar motion is shown here (see inset of motion trajectory). A, visual stimulation alone. B, TMS alone. C and D, TMS combined with visual stimulation, with TMS given at two different times. Note that the activity evoked by TMS alone (asterisks) is less than the increase of visual activity during combined TMS and moving bar (see response components labelled with asterisks and diamonds). Arrows indicate the TMS artefact.
Figure 5 shows part of a sequence of different timings (nine out of 14) of the TMS pulse for another cell and for the full stimulus cycle with forward and backward motion of the bar. The upper rows show the mean responses for combined TMS and visual stimulation, the lower rows show the controls with visual stimulation alone. The diagram to the lower right shows the activity after TMS alone; actually no significant change of spontaneous activity is evident in this case. The PSTHs demonstrate two effects that are further quantified in Fig. 6. After a long delay, the TMS pulse inhibited visual activity. In records 1–8 the second visual response (to backward motion) is partly diminished (see downward pointing arrows in Fig. 5). Facilitation of the visual response was achieved when the TMS pulse was given close to the visual response (see upright arrows in diagrams 5, 7, 8, 11, 12 and 13). For this cell, facilitation of visual activity was stronger for the second response, which was the stronger response in the control condition with pure visual stimulation. This might be an indication for a stronger facilitation of activity with more numerous active, but subthreshold, excitatory inputs available for the preferred direction of the stimulus, or the other way round, more numerous inhibitory inputs active for the non-preferred stimulus direction strengthened by TMS. The sample of direction-specific cells tested with the same set of intervals between TMS and response onset, however, is too small to allow any statistically significant conclusions to be drawn.
Figure 6. Effect of TMS presented at different times and at different strengths on visual responses.
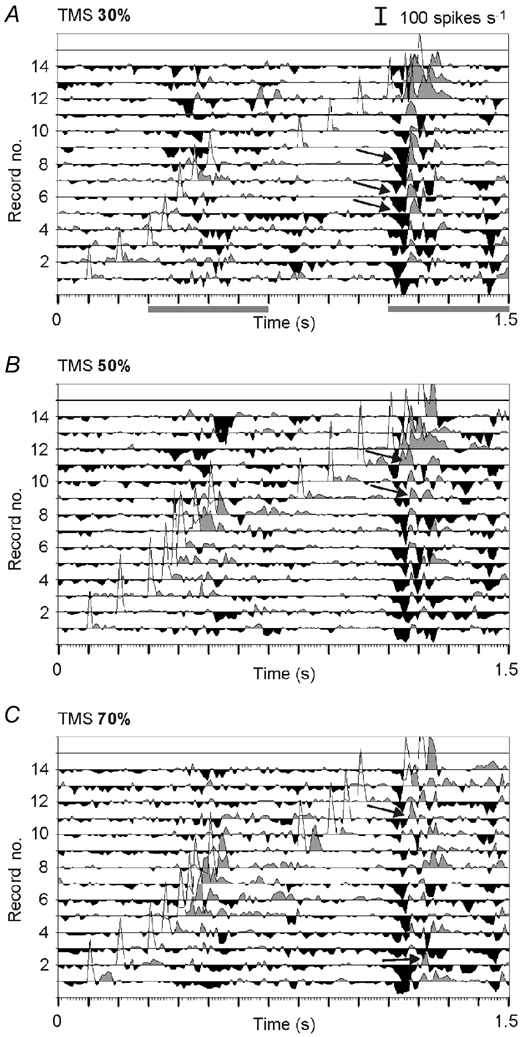
Series of PSTHs showing changes in the visual response amplitude due to TMS pulses of different strengths (A, 30 %; B, 50 %; C, 70 %) applied at different times relative to the visual response (traces 1–14). The diagrams were obtained by subtracting the activity evoked by visual stimulation alone from the activity elicited by combined TMS and visual stimulation. The traces thus show the enhancement (grey areas) and reduction (black areas) of activity caused by the additional TMS (the artefacts appear as unfilled regions). Arrows point to a sequence of suppression and facilitation, possibly resembling a rebound phenomenon. All measurements were performed in the same cell; part of the original PSTHs are shown in Fig. 5. Grey bars below A label episodes of visual activity.
Figure 6 quantifies and summarises all measurements performed with the cell already introduced in Fig. 5. The traces in the diagrams show the difference of activity elicited by combined TMS and visual stimulation compared to visual stimulation alone for TMS tested at 30, 50 and 70 %. For quantification of the TMS effects, we subtracted the activity recorded during TMS application without visual stimulation (not shown here because there was no effect of TMS alone; only the TMS artefact would then be missing). Peaks filled in grey resemble facilitation of the visual responses, those in black show the reduction of visual activity. As already seen in the PSTHs of Fig. 5, facilitation was only found when the TMS pulse was just in front of the visual response (traces 5–9 for the first response and traces 11–14 for the second response), while suppression of the second response was observed when TMS was several hundred milliseconds prior to the visual response (traces 1–9). Late suppression was almost identical for TMS strengths of 30, 50 and 70 %, but facilitation of the first visual response increased with TMS strength. A suppression of activity during the first visual response is also visible in the upper traces of the diagrams (9–14), although the TMS pulse followed. This is an indication that the TMS pulse given in the previous trial still had a suppressive effect, lasting even for 5–6 s. The visual response itself is not visible in these traces because only the changes are shown, and these were strongest during the visual response. An indication of the time during which the visually elevated activity occurred is indicated by the grey bars below Fig. 6A).
The short peaks of suppression (black) in the traces of Fig. 6 could further raise the illusion that suppression occurred only at distinct times after TMS. This is related to the fact that considerable reduction (and enhancement) of activity can only occur at the time of visually induced activity. The level of spontaneous activity before and after the visual response was too low to allow a considerable reduction of activity (there is nothing to reduce) and no subthreshold visual inputs are available to be pushed above spike threshold. Visually induced responses had amplitudes between 27.4 and 172.3 spikes s−1 (mean 82.7 ± 29.2 spikes s−1, n = 48 cells). To get a better impression of the time course of facilitation and suppression, we plotted all changes in visual activity exceeding ± 50 spikes s−1 for all records obtained with different time points of TMS, and aligned the time axis to TMS onset (time 0). The scatter plots shown in Fig. 7 show the data obtained from 48 cells, grouped in four ranges of TMS strength. The complete set of TMS strength could not be tested for every cell, and some settings were tested twice and included in the sample (20–30 %: 39 cells 290 records; 40–50 %: 48 cells, 256 records; 60–70 %: 28 cells, 99 records; 80–100 %: 7 cells, 14 records). Similar to the scatter plots shown for the spontaneous activity, visually induced activity was also facilitated up to 500 ms following the TMS pulse, with the strongest facilitation occurring during the first 200 ms. Early suppression occurs preferentially at around 100 ms post-TMS, while late (long-lasting) suppression peaks at around 1 s. Only a few measurements were made with 80–100 % TMS, but these also show early facilitation and late suppression of visual activity. However, because of the small sample size, a real quantification for this range of TMS strength is impossible.
Figure 7. Statistics for the effect of TMS on the visual responses evoked by a moving bar stimulus.
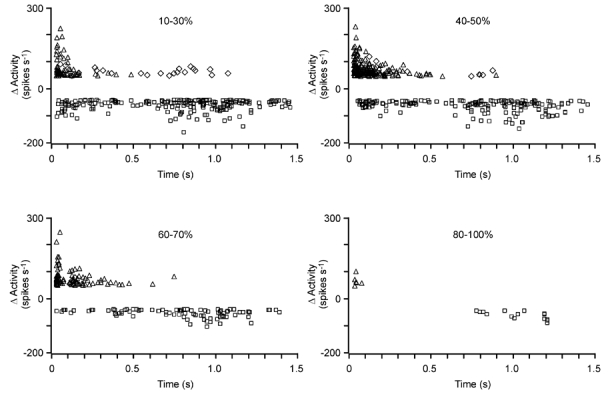
For individual measurements, the scatter plots show the strength and time of changes in activity elicited by single TMS pulses of different strengths (20–30 %: 39 cells, 290 records; 40–50 %: 48 cells, 256 records; 60–70 %: 28 cells, 99 records; 80–100 %: seven cells, 14 records). The time axis is aligned to TMS onset and the threshold for changes in activity was set to ± 50 spikes s−1. Facilitation following a suppression within 60 ms (rebound) is shown by diamonds. Facilitation missing a preceding suppression is shown with triangles. Squares are used to plot the suppression of activity.
Some increase of activity was also found later than 500 ms relative to TMS onset; however, this facilitation was usually accompanied by a preceding suppression (see arrows in Fig. 6) and may be the result of a rebound process. Therefore, we distinguished between facilitation with and without a preceding suppression: the diamonds in Fig. 7 indicate a rise in activity following a drop in activity within 60 ms, while the triangles label facilitation without preceding suppression. The diamonds are largely found at long delays, between 200 and 1200 ms, indicating that rebound responses occurred primarily with inhibition during the long-latency suppression of activity. At short delays, facilitation of activity without preceding suppression dominates in the scatter plots of Fig. 7.
Discussion
Methodical aspects and limitations
To our knowledge this is the first experimental study to employ extracellular single-unit recording within the centre of TMS. The intention of this initial study was the analysis of the effect of a single TMS pulse on spontaneous and evoked activity. We have chosen the visual system for our approach to enable precisely timed combinations of single TMS pulses with sensory stimuli and the resulting evoked responses. Comparable studies have been performed in the field of human visual perception (Kammer & Nusseck, 1998; Corthout et al. 1999; Paulus et al. 1999). With appropriate amplifier and filter settings, a blockade and ringing of the amplifier due to overload could be avoided, thereby reducing the duration of the electrical artefact produced by the magnetic pulse and allowing for reliable action potential detection about 5–10 ms following TMS onset. It would be ideal if one could blank out the artefact altogether, however neither commercial nor self-designed systems were found that were suitable for combination with high-impedance single-unit recordings. Analysing the first 10 ms after TMS onset would allow for a better distinction between direct or transsynaptic excitation of a cell.
Another limiting factor for interpreting our data is the anaesthesia of the experimental cat. It has been shown that up to 80 % N2O in O2 has little effect on cortical activity in the cat (Ikeda & Wright, 1974) and is considered to be insufficient to maintain anaesthesia in cats if not supplemented by additional anaesthetics (Hammond, 1978). Adding halothane or isofluorane to N2O is a standard inhalation anaesthesia for recording cortical activity in cat and has been reported to have moderate suppressive effects on visual responses in both cat and monkey (Ikeda & Wright, 1974; Tigwell & Sauter, 1992). Nevertheless, anaesthetics of this kind are thought to weaken excitatory synaptic transmission in favour of strengthened inhibitory actions due to enhanced GABAA receptor-mediated Cl− currents and increased K+ outflux (Krnjevic, 1992). It is thus reasonable to assume that spontaneous and TMS-induced excitatory synaptic action may be weakened compared to inhibitory actions. The effect of anaesthesia on TMS-induced activity has been investigated primarily in studies of motor-evoked potentials (MEPs) in humans. While it appears that N2O has relatively little effect on myogenic responses when administered alone, it has been shown that addition of isofluorane or halothane strongly reduces muscle potentials (for review see Gugino et al. 2002). A study in cat, however, showed that it is primarily the myogenic response that is reduced; spinal potentials are little affected by these anaesthetics (Yamada et al. 1994). In primates, a N2O-methohexital anaesthesia had little effect on the transmission of motor and sensory potentials (Ghaly et al. 1999), but isofluorane had a depressive action on spinal motor potentials (Baker et al. 1994). Little is known about the action of anaesthetics on TMS-evoked activity in the sensory cortices, but we expect similar consequences as with visually evoked activity.
The electric field induced by the magnetic field is on average about 200 V m−1 along its main orientation, which corresponds to 2 mV (10 µm)−1. A neuronal process has to be sufficiently elongated in the direction of the electric field to be depolarised to the spike threshold. It has been proposed that curved axons travelling some distance in a horizontal direction are the most likely structures to be excited (Amassian et al. 1992; Maccabee et al. 1993). This, for example, holds for axons within the subcortical white matter and for horizontally projecting axons within the layers. Another structure likely to be stimulated by moderate stimulation is the axon terminal, resulting in increased transmitter release. Consequently, neurons with horizontal intracortical projections are more likely to be stimulated than neurons sending their axons down the white matter to subcortical targets. Studies involving stimulation of the human motor cortex (Amassian et al. 1987; Brasil-Neto et al. 1992; Mills et al. 1992; Kaneko et al. 1996; Sakai et al. 1997) have shown that direct excitation of the cells of origin of the pyramidal tract, as measured with MEPs of peripheral nerves or muscles, is dependent on magnetic field orientation. A lateral-to-medial induced current oriented almost parallel to the central gyrus preferentially evokes a direct volley of excitation in the corticospinal pathway, the so-called ‘D-wave’ (Patton & Amassian, 1954), while a posterior-anterior direction of induced current flow is more likely to evoke a sequence of volleys at intervals around 1.5 ms (600–650 Hz). These ‘I-waves’ (Patton & Amassian, 1954) are thought to result from the activation of a chain of interneurons (Di Lazzaro et al. 1998; for review see Ziemann & Rothwell, 2000). Several studies using either pharmacological blockade of ion conductance (Hicks et al. 1992; Ziemann et al. 1998b) or paired-pulse protocols (Ziemann et al. 1996, 1998b; for review see Rothwell, 1996, and Ziemann & Rothwell, 2000) support the hypothesis of a predominant activation of intracortical circuits by TMS.
Some characteristics of the human motor cortex seem to be similar to those of the visual cortex, while others may be specific for the motor cortex. For example, the threshold for eliciting phosphene sensations in humans is dependent on the direction of the induced current and is lowest for a lateral-to-medial current flow in the occipital lobe (Meyer et al. 1991; Kammer et al. 2001). On the other hand, activity patterns similar to I-waves or signs of intracortical inhibition as elicited with paired TMS pulses of less than 5 ms intervals (subthreshold pre-pulse and suprathreshold test pulse) have not been observed for the human visual cortex (Dambeck et al. 2003; T. Kammer, personal communication). In part, this may be a consequence not only of the different systems investigated (motor vs. sensory system), but also because of differing analysis of the response/output systems (MEPs vs. sensations).
Summary of findings
In general, a single TMS pulse enhanced spontaneous and visually evoked activity during the first 500 ms, while it suppressed it thereafter for up to a few seconds. The early phase of facilitation was more variable than the late suppression. It varied with stimulus strength, but also from cell to cell. In general, weak stimuli (< 50 %) caused an early facilitation up to 200 ms after TMS onset, followed by a late inhibition. Stronger stimuli increasingly evoked an early suppression of activity for 100–200 ms, followed by a delayed, prolonged and increased facilitation of spontaneous and visual activity (up to 500 ms) and terminating in the late inhibition. Often, facilitation evoked by strong TMS in the absence of visual stimulation had multiple peaks of activity separated by about 100 ms, pointing to an oscillation of excitation and inhibition at about 10 Hz. A relationship between TMS-evoked patterns of activity and cell type or cortical depth has not been established so far.
Relationship to findings in the human motor and visual cortex
How can we relate our findings to those obtained in the human motor system and visual cortex? As already mentioned, the duration of the stimulus artefact prevents any analysis of the first 10 ms, possibly including a direct excitation of the cell or correlates of I-waves. The early suppression of spontaneous and visually induced activity lasting for 50–100 ms seems to have corresponding events in the human motor and visual cortex: (1) in MEP recordings, a ‘silent period’ (SP) is found, which follows the initial activation of the corticospinal system (Kujirai et al. 1993) and which has a similar latency and duration as the early inhibition described by us; (2) using paired-pulse TMS, a so-called ‘long ISI intracortical inhibition’ (Sanger et al. 2001) has been described that also peaks around 100 ms (50–200 ms, Valls-Soléet al. 1992; Wassermann et al. 1996) and may be a sign for a cortical origin of the SP; (3) suppression of visual perception (artificial scotoma; Corthout et al. 1999; elevation of contrast threshold) is maximal if TMS is applied 20–90 ms (Paulus et al. 1999) or 40–200 ms (Kammer & Nusseck, 1998) after a visual test stimulus. Taking into account a latency of 30–50 ms for transmission from the retina to the cortex, the cortically evoked response would fall into the early suppressive episode.
Intracortical inhibition (McCormick, 1989) may be one reason for an enhanced perception threshold, but increased background activity (noise) due to TMS may also account for the raised detection threshold (Kammer & Nusseck, 1998). In the present study we found facilitation of activity within the first 500 ms following TMS. Moderate stimuli (< 50 %) caused an early enhancement of spontaneous activity (up to 200 ms), while stronger stimuli first elicited the suppression but thereafter a strong facilitation. It is likely that excitatory processes are also initiated by stronger stimuli, but are cancelled by the simultaneous activation of inhibitory processes. However, facilitation of activity may prevail at some distance from the centre of the magnetic field, leading to enhanced noise. It is thus likely that even facilitation of activity following TMS by some 100 ms may raise the perception threshold.
Otherwise, facilitation of activity peaking at around 200–500 ms, as found for the episode following the early inhibition, has not been reported in the literature. This would coincide with recovery of the SP and may produce another excitatory volley if stimulation is applied at frequencies higher than 1 Hz (see below), but a remarkable rebound excitation has not been reported so far. In the case of the visual system, phosphenes can be elicited with stimulus intensities somewhat lower than those causing elevated perception thresholds (Kastner et al. 1998; Kammer, 1999). Phosphenes might be related to direct excitation of cells or an early excitatory volley from local interneurons, comparable with early facilitation found in the present study with moderate stimuli. However, a corollary rebound activity following early inhibition can also be taken into account. Testing the latency of phosphene perception may yield an answer. On the other hand, it is possible that due to the smaller dimensions of cortical areas in cat, the magnetic stimulus may have also stimulated visual areas close to area 17 (e.g. area 18 of the same hemisphere and area 17 of the opposite hemisphere). Top-down activation of area 17 from ‘higher order’ cortices may lead to a stronger and prolonged activity than would be elicited in the human visual cortex. However, even with stimulation of the much larger occipital cortex in humans, it is possible that visual areas V1, V2 and V3 will be co-stimulated because V1 is hidden in the calcarine sulcus (Kammer et al. 2001).
In some cases we found multiple peaks of activity during the facilitating episode. The interval between peaks was close to 100 ms, indicating that a 10 Hz alpha rhythm has been induced. It is well known that when the visual cortex is deprived of sensory input (eyes closed) it develops an enhanced alpha rhythm. In our study, the cat was in a dimmed room and no, or only small stimuli were presented. Thus, we can assume that the visual cortex was partially deprived of sensory input and was therefore likely to have developed an alpha rhythm. A similar observation was made after single TMS pulses were applied to the human motor cortex. In this case, increased synchronous activity was found in the beta-range of the EEG (Paus et al. 2001). Results from EEG studies with repetitive TMS are somewhat controversial. Using 10 Hz repetitive application TMS (rTMS), which is thought to enhance cortical excitability, Jing & Takigawa (2000) have shown increased synchronisation of alpha activity within and between hemispheres for the frontal and parietal cortical areas. Strens et al. (2002) found increased synchronisation within the alpha frequency range for the motor cortex when using a dampening low-frequency rTMS (1 Hz). On the other hand, Thut and co-workers (2003) reported desynchronisation of alpha activity with low-frequency rTMS (1 Hz) applied to the visual cortex. Different from the studies mentioned above, these authors analysed visually evoked alpha activity but not the resting state. Differences with regard to the architecture and connectivity of these cortical areas may also be relevant.
The most surprising finding is the late and long-lasting suppression of activity following a single TMS pulse. A possible origin for this late suppression could be another long-loop feedback process, but with a duration of up to several seconds a conventional (ionotropic) transmission of activity is unlikely. Alternatively, activation of inhibitory neurons is dispersed over time due to cycling of activity (oscillations) or to long-lasting depolarisation of fast-spiking neurons. The latter could be achieved by slow cellular second-messenger systems following activation of GABAB or metabotropic glutamate receptors (McCormick, 1989; Reid & Daw, 1997). In addition, it has to be taken into consideration that the artificial stimulation of the cortical network will lead to activity patterns very different from those that occur during natural activation. A synchronous activation of a large number of neurons may also have metabolic consequences, changing the perineuronal milieu and triggering a vascular response. So far this has been documented only for rTMS (Paus et al. 1998; Pecuch et al. 2000).
Relationship to rTMS
rTMS with repetition rates equal to or less than 1 s−1 have been reported to yield a long-lasting (up to hours) reduction of cortical excitability (Chen et al. 1997), while higher repetition rates (5–30 Hz) raise cortical excitability (Pascual-Leone et al. 1994; Chen et al. 1997; Berardelli et al. 1998; Maeda et al. 2000; Wu et al. 2000; Gangitano et al. 2002). It has been assumed that rTMS may modulate synaptic strength (Wang et al. 1996), comparable to long-term potentiation or long-term depression. Long-term changes in metabolic states (including blood circulation) are also likely to occur (Paus et al. 1998; Bohning et al. 1999; Pecuch et al. 2000; Siebner et al. 2000). Therefore, rTMS has become an option for treating neurological and psychiatric disorders by counterbalancing cortical excitability. So far we have not tested the effect of rTMS on single-unit responses, but our results obtained with single-pulse TMS allow us to draw some conclusions. The facilitation of neuronal activity prevails during the first 500 ms after TMS, thereafter a long-lasting suppression sets in. Thus, if the effects of rTMS are related to the activity patterns evoked, TMS applied at 2 Hz or at a higher frequency will evoke primarily facilitation of activity and might block or reduce the late suppression with the subsequent stimulus. When repeated for some time, the mechanisms involved in facilitation may be strengthened, while those related to suppression may be weakened. On the other hand, stimulus intervals of 1 s or longer will favour the long-lasting suppression and might have the opposite effect.
Concluding remarks
In summary, we found that a single TMS pulse applied to the cat visual cortex can elicit both the facilitation and suppression of spontaneous and visual activity. Facilitation prevails during the first 200–500 ms, while suppression dominates thereafter. Strong stimuli also induce an early suppression of activity (50–100 ms) and an increased but delayed facilitation. It is likely that suppression of activity is the result of activated local inhibitory circuits. The nature of this inhibition is not known and will probably be the aim of future studies. The early suppression coincides with suppression of motor activity and visual perception in humans, the late suppression (up to seconds) found in cat visual cortex may be less well investigated in human studies, either too weak to be detected in humans, or artificially increased by anaesthesia in the cat (see above). The capability of recording single-unit activity in the centre of TMS opens the door to further studies, like the application of paired pulses and the interaction with neuroactive substances. Future approaches may also evaluate the potential of TMS (or rTMS) to support ‘plastic’ changes of the neuronal networks related to synaptic plasticity (Ziemann et al. 1998a), as will be involved in perceptional learning and the post-lesion recovery of function.
Acknowledgments
We would like to thank Dimitrula Winkler for assistance during the experiments, Dr Martin Tegenthoff for providing a magnetic stimulator and Dr Thomas Kammer for expert discussion and help with the manuscript.
References
- Amassian VE, Eberle L, Maccabee PJ, Cracco RQ. Modelling magnetic coil excitation of human cerebral cortex with a peripheral nerve immersed in a brain-shaped volume conductor: the significance of fiber bending in excitation. Electroencephalogr Clin Neurophysiol. 1992;85:291–301. doi: 10.1016/0168-5597(92)90105-k. [DOI] [PubMed] [Google Scholar]
- Amassian VE, Steward M, Quirk GJ, Rosenthal JL. Physiological basis of motor effects of a transient stimulus to cerebral cortex. Neurosurgery. 1987;20:74–93. [PubMed] [Google Scholar]
- Baker SN, Olivier E, Lemon RN. Recording an identified pyramidal volley evoked by transcranial magnetic stimulation in a conscious macaque monkey. Exp Brain Res. 1994;99:529–532. doi: 10.1007/BF00228989. [DOI] [PubMed] [Google Scholar]
- Barker AT, Jalinous R, Freeston IL. Non-invasive magnetic stimulation of human motor cortex. Lancet. 1985;1:1106–1107. doi: 10.1016/s0140-6736(85)92413-4. [DOI] [PubMed] [Google Scholar]
- Berardelli A, Inghilleri M, Rothwell JC, Romeo S, Curra A, Gilio F, Modugno N, Manfredi M. Facilitation of muscle evoked responses after repetitive cortical stimulation in man. Exp Brain Res. 1998;122:79–84. doi: 10.1007/s002210050493. [DOI] [PubMed] [Google Scholar]
- Bohning DE, Shastri A, McConnell KA, Nahas Z, Lorberbaum JP, Roberts DR, Teneback C, Vincent DJ, George MS. A combined TMS/fMRI study of intensity-dependent TMS over motor cortex. Biol Psychiatry. 1999;45:385–394. doi: 10.1016/s0006-3223(98)00368-0. [DOI] [PubMed] [Google Scholar]
- Brasil-Neto JP, Cohen LG, Panizza M, Nilsson J, Roth BJ, Hallett M. Optimal focal transcranial magnetic activation of the human motor cortex: effects of coil orientation, shape of induced current pulse, and stimulus intensity. J Clin Neurophysiol. 1992;9:132–136. [PubMed] [Google Scholar]
- Chen R, Classen J, Gerloff C, Celnik P, Wassermann EM, Hallett M, Cohen LG. Depression of motor cortex excitability by low-frequency transcranial magnetic stimulation. Neurology. 1997;48:1398–1403. doi: 10.1212/wnl.48.5.1398. [DOI] [PubMed] [Google Scholar]
- Corthout E, Uttl B, Walsh V, Hallett M, Cowey A. Timing of activity in early visual cortex as revealed by transcranial magnetic stimulation. Neuroreport. 1999;10:2631–2634. doi: 10.1097/00001756-199908200-00035. [DOI] [PubMed] [Google Scholar]
- Dambeck N, Stock K, Weidemann J, Meister IG, Foltys H, Boroojerdi B. Investigating phosphene elicitation with the paired-pulse paradigm. Proceedings of the 29th Neurobiology Conference & 5th Conference of the German Neuroscience Society. 2003. p. S528.
- Di Lazzaro V, Restuccia D, Oliviero A, Profice P, Ferrara L, Insola A, Mazzone P, Tonali P, Rothwell JC. Magnetic transcranial stimulation at intensities below active motor threshold activates inhibitory circuits. Exp Brain Res. 1998;119:265–268. doi: 10.1007/s002210050341. [DOI] [PubMed] [Google Scholar]
- Gangitano M, Valero-Cabre A, Tormos JM, Mottaghy FM, Romero JR, Pascual-Leone A. Modulation of input-output curves by low and high frequency repetitive transcranial magnetic stimulation of the motor cortex. Clin Neurophysiol. 2002;113:1249–1257. doi: 10.1016/s1388-2457(02)00109-8. [DOI] [PubMed] [Google Scholar]
- Ghaly RF, Stone JL, Lee JJ, Ham JH, Levy WJ. Monitoring spinal cord motor and somatosensory evoked potentials in anaesthetised primates. Neurol Res. 1999;21:359–367. doi: 10.1080/01616412.1999.11740944. [DOI] [PubMed] [Google Scholar]
- Gugino LD, Aglio LS, Gonzalez AA. Intraoperative spinal cord motor path monitoring. In: Pascual-Leone A, Davey NJ, Rothwell J, Wassermann EM, Puri BK, editors. Handbook of Transcranial Magnetic Stimulation. New York: Oxford University Press; 2002. pp. 198–210. [Google Scholar]
- Hammond P. Inadequacy of nitrous oxide/oxygen mixtures for maintaining anaesthesia in cats: satisfactory alternatives. Pain. 1978;5:143–151. doi: 10.1016/0304-3959(78)90036-2. [DOI] [PubMed] [Google Scholar]
- Hicks R, Burke D, Stephen J, Woodforth I, Crawford M. Corticospinal volleys evoked by electrical stimulation of human motor cortex after withdrawal of volatile anesthetics. J Physiol. 1992;456:393–404. doi: 10.1113/jphysiol.1992.sp019342. [DOI] [PMC free article] [PubMed] [Google Scholar]
- Ikeda H, Wright MJ. Sensitivity of neurons in visual cortex (area 17) under different levels of anaesthesia. Exp Brain Res. 1974;20:471–484. doi: 10.1007/BF00238014. [DOI] [PubMed] [Google Scholar]
- Jing H, Takigawa M. Observation of EEG coherence after repetitive transcranial magnetic stimulation. Clin Neurophysiol. 2000;111:1620–1631. doi: 10.1016/s1388-2457(00)00357-6. [DOI] [PubMed] [Google Scholar]
- Kammer T. Phosphenes and transient scotomas induced by magnetic stimulation of the occipital lobe: their topographic relationship. Neuropsychologia. 1999;37:191–198. doi: 10.1016/s0028-3932(98)00093-1. [DOI] [PubMed] [Google Scholar]
- Kammer T, Beck S, Erb M, Grodd W. The influence of current direction on phosphene thresholds evoked by transcranial magnetic stimulation. Clin Neurophysiol. 2001;112:2015–2021. doi: 10.1016/s1388-2457(01)00673-3. [DOI] [PubMed] [Google Scholar]
- Kammer T, Nusseck HG. Are recognition deficits following occipital lobe TMS explained by raised detection thresholds? Neuropsychologia. 1998;36:1161–1166. doi: 10.1016/s0028-3932(98)00003-7. [DOI] [PubMed] [Google Scholar]
- Kastner S, Paul I, Ziemann U. Transient visual field defects induced by transcranial magnetic stimulation over the occipital lobe. Exp Brain Res. 1998;118:19–26. doi: 10.1007/s002210050251. [DOI] [PubMed] [Google Scholar]
- Krnjevic K. Cellular and synaptic actions of general anaesthetics. Gen Pharmacol. 1992;23:965–975. doi: 10.1016/0306-3623(92)90274-n. [DOI] [PubMed] [Google Scholar]
- Kurjirai T, Caramia MD, Rothwell JC, Day BL, Thompson PD, Ferbert A, Wroe S, Asselman P, Marsden CD. Corticocortical inhibition in human motor cortex. J Physiol. 1993;471:501–519. doi: 10.1113/jphysiol.1993.sp019912. [DOI] [PMC free article] [PubMed] [Google Scholar]
- Li B, Funke K, Wörgötter F, Eysel UT. Correlated variations in EEG pattern and visual responsiveness of cat lateral geniculate relay cells. J Physiol. 1999;514:857–874. doi: 10.1111/j.1469-7793.1999.857ad.x. [DOI] [PMC free article] [PubMed] [Google Scholar]
- Maccabee PJ, Amassian VE, Eberle LP, Cracco RQ. Magnetic coil stimulation of straight and bent amphibian and mammalian peripheral nerve in vitro: locus of excitation. J Physiol. 1993;460:201–219. doi: 10.1113/jphysiol.1993.sp019467. [DOI] [PMC free article] [PubMed] [Google Scholar]
- Maccabee PJ, Nagarajan SS, Amassian VE, Durand DM, Szabo AZ, Ahad AB, Cracco RQ, Lai KS, Eberle LP. Influence of pulse sequence, polarity and amplitude on magnetic stimulation of human and porcine peripheral nerve. J Physiol. 1998;513:571–585. doi: 10.1111/j.1469-7793.1998.571bb.x. [DOI] [PMC free article] [PubMed] [Google Scholar]
- McCormick DA. GABA as an inhibitory transmitter in human cerebral cortex. J Neurophysiol. 1989;62:1018–1027. doi: 10.1152/jn.1989.62.5.1018. [DOI] [PubMed] [Google Scholar]
- Maeda F, Keenan JP, Tormos JM, Topka H, Pascual-Leone A. Modulation of corticospinal excitability by repetitive transcranial magnetic stimulation. Clin Neurophysiol. 2000;111:800–805. doi: 10.1016/s1388-2457(99)00323-5. [DOI] [PubMed] [Google Scholar]
- Merton PA, Morton HB. Stimulation of the cerebral cortex in the intact human brain. Nature. 1980;285:227. doi: 10.1038/285227a0. [DOI] [PubMed] [Google Scholar]
- Meyer BU, Diehl RR, Steinmetz H, Britton DC, Benecke R. Magnetic stimuli applied over motor cortex and visual cortex: influence of coil position and field polarity on motor responses, phosphenes and eye movements. Electroencephalogr Clin Neurophysiol. 1991;43:121–134. [PubMed] [Google Scholar]
- Mills KR, Boniface SJ, Schubert M. Magnetic brain stimulation with a double coil: the importance of coil orientation. Electroencephalogr Clin Neurophysiol. 1992;85:17–21. doi: 10.1016/0168-5597(92)90096-t. [DOI] [PubMed] [Google Scholar]
- Niehaus L, Meyer BU, Weyh T. Influence of pulse configuration and direction of coil current on excitatory effects of magnetic motor cortex and nerve stimulation. Clin Neurophysiol. 2000;111:75–80. doi: 10.1016/s1388-2457(99)00198-4. [DOI] [PubMed] [Google Scholar]
- Pascual-Leone A, Valls-Sole J, Wassermann EM, Hallett M. Responses to rapid-rate transcranial magnetic stimulation of the human motor cortex. Brain. 1994;117:847–858. doi: 10.1093/brain/117.4.847. [DOI] [PubMed] [Google Scholar]
- Patton HD, Amassian VE. Single- and multi-unit analysis of cortical stage of pyramidal tract activation. J Neurophysiol. 1954;17:345–363. doi: 10.1152/jn.1954.17.4.345. [DOI] [PubMed] [Google Scholar]
- Paulus W, Korinth S, Wischer S, Tergau F. Differential inhibition of cromatic and acromatic perception by transcranial magnetic stimulation of the human visual cortex. Neuroreport. 1999;10:1245–1248. doi: 10.1097/00001756-199904260-00017. [DOI] [PubMed] [Google Scholar]
- Paus T, Jech R, Thompson CJ, Comeau R, Peters T, Evans AC. Dose-dependent reduction of cerebral blood-flow during rapid-rate transcranial magnetic stimulation of the human sensorimotor cortex. J Neurophysiol. 1998;79:1102–1107. doi: 10.1152/jn.1998.79.2.1102. [DOI] [PubMed] [Google Scholar]
- Paus T, Sipila PK, Strafella AP. Synchronization of neuronal activity in the human primary motor cortex by transcranial magnetic stimulation: an EEG study. J Neurophysiol. 2001;86:1983–1990. doi: 10.1152/jn.2001.86.4.1983. [DOI] [PubMed] [Google Scholar]
- Pecuch PW, Evers S, Folkerts HW, Michael N, Arolt V. The cerebral hemodynamics of repetitive transcranial magnetic stimulation. Eur Arch Psychol Clin Neurosci. 2000;250:320–324. doi: 10.1007/s004060070007. [DOI] [PubMed] [Google Scholar]
- Reid SNM, Daw NW. Activation of metabotropic glutamate receptors has different effects in different layers of cat visual cortex. Vis Neurosci. 1997;14:83–88. doi: 10.1017/s0952523800008786. [DOI] [PubMed] [Google Scholar]
- Roth BJ, Cohen LG, Hallett M, Friauf W, Basser PJ. A theoretical calculation of the electric field induced by magnetic stimulation of a peripheral nerve. Muscle Nerve. 1990;13:734–741. doi: 10.1002/mus.880130812. [DOI] [PubMed] [Google Scholar]
- Rothwell JC. The use of paired pulse stimulation to investigate the intrinsic circuitry of human motor cortex. In: Nilsson J, Panizza M, Grandori F, editors. Advances in Magnetic Stimulation. Mathematical Modelling and Clinical Applications. Italy: Pavia; 1996. pp. 99–104. [Google Scholar]
- Rushton WAH. The effect upon the threshold for nervous excitation of the length of nerve exposed, and the angle between current and nerve. J Physiol. 1927;63:357–377. doi: 10.1113/jphysiol.1927.sp002409. [DOI] [PMC free article] [PubMed] [Google Scholar]
- Sakai K, Ugawa Y, Terao Y, Hanajima R, Furabayashi T, Kanazawa I. Preferential activation of different I-waves by transcranial magnetic stimulation with a figure-of-eight shaped coil. Exp Brain Res. 1997;113:24–32. doi: 10.1007/BF02454139. [DOI] [PubMed] [Google Scholar]
- Sanger TD, Garg RR, Chen R. Interactions between two different inhibitory systems in the human motor cortex. J Physiol. 2001;530:307–317. doi: 10.1111/j.1469-7793.2001.0307l.x. [DOI] [PMC free article] [PubMed] [Google Scholar]
- Siebner HR, Peller M, Willoch F, Minoshima S, Boecker H, Auer C, Drzezga A, Conrad B, Bartenstein P. Lasting cortical activation after repetitive TMS of the motor cortex-A glucose metabolic study. Neurology. 2000;54:956–963. doi: 10.1212/wnl.54.4.956. [DOI] [PubMed] [Google Scholar]
- Strens LH, Oliviero A, Bloem BR, Gerschlager W, Rothwell JC, Brown P. The effect of subthreshold 1 Hz repetitive TMS on cortico-cortical and interhemispheric coherence. Clin Neurophysiol. 2002;113:1279–1285. doi: 10.1016/s1388-2457(02)00151-7. [DOI] [PubMed] [Google Scholar]
- Tigwell DA, Sauter J. On the use of isofluorane as an anaesthetic for visual neurophysiology. Exp Brain Res. 1992;88:224–228. doi: 10.1007/BF02259146. [DOI] [PubMed] [Google Scholar]
- Thut G, Théoret H, Pfennig A, Ives J, Kampmann F, Northoff G, Pascual-Leone A. Differential effects of low-frequency rTMS at the occipital pole on visual-induced alpha desynchronisation and visual-evoked potentials. Neuroimage. 2003;18:334–347. doi: 10.1016/s1053-8119(02)00048-4. [DOI] [PubMed] [Google Scholar]
- Valls-Solé J, Pascual-Leone A, Wassermann EM, Hallett M. Human motor evoked responses to paired transcranial magnetic stimuli. Electroencephalogr Clin Neurophysiol. 1992;85:355–364. doi: 10.1016/0168-5597(92)90048-g. [DOI] [PubMed] [Google Scholar]
- Wang H, Wang X, Scheich H. LTD and LTP induced by transcranial magnetic stimulation in auditory cortex. Neuroreport. 1996;7:521–525. doi: 10.1097/00001756-199601310-00035. [DOI] [PubMed] [Google Scholar]
- Wassermann EM. Safety and side-effects of transcranial magnetic stimulation and repetitive transcranial magnetic stimulation. In: Pascual-Leone A, Davey NJ, Rothwell J, Wassermann EM, Puri BK, editors. Handbook of Transcranial Magnetic Stimulation. New York: Oxford University Press; 2002. pp. 39–49. [Google Scholar]
- Wassermann EM, Samii A, Mercuri B, Ikoma K, Oddo D, Grill SE, Hallett M. Responses to paired transcranial magnetic stimuli in resting, active and recently activated muscle. Exp Brain Res. 1996;109:158–163. doi: 10.1007/BF00228638. [DOI] [PubMed] [Google Scholar]
- Wu T, Sommer M, Tergau F, Paulus W. Lasting influence of repetitive transcranial magnetic stimulation on intracortical excitability in human subjects. Neurosci Lett. 2000;287:37–40. doi: 10.1016/s0304-3940(00)01132-0. [DOI] [PubMed] [Google Scholar]
- Yamada H, Transfeldt EE, Tamaki T, Torres F, Iaizzo PA. The effects of volatile anaesthetics on the relative amplitudes and latencies of spinal and muscle potentials evoked by transcranial magnetic stimulation. Spine. 1994;19:1512–1517. doi: 10.1097/00007632-199407000-00018. [DOI] [PubMed] [Google Scholar]
- Ziemann U, Corwell B, Cohen LG. Modulation of plasticity in human motor cortex after forearm ischemic nerve block. J Neurosci. 1998a;18:1115–1123. doi: 10.1523/JNEUROSCI.18-03-01115.1998. [DOI] [PMC free article] [PubMed] [Google Scholar]
- Ziemann U, Rothwell JC. I-waves in motor cortex. J Clin Neurophysiol. 2000;17:397–405. doi: 10.1097/00004691-200007000-00005. [DOI] [PubMed] [Google Scholar]
- Ziemann U, Rothwell JC, Ridding MC. Interaction between intracortical inhibition and facilitation in human motor cortex. J Physiol. 1996;496:873–881. doi: 10.1113/jphysiol.1996.sp021734. [DOI] [PMC free article] [PubMed] [Google Scholar]
- Ziemann U, Tergau F, Wischer S, Hildebrandt J, Paulus W. Pharmacological control of facilitatory I-wave interaction in the human motor cortex. A paired transcranial magnetic stimulation study. Electroencephalogr Clin Neurophysiol. 1998b;109:321–330. doi: 10.1016/s0924-980x(98)00023-x. [DOI] [PubMed] [Google Scholar]
- Kaneko K, Kawai S, Fuchigami Y, Morita H, Ofuji A. The effect of current direction induced by transcranial magnetic stimulation on the corticospinal excitability in human brain. Electroencephalogr Clin Neurophysiol. 1996;101:478–482. doi: 10.1016/s0013-4694(96)96021-x. [DOI] [PubMed] [Google Scholar]