

Abstract
Thirty eccentric contractions (ECs) were imposed upon rat dorsiflexors (n = 46) by activating the peroneal nerve and plantarflexing the foot ≈40 deg, corresponding to a sarcomere length change over the range 2.27–2.39 μm for the tibialis anterior and 2.52–2.66 μm for the extensor digitorum longus. Animals were allowed to recover for one of 10 time periods ranging from 0.5 to 240 h, at which time muscle contractile properties, immunohistochemical labelling and gene expression were measured. Peak isometric torque dropped significantly by ≈40 % from an initial level of 0.0530 ± 0.0009 Nm to 0.0298 ± 0.0008 Nm (P < 0.0001) immediately after EC, and then recovered in a linear fashion to control levels 168 h later. Immunohistochemical labelling of cellular proteins revealed a generally asynchronous sequence of events at the cellular level, with the earliest event measured being loss of immunostaining for the intermediate filament protein, desmin. Soon after the first signs of desmin loss, infiltration of inflammatory cells occurred, followed by a transient increase in membrane permeability, manifested as inclusion of plasma fibronectin. The quantitative polymerase chain reaction (QPCR) was used to measure transcript levels of desmin, vimentin, embryonic myosin heavy chain (MHC), myostatin, myoD and myogenin. Compared to control levels, myostatin transcripts were significantly elevated after only 0.5 h, myogenic regulatory factors significantly elevated after 3 h and desmin transcripts were significantly increased 12 h after EC. None of the measured parameters provide a mechanistic explanation for muscle force loss after EC. Future studies are required to investigate whether there is a causal relationship among desmin loss, increased cellular permeability, upregulation of the myoD and desmin genes, and, ultimately, an increase in the desmin content per sarcomere of the muscle.
It is important from both a biological and a functional point of view to understand the response of muscle to eccentric contractions (ECs). ECs occur when a muscle is forced to lengthen while it is activated. As such, they are a part of ordinary movements and thus physiologically relevant. However, certain aspects of ECs remain distinctive and poorly understood. First, delayed onset muscle soreness and ultrastructural disruptions are selectively associated with exercise involving EC (Fridén et al. 1981, 1983; Fridén, 1984; Jones et al. 1986; Clarkson & Tremblay, 1988). Such changes may require several weeks to resolve and often lead to muscle hypertrophy and strengthening. This association between injury and strengthening has led some to state tacitly that muscle injury is required for muscle strengthening. Interestingly, prior EC renders a muscle more resistant to both the injury and the soreness associated with it (Byrnes et al. 1985; Clarkson & Tremblay, 1988). Thus EC itself protects muscle against further EC-induced damage. Unfortunately, the mechanism for such protection is unknown.
Eccentric contractions of muscle are mechanically unique (see the excellent case made in the Introduction to Morgan, 1990). While the dynamic shortening behaviour of muscle is well explained by the force-velocity relation (Hill, 1938; Huxley, 1957), even at the level of the single cell (Edman et al. 1976), dynamic lengthening is poorly understood from a mechanical point of view. Current crossbridge models do not adequately explain muscle's lengthening behaviour (Harry et al. 1990). It was this observation in part that led to a novel mechanical hypothesis in which muscle injury was proposed to occur by the undamped lengthening of sarcomeres in focal regions of a muscle termed ‘popping’ (Morgan, 1990). Experimental support for this provocative hypothesis exists in both animal and human EC models (Lynn & Morgan, 1994; Talbot & Morgan, 1996; Whitehead et al. 1998).
Animal models of eccentric contraction have been helpful in elucidating cellular events associated with injury and muscle's response to such injury. The earliest event associated with EC in animals is the loss of the intermediate filament desmin (Lieber et al. 1996) followed by inflammation and intracellular and extracellular disruption (McCully & Faulkner, 1985; Stauber et al. 1988). Quantitative measures of desmin loss correlate with loss of tetanic tension in some (Lieber et al. 1996) but not all (Yu et al. 2002) experimental studies. Loss in tetanic tension after EC has also been attributed to loss of excitation-contraction coupling based both on the dissociation between the surface electromyogram (EMG) and torque and the increase in muscle force measured after caffeine-induced contractures (Warren et al. 1993, 1999). Yet in spite of these associations between muscle tetanic tension and changes after EC, there is as yet no quantitative explanation available as to why muscle force decreases after EC, how one phenomenon leads to the next and how (or if) muscle injury causes muscle hypertrophy. In part this is due to the fact that different investigators measure different muscle properties in different species, with different methods over different time courses thus making comparisons across studies extremely difficult. The functional properties of muscle have never been directly correlated with all of these cellular and transcriptional changes. Thus, the purpose of this study was to measure muscle functional properties and a palette of structural and biological properties continuously across the entire range of physiologically relevant time periods from 30 min to 10 days after EC.
METHODS
Animal care
Laboratory animals used in this study were untrained, adult male Sprague-Dawley rats (Harlan, Indianapolis, IN, USA) with an average size of 433.1 ± 3.6 g (mean ±s.e.m., n = 46). Rats were housed two per cage at 20–23 °C with a 12 h dark-light cycle. All procedures were approved by the University of California and V.A. Medical Center Committees on the Use of Animal Subjects in Research. After terminal experiments, animals were killed with an intracardiac injection of pentobarbitol sodium (0.5 ml of 390 mg ml−1 solution).
Experimental protocol
Ankle isometric dorsiflexion torque was measured prior to eccentric exercise, immediately after eccentric exercise, and after a specified recovery time: 0.5 h (n = 4), 3 h (n = 4), 6 h (n = 4), 12 h (n = 4), 24 h (n = 5), 48 h (n = 8), 72 h (n = 4), 120 h (n = 4), 168 h (n = 5) and 240 h (n = 4). The contralateral leg served as the control, receiving only the isometric torque testing protocol. Eccentric exercise, consisting of 30 eccentric contractions (EC), was imposed with each contraction occurring at 2 min intervals to eliminate the effects of fatigue. A separate group of animals (n = 3) received an exercise protocol of 30 isometric contractions using the identical activation parameters to estimate torque loss due to stimulation alone.
Animals were anaesthetized using 0.3 ml subcutaneous injection of a ketamine-rompum-acepromazine cocktail (25, 2.5, and 0.5 mg ml−1, respectively) and were maintained on isoflurane anesthesia (2 %, 1.5 l min−1) throughout the experiment. Respiratory rate was monitored visually and anaesthetic concentration was adjusted as needed.
A small incision was made in the lateral portion of the leg near the fibular head and the peroneal nerve was isolated. Using a procedure similar to that described previously in rabbits (Lieber et al. 1994), the foot was secured to a footplate attached to the motor arm of a dual-mode servomotor (Model 6650, Cambridge Technologies, Cambridge, MA, USA), which simultaneously measured dorsiflexion torque and imposed angular rotation. The ankle joint centre of rotation was aligned with the axis of rotation of the motor with tibiotarsal and femurotibial angles set to 90 deg. A small nerve cuff (subminiature electrode, Harvard Apparatus, Holliston, MA, USA) was used to stimulate the peroneal nerve (Model S48, Grass Instruments, Quincy, MA, USA). Muscle temperature was maintained at 37 °C using radiant heat, mineral oil, and a servo-temperature controller (Model 73A, Yellow Springs Instrument, Yellow Springs, OH, USA). Maximal isometric twitch with a typical recruitment pattern (Close, 1972) was performed to ensure consistent nerve cuff placement.
Isometric dorsiflexion torque was maximal using a 15 V stimulus, with a train duration of 650 ms. Rats were stimulated at 2 min intervals at frequencies of 5, 15, 25, 40, and 100 Hz to determine the torque-frequency relationship. Maximum isometric torque was defined as the dorsiflexion torque at 100 Hz stimulation frequency which was always the greatest value achieved. Isometric torque was also determined during eccentric contractions by measuring the torque generated at full tetanus just prior to the EC stretch (190 ms after initiation of stimulation; cf. Fig. 3B).
Figure 3. Biomechanical changes of muscles subjected to eccentric contractions.
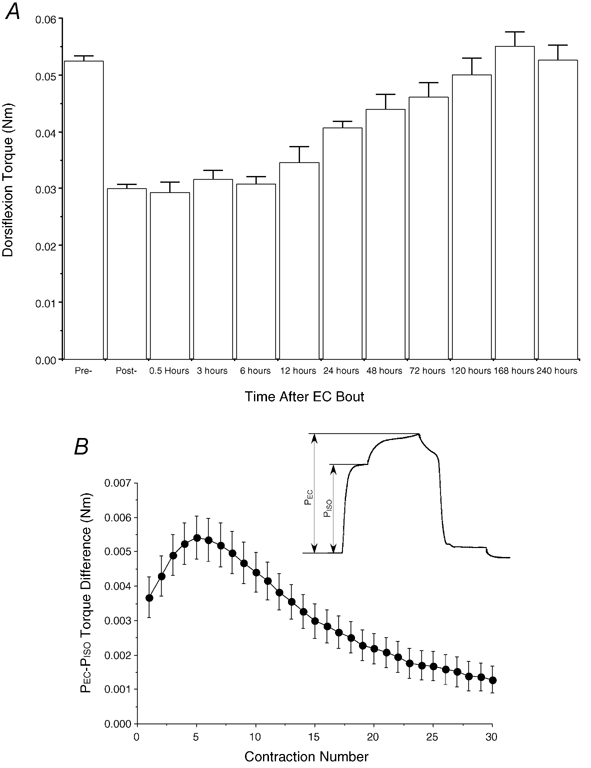
A, time course of torque peak isometric torque at various time points after eccentric contraction. Each bar represents 4–8 animals per time point with the exception of the ‘Pre-’ and ‘Post-’ data, which represent the pool of all 46 animals. B, time course of average ‘additional’ tension due to eccentric contraction during the EC bout. Inset represents schematic of method of PADD calculation. Details are provided in Lieber et al. (1991). Data in A from the time periods 6–168 h were presented in Barash et al. (2002). PEC represents peak eccentric torque while PISO represents isometric torque just prior to eccentric contraction.
Eccentric exercise was induced by imposing a 38 deg ankle plantarflexion (maximum range of the servomotor) over a 400 ms duration during maximal dorsiflexor activation. This was repeated at 2 min intervals for 60 min, yielding 30 eccentric contractions. Dorsiflexion torque was recorded in real time during all contractions and was remeasured isometrically 2 min after the last eccentric contraction, before closing the incision using 5–0 nylon suture. The additional tension induced by EC (i.e., PADD, described in Lieber et al. 1991) was calculated from the real-time torque records during each contraction. Animals were allowed to recover for one of the specified time periods (see above) at which point isometric dorsiflexion torque measurement was repeated. Animals were killed and the tibialis anterior (TA) and extensor digitorum longus (EDL) muscles were excised, immediately frozen in liquid nitrogen-cooled isopentane (−159 °C) and stored at −8 °C for subsequent analysis.
Immunohistochemistry
Muscle cross-sections (10 μm thick) taken from the midbelly of the TA and EDL were stained with eosin and haematoxylin to view overall fibre appearance. Average muscle fibre diameter within sections was calculated using stereological point counting techniques on laminin-stained cross-sections of control TA muscle (Weibel, 1980). A portion of the muscle cross-section, free from sectioning artifacts, excessive connective tissue or blood vessels, was viewed through a 10 × 10 grid placed into the eyepiece of a light microscope (Nikon Microphot, Tokyo, Japan). The number of fibres within the grid was counted directly. Fibres that intersected the edges of the grid were counted if they were on the left or top of the grid and excluded if they were on the bottom or right on the grid according to stereological principles (Weibel, 1980). Fibre size was then calculated using standard stereological equations (Weibel, 1980). An average of 12 samples from different muscle cross-sections was taken.
Serial sections from the frozen tissue were labelled with monoclonal antibodies to desmin (DER11, 1:1000, Novocastra Laboratories, Newcastle, UK), fibronectin (EDA domain, 1:50, Sigma), vimentin (VIM-V9, 1:5000, Novocastra), embryonic myosin heavy chain (MHC) (clone 1.652, 1:10, courtesy of Helen Blau, Stanford University), and laminin (clone II (2E8), 1:1000, Gibco, Carlsbad, CA, USA) using an indirect immunoperoxidase technique (Vectastain Elite ABC Kit, Vector laboratories, Burlingame, CA, USA). Muscle sections were treated with bovine serum albumin (Sigma) as a blocking agent and incubated with the primary antibodies overnight. The secondary antibody was biotinylated, rat-adsorbed, horse anti-mouse (1:20 000, Vector) and labelling was visualized using diaminobenzidine (Sigma).
Cross-sections were viewed at × 25 magnification to enable viewing the entire muscle cross-section and the affected fibres were counted directly by an observer blinded to tissue identity. Each affected fibre of every section was counted to quantify immunohistochemical appearance. Fibres were considered desmin negative (Fig. 1D) if the outline of the fibre could still be seen and little or no staining occurred relative to positively staining neighboring fibres. Fibronectin (Fig. 1B), vimentin (Fig. 1F), and embryonic myosin heavy chain (MHCemb; Fig. 1H) are absent from normal adult fibres (Figs. 1C, 1E, 1G) so that fibres were considered positive (and abnormal) if the antibody labelled the fibre. At certain time periods, small muscle cells were identified that labelled positively with the MHCemb antibody and were considered regenerating fibres (Fig. 1H, arrows). Total muscle cross-sectional area (CSA) was determined by projecting the cross-section at × 10 magnification onto a piece of paper and tracing it. Muscle outlines were weighed and mass was converted to area (conversion factor = 0.3725 cm2 g−1). Accuracy of this method determined by repeated measures of a standard grid was 2.9 % (coefficient of variation) and repeatability determined by repeated measures of the same tracing was 1.0 %. Fibre number in each muscle was then calculated by dividing muscle CSA by average fibre diameter measured from the laminin-stained sections.
Figure 1. Immunohistochemical sections of normal TA muscles (A, C, E and G) or eccentrically exercised TA muscles (B, D, F and H).
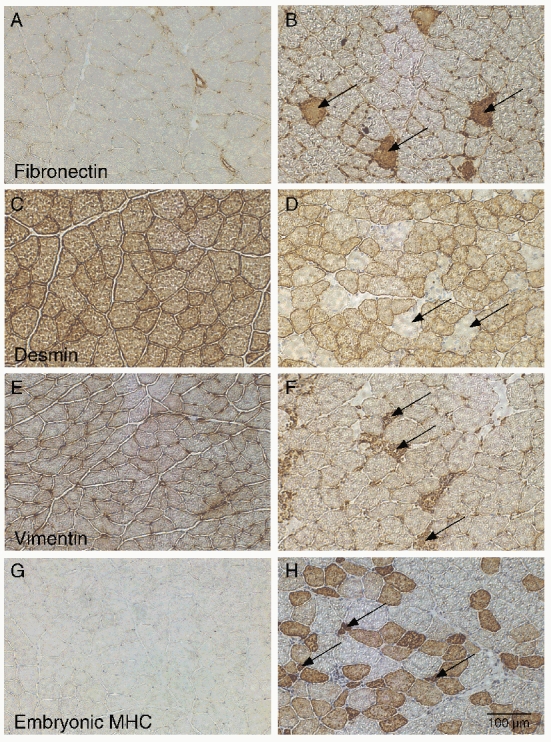
A, control fibronectin; B, fibronectin 12 h after EC, arrows point to cells with included fibronectin that have thus lost their permeability barrier; C, control desmin; D, desmin 24 h after EC, arrows point to cells that have lost immunostaining for desmin; E, control vimentin; F, vimentin 24 h after EC, arrows point to fibres with inflammatory cells that label positively for vimentin; G, control embryonic MHC; H, embryonic MHC 120 h after EC, arrows represent small regenerating fibres. Note also the presence of large, positively staining fibres. EDL muscles showed no abnormalities.
Skeletal muscle architecture and moment arms
To define EDL and TA architectural properties and moment arms and to determine the relationship between sarcomere length and ankle joint angle, rat hindlimbs were harvested from a separate group of anaesthetized rats (n = 8 rats, 16 limbs). Transection was performed at the midfemoral level to maintain EDL patency, accounting for the EDL's origin proximal to the knee. Specimens were freed of the surrounding soft tissue envelope of skin and subcutaneous fat leaving only the underlying muscles, tendons, ligaments, and bone. Hindlimbs were pinned to corkboard with the knee joint fixed at 90 deg and the ankle joint placed at one of the following joint angles (n = 4 muscles/angle): Maximum dorsiflexion (≈60 deg dorsiflexion), 35 deg dorsiflexion, neutral (0 deg), and maximum plantarflexion (≈70 deg plantarflexion). Hindlimbs were fixed in 10 % buffered Formalin for 48 h. Four to six muscle fibres were carefully dissected from each fixed muscle using microinstruments, placed on glass slides and allowed to dry in mounting medium. Sarcomere length was measured at three locations along each fibre using laser diffraction (Lieber et al. 1984). Average sarcomere length from each fibre was divided into measured fibre length to yield sarcomere number for each fibre, which was used in architectural calculations. Raw sarcomere lengths from each muscle were used to construct the sarcomere length-joint angle relationship for the TA and EDL (Fig. 2). For architectural definitions, muscle length and fibre length were corrected to a sarcomere length of 2.5 μm to compensate for differences in joint angle during fixation. Physiological cross-sectional area (PCSA) was calculated using the equations described and validated previously (Sacks & Roy, 1982; Powell et al. 1984).
Figure 2. Relationship between sarcomere length and ankle joint angle for the TA and EDL in chemically fixed rat hindlimbs, as a function of joint angle.
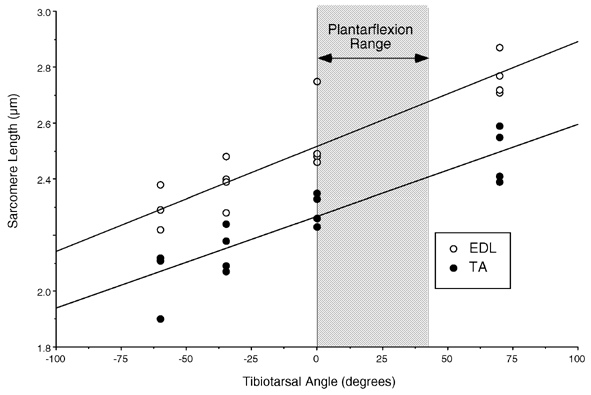
Note the nearly identical slopes of the sarcomere length-joint angle relationship determined by linear regression. Shaded area shows ankle angle range during EC corresponding to the plateau and descending limb of the length-tension curve. Note the linear relationship for both muscles between sarcomere strain and joint angle.
For moment arm determination, hindlimbs were isolated as described above (n = 8 rats, 16 limbs) and TA or EDL tendon excursion was measured as a function of joint angle. Because the retinaculum acts as a pulley, this yielded a linear relationship (see Fig. 2 of Lieber et al. 1994), the derivative of which yielded the moment arm (An et al. 1983).
Skeletal muscle transcript levels
Total RNA was isolated from frozen muscle tissues using TRIZOL extraction (Gibco BRL, Grand Island, NY, USA). RNA concentration was measured by absorption at 260 nm and the purity of the RNA was guaranteed based on a 260 nm/280 nm absorption ratio of ≈2.0. A total of 1 μg of RNA per reaction was reverse transcribed (Superscript, Invitrogen, Carlsbad, CA, USA) into cDNA using Oligo dT as the primer and the manufacturer's protocol. Primers were designed to amplify desmin, vimentin, myostatin, MyoD and myogenin in the translated region, while for embryonic MHC the sense primer was designed in the translated region and the antisense primer in the 3′-untranslated region, where the sequence is highly specific for the different MHC isoforms (Periasamy et al. 1985; Weiss et al. 1999). Primers, accession numbers for plasmid standards, and expected product lengths are provided in Table 1.
Table 1.
Primers used for quantitative real-time PCR
| Myostatin transcript (AF019624, 245 bp): | Sense primer: 5′-AAA GAG GGG CTG TGT AAT GCG-3′ |
| Antisense primer: 5′-TCC GTG GTA GCG TGA TAA TCG-3′ | |
| MyoD transcript (M84176, 388 bp): | Sense primer: 5′-AGG GAA GGG AAG AGC AGA AG-3′ |
| Antisense primer: 5′-TAC ACC TGT TAC ACC CGA GAT-3′ | |
| Myogenin transcript (NM_017115, 311 bp): | Sense primer: 5′-TCC CAA CCC AGG AGA TCA T-3′ |
| Antisense primer: 5′-TGC TGG GCT GGG TGT TAG TC-3′ | |
| Desmin transcript (NM_022531, 254 bp): | Sense primer: 5′-TCA AGG GCA CCA ACG ACT-3′ |
| Antisense primer: 5′-GGT CTG GAT CGG AAG GTT GAT-3′ | |
| Vimentin transcript (NM_031140, 230 bp): | Sense primer: 5′-CCC AGA TTC AGG AAC AGC AT-3′ |
| Antisense primer: 5′-CAC CTG TCT CCG GTA TTC GT-3′ | |
| Embryonic MHC transcript (X04267, 443 bp): | Sense primer: 5′-GAG GAT CAG AGA GCT AGA GTT-3′ |
| Antisense primer: 5′-ATT AAG CAG GAT GGT CAG GAG CC-3′ |
GenBank accession number and PCR product length are given in parentheses after each transcript name.
Quantification of transcript levels was performed using the Cepheid SmartCycler (Sunnyvale, CA, USA) on cDNA. A sample of 1 μl of 1:10 diluted cDNA was analysed using platinum taq DNA polymerase (Invitrogen) and SYBR Green dye. All samples (four injured and two controls from each time point) were analysed in triplicate along with the appropriate plasmid DNA standard (MHCemb) or gel purified PCR product standard (desmin, vimentin, myostatin, MyoD and myogenin). The PCR reaction vessel (25 μl) contained: 2.5 μl 10 × PCR buffer (1 ×), 2 mm MgCl2, 0.2 mm sense and antisense primers, 0.2 mm dNTP, 0.2 × SYBR Green and 1 u platinum taq polymerase. For MHCemb, plasmid DNA (Lieber et al. 1993) was prepared from the cloned portion of each gene using the Qiaprep mini prep spin kit (Qiagen) and for desmin, vimentin, myostatin, MyoD and myogenin, gel purified PCR product was used as the standard.
Two-step amplification was performed as follows: An initial hold at 95 °C for 3 min (myogenin) or 5 min (for myostatin, MyoD, MHCemb, vimentin and desmin) was followed by 40 cycles of denaturing at 95 °C for 15 s followed by annealing/extensionat 62 °C for 40 s (myostatin), 67 °C for 40 s (MyoD), 68 °C for 30 s (myogenin) or 69 °C for 40 s (MHCemb, vimentin, and desmin). The success of each reaction was deduced based on observing a single reaction product on an agarose gel and a single peak on the DNA melting temperature curve determined at the end of the reaction. Because MHCemb is one of nine in a multigene family (Weiss et al. 1999), it was critical to demonstrate the specificity of MHC primers against all of the other MHC isoforms that could exist in these muscles (types 2A, 2B, 2X, β-cardiac and MHCemb). This was done by using quantitative polymerase chain reaction (QPCR) to compare the amount of MHCemb in tubes containing only MHCemb to those containing the same amount of MHCemb and mixtures of other isoforms. In all cases, the same value was obtained indicating no cross-reactivity.
Statistical analysis
Mean values between different time periods were compared by one-way analysis of variance (ANOVA). (Despite the fact that time was the dependent variable, a repeated measures design was not used as each time period represented independent experimental animals.) Post hoc multiple comparisons between each time period and control groups were made using Fischer's least squared differences test. Correlations between variables were calculated using linear regression. Statistical significance level (α) was set to 0.05 and statistical power (1 - β) exceeded 80 % in all cases where results were not significantly different demonstrating an adequate sample size. All analysis was performed with the StatView program (v.5.1, Abacus Concepts, Berkeley, CA, USA). Data are presented in the text as mean ±s.e.m. unless otherwise stated.
RESULTS
Initial dorsiflexion torque was 0.0530 ± 0.00090 Nm, and decreased 44 % to 0.0298 ± 0.00075 Nm (P < 0.0001) immediately after the EC bout (Fig. 3A). During the EC bout, most of the ‘added tension’ due to eccentric contraction (i.e. PADD defined in Lieber et al. 1991) occurred early during the EC bout, maximizing on the 5th contraction and reducing to zero after ≈20 contractions (Fig. 3B). This agrees with the previously published time course obtained from isolated rabbit tibialis anterior muscle (Lieber et al. 1991) and suggests the majority of the energy absorbed by the muscle was early in the bout. Dorsiflexion torque recovered slightly after 6 h (3 %), and continued to recover monotonically back to initial levels after 168 h (0.055 ± 0.00026 Nm; Fig. 3A). Control experiments, in which 30 isometric contractions were imposed using the same stimulation protocol as EC, caused a statistically insignificant 2 % decrease in dorsiflexion torque, which fully recovered after 24–48 h (data not shown).
Tibialis anterior cross-sectional area (CSA) measured from frozen sections increased significantly by 14.0 ± 2.1 % above controls 6–24 h after EC (to 0.498 ± 0.017 cm2) and returned to control levels after 24 h. Contralateral controls showed no change with time. We interpreted this as reflecting transient intramuscular swelling which has been previously reported in human EC models (Howell et al. 1993). Architectural measurements from the rat dorsiflexors revealed similar fibre lengths and moment arms for both the TA and EDL (Table 2). It was thus not surprising that the relationship between sarcomere length and ankle joint angle was similar between the two muscles with the TA changing sarcomere length linearly by 3.27 nm (deg)−1 (P < 0.0001, r2 = 0.81) and the EDL changing sarcomere length linearly by 3.75 nm (deg)−1 (P < 0.0001, r2 = 0.82; Fig. 2). The slightly larger sarcomere length change per joint angle rotation for the EDL was a result of its slightly shorter muscle fibres. Using the regression equations, the TA was predicted to lengthen over the range 2.27-2.39 μm while the EDL was predicted to lengthen over the range 2.52–2.66 μm, which would represent the plateau and descending limb of the length-tension curve for this species.
Table 2.
Architectural properties of rat EDL and TA muscles
| Parameter | EDL | TA |
|---|---|---|
| Moment arm (mm) | 4.49 ± 0.41 | 4.34 ± 0.39 |
| Mass (g) | 0.091 ± 0.002 | 0.446 ± 0.013 |
| Muscle length (mm) | 25.8 ± 0.9 | 24.5 ± 1.3 |
| Fibre length (mm) | 11.40 ± 0.33 | 14.72 ± 0.48 |
| Lf/Lm ratio | 0.44 ± 0.02 | 0.57 ± 0.02 |
| PCSA (mm2) | 7.56 ± 0.28 | 28.89 ± 1.58 |
n = 8 muscles per group. Data are presented as means ±s.e.m. for animals with an average mass of 413.5 ± 6.4 g. Abbreviations: EDL, extensor digitorum longus; TA, tibialis anterior; Lf, fibre length; Lm, muscle length; PCSA, physiological cross-sectional area.
Immunolabelling of TA serial cross-sections revealed a variety of cellular abnormalities with very different time courses relative to each other and to dorsiflexion torque. The most rapid structural change in the fibres was loss of immunostaining for the intermediate filament protein, desmin (Fig. 3D and Fig. 4A). There were many fibres that were negative for desmin within 6 h of the EC bout. As previously reported in part (Barash et al. 2002), loss of desmin immunostaining reached maximal levels at 12 h (255 ± 113 fibres, P < 0.005) and resolved within 72 h. Changes in vimentin paralleled those of desmin, with comparable numbers of fibres staining positively (222 ± 84 fibres, P < 0.001) 12 h after the EC bout (Fig. 3B and Fig. 4B). Vimentin labelling was confined to infiltrating inflammatory cells, which could be easily distinguished from the surrounding myoplasm (Fig. 3B). Fibronectin labelling, which reflected a loss of cell membrane integrity, reached a peak of 477 ± 74 (P < 0.0001) fibres staining positively 24 h after EC (Fig. 3F and Fig. 4C). Finally, expression of MHCemb protein was first detected 48 h after EC and continued to increase even 7 days later (666 ± 176 fibres, P < 0.0001; Fig. 3H and Fig. 4D, filled bars). The embryonic MHC monoclonal antibody also labelled small, presumably regenerating fibres, whose numbers became significant 72 h after EC (214 ± 68 fibres, P < 0.0001, Fig. 4D, hatched bars), reaching maximal levels after 120 h (285 ± 28 fibres, P < 0.0001), and decreasing 240 h after EC (77 ± 19 fibres, P < 0.05; Fig. 4D). None of the TA muscle cross-sections from contralateral control legs or any EDL muscles showed any of the abnormal changes in immunostaining observed in muscles subjected to EC.
Figure 4. Number of muscle fibres demonstrating abnormal staining characteristics as described in Methods at different time points after EC.
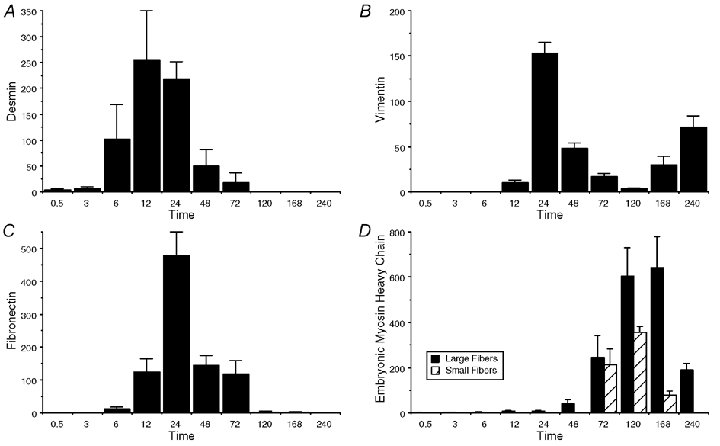
A, fibres negative for desmin; B, fibres positive for vimentin; C, fibres positive for fibronectin; D, large fibres positive for embryonic MHC (filled bars) or small fibres positive for embryonic MHC (hatched bars). The total fibre number of the rat TA was calculated as 15, 429 ± 672 (mean ±s.d.). Data in A from the middle time periods, 6–168 h, were presented in (Barash et al. 2002). They are provided here for reader's convenience only and are not intended to indicate new research data obtained.
Protein changes observed in this and a previous study (Barash et al. 2002) could reflect post-translational or transcriptional regulation within the muscle. We thus investigated the transcriptional activity of the desmin, vimentin and MHCemb, as well as the myostatin, myoD and myogenin genes. As with protein expression, gene regulation occurred to various degrees and with different time courses. Myostatin levels increased very rapidly, such that they were significantly elevated after only 30 min, peaked after 12 h and returned to baseline levels 24 h after EC (Fig. 5A). Both myogenic regulatory factors were significantly elevated after only 3 h with myoD mRNA levels occurring at very low levels, peaking after 6 h and returning to control levels after 120 h (Fig. 5B), and myogenin levels peaking after 24 h and returning to control levels after 240 h (Fig. 5C). A significant increase over control levels of desmin transcripts was observed 12 h after EC, peaking after 48 h and resolving to control levels by 72 h (Fig. 5D). This was approximately the same time course as the vimentin transcript levels albeit vimentin transcripts were present in much lower quantities (Fig. 5E). Upregulation of the embryonic MHC gene occurred much later than the other transcripts measured, with transcript levels significantly increased over control levels only after 72 h, peaking after 120 h, and remaining elevated even 240 h after EC (Fig. 5F).
Figure 5. Transcript levels from normal muscles (control) and muscles obtained at various time points after EC.
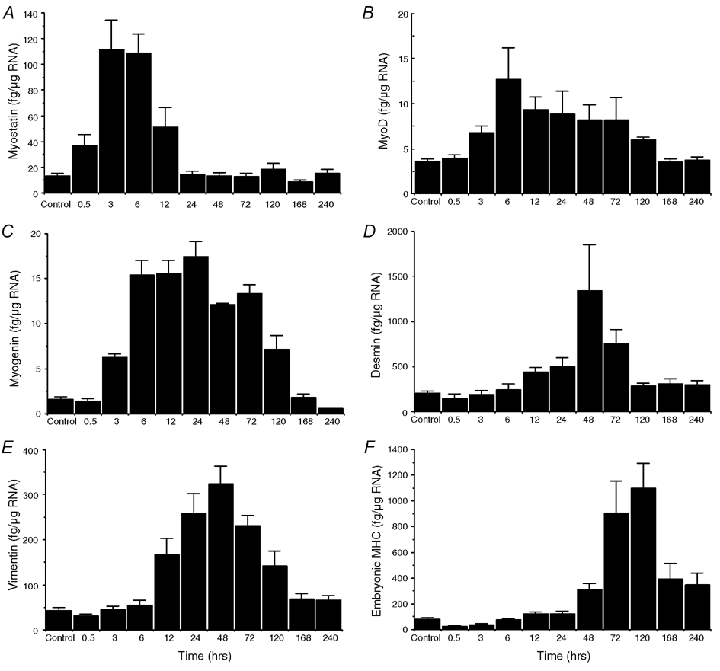
Values are expressed as amount of transcript per microgram of RNA extracted from the muscle tissue. Note large variations in absolute amount of transcripts for the different proteins studied. A, myostatin; B, myoD; C, myogenin; D, desmin; E, vimentin; F, embryonic MHC.
DISCUSSION
The purpose of this study was to measure the biological and functional response of skeletal muscle to eccentric contractions (EC). A limitation of previous studies in this area was that only a single parameter such as immunostaining or function or architecture or gene expression was measured or multiple parameters were measured only at a few time points, precluding detection of potential causative relationships among these variables (Armstrong et al. 1983; McCully & Faulkner, 1985; Lieber & Fridén, 1988; Stauber et al. 1988; Chen et al. 2002). Using a multidisciplinary approach, we have addressed the functional and biological consequences of EC across the entire physiologically relevant time span (30 min to 10 days) in an attempt to describe the relationship between muscle function and the underlying cellular events associated with EC-induced injury.
In previous studies, we identified two pieces of mechanical evidence suggesting that desmin might play a direct mechanical role in the force loss after EC. First, desmin immunostaining was rapidly lost, as fast as 15 min into a single bout of EC in a rabbit dorsiflexor model (Lieber et al. 1996) and a strong linear correlation was seen between the magnitude of desmin lost and muscle force generated after EC (cf. Fig. 10 of Lieber et al. 1994). Because desmin is the major skeletal muscle intermediate filament protein responsible for transmission of stress radially and, to a lesser extent, longitudinally among myofibrils (Wang & Ramirez-Mitchell, 1983), the correlation between muscle force and desmin loss was interpreted as evidence that force transmission among myofibrils must be present in order to generate peak muscle stress. Support for this concept was provided based on the observation that, in a desmin null model (Milner et al. 1996), isometric stress generated by skeletal muscle was reduced by about 25 % compared to wildtype animals and, after a single EC bout, stress generated by desmin null and wildtype mice was identical (Sam et al. 2000). However, in the current study, desmin loss cannot explain the precipitous and prolonged loss in muscle force production. This conclusion is based on the fact that at most ≈250 fibres showed loss of desmin immunostaining whereas direct counting of fibre number in the rat TA yielded an average fibre number of 15, 429 ± 672. Thus, even if all 250 fibres generated zero tension, force would decrease by only ≈2 % which is far less than the 40 % drop observed (Fig. 3A). Of course, it is feasible that desmin function is not accurately portrayed by loss of immunostaining and that other fibres did lose some or all of the function of the desmin intermediate filament system. This seems unlikely in light of the fact that the time course of loss of desmin immunostaining (Fig. 4) is quite different from the time course of functional recovery from EC (Fig. 3A).
A limitation of this study is that peak isometric torque was not measured at the joint angle where torque was maximal, due to limitations in the measuring apparatus itself. Morgan and colleagues have demonstrated a shift in the optimal torque angle of 5–15 deg in both animal and human systems after EC (Talbot & Morgan, 1998; Whitehead et al. 1998; Proske & Morgan, 2001). Based on our direct measurements of the sarcomere length-joint angle relationship, we predict that, given the constant ankle joint moment arm (Table 2), a shift in the optimal joint angle of ≈15 deg would result in a force increase of only 11 % because those muscles were tested on the descending limb of the length-tension relationship. This cannot explain the observations in the current study. Because isometric torque was measured on the descending limb of the length-tension relationship, such a shift in optimal length would actually result in an underestimation of peak torque.
We were surprised that no signs of injury were observed in the EDL muscle after EC. In our previous study of the rabbit dorsiflexors, EDL injury was always about twice that observed in the TA (Lieber et al. 1994, 1996). We suggested that this was due to the fact that EDL strain during EC was about twice that seen in the TA, because EDL fibres were only about half the length of those in the TA (Lieber & Blevins, 1989). Since rat EDL fibres are shorter than TA fibres (Table 2), based on the measured moment arms (Table 2), we calculate EDL strain to be ≈26 % while TA strain is ≈20 %. If strain were the sole determinant of injury magnitude, the EDL would demonstrate more injury than the TA. Therefore, either strain is not a good predictor of muscle injury or EDL fibre strain has been miscalculated. It is conceivable that the very long distal EDL tendons or slight toe extension could provide sufficient compliance to ‘buffer’ the EDL fibres from the imposed length change. Such a disparity between muscle-tendon unit length and muscle fibre length has been reported by Hoffer et al. in cat plantarflexors during locomotion (Hoffer et al. 1989). In any case, because the physiological cross-sectional area of the TA represents ≈80 % of the rat dorsiflexors (Table 2), TA properties will dominate torque measurements and the unexplained result for the EDL does not affect the conclusions reached.
The rapid transient expression of the myostatin, myoD and myogenin transcripts demonstrates that EC initiates events related to myogenesis and differentiation (Megeney et al. 1996). While previous studies suggested a negative regulatory role of myostatin on the myogenic regulatory factors (McPherron et al. 1997; Langley et al. 2002; McMahon et al. 2003) and therefore we expected to see decreased myostatin expression after EC, in fact, the opposite was observed. This surprising result indicates that myostatin's relationship to myogenesis is not fully understood. Further, because myostatin proteins experience post-translational modifications (Langley et al. 2002; McMahon et al. 2003), transcript levels may not accurately represent levels of the functional protein.
The most likely source of myogenin and myoD transcripts is proliferating and differentiating satellite cells (Megeney & Rudnicki, 1995). Myogenin and myoD transcript levels were significantly correlated across all time points (P < 0.0001, r2 = 0.34) and slightly staggered in time, which supports their co-regulation and causal relationship (Rudnicki et al. 1992). We did not use in situ hybridization to localize these transcripts, but, based on the observation that the embryonic MHC protein was ultimately expressed in both large and small regenerating fibres 24–48 h after EC (Fig. 1H), we conclude that EC did activate satellite cells in mature muscle cells, inducing their differentiation and, perhaps, ultimately leading to muscle cell hypertrophy. The fact that the nuclear:cytoplasmic volume ratio remains nearly constant in hypertrophy and atrophy models (Allen et al. 1995) strongly suggests that satellite cells can be recruited to existing myofibres, replicated to replace damaged myofibres during hypertrophy, and eliminated during atrophy. The fact that inflammatory cells (indicated by vimentin labelling) are only present in the tissue after myoD and myogenenin upregulation (Fig. 4B and Fig. 5A and B) argues against their causative role in satellite proliferation. It should be noted that all PCR results were expressed per microgram of RNA extracted from the tissue. Since significant numbers of inflammatory cells were present, especially at the 24–48 h time periods (Fig. 4B), the values reported (Fig. 5) slightly underestimate the transcript levels within the muscle cells at these time points.
We recently reported, using this same model, that a single EC bout leads to an approximate 3-fold increase in the amount of desmin relative to actin 7 days after an EC bout (Barash et al. 2002). Since actin content remained constant, we interpreted this as indicating a stoichiometric increase in the relative amount of desmin per myofibril. The relatively robust and transient nature of desmin mRNA expression (Fig. 5D) provides a transcriptional basis for this observation. We hypothesize that there is a relationship, albeit poorly understood, between loss of desmin immunostaining (Fig. 4A), transcriptional upregulation (Fig. 5D) and the ultimate increase in desmin content per sarcomere (Fig. 3B of Barash et al. 2002). We also have direct mechanical data demonstrating that such ‘reinforced’ sarcomeres are highly resistant to EC-induced injury (D. Peters & R. L. Lieber, manuscript in preparation). We hypothesize that reinforcement of the desmin cytoskeleton secondary to transcriptional upregulation provides mechanical protection from injury. Of course, further studies are required to test this hypothesis directly.
In conclusion, this study provides a detailed description of some of the temporal events that occur after EC-induced muscle injury. None of the measured parameters can directly explain torque loss after EC, or the linear recovery that occurs thereafter, but the time course of the cellular changes in the injured muscle suggests a dynamic remodelling of the cytoskeleton and gene expression profile that may lead to hypertrophy and protection from further injury. This study yields insights into the nature of the cellular response to eccentric injury and provides a powerful model in which to study mechanistic relationships among these parameters.
REFERENCES
- Allen DL, Monke SR, Talmadge RJ, Roy RR, Edgerton VR. Plasticity of myonuclear number in hypertrophied and atrophied mammalian muscle fibers. J Appl Physiol. 1995;78:1969–1976. doi: 10.1152/jappl.1995.78.5.1969. [DOI] [PubMed] [Google Scholar]
- An KN, Ueba Y, Chao EY, Cooney WP, Linscheid RL. Tendon excursion and moment arm of index finger muscles. J Biomech. 1983;16:419–425. doi: 10.1016/0021-9290(83)90074-x. [DOI] [PubMed] [Google Scholar]
- Armstrong RB, Ogilvie RW, Schwane JA. Eccentric exercise-induced injury to rat skeletal muscle. J Appl Physiol. 1983;54:80–93. doi: 10.1152/jappl.1983.54.1.80. [DOI] [PubMed] [Google Scholar]
- Barash IA, Peters D, Fridén J, Lutz GJ, Lieber RL. Desmin cytoskeletal modifications after a bout of eccentric exercise in the rat. Am J Physiol. 2002;283:R958–563. doi: 10.1152/ajpregu.00185.2002. [DOI] [PubMed] [Google Scholar]
- Byrnes WC, Clarkson PM, White JS, Hseih SS, Frykman PN, Maughan RJ. Delayed onset muscle soreness following repeated bouts of downhill running. J Appl Physiol. 1985;59:710–715. doi: 10.1152/jappl.1985.59.3.710. [DOI] [PubMed] [Google Scholar]
- Chen YW, Nader GA, Baar KR, Fedele MJ, Hoffman EP, Esser KA. Response of rat muscle to acute resistance exercise defined by transcriptional and translational profiling. J Physiol. 2002;545:27–41. doi: 10.1113/jphysiol.2002.021220. [DOI] [PMC free article] [PubMed] [Google Scholar]
- Clarkson PM, Tremblay I. Exercise-induced muscle damage, repair, and adaptation in humans. J Appl Physiol. 1988;65:1–6. doi: 10.1152/jappl.1988.65.1.1. [DOI] [PubMed] [Google Scholar]
- Close RI. Dynamic properties of mammalian skeletal muscles. Physiol Rev. 1972;52:129–197. doi: 10.1152/physrev.1972.52.1.129. [DOI] [PubMed] [Google Scholar]
- Edman K, Mulieri LA, Scubon MB. Non-hyperbolic force-velocity relationship in single muscle fibres. Acta Physiol Scand. 1976;98:143–156. doi: 10.1111/j.1748-1716.1976.tb00234.x. [DOI] [PubMed] [Google Scholar]
- Fridén J. Muscle soreness after exercise: implications of morphological changes. Int J Sports Med. 1984;5:57–66. doi: 10.1055/s-2008-1025881. [DOI] [PubMed] [Google Scholar]
- Fridén J, Sjöström M, Ekblom B. A morphological study of delayed muscle soreness. Experientia. 1981;37:506–507. doi: 10.1007/BF01986165. [DOI] [PubMed] [Google Scholar]
- Fridén J, Sjöström M, Ekblom B. Myofibrillar damage following intense eccentric exercise in man. Int J Sports Med. 1983;4:170–176. doi: 10.1055/s-2008-1026030. [DOI] [PubMed] [Google Scholar]
- Harry JD, Ward AW, Heglund NC, Morgan DL, McMahon TA. Cross-bridge cycling theories cannot explain high-speed lengthening behavior in frog muscle. Biophys J. 1990;57:201–208. doi: 10.1016/S0006-3495(90)82523-6. [DOI] [PMC free article] [PubMed] [Google Scholar]
- Hill AV. The heat of shortening and the dynamic constants of muscle. Proc R Soc Lond B Biol Sci. 1938;126:136–195. doi: 10.1098/rspb.1949.0019. [DOI] [PubMed] [Google Scholar]
- Hoffer JA, Caputi AA, Pose IE, Griffiths RI. Roles of muscle activity and load on the relationship between muscle spindle length and whole muscle length in the freely walking cat. Prog Brain Res. 1989;80:75–85. doi: 10.1016/s0079-6123(08)62201-3. [DOI] [PubMed] [Google Scholar]
- Howell JN, Chleboun G, Conatser R. Muscle stiffness, strength loss, swelling and soreness following exercise-induced injury in humans. J Physiol. 1993;464:183–96. doi: 10.1113/jphysiol.1993.sp019629. [DOI] [PMC free article] [PubMed] [Google Scholar]
- Huxley AF. Muscle structure and theories of contraction. Prog Biophys Mol Biol. 1957;7:255–318. [PubMed] [Google Scholar]
- Jones DA, Newham DJ, Round JM, Tolfree SEJ. Experimental human muscle damage: morphological changes in relation to other indices of damage. J Physiol. 1986;375:435–448. doi: 10.1113/jphysiol.1986.sp016126. [DOI] [PMC free article] [PubMed] [Google Scholar]
- Langley B, Thomas M, Bishop A, Sharma M, Gilmour S, Kambadur R. Myostatin inhibits myoblast differentiation by down-regulating MyoD expression. J Biol Chem. 2002;277:49831–49840. doi: 10.1074/jbc.M204291200. [DOI] [PubMed] [Google Scholar]
- Lieber RL, Blevins FT. Skeletal muscle architecture of the rabbit hindlimb: functional implications of muscle design. J Morphol. 1989;199:93–101. doi: 10.1002/jmor.1051990108. [DOI] [PubMed] [Google Scholar]
- Lieber RL, Bodine SC, Burkholder TJ, Pierotti DJ, Ryan AF. Cloning and in situ hybridization of type 2A and 2B rat skeletal muscle myosin tail region: implications for filament assembly. Biochem Biophys Res Comm. 1993;197:1312–1318. doi: 10.1006/bbrc.1993.2620. [DOI] [PubMed] [Google Scholar]
- Lieber RL, Fridén J. Selective damage of fast glycolytic muscle fibers with eccentric contraction of the rabbit tibialis anterior. Acta Physiol Scand. 1988;133:587–588. doi: 10.1111/j.1748-1716.1988.tb08446.x. [DOI] [PubMed] [Google Scholar]
- Lieber RL, McKee-Woodburn T, Fridén J. Muscle damage induced by eccentric contractions of 25 % strain. J Appl Physiol. 1991;70:2498–2507. doi: 10.1152/jappl.1991.70.6.2498. [DOI] [PubMed] [Google Scholar]
- Lieber RL, Schmitz MC, Mishra DK, Fridén J. Contractile and cellular remodeling in rabbit skeletal muscle after cyclic eccentric contractions. J Appl Physiol. 1994;77:1926–1934. doi: 10.1152/jappl.1994.77.4.1926. [DOI] [PubMed] [Google Scholar]
- Lieber RL, Thornell L-E, Fridén J. Muscle cytoskeletal disruption occurs within the first 15 min of cyclic eccentric contraction. J Appl Physiol. 1996;80:278–284. doi: 10.1152/jappl.1996.80.1.278. [DOI] [PubMed] [Google Scholar]
- Lieber RL, Yeh Y, Baskin RJ. Sarcomere length determination using laser diffraction. Effect of beam and fiber diameter. Biophys J. 1984;45:1007–1016. doi: 10.1016/S0006-3495(84)84246-0. [DOI] [PMC free article] [PubMed] [Google Scholar]
- Lynn R, Morgan DL. Decline running produces more sarcomeres in rat vastus intermedius muscle fibers than does incline running. J Appl Physiol. 1994;77:1439–1444. doi: 10.1152/jappl.1994.77.3.1439. [DOI] [PubMed] [Google Scholar]
- McCully KK, Faulkner JA. Injury to skeletal muscle fibers of mice following lengthening contractions. J Appl Physiol. 1985;59:119–126. doi: 10.1152/jappl.1985.59.1.119. [DOI] [PubMed] [Google Scholar]
- McMahon CD, Popovic L, Oldham JM, Jeanplong F, Smith HK, Kambadur R, Sharma M, Maxwell L, Bass JJ. Myostatin-deficient mice lose more skeletal muscle mass than wild-type controls during hindlimb suspension. Am J Physiol Endocrinol Metab. 2003;285:E82–87. doi: 10.1152/ajpendo.00275.2002. [DOI] [PubMed] [Google Scholar]
- McPherron AC, Lawler AM, Lee SJ. Regulation of skeletal muscle mass in mice by a new TGF-beta superfamily member. Nature. 1997;387:83–90. doi: 10.1038/387083a0. [DOI] [PubMed] [Google Scholar]
- Megeney LA, Kablar B, Garrett K, Anderson JE, Rudnicki MA. MyoD is required for myogenic stem cell function in adult skeletal muscle. Genes Dev. 1996;10:1173–1183. doi: 10.1101/gad.10.10.1173. [DOI] [PubMed] [Google Scholar]
- Megeney LA, Rudnicki MA. Determination versus differentiation and the MyoD family of transcription factors. Biochem Cell Biol. 1995;73:723–732. doi: 10.1139/o95-080. [DOI] [PubMed] [Google Scholar]
- Milner DJ, Weitzer G, Tran D, Bradley A, Capetanaki Y. Disruption of muscle architecture and myocardial degeneration in mice lacking desmin. J Cell Biol. 1996;134:1255–1270. doi: 10.1083/jcb.134.5.1255. [DOI] [PMC free article] [PubMed] [Google Scholar]
- Morgan DL. New insights into the behavior of muscle during active lengthening. Biophys J. 1990;57:209–221. doi: 10.1016/S0006-3495(90)82524-8. [DOI] [PMC free article] [PubMed] [Google Scholar]
- Periasamy M, Wydro RM, Strehler-Page MA, Strehler EE, Nadal-Ginard B. Characterization of cDNA and genomic sequences corresponding to an embryonic myosin heavy chain. J Biol Chem. 1985;260:15856–15862. [PubMed] [Google Scholar]
- Powell PL, Roy RR, Kanim P, Bello M, Edgerton VR. Predictability of skeletal muscle tension from architectural determinations in guinea pig hindlimbs. J Appl Physiol. 1984;57:1715–1721. doi: 10.1152/jappl.1984.57.6.1715. [DOI] [PubMed] [Google Scholar]
- Proske U, Morgan DL. Muscle damage from eccentric exercise: mechanism, mechanical signs, adaptation and clinical applications. J Physiol. 2001;537:333–345. doi: 10.1111/j.1469-7793.2001.00333.x. [DOI] [PMC free article] [PubMed] [Google Scholar]
- Rudnicki MA, Braun T, Hinuma S, Jaenisch R. Inactivation of MyoD in mice leads to up-regulation of the myogenic HLH gene Myf-5 and results in apparently normal muscle development. Cell. 1992;71:383–390. doi: 10.1016/0092-8674(92)90508-a. [DOI] [PubMed] [Google Scholar]
- Sacks RD, Roy RR. Architecture of the hindlimb muscles of cats: functional significance. J Morphol. 1982;173:185–195. doi: 10.1002/jmor.1051730206. [DOI] [PubMed] [Google Scholar]
- Sam M, Shah S, Fridén J, Milner DJ, Capetanaki Y, Lieber RL. Desmin knockout muscles generate lower stress and are less vulnerable to injury compared to wildtype muscles. Am J Physiol. 2000;279:C1116–1122. doi: 10.1152/ajpcell.2000.279.4.C1116. [DOI] [PubMed] [Google Scholar]
- Stauber WT, Fritz VK, Vogelbach DW, Dahlmann B. Characterization of muscles injured by forced lengthening. I. Cellular infiltrates. Med Sci Sports Exerc. 1988;20:345–353. doi: 10.1249/00005768-198808000-00004. [DOI] [PubMed] [Google Scholar]
- Talbot JA, Morgan DL. Quantitative analysis of sarcomere non-uniformities in active muscle following a stretch. J Muscle Res Cell Motil. 1996;17:261–268. doi: 10.1007/BF00124247. [DOI] [PubMed] [Google Scholar]
- Talbot JA, Morgan DL. The effects of stretch parameters on eccentric exercise-induced damage to toad skeletal muscle. J Muscle Res Cell Motil. 1998;19:237–245. doi: 10.1023/a:1005325032106. [DOI] [PubMed] [Google Scholar]
- Wang K, Ramirez-Mitchell R. A network of transverse and longitudinal intermediate filaments is associated with sarcomeres of adult vertebrate skeletal muscle. J Cell Biol. 1983;96:562–570. doi: 10.1083/jcb.96.2.562. [DOI] [PMC free article] [PubMed] [Google Scholar]
- Warren GL, Ingalls CP, Shah SJ, Armstrong RB. Uncoupling of in vivo torque production from EMG in mouse muscles injured by eccentric contractions. J Physiol. 1999;515:609–619. doi: 10.1111/j.1469-7793.1999.609ac.x. [DOI] [PMC free article] [PubMed] [Google Scholar]
- Warren GL, Lowe DA, Hayes DA, Karwoski CJ, Prior BM, Armstrong RB. Excitation failure in eccentric contraction-induced injury of mouse soleus muscle. J Physiol. 1993;468:487–499. doi: 10.1113/jphysiol.1993.sp019783. [DOI] [PMC free article] [PubMed] [Google Scholar]
- Weibel ER. Stereological Methods. New York: Blackwell Science Inc; 1980. Practical methods for biological morphometry. [Google Scholar]
- Weiss A, Schiaffino S, Leinwand LA. Comparative sequence analysis of the complete human sarcomeric myosin heavy chain family: implications for functional diversity. J Mol Biol. 1999;290:61–75. doi: 10.1006/jmbi.1999.2865. [DOI] [PubMed] [Google Scholar]
- Whitehead NP, Allen TJ, Morgan DL, Proske U. Damage to human muscle from eccentric exercise after training with concentric exercise. J Physiol. 1998;512:615–620. doi: 10.1111/j.1469-7793.1998.615be.x. [DOI] [PMC free article] [PubMed] [Google Scholar]
- Yu JG, Malm C, Thornell LE. Eccentric contractions leading to DOMS do not cause loss of desmin nor fibre necrosis in human muscle. Histochem Cell Biol. 2002;118:29–34. doi: 10.1007/s00418-002-0423-1. [DOI] [PubMed] [Google Scholar]