

Abstract
How fatty acids stimulate enteroendocrine cells to release cholecystokinin (CCK) is largely unknown. Recently, we proposed that the murine enteroendocrine cell line, STC-1, responds to insoluble fatty acid aggregates rather than fatty acid monomers in solution. This hypothesis led to two testable predictions. First, other insoluble particles of similar size but unrelated to fatty acid may be able to stimulate STC-1 cells in a similar fashion to dodecanoic acid and second, fatty acid sensing in STC-1 cells should be fairly insensitive to chemical modifications of the fatty acid as long as these modifications do not greatly alter the ability of the molecule to form insoluble aggregates. We used several analogues of dodecanoic acid and several varieties of latex microsphere (varying in size and surface charge) to see whether the predictions of our model hold. We found that while there was at least one latex microsphere that could induce CCK secretion and calcium mobilisation in STC-1 cells, there was a very poor correlation between the presence of insoluble aggregates and a cellular response. Instead the most important property, determining the potency of fatty acid analogues as stimulants of CCK secretion, was their amphipathicity. Removal of either the polar head or lipophilic tail completely abolished the ability of a given fatty acid analogue to stimulate STC-1 cells. These data suggested that while fatty acids can stimulate cells as aggregates, they may also be acting in monomeric form with the oil:water partitioning coefficient playing a crucial role. We finally resolved this issue with the observation that the sulfate ion greatly altered the response of STC-1 cells to monomeric dodecanoic acid. In the presence of sulfate, STC-1 cells will only respond to dodecanoic acid aggregates whereas when sulfate is replaced with chloride the cells clearly respond to dodecanoic acid monomers which are completely in solution. In summary, we propose that dodecanoic acid can stimulate STC-1 cells via two separate pathways one involving fatty acid monomers in solution and one involving fatty acid aggregates. Which pathway dominates depends on the presence of sulfate in the extracellular medium.
The digestion and absorption of fat in the gut presents a major challenge because medium- and long-chain fatty acids are insoluble in aqueous solutions (Vorum et al. 1992). In response to this challenge, fatty acids in the gut elicit several distinct regulatory responses which include: a delay in gastric emptying, stimulation of pancreatic secretion and gall bladder emptying, and the onset of satiety (Liddle, 1997). Collectively, these responses help optimise the absorption of fatty acids by allowing them to be effectively solubilised and presented to the enterocytes for absorption (Raybould, 1999). Central to these effects is the gut hormone cholecystokinin (CCK) which is released from enteroendocrine cells when they are exposed to fatty acids and largely mediates the regulatory responses described above (Liddle, 1995; McLaughlin et al. 1999). The signal transduction pathway for fatty acid-induced CCK secretion in enteroendocrine cells involves Ca2+ mobilisation (McLaughlin et al. 1998; Sidhu et al. 2000) but it is not known whether signal transduction begins at the cell surface or intracellularly. Because fatty acids rapidly cross the cell membrane, an intracellular receptor or channel stimulated by fatty acids or a fatty acid metabolite(s) cannot be eliminated (Sidhu et al. 2000).
Fatty acid-induced CCK secretion is dependent on chain length; only test meals which contain fatty acids with a chain length of greater than 11 carbon atoms induce CCK secretion in human volunteers (McLaughlin et al. 1999). This chain length dependency is also observed in enteroendocrine cell line models, namely STC-1 cells (McLaughlin et al. 1998; Sidhu et al. 2000) and GLUTag cells (Sidhu et al. 2000). This dependency suggests that the detection mechanism for free fatty acids is sensitive to the chemical structure of the molecule and hence may represent one or more specific fatty acid receptors. Indeed such a G-protein-coupled fatty acid receptor has recently been described (Itoh et al. 2003). Over-expression of this receptor resulted in cells that could respond to dodecanoic acid at a concentration of 5 μm, well below the solubility limit of the molecule. However, in STC-1 cells, one pathway for fatty acid signalling is driven by insoluble fatty acid aggregates rather than monomeric fatty acids in solution (Benson et al. 2002). This finding was based on filtering radiolabelled fatty acid solutions through polytetrafluoroethylene (PTFE) filters of various pore sizes and examining the concentration of fatty acid remaining in the filtrates and the ability of these filtrates to induce CCK secretion and Ca2+ mobilisation in STC-1 cells.
Our study however had important limitations. First, we could not be certain that the filters were removing only aggregates that were greater than the manufactured filter pore size, a major issue with fatty acids which are notorious for binding non-polar surfaces. Unfortunately, we could not check this because we were unable to determine with any accuracy the size of aggregates in filtrates. Second, the magnitude of CCK secretion and Ca2+ mobilisation varied with cell passage number with some cell passages being unable to respond to dodecanoic acid. Given these limitations, we began a series of studies to further clarify the model. First, we examined the effect of chemically modifying fatty acids on CCK secretion and Ca2+ mobilisation in STC-1 cells. Second, we investigated whether small particles, unrelated to fatty acid, can stimulate CCK secretion and/orCa2+ mobilisation. Third, we studied the influence of ionic composition of our fatty acid solution on the response of STC-1 cells to fatty acid.
Our data indicated that: (1) STC-1 cells were also able to respond to certain fatty acid analogues which were completely in solution; (2) STC-1 cells were able to respond to non-fat particulate material (a particular type of latex microsphere); (3) substituting MgSO4 for MgCl2 has a major effect on the ability of STC-1 cells to respond to fatty acid. Together these data suggest that dodecanoic acid can stimulate STC-1 cells by two distinct pathways involving fatty acid monomers in solution and/orinsoluble fatty acid aggregates, with the anion composition of the presenting solution playing a critical role in determining which pathway dominates.
METHODS
Cell culture consumables, Dulbecco's Modified Eagles Medium (DMEM), horse serum, fetal bovine serum and penicillin/ streptomycin were purchased from Gibco (Paisley, UK). Phosphate buffered saline (PBS) tablets were purchased from Oxoid (Basingstoke, Hampshire, UK). Saturated fatty acids including C8 (octadecanoic), C9 (nonanoic), C10 (decanoic), C11 (undecanoic), C12 (dodecanoic), C13 (tridecanoic) and C14 (tetradecanoic) acid, along with all the perfluoro analogues, 1,10-decane-dicarboxylic acid and 3-hydroxy-dodecanoic acid, were purchased from Sigma-Aldrich (Poole, Dorset, UK). Fatty acid analogues: 3-keto ethyldodecanoate, sodium undecane-sulfonate, dodecanamide, undecane-sulfonamide, perfluoro-dodecanoic and perfluoro-decanoic acid were synthesised in-house. Note that while compound 1-undecanesulfonic acid was synthesised in the salt form, the pH of the final solution used on STC-1 cells was not greater than 7.37. All other materials were obtained from either Sigma or BDH with the exception of Fura-2 AM and Pluronic F-127 which were obtained from Molecular Probes (Leiden, Netherlands), and latex microspheres, which were purchased from Interfacial Dynamics (Portland, Oregon, USA). A 50 mm stock solution of Bodipy labelled dodecanoic acid was prepared in ethanol. Nicardipine (Sigma) was dissolved in dimethyl sulfoxide (DMSO) to produce a stock concentration of 5 mm. Hepes buffered isotonic solution (pH 7.4) was prepared by dissolving (mm): 140 NaCl, 4.5 KCl, 10 Hepes acid, 10 Hepes salt, 1.2 CaCl2, 1.2 MgSO4 and 10 glucose. In some experiments MgSO4 was replaced by eqimolar MgCl2. For experiments carried out under calcium-free conditions, fatty acids were prepared in buffer from which Ca2+ was omitted and which contained 0.2 mm EGTA.
Preparation fatty acid solution
Stock solutions of dodecanoic acid, 3-hydroxy-dodecanoic acid, decanoic acid, perfluoro-decanoic acid, perfluoro octanoic acid, perfluoro heptanoic acid and dodecanamide were prepared in 100 % ethanol. 1,10-decanedicarboxylic acid and undecane-sulfonamide were prepared in DMSO. Sodium undecane-sulfonate was prepared in water. The concentration of each stock solution was such that the concentration of vehicle in the experimental solution never exceeded 0.1 %. Appropriate volumes of these solutions were added to the Hepes buffered solution (described above) so as to produce working solutions with a fatty acid concentration of 50 μm-600 μm. These solutions were sonicated (Soniprep 150, Sanyo, Herts, UK) at room temperature for 5 min prior to use. The pH of the solutions after sonication was measured to be between 7.25 and 7.35.
Tissue culture
STC-1 cells (kindly supplied by D. Hanahan, University of California, San Francisco 94143) were cultured as previously described (Sidhu et al. 2000). For fluorescence studies, STC-1 cells were plated at densities between 8 × 10⁴ and 1 × 10⁵ cells cm−2 on coverslips coated with 0.025 % w/vpoly-l-lysine in 24-well plates. Measurements of [Ca2+]i in STC-1 cells were carried out 24–72 h after seeding. Cell viability was estimated by trypan blue exclusion and was greater than 95 %.
Confocal microscopy
STC-1 cells were plated on 35 mm tissue culture dishes (Corning Costar Corp, Cambridge, MA, USA) at a density of 8 × 10⁴ cells cm−2 and used the following day. Prior to use, cells were washed three times and placed in 4 ml of Hepes buffered isotonic solution containing either 50 μm Bodipy-labelled dodecanoic acid or 0.01 % Nile red-labelled latex microsphere (Interfacial Dynamics, Portland Oregan, USA). The cells were then washed once in fresh isotonic saline solution. Dual photon laser confocal microscopy was performed acquiring simultaneously a blue (Hoechst) and red (Nile red) or green (Bodipy) signal. The cells were then examined with a dual photon scanning confocal microscope (Biorad MRC1024 MP confocal scanning head mounted on a Nikon Eclipse TE300 fluorescent microscope with tuneable 700–1080 nm Spectra Physics titanium sapphire laser) using a 20 × water immersion objective. A Z-series of images with step sizes between 2 and 10 μm was acquired 2 min after the initial exposure of STC-1 cells to the test solutions.
Latex particle and fatty acid analogue size determination
The mean, stated diameter of the latex microspheres used in our experiments had been determined by the manufacturer using electron microscopy. However, the size of the particles in a physiological buffered salt solution differs because, in the presence of divalent cations, aggregation of the microspheres can occur. Therefore the particle size distribution of aggregates of latex particles and fatty acid analogues was determined using a Coulter LS-230 (Beckman Coulter, High Wycombe, UK). Briefly this instrument can measure particles in solution with diameters between 0.04 μm and 2000 μm using enhanced laser diffraction (excitation 750 nm) and polarisation intensity differential scattering (PIDS). Fatty acid solutions (140 ml) were prepared as described above and each solution was then loaded into the sampling cell of the LS-230 instrument. Latex solutions were prepared by adding a small quantity of microspheres to the Hepes buffered isotonic solution used in the experiments. Addition of the latex microspheres to the buffered solution increased the obscuration of the laser light passing through the sample. Therefore the quantity of microspheres required for each measurement was determined by the obscuration which was required to be between 8 and 16 % (usually approximately 30 μl latex in 140 ml buffer). After addition of latex microspheres or fatty acid analogues, light scattering data were collected for 1 min. These data were then transformed to a size distribution using an optical model that is consistent with the refractive index of the latex microsphere (1.591) or olive oil (1.456).
Calcium imaging studies and measurement of CCK
[Ca2+]i in STC-1 cells was determined using dual-excitation fluorescence microscopy with the calcium-sensitive ratiometric dye fura-2 as previously described (Sidhu et al. 2000). Where appropriate, traces were calibrated using a two-point calibration of fura-2 fluorescence as described previously (Grynkiewicz et al. 1985). CCK was determined using a radioimmunoassay as previously described (McLaughlin et al. 1998).
Data analysis
All data are expressed as mean ±s.e.m. Unless otherwise stated statistical comparisons were made using an unpaired two-tailed t test with P values of less than 0.05 being considered significant. In experiments which measured the change in [Ca2+]i, a change greater than 5 nm was considered significant.
RESULTS
Our model for the stimulation of STC-1 cells by fatty acid aggregates makes two important predictions. First, chemical modifications of a fatty acid molecule should not greatly impair its ability to induce CCK secretion provided these modifications do not increase the solubility of the molecule in aqueous solutions and hence reduce its ability to aggregate. Second, a particle, which is completely unrelated to fatty acid, should stimulate CCK secretion and Ca2+ mobilisation provided that the size distribution of the particle is similar to that of fatty acid aggregates. Both these predictions are based on the hypothesis that the cell is stimulated by a physical interaction with the fatty acid aggregate rather than by the unique chemical structure of the fatty acid monomer. In the following study we have tested both these predictions using fatty acid analogues and latex microspheres.
Structural analogues of dodecanoic acid which resemble metabolites of β oxidation induce CCK secretion in STC-1 cells
The oxidation of fatty acids begins with attachment of coenzyme A to the carboxylic group. Thereafter, four reactions take place which effectively reduce the length of the fatty acid carbon chain by two. After oxidation and hydration, the intermediate metabolite produced is l-hydroxyacyl CoA. A second oxidation reaction results in the production of ketoacyl CoA. We synthesised two molecules which resembled these intermediates; 3-hydroxydodecanoic acid (Fig. 1B) and ethyl (3-keto dodecanoate) (Fig. 1C). Both these compounds induced significant CCK secretion in STC-1 cells (Figs 2A and B). Given that these fatty acid metabolites can induce CCK secretion, we next examined whether the metabolism of dodecanoic acid was required for it to mediate its stimulatory effects in STC-1 cells using 2-bromododecanoic acid (Fig. 1D). In agreement with our previous work, which examined the effect of 2-bromododecanoic acid on [Ca2+]i (Sidhu et al. 2000), we found that this non-metabolisable form of dodecanoic acid was able to induce CCK secretion. In keeping with its ability to induce a larger change in [Ca2+]i than decanoic acid (Sidhu et al. 2000) it also induced greater CCK secretion than dodecanoic acid (Fig. 2C). Collectively these data confirm that the signal transduction pathway for fatty acid-induced CCK secretion is not very sensitive to the precise structure of the fatty acid molecule as both molecules which resemble fatty acid metabolites and a non-metabolisable form of dodecanoic acid are able to induce CCK secretion in STC-1 cells.
Figure 1. Fatty acid structures used in this study.

The structure of the various fatty acid analogues used in this study. In general three types of modifications were made. First, changes to the acyl chain adjacent to the carboxyl group were made by the addition of functional groups such as the hydroxyl group (B), ketone group (C), bromine (D) or the substitution of hydrogen for fluorine (I). Second, changes to the carboxylic end including substitution with a sulfonyl group (E), an amide group (F), or a combination of the two (G). Third, changes to the methyl end with the addition of a second carboxylic group (H).
Figure 2. The effect of various chemical modifications on fatty acid-induced CCK secretion.
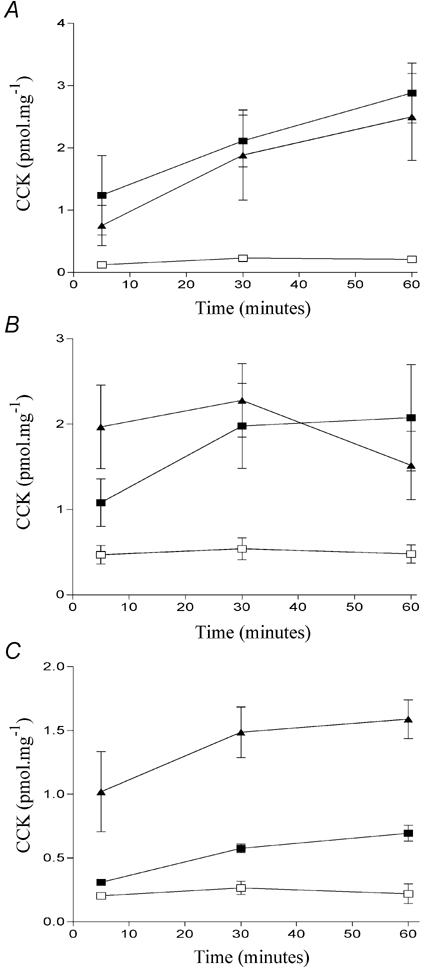
Comparison of the ability of dodecanoic acid (▪), fatty acid analogues (▴) and the ethanol vehicle control (□) to induce CCK secretion in STC-1 cells. The amount of CCK secreted into the medium was determined by radioimmunoassay (see Methods). To control for differences in plating densities, CCK values were normalised against total cellular protein (pmol mg−1). The fatty acid analogues tested were 3-hydroxydodecanoic acid (A) ethyl(3-keto dodecanoate) (B) or 2- bromododecanoic acid (C). Each data point represents the mean ±s.e.m. of three experiments for A and C and four experiments for B.
The amphipathic nature of fatty acid is necessary property for the induction of CCK secretion in STC-1 cells
Given that changes to the acyl chain adjacent to the carboxylic group seem to make little difference in the ability of a fatty acid to induce CCK secretion in STC-1 cells, we next explored the effect of altering either the polar head group or the lipophilic tail of dodecanoic acid. Three compounds were tested. First, the charge density of the polar head was increased by substituting the carboxyl group with a sulfonate group. Unlike dodecanoic acid, undecane sulfonic acid sodium salt (Fig. 1E) was completely soluble in aqueous solution. Nevertheless, it was able to induce significant CCK secretion in STC-1 cells, being very similar in action to dodecanoic acid (Fig. 3A). By contrast removal of the acidic proton from the head group by substituting the carboxyl group with an amide group to produce dodecanamide (Fig. 1F) abolished any fatty acid-induced CCK secretion (Fig. 3B). When both substitutions were made, the resulting sulfonamide (Fig. 1G) appeared to cause a slight increase in the amount of CCK secreted at 60 min but this was not significant (P = 0.3; one way ANOVA) (Fig. 3B). The removal of the lipophilic tail by the addition of a second polar head group prevents the resulting analogue, 1,10-decanedicarboxylic acid (Fig. 1H), from evoking CCK secretion (Fig. 4A), even at increased concentrations (600 μm) (Fig. 4B).
Figure 3. The effect of altering the either the polar head or lipophilic tail on fatty acid-induced CCK secretion.

Comparison of the ability of dodecanoic acid (▪), undecanesulfonic acid (▴; A), dodecanamide (▴; B) or 1-undecanesulfonamide (♦; B) to induce CCK secretion in STC-1 cells exposed for up to 60 min with each fatty acid or to the ethanol vehicle control (□). Determination of CCK secretion is described in Fig. 2. Each data point represents the mean ±s.e.m. of four and five experiments for A and B, respectively.
Figure 4. The effect of adding a second polar head group on fatty acid-induced CCK secretion.
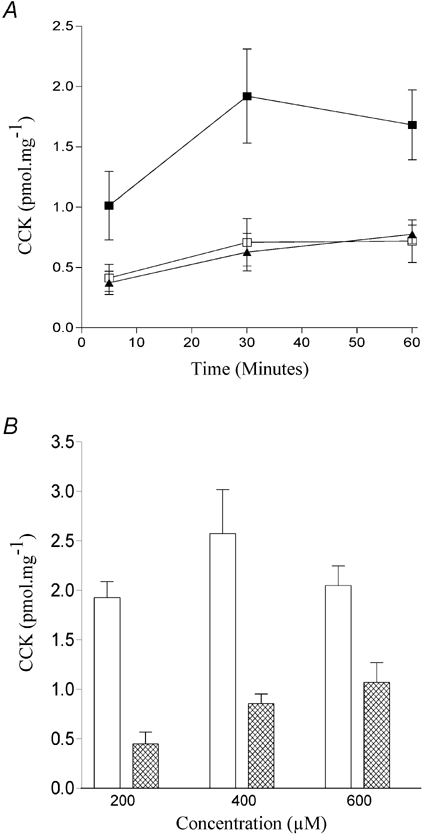
Comparison of the ability of dodecanoic acid (▪) and 1,10-decanedicarboxylic acid (▴) to induce CCK secretion in STC-1 cells exposed for up to 60 min (A) with each fatty acid or to the ethanol vehicle control (□). The potency of dodecanoic and 1,10-decanedicarboxylic acid (open and hatched columns, respectively, B) was also compared by examining CCK secretion from STC-1 cells after a 30 min exposure to fixed concentrations of the fatty acids. Determination of CCK secretion is described in Fig. 2. Each data point represents the mean ±s.e.m. of five experiments.
Substitution of hydrogen with fluorine on the acyl chain results in a molecule that can induce CCK secretion at shorter chain lengths
We next examined the effect of substituting hydrogen with fluorine. CCK secretion induced by 500 μm perfluorododecanoic acid (Fig. 1I) is shown in Fig. 5A. Like other analogues with modifications to the acyl backbone, perfluorododecanoic acid was able to induce CCK secretion in STC-1 cells. Indeed, it was equipotent with dodecanoic acid (Fig. 5B). We have previously observed a strong chain-length dependency for fatty acid-induced CCK secretion in both enteroendocrine cells (McLaughlin et al. 1998; Sidhu et al. 2000) and in human volunteers (McLaughlin et al. 1999). With the perfluoro-fatty acids, the chain length dependency was shifted, such that shorter chain perfluoro-compounds were able to induce CCK secretion (Fig. 5C). Thus, both perfluoro-octanoic acid and perfluoro-heptanoic acid were able to induce CCK secretion, with the amount of CCK secreted being correlated to perfluoro-chain length, whereas neither heptanoic nor octanoic acids were able to evoke significant CCK secretion.
Figure 5. The effect of other modifications on fatty-acid induced CCK secretion.
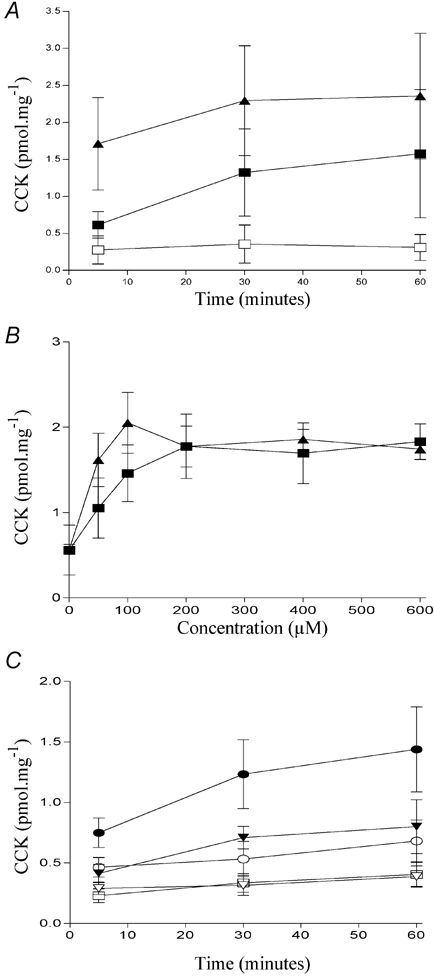
Comparison of the ability of dodecanoic acid (▪) and perfluorododecanoic acid (▴) to induce CCK secretion in STC-1 cells exposed for up to 60 min (A) with each fatty acid or to the ethanol vehicle control (□). The potency of each fatty acid was determined by exposing STC-1 cells to various concentrations (0–600 μm) for 30 min (B). The effect of shorter chain perfluoro fatty acids on CCK secretion in STC-1 cells is shown in C. STC-1 cells were exposed for up to 60 min with heptanoic acid (▿); octanoic acid (○); perfluoro heptanoic acid (▾); perfluoro octanoic acid (•) or to an ethanol vehicle control (□). Determination of CCK secretion is described in Fig. 2. Each data point represents the mean ±s.e.m. of four experiments.
There is a poor correlation between the presence of insoluble fatty acid aggregates and CCK secretion
As described in the Introduction, we have good evidence that, in the case of natural fatty acids, STC-1 cells respond to fatty acid aggregates rather than to fatty acids in solution. We therefore wanted to examine whether the ability of the fatty acid analogues to induce CCK secretion was also dependent on the presence of fatty acid aggregates.
We found that while the dodecanoic acid solution clearly contained aggregates in the range of 0.1 μm (Fig. 6A), not all the fatty acid analogue solutions capable of inducing CCK secretion, contained aggregates in this range. Of those analogues which did induce CCK secretion, 3-hydroxy-dodecanoic had the most similar profile to dodecanoic acid (continuous line; Fig. 6B). The solution of ethyl (3-keto dodecanoate) acid contained aggregates with a modal diameter which was greater than dodecanoic acid (30 μm versus 10 μm, respectively) but also contained particles of smaller diameters (0.1-3 μm). These overlap the smaller peak observed with dodecanoic acid which has a mode of approximately 0.3 μm (Fig. 6A). Solutions of 2-bromododecanoic acid contained no aggregates greater than 3 μm (Fig. 7A) but showed three distinct peaks at 0.09 μm, 0.25 μm and 1.8 μm. While these peaks are all less than the main peak observed with dodecanoic acid, they still overlap the smaller peak observed with dodecanoic acid.
Figure 6. Determination of fatty acid aggregate size in Hepes-buffered isotonic saline solution containing divalent cations.
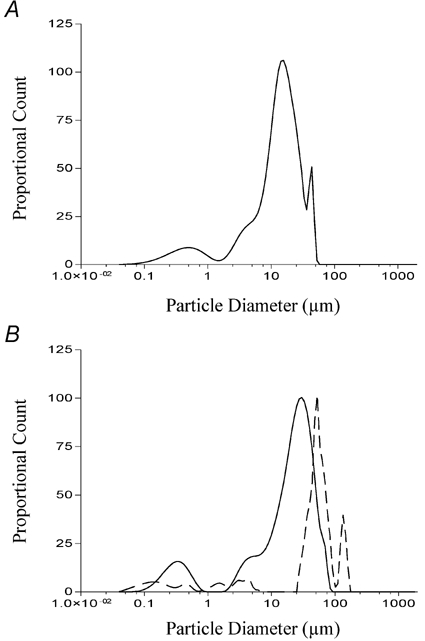
Dodecanoic acid (A), 3-hydroxydodecanoic acid (B; continuous line) and ethyl-keto dodecanoic acid (B; dashed line) were prepared as described in Methods and sonicated for 5 min. Each solution was then placed into the measuring container of an LS-230 laser diffraction instrument and the diffraction pattern of light measured for 30 s. The particle diameter is shown on the abscissa. The ordinate represents an arbitrary number derived from an optical model fit of the diffracted light detected by each sensor in the instrument. Each measurement was performed in triplicate.
Figure 7. Determination of fatty acid aggregate size in Hepes-buffered isotonic saline solution containing divalent cations.
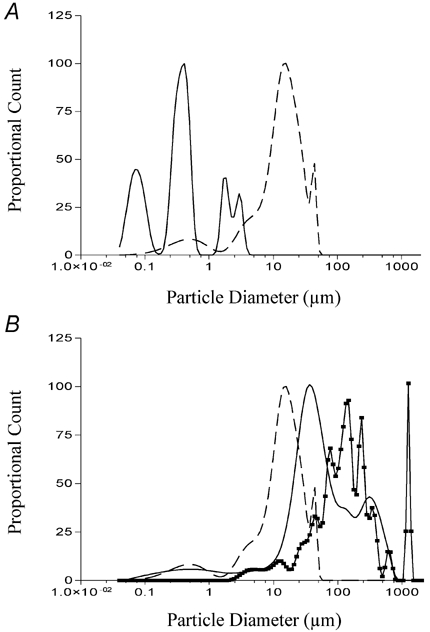
2-Bromododecanoic acid (A; continuous line), dodecanamide (B; continuous line) and 1-undecanesulfonamide (B; continuous line with data points) were prepared as described in methods and sonicated for 5 min. The size distribution of each solution was then determined as described in Fig. 6. The size distribution for dodecanoic acid is shown in each panel as a dashed line for comparison.
Of the three fatty acid analogues which did not evoke CCK secretion, only 1,10-decanedicarboxylic acid formed no measurable aggregates in solution. In contrast, both dodecanamide (continuous line; Fig. 7B) and 1-undecanesulfonamide (continuous line with data points; Fig. 7B) contained aggregates. The peaks for these two solutions were greater than dodecanoic acid although dodecanamide did possess a measurable number of aggregates from 0.09 to 10 μm while dodecanesulfonamide did not possess any measurable aggregates below 2 μm. Finally, particle sizing of 1-undecanesulfonic acid and the perfluoro-fatty acids revealed the absence of any measurable particles in the range of 0.04-2000 μm. Collectively these data suggest that the presence or absence of particles between 0.04 and 2000 μm does not influence whether a given compound can induce CCK secretion in STC-1 cells. These data contrast with our filtering work (Benson et al. 2002) which suggests that STC-1 cells are responding to dodecanoic acid aggregates which are greater than the monomeric size of the molecule but probably less than 0.45 μm.
Fatty acid-induced CCK secretion is always associated with a change in [Ca2+]i in STC-1 cells
Given that many of the fatty acid analogues we synthesised were able to induce CCK secretion, we examined whether, like dodecanoic acid, they were also able to induce a rise in [Ca2+]i in STC-1 cells. We especially focused on those analogues which, although they do not form aggregates, nonetheless induce CCK secretion. Figure 8A shows a Ca2+ trace from STC-1 cells exposed first to 1,10-decanedicarboxylic acid and then dodecanoic acid. Consistent with its inability to induce CCK secretion, 1,10-decanedicarboxylic acid caused no change in [Ca2+]i. By contrast, both dodecanoic acid (Fig. 8A) and 2-bromododecanoic acid (Fig. 8B) caused a peak elevation in [Ca2+]i which then fell to a plateau before returning to basal conditions upon removal of the fatty acid stimulus. With 2-bromododecanoic acid the return to resting [Ca2+] concentration was sometimes delayed, as is apparent in Fig. 8B. Likewise, 3-hydroxydodecanoic acid (Fig. 9A), perfluoro-octanoic acid (Fig. 9B) and 1-undecanesulfonic acid (Fig. 9C) all produced changes in [Ca2+]i consistent with their ability to induce significant CCK secretion from STC-1 cells. Furthermore, octanoic acid, which does not induce CCK secretion did not induce a rise in [Ca2+]i (Fig. 9B; middle dose bar). These data further suggest a strong link between the ability of a fatty acid to mobilise Ca2+ and its ability to evoke CCK secretion.
Figure 8. The effect of various chemical modifications on fatty acid-induced Ca2+ mobilisation.
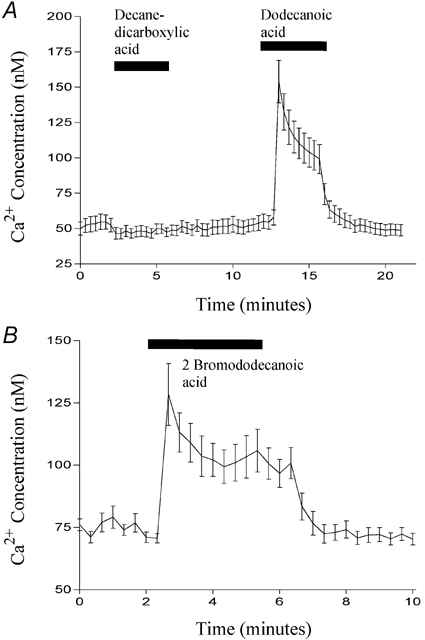
The effect of 500 μm decanedicarboxylic acid (first bar; A), dodecanoic acid (second bar; A) or 2-bromododecanoic acid (bar; B) on [Ca2+]i (nm) in STC-1 cells. Cells were exposed to each fatty acid for 3 min. Fluorescent images were acquired every 20 s and cells were identified using global thresholding to create a binary image which was applied to the ratio images to identify the regions of interest. The ratio for each region was calculated and all the regions were then averaged to give a mean ±s.e.m. fluorescence ratio for all cells present in the field. This was then converted to a Ca2+ concentration (nm) using standard calibration techniques (see Methods) and plotted on the ordinate. The number of cells which make up each mean is 14 (A) and 15 (B) and these figures are representative of at least four other experiments.
Figure 9. The effect of various chemical modifications on fatty acid-induced Ca2+ mobilisation.
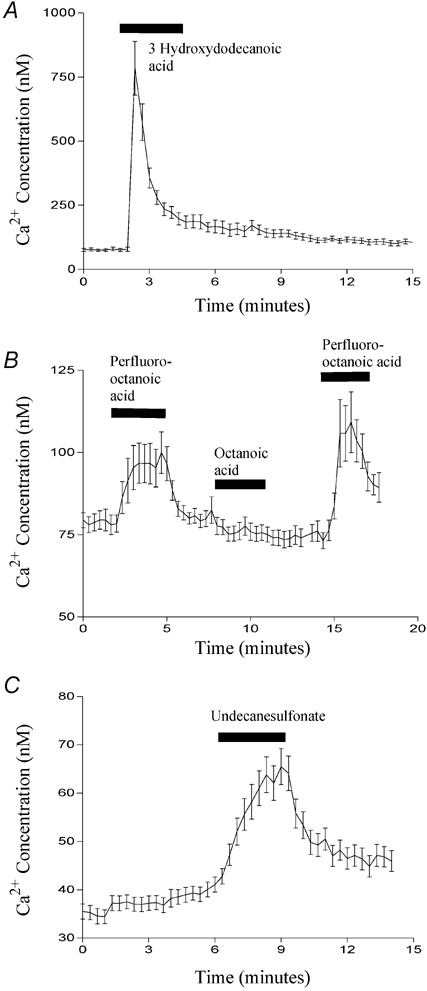
The effect of 500 μm 3-hydroxydodecanoic acid (A), 500 μm perfluoro-fatty acids (B) and 500 μm 1-undecanesulfonic acid (C) on [Ca2+]i in STC-1 cells. Cells were exposed to each fatty acid for 3 min. In B, cells were exposed to perfluoro-octanoic acid (first bar), octanoic acid (second bar) and perfluoro-octanoic acid a second time (third bar). Fluorescent images were acquired and processed as described in Fig. 8. The number of cells that make up each mean is 12 (A), 13 (B) and 14 (C) and these figures are representative of three other experiments.
Inert particles can induce CCK secretion and Ca2+ mobilisation
Taken together, the data alone suggest that the ability of a fatty acid analogue to induce CCK secretion and Ca2+ mobilisation in STC-1 cells is poorly correlated with its ability to form aggregates. We therefore exposed STC-1 cells to several compounds which would be expected to form particles of a known size in an aqueous solution in order to clarify whether particulates really can stimulate STC-1 cells. In the first instance we used polymers which would be much smaller than our smallest filter pore size (0.2 μm) but larger than the monomeric size of dodecanoic acid (≈2 nm). Our reason for testing particles in this size range was to control for the possibility that the filters were removing fatty acid aggregates of a smaller diameter than the manufactured filter pore size.
In the first series of experiments we tested a polyamidoamine dendrimer with carboxylic surface groups known generically as ‘starburst’, which has an average diameter of 5 nm, and Buckminsterfullerene which is a sphere of 60 carbon atoms and has an average diameter of 0.7 nm. Neither of these compounds induced CCK secretion (Fig. 10A), indicating that cells do not respond to small inert polymers which are in the 0.7-5 nm range. We then examined several larger latex microspheres, each of defined size and surface charge as described in Table 1. Latex microspheres with different charges were selected in order to address whether surface charge played a role in the ability of particles to stimulate enteroendocrine cells. In general, the latex microspheres also were unable to stimulate STC-1 cells. However, two microspheres evoked significant CCK secretion at 60 min: in one case CCK secretion was greater than 50 % of that induced by an optimal concentration of dodecanoic acid (Fig. 10B). The two microspheres which induced CCK secretion were also able to induce changes in [Ca2+]i (‘P1′ and ‘P3′ in Fig. 10C) while those which did not induce CCK secretion also failed to induce a change in [Ca2+]i (‘P2′, Fig. 10C). Like dodecanoic acid itself, changes in [Ca2+]i, induced by P1, were also attenuated by L-type Ca2+-channel inhibition. When changes in [Ca2+]i, induced by dodecanoic acid or P1 were normalised to 100 %, the addition of the L-type Ca2+ channel inhibitor, nicardipine, resulted in a reduction of 77.1 ± 5.0 % (mean ±s.e.m., n = 5) and 73.7 ± 7.2 % (mean ±s.e.m., n = 4) for dodecanoic and P1-induced Ca2+ mobilisation, respectively.
Figure 10. The effect of various particulate compounds on CCK secretion in STC-1 cells.
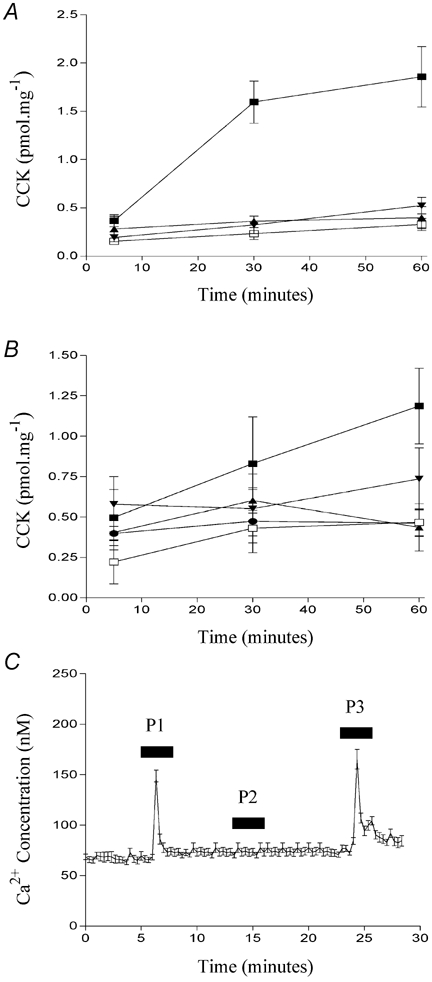
Compounds tested (A) were: C,O,H dendrimer (1 %) known as ‘starburst generation 4.5′ (▴); 1 mm Buckminsterfullerene (C60) (▾); dodecanoic acid (▪); vehicle control (□) and latex microspheres (B) of various size (mean microsphere diameter) and surface charge (μC cm−2): 280 nm, −27.8 μC cm−2 (•); 150 nm −12.7 μC cm−2 (▴); 93 nm, −67.4 μC cm−2 (▾); 112 μm, −0.1 μC cm−2 (▪) and vehicle control (□). The data points represent the mean ±s.e.m. of four experiments. In C, the effect of three different latex microspheres on [Ca2+]i in STC-1 cells is shown. The microspheres tested were of the following size and surface charge: 112 μm, −0.1 μC cm−2 (P1); 300 nm, −85.2 μC cm−2 (P2) and 18.5 μm, −1.2 μC cm−2 (P3). Fluorescent images were acquired and processed as described in Fig. 8. The number of cells which make up this mean is 20 and this figure is representative of three other experiments.
Table 1.
Summary of the different latex microspheres tested on STC-1 cells
| Mean particle | Measured | ||
|---|---|---|---|
| Microsphere | diameter | Surface charge | mean diameter |
| (μm) | (μC cm−2) | (μm) | |
| 1 | 0.092 | −0.1 | 112 |
| 2 | 0.32 | −1.2 | 18.5 |
| 3 | 0.22 | −0.9 | 0.25 |
| 4 | 0.22 | −12.7 | 0.15 |
| 5 | 0.3 | −85.2 | 0.3 |
| 6 | 0.12 | −67.4 | 0.093 |
| 7 | 0.4 | −27.8 | 0.28 |
| 8 | 0.017 | −1.2 | 11.6 |
| 9 | 0.027 | 4 | 13.2 |
| 10 | 0.13 | 8 | 2.4 |
| 11 | 0.12 | 3.9 | 6.2 |
| 12 | 0.069 | 1.6 | 0.35 |
| 13 | 0.14 | −3.4 | 0.19 |
| 14 | 0.97 | −114 | 0.83 |
| 15 | 9.7 | −54.3 | 9 |
The table shows the surface charge in μC cm−2 and the mean particle diameter determined by the manufacturer using electron microscopy (column 2) and by us using laser light scatter (column 3).
Sizing microspheres
Although the mean diameter of each sample of microsphere is known (determined by electron microscopy), their size under experimental conditions was unknown. Similarly it is also important to know the range of aggregate sizes which constitute that mean diameter when the particles are suspended in the various test solutions used in our experiments. In order to address this issue we used laser light diffraction measurements to determine the size and distribution of each latex particle in the aqueous solution to which the cell was exposed.
These data are shown in Fig. 11 and demonstrate clearly the effect of microsphere charge on particle aggregation in the test solutions. Microspheres which possess a high surface charge tend to remain as monomers so that their diameter in solution matched their diameter measured by electron microscopy. Consequently, the variation in mean diameter was discrete; there was only one peak width matching the supplier's stated diameter (Fig. 11A). Microspheres that possess a low surface charge tended to aggregate. Because aggregation forms particles of different sizes, the variation in the diameters of microsphere aggregates was larger, often resulting in one or more peaks (Fig. 11B). This also meant that the measured mean diameter for these particles in solution was much greater than the supplier's stated diameter (Table 1 and Fig. 11B and C). While the monomeric microspheres were unable to induce CCK secretion, some of those that aggregated were able to induce secretion amounting to between 20 and 40 % of that induced by dodecanoic acid. Only one microsphere aggregate was able to induce CCK secretion of a similar magnitude (approximately 60 %) to that induced by dodecanoic acid. Its size distribution was the widest of those measured and contained the largest aggregate size (mean diameter 100 μm; Fig. 11C). The inverse correlation between surface charge and mean diameter of the microsphere in solution (Fig. 12A) meant that surface charge was also inversely correlated with the ability of the microsphere to induce CCK secretion (Fig. 12B) or Ca2+ mobilisation (Fig. 12C).
Figure 11. Determination of the size distribution of latex microspheres in a Hepes-buffered isotonic solution, containing divalent cations.
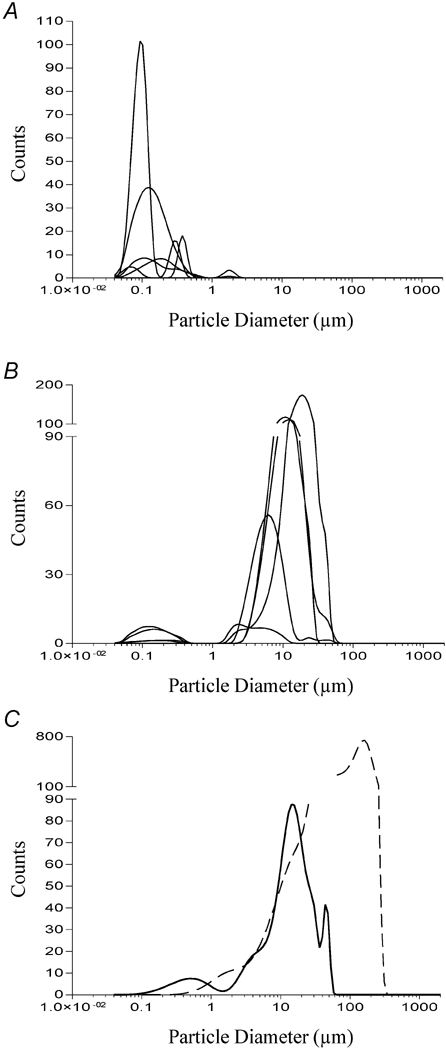
The particle size distributions were determined as described in Fig. 6 and have been divided into three graphs: A represents microspheres which do not aggregate and hence their size in solution is similar to the diameter measured by electron microscopy; B represents microspheres which do aggregate and so have a mean diameter in solution which is much greater than the diameter measured by electron microscopy; C represents the particle size distribution of dodecanoic acid solution (thick continuous line) and the microsphere which gave the highest CCK secretion values and induced the greatest change in [Ca2+]i (dashed line). This microsphere had a monomer diameter of only 92 nm and a surface charge of −0.1 μC cm−2.
Figure 12. The relationship between latex particle surface charge, particulate size and Ca2+ mobilisation.
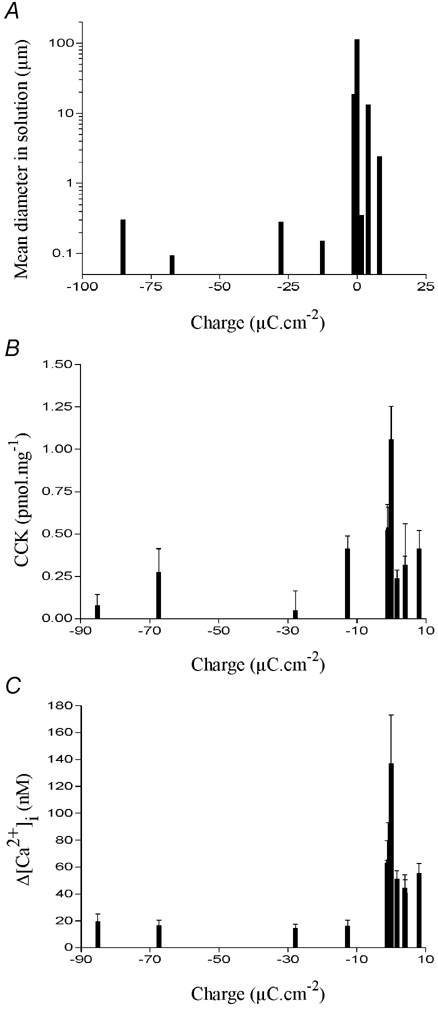
The effect of latex microsphere surface charge on the mean diameter of particles in an isotonic solution containing divalent cations (A). The surface charge is in μC cm−2 and was measured by the microsphere manufacturer. The effect of surface charge on CCK secretion (B) or change in [Ca2+]i (C) in STC-1 cells is also shown. For CCK secretion, STC-1 cells were exposed to each microsphere for 60 min and the data were analysed as described in Fig. 2. The change in [Ca2+]i was determined as described Fig. 8. Each data bar represents the mean ±s.e.m. of four experiments.
From these data it appeared that only microsphere aggregates that were much larger than 0.5 μm were able to induce CCK secretion. This is in conflict with our earlier filtering work with fatty acids which suggested that STC-1 cells were responding to fatty acid aggregates that were less than 0.45 μm. In order to clarify whether it is the larger particles per se which cause CCK secretion or whether the particle size in this system is a surrogate measure of surface charge, and it is this parameter which is important, we exposed STC-1 cells to two microspheres which had larger mean diameters (1 and 10 μm) but which were highly charged and so did not form aggregates in solution (Fig. 13A). We found that neither microsphere induced CCK secretion in STC-1 cells (Fig. 13B). Thus, only microspheres with the lowest surface charge were able to elicit a physiological response in STC-1 cells.
Figure 13. The size distribution of two highly charge latex particles.
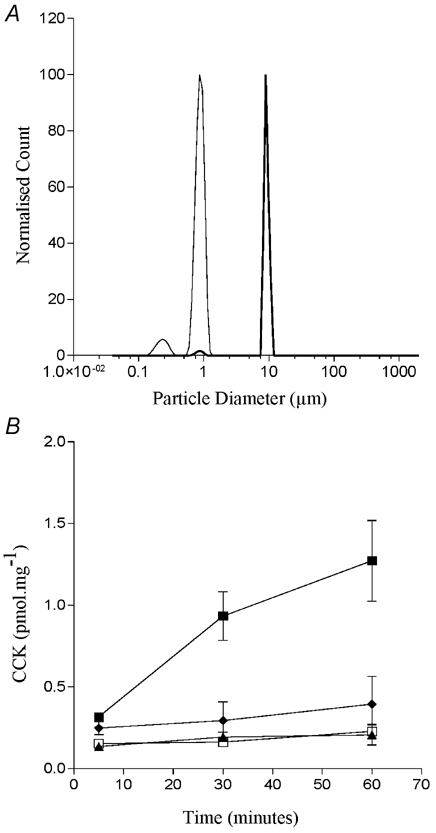
The size distribution of two highly charged microspheres in an isotonic solution containing divalent cations (A). The monomeric sizes of the microspheres are 9.7 μm (thick line) and 0.97 μm (thin line), respectively. The surface charge of the smaller microsphere is 114 μC cm−2 while the larger microsphere has a surface charge of 54.3 μC cm−2. B compares the ability of the 9.7 μm microsphere (▴), the 0.97 μm microsphere (♦) and 500 μm dodecanoic (▪) and an ethanol vehicle control (□) to induce CCK secretion from STC-1 cells. CCK secretion was measured and calculated as described in Fig. 2. Each data point represents the mean ±s.e.m. of three experiments.
Latex microspheres aggregate at the cell surface
Given that certain latex microspheres can induce CCK secretion and Ca2+ mobilisation, we examined by confocal microscopy the distribution of a fluorescently labelled microsphere that was able to induce Ca2+ mobilisation. The fluorescent micrograph showed that it was concentrated at the cell membrane (Fig. 14A). This is in contrast to dodecanoic acid (Fig. 14B) which has clearly entered the cytoplasm of the cells. These data suggest that microspheres are probably acting extracellularly on the cell surface.
Figure 14. The distribution of a fluorescently labelled latex microsphere in the presence of STC-1 cells.
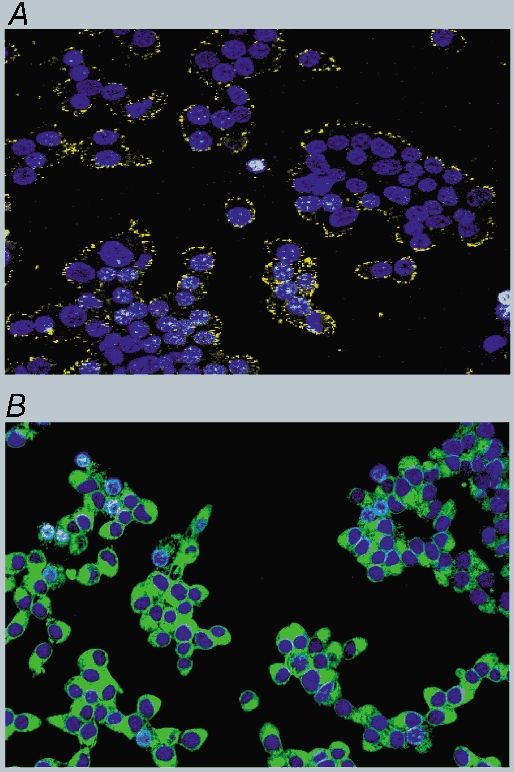
Confocal micrographs showing the distribution of Nile red-labelled latex microspheres (A) or Bodipy labelled dodecanoic acid (B). STC-1 cells were dual stained for 2 min with Hoechst 33342 (10 μm) and either Nile red-labelled latex microspheres (diameter in solution 0.19 μm) or Bodipy-labelled dodecanoic acid (50 μm). A confocal ‘Z-series’ was then acquired in 2 μm steps and the micrographs shown are towards the centre of the cell as judged by the nuclear stain (see Methods). These micrographs are representative of two other experiments.
Exchanging sulfate for chloride influences how STC-1 cells respond to dodecanoic acid
The caveat that PTFE filters can remove fatty acid monomers, together with the fatty acid analogue data described here suggest that fatty acid monomers can stimulate STC-1 cells directly. On the other hand, our previous observation that the efficacy of fatty acid filtrates to stimulate STC-1 cells decays with time and is abolished by sonication (Benson et al. 2002) together with our new finding that certain latex microspheres can stimulate STC-1 cells is strong evidence that enteroendocrine cells also respond to fatty acid aggregates. How can these two opposing views be reconciled? Depending upon the experimental conditions, can fatty acids act either through their aggregation or as monomers? Obviously a solution of fatty acid that contains aggregates will also contain monomers so it is difficult to completely untangle the two responses under these conditions. However, if STC-1 cells can respond to monomers then there should be a concentration where the cells will respond to fatty acid which is completely in solution. We previously showed that such a concentration does not exist (Sidhu et al. 2000) and this was mainly why we concluded that fatty acid monomers cannot stimulate STC-1 cells. However, we have serendipitously discovered that changing MgSO4 for MgCl2 has a major influence on how STC-1 cells responded to fatty acid.
First, the shape of the Ca2+ response in the absence of sulfate is greatly altered. Whereas cells respond with a transient mobilisation of Ca2+ in solutions containing sulfate (Fig. 15A), mobilisation is much more sustained when sulfate is removed (Fig. 15B). Second, the response in the absence of sulfate is much more robust with most cell preparations responding to fatty acid. This contrasts with the response observed in the presence of sulfate which is not present in all cell preparations (Fig. 15C) even when the same cells respond in the absence of sulfate (Fig. 15B). Third, STC-1 cells in the absence of sulfate are able to mobilise Ca2+ at much lower concentrations (50–100 μm) of dodecanoic acid (Fig. 15D). At these concentrations, dodecanoic acid is completely soluble so the fatty acid cannot be acting via an aggregate pathway. Furthermore, in agreement with our previous observations, we were never able to observe Ca2+ mobilisation in STC-1 cells stimulated with 70 μm dodecanoic acid (the solubility limit of this compound in our test solutions) in the presence of 1.2 mm sulfate (Fig. 15E). Finally, while STC-1 cells do not respond to fatty acid in the absence of divalent cations (Benson et al. 2002), they do respond in the presence of MgCl2 (1.2 mm) and in the absence of CaCl2 (Fig. 15F). Under these conditions 500 μm dodecanoic acid becomes completely soluble after sonication. These data present further evidence that fatty acid-induced CCK secretion in the enteroendocrine cell line STC-1 can be mediated by both fatty acid monomers and fatty acid aggregates and that the anion concentrations of the medium in which the fatty acid is presented play a major role in determining which pathway will dominate.
Figure 15. The effect of sulfate on the efficacy of dodecanoic acid to mobilise Ca2+ in STC-1 cells.
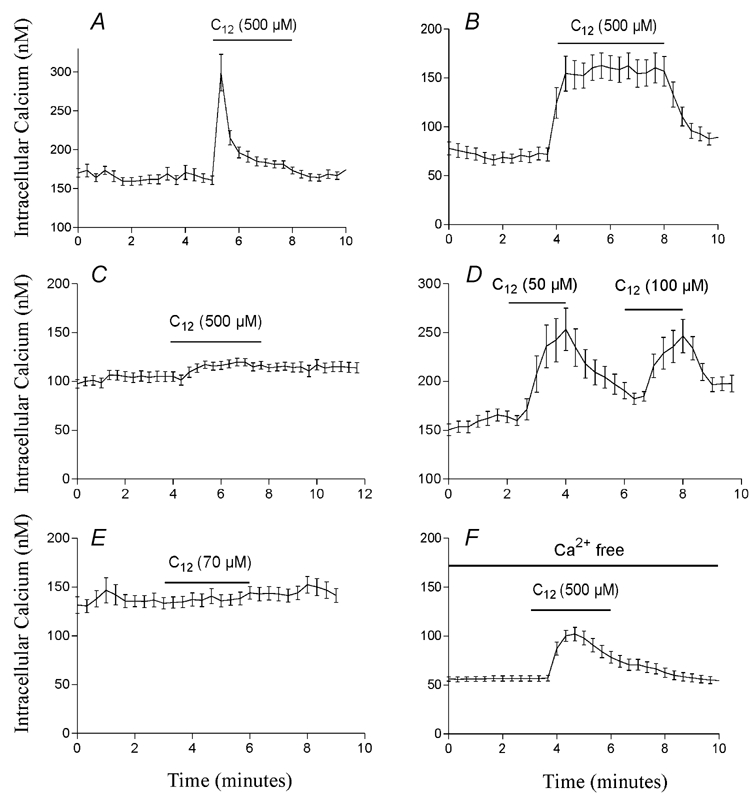
Dodecanoic acid was presented to the cells in a solution containing either 1.2 mm MgSO4 (A, C and E) or with the sulfate replaced by equimolar chloride (B, D and F). In order to avoid swapping experimental solutions, STC-1 cells were loaded with fura-2 in the solution in which they were tested (i.e. cells in A, C and E were loaded in a solution containing 1.2 mm MgSO4 and cells in B, D and F loaded in a solution containing 1.2 mm MgCl2). In calcium-free conditions (F), CaCl2 was replaced with 0.2 mm EGTA. Fluorescent images were acquired and processed as described in Fig. 8. The period of fatty acid exposure is shown with dose bars above the traces and the concentration of fatty acid used in each experiment is shown on each trace. Each trace is representative of at least three independent experiments.
DISCUSSION
In our previous studies on the enteroendocrine cell line STC-1, we found that the well-characterised relationship between fatty acid chain length and CCK secretion (McLaughlin et al. 1998), was related to the solubility of the fatty acids in aqueous solutions containing divalent cations (Sidhu et al. 2000). More recently, by filtering fatty acid solutions through polytetrafluoroethylene (PTFE), we have observed that both fatty acid-induced CCK secretion and Ca2+ mobilisation were due to the presence of insoluble fatty acid aggregates which are larger than the monomeric size of the fatty acid but probably smaller than 0.45 μm. Because the concentration of fatty acid in each filtrate was less than its solubility limit, the critical finding that the efficacy of each filtrate decays with time, presumably as filtered fatty acid aggregates disintegrate and return to equilibrium with the solvent, confirms that the physical state of the fatty acid in solution is important (Benson et al. 2002). However, if fatty acids are stimulating STC-1 cells only because of their aggregation, then alterations to fatty acids that make them soluble should completely abrogate their ability to induce CCK secretion and Ca2+ mobilisation. Likewise, particles which are unrelated to fatty acids but which form a similar particle profile in solution should also be able to stimulate STC-1 cells.
The data obtained in this study clearly show that STC-1 cells can respond to latex microspheres, which is strong evidence that the presence of particles can somehow be detected by STC-1 cells. Given the rapid response of STC-1 cells to the latex microspheres and the confocal microscopy data which shows the microspheres associated with the cell membrane, the detection of particulates by STC-1 cells appears to be mediated extracellularly. By extension, while fatty acids in solution can clearly enter STC-1 cells (Sidhu et al. 2000) their action on STC-1 cells as aggregates is possibly mediated extracellularly.
Equally clearly, our experiments with modified fatty acids demonstrate that these compounds can act in the absence of aggregation. Furthermore, even dodecanoic acid itself is able to act at concentrations below its solubility limit as long as sulfate is not present in the test solution. These data indicate that fatty acids can stimulate STC-1 cells directly, independent of their propensity to form aggregates. In fact, the most important property determining the stimulatory effect of a fatty acid is its amphipathic nature. Changes in fatty acid structure which either alter the polar head or lipophilic tail tend to eliminate its ability to induce CCK secretion and Ca2+ mobilisation in STC-1 cells. There are several possible explanations as to why the amphipathic property of fatty acids is so important. First, it directly influences solubility. Thus, increasing the charge density of the polar head or reducing the length of the lipophilic tail should increase solubility and hence decrease the propensity of fatty acids to form aggregates. While the amphipathic property of the molecule could therefore be a surrogate for aggregate formation, and hence meet our original hypothesis that only fatty acid aggregates were stimulating STC-1 cells, it became clear during this study that the poor correlation between the efficacy of the fatty acid analogue to induce a cellular response and its propensity to form aggregates in solution was indicative of the fact that fatty acid monomers were also able to stimulate STC-1 cells.
Second, the amphipathic properties of a fatty acid determine its water/oilpartitioning coefficient. This is important because it will influence how easily the molecule can permeate the cell membrane. The observations that either decreasing the aqueous solubility of dodecanoic acid (by the removal of the polar head) or decreasing its ability to partition into lipid (by adding a second charged group on the lipophilic tail) abolished CCK secretion and Ca2+ mobilisation in STC-1 cells, together with the finding that dodecanoic acid freely, rapidly and irreversibly crosses the cell membrane (Sidhu et al. 2000) are consistent with the concept that when fatty acids, stimulate cells in monomeric form, they may do so intracellularly. This being so, it seems unlikely that the recently identified, G-protein-coupled fatty acid receptor (Itoh et al. 2003) is solely involved in the response of STC-1 cells to monomeric fatty acids. The finding that the non-metabolisable form of dodecanoic acid (2-bromododecanoic acid) also induces a cellular response suggest that, if dodecanoic acid is acting intracellularly, it is the fatty acid itself and not one of its metabolites which is responsible for the observed physiological responses.
Returning to the stimulation of STC-1 cells by fatty acid aggregates, our earlier data on filtering fatty acid colloidal suspensions suggested that the size of the insoluble aggregate was critically important (Benson et al. 2002). Thus, in the present study we also measured the size of all our microsphere solutions to examine whether STC-1 cells would respond to particles of similar size which were completely unrelated to fatty acids. While we could not stimulate STC-1 cells with microspheres smaller than 0.45 μm in diameter, we were able to find a microsphere which did induce CCK secretion and Ca2+ mobilisation. Moreover, the nature of this response appeared to be similar to that induced by fatty acids as the rise in [Ca2+]i was attenuated by blocking L-type Ca2+ channels. This creates the possibility that the action of the particulate resin, cholestyramine, in raising plasma CCK concentration might be via a direct action on enteroendocrine cells rather than through its bile salt-binding capacity as is traditionally believed (Masclee et al. 1993).
An obvious problem raised by these data is the disparity in size between the fatty acid and microsphere aggregates that are able to induce CCK secretion. There are several potential explanations for this paradox. First, while the filtering data suggest that it is fatty acid aggregates below 0.45 μm which stimulate STC-1 cells, we have no way of knowing if the filters prevent all particles larger than the manufactured filter pore size from entering the filtrate. If, for example, the aggregates are deformable or the filter pores themselves become stretched under pressure, aggregates which are greater than the pore size may pass through the filter and it could be these which are responsible for the observed biological responses.
Second, there appears to be a very good correlation between the surface charge of a microsphere and its ability to induce a cellular response. This may mean that in order for the microsphere to induce CCK secretion it must possess minimal surface charge. Thus, while more highly charged microspheres may be in the right size range to stimulate STC-1 cells, the large surface charge obviates the effect. The finding that highly charged 1 μm and 10 μm microspheres were unable to induce CCK secretion or Ca2+ mobilisation is at least consistent with this interpretation. A theoretical way to further test this hypothesis would be to create a microsphere that has a very low surface charge but that does not aggregate in a solution that contains divalent cations. Unfortunately, it is not possible to do this as particle aggregation is inversely related to surface charge and is increased in the presence of divalent cations. Third, it is possible that it is aggregation itself which is responsible for microsphere and fatty acid-induced CCK secretion and Ca2+ mobilisation. It may even be necessary for there to be a range of aggregates covering a spectrum of sizes. Finally, it may be that the apparent similarity between microsphere- and fatty acid-induced cellular responses is purely coincidental and the mechanism by which microspheres stimulate STC-1 cells is unrelated to the way fatty acid aggregates stimulate STC-1 cells.
Taken together, the microsphere and fatty acid analogue studies suggest that there are two distinct pathways by which medium chain fatty acids can stimulate STC-1 cells. Although STC-1 cells can be stimulated by particulate fatty acid aggregates, this is not to the exclusion of stimulation by monomeric fatty acid. Support for this dual receptor mechanism arose from the serendipitous observation that sulfate in the bathing media dramatically alters the responsiveness of STC-1 cells to dodecanoic acid monomers. Why sulfate has this effect is unknown: maybe the sulfate ion subtly alters the solubility of dodecanoic acid, or the rate at which dodecanoic acid crosses the cell membrane, or interferes with some cellular pathway which is important for fatty acid monomer detection. Given that our analogue data were all obtained with sulfate present, we think the latter explanation is the least likely. Whether there is any physiological relevance to the presence of sulfate in the gut also remains to be determined. The concentration of sulfate that bathes the luminal surface of enteroendocrine cells is hard to determine from the literature and probably varies with diet. The concentration of sulfate used in our solutions could realistically be obtained in the digesta based on the concentration of sulfate found in pancreatic and gastric secretions.
In summary, these data, together with our previous work (Benson et al. 2002), demonstrate that STC-1 cells can respond to stimulation by both fatty acid monomers and fatty acid aggregates. Whether the aggregate pathway has any physiological relevance in digestion remains to be determined.
Acknowledgments
We would like to thank Dr Austin Elliot for his assistance with calcium imaging, Drs Tony Wade and Grenham Ireland for their help with confocal microscopy Dr Annette Fillery-Travis of the Institute of Food Research, Norwich for assisting with light scatter measurements and Dr John McLaughlin for his helpful editorial comments. This work was supported by a BBSRC grant (34/FO8146). Satjinder Sidhu was an MRC student.
REFERENCES
- Benson RSP, Sidhu SS, Jones MN, Case RM, Thompson DG. Fatty acid signalling in enteroendocrine cells involves fatty acid aggregates rather than free fatty acids. J Physiol. 2002;538:121–131. doi: 10.1113/jphysiol.2001.012969. [DOI] [PMC free article] [PubMed] [Google Scholar]
- Grynkiewicz G, Poenie M, Tsien RY. A new generation of Ca2+ indicators with greatly improved fluorescence properties. J Biol Chem. 1985;260:3440–3450. [PubMed] [Google Scholar]
- Itoh Y, Kawamata Y, Harada M, Kobayashi M, Fujii R, Fukusumi S, Ogi K, Hosoya M, Tanaka Y, Uejima H, Tanaka H, Maruyama M, Satoh R, Okubo S, Kizawa H, Komatsu H, Matsumura F, Noguchi Y, Shinohara T, Hinuma S, Fujisawa Y, Fujino M. Free fatty acids regulate insulin secretion from pancreatic beta cells through GPR40. Nature. 2003;422:173–176. doi: 10.1038/nature01478. [DOI] [PubMed] [Google Scholar]
- Liddle RA. Regulation of cholecystokinin secretion by intraluminal releasing factors. Am J Physiol. 1995;269:G319–327. doi: 10.1152/ajpgi.1995.269.3.G319. [DOI] [PubMed] [Google Scholar]
- Liddle RA. Cholecystokinin cells. Annu Rev Physiol. 1997;59:221–242. doi: 10.1146/annurev.physiol.59.1.221. [DOI] [PubMed] [Google Scholar]
- Masclee AA, Jansen JB, Rovati LC, Lamers CB. Effect of cholestyramine and cholecystokinin receptor antagonist CR1505 (loxiglumide) on lower esophageal sphincter pressure in man. Dig Dis Sci. 1993;38:1889–1892. doi: 10.1007/BF01296114. [DOI] [PubMed] [Google Scholar]
- McLaughlin JT, Lomax RB, Hall L, Dockray GJ, Thompson DG, Warhurst G. Fatty acids stimulate cholecystokinin secretion via an acyl chain length-specific, Ca2+-dependent mechanism in the enteroendocrine cell line STC-1. J Physiol. 1998;513:11–18. doi: 10.1111/j.1469-7793.1998.011by.x. [DOI] [PMC free article] [PubMed] [Google Scholar]
- McLaughlin JT, Luca MG, Jones MN, Dockray GJ, Thompson DG. Fatty acid chain length determines CCK secretion and different effects on proximal and distal gastric motility. Gastroenterology. 1999;116:46–53. doi: 10.1016/s0016-5085(99)70227-1. [DOI] [PubMed] [Google Scholar]
- Raybould HE. Nutrient tasting and signaling mechanisms in the gut I. sensing of lipid by the intestinal mucosa. Am J Physiol. 1999;277:G751–755. doi: 10.1152/ajpgi.1999.277.4.G751. [DOI] [PubMed] [Google Scholar]
- Sidhu SS, Case RM, Warhurst G, Thompson DG, Benson RSP. Fatty acid-induced cholecystokinin secretion and changes in intracellular Ca2+ in two enteroendocrince cell lines, STC-1 and GLUTag. J Physiol. 2000;528:165–176. doi: 10.1111/j.1469-7793.2000.00165.x. [DOI] [PMC free article] [PubMed] [Google Scholar]
- Vorum H, Brodersen R, Kragh HU, Pedersen AO. Solubility of long-chain fatty acids in phosphate buffer at pH 7. 4. Biochim Biophys Acta. 1992;1126:135–142. doi: 10.1016/0005-2760(92)90283-2. [DOI] [PubMed] [Google Scholar]