

Abstract
The ventilatory response to mild-to-moderate exercise in humans is isocapnic, or ‘error-free’. It has been suggested that this response is learned over many repetitions of exercise through the process of minimising any deviations from normal in the blood gas tensions, as sensed by the chemoreceptors. However, relatively limited training programmes have failed to produce any convincing evidence in humans that forcibly altering the blood gas tensions during repeated periods of exercise alters the subsequent steady-state ventilatory response to exercise. In this study, eight healthy young subjects were exposed, over a 7 day training period, to a total of 70 repeated bouts of exercise paired with a simultaneous airway CO2 load to stimulate the chemoreceptors (protocol EX + CO2). The ventilatory response to exercise was measured before and after training to determine whether it had been modified. Two further training protocols were undertaken as controls. One employed repeated exercise without an airway CO2 load, and the other employed repeated airway CO2 loading without exercise. On the 1st and 2nd days following training with protocol EX + CO2, end-tidal PCO2 was regulated at a lower level during steady-state exercise than following training with the control protocols and than before training (mean ±s.e.m. reduction in end-tidal PCO2 = 1.32 ± 0.36 Torr, ANOVA, P < 0.05). In contrast to previous studies, this finding demonstrates that the steady-state ventilatory response to exercise can be modified by a prior period of altered chemoreception during exercise. This suggests that ventilation is matched to metabolic rate during exercise by a mechanism that involves learning and memory.
As first demonstrated by Haldane & Priestley (1905). the increase in metabolism that occurs as a result of muscular exercise is matched exactly by an increase in pulmonary ventilation ( ). They proposed that during exercise, an increase in alveolar PCO2 (PA,CO2), and hence arterial PCO2 (Pa,CO2), would stimulate the chemoreceptors, and that this would increase , thus providing the link between and metabolic CO2 production (
 ). However, subsequent studies have demonstrated that the matching of to is so precise that during mild-to-moderate exercise, Pa,CO2 does not change and hence there is no error signal to drive this feedback mechanism (Wasserman et al. 1967). How this exact matching of to occurs is not understood.
A variety of mechanisms have been proposed to drive the increase in during exercise, including ‘irradiation’ of signals from the motor cortex (feedforward control), stimulation of neural receptors in the exercising muscles, stimulation of chemoreceptors by a humoral factor released from the exercising muscles, and stimulation of chemoreceptors in the lungs by mixed venous PCO2 (Zuntz & Geppert, 1886). All of these mechanisms may, to a greater or lesser extent, serve to increase during muscular exercise. However, none provides an explanation of how such mechanisms have been calibrated to ensure that rises in a manner so precisely matched to .
In an attempt to overcome this problem, Somjen (1992) has hypothesised that feedforward control is a learned response. He proposed that the brain ‘knows’ exactly how much O2 is demanded and CO2 produced, by the level of exercise being undertaken and has learned to anticipate the corresponding increase in that is necessary to avoid any changes in arterial blood gases. He hypothesised that the brain has learned how to do this over a period of many years, from early in infancy, by a process of ‘trial and error’. would initially be driven by chemoreceptor feedback signals during increased levels of activity, but gradually the individual would learn to anticipate these errors in blood gases and thus avoid them. Hence, control of becomes possible without the need for any error signal.
Somjen indicated that control of in the absence of error signals is only possible while the internal and external environments remain constant, because if these change, error signals will result and a process of re-learning will be required. As such, it should be possible to test this theory by repeatedly generating error signals experimentally (i.e. disturbances in arterial blood gases) during exercise to induce a process of re-learning. Subsequent removal of these error signals should reveal whether learning has occurred, because and will no longer be exactly matched, the brain having learned to anticipate the level of required under different conditions.
There is some evidence in support of this theory using just such an experimental approach in goats (Martin & Mitchell, 1993). After repeated trials of exercise paired with an added external dead space to induce hypercapnia, steady-state was increased during subsequent trials of exercise without added dead space. However, similar experiments in human subjects have failed to demonstrate convincing evidence in favour of Somjen's theory (Helbling et al. 1997; Moosavi et al. 2002; Turner & Sumners, 2002).
With one exception, a potential problem with the design of these previous studies is that the overall period within which training has taken place has been relatively short. The exception is the study by Helbling et al. (1997). where an 8 day training programme was employed. However, in their training programme there were only two rest-to-exercise transitions on each training day. Should it be the case that the change in chemoreceptor feedback occurring from rest to exercise is important in the learning process, then it is possible that the total number of transitions employed by Helbling et al. was too few for effective modification of the steady-state ventilatory response to exercise to occur. In general, it seems unlikely that a control system that has been calibrated over years would alter its properties markedly over a period lasting only a few hours or perhaps with a training protocol involving relatively few rest-to-exercise transitions. The present study sought to address these issues by employing a training protocol lasting for 7 consecutive days, with 10 rest-to-exercise transitions on each day.
METHODS
Subjects
The subjects were eight young healthy males with no history of respiratory or cardiovascular disease. All subjects were non-smokers. All experiments conformed to the Declaration of Helsinki, and received the approval of the local ethics committee (COREC). The nature and requirements of the experiments were explained to the subjects without revealing the purpose of the study, and subjects gave their informed written consent prior to each experiment.
Protocols
Prior to the main experiments, a set of preliminary measurements was made. These included measurements of end-tidal PCO2 (PET,CO2) and PO2 (PET,O2) with the subject at rest, determination of maximal work rate using an incremental exercise test, and measurements of PET,CO2 and PET,O2 at a work rate equivalent to 50 % of maximal (chosen to be below the anaerobic threshold but above a level associated with slow walking/cyclingon level ground). This subject-specific work rate was used throughout the remainder of the study.
For the main experiments, the subjects undertook three different protocols in a random order. The randomisation was undertaken by noting that there were six possible orders in which these protocols could be undertaken; these were chosen at random to provide the order for subjects 1–6, with subject 7 and 8 repeating the order used for subjects 1 and 2. Each protocol comprised a 7 day training period, which was separated from the training period of any other protocol by a minimum of 4 weeks (see Fig. 1). Measurements of the ventilatory response to exercise were made before and after these training periods to determine whether the response had been modified by training. In protocol EX + CO2, training involved repeated bouts of exercise paired with a simultaneous airway CO2 load to stimulate the chemoreceptors; in protocol EX, training involved repeated bouts of air-breathing exercise; and in protocol CO2, training involved repeated bouts of airway CO2 loading at rest. During each 7 day training period subjects came to the laboratory twice a day, and on each occasion undertook five bouts of training, each lasting 4 min. These bouts were separated from one another by 4 min periods of air-breathing rest. Outside the laboratory, subjects were requested to refrain from taking exercise other than the minimum required to travel around (slow walking and cycling on level ground). Subjects were equipped with a pulse meter to warn them if they were exerting themselves to too great a degree. Subjects tended to only wear the monitor for the first couple of days of each protocol, until they became accustomed to maintaining this minimal level of exertion.
Figure 1. Summary of protocols and measurements.
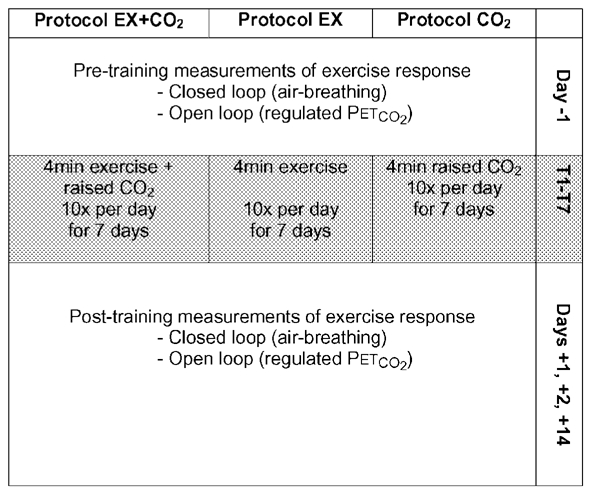
Subjects undertook three different 7 day training protocols with identical measurements of the ventilatory response to exercise, under closed-loop and open-loop conditions, made before and after each training period.
In order to determine whether the subjects’ perception of breathlessness differed between the three training protocols they were asked to rate their sensations of breathlessness during the final minute of each bout of training, according to a modified Borg scale (Borg, 1982). This scale associates numerical ‘scores’ with verbal expressions; in this case, descriptions of the strength of sensations of breathlessness, which ranged from zero (‘none at all’) to 10 (‘very, very heavy’). A card displaying the modified Borg scale was held in front of the subject, who was asked to point at the score associated with the expression that best described their sensations of breathlessness at that moment.
The respiratory response to exercise before and after training was assessed in two ways. In the first, subjects undertook an 8 min period of exercise breathing air, which leaves the biological feedback loop between CO2 and ventilation intact (closed-loop measurements). In the second, subjects undertook an identical period of exercise, but with their PET,CO2 regulated at a fixed level, which opens the biological feedback loop to allow measurement of at a fixed level of PCO2 (open-loop measurements). Measurements were undertaken the day before training (day −1), on the 1st and 2nd days after training (days +1 and +2) and 2 weeks after training (day +14).
Experimental technique
Subjects sat upright in a chair for the procedures exclusively at rest, and on a cycle ergometer for those involving any exercise. For the preliminary measurements of the end-tidal gases at rest, gas was sampled from a catheter taped just below the subject's nostril and analysed by mass spectrometry (Airspec MGA300, UK). For all other experiments, subjects breathed through a mouthpiece with the nose occluded by a clip. Gas was sampled from a port in the mouthpiece.
All exercise in this study was performed on the same cycle ergometer (Mijnhardt KEM-3, Cardiokinetics, Salford, UK). This ergometer was electromagnetically braked and provided a constant work rate, independent of pedal frequency. A coloured light display mounted on the handlebars indicated pedal rate, and subjects were instructed to maintain a rate of 60 revs min−1 (the ‘green range’) at all times. Subjects were assisted by verbal instructions whenever they had problems maintaining this rate (‘slow down’ or ‘speed up’, as required).
The procedure used for the incremental exercise test was as follows: subjects pedalled at 0 W for 4 min, after which the load was increased by 25–30 W (the chosen increment depended on how fit the subject reported himself to be) every minute until exhaustion. Subjects were instructed to maintain a pedal speed of 60 revs min−1. Exhaustion was taken as the point when either the subject stopped voluntarily or was unable to maintain a pedal rate of 60 revs min−1 following an increment, and was told to stop. Verbal encouragement was given throughout the test to ensure the subject reached exhaustion. Maximal O2 uptake capacity was taken as the maximal single-breath value achieved during the test and was calculated using the method of Pandit & Robbins (1992). Maximal work rate was taken as the highest load that the subject was able to maintain for a full minute. Heart rate was monitored throughout the test to check that the expected maximal value was reached, and plots of PET,CO2vs. work rate were inspected visually to check that anaerobic threshold had been achieved several minutes prior to the end of the test (i.e. plots became alinear).
During training, the inspired gas composition was controlled manually using rotameters (Roxspur Measurement & Control, Bramley, UK). For protocol EX + CO2, values for inspiratory PCO2 and PO2 were chosen that would raise PET,CO2 by 8 Torr above the normal level during exercise and lower PET,O2 to 8 Torr below the normal level during exercise. PET,O2 was lowered in addition to raising PET,CO2 in order that the stimulus would mimic the effects of hypoventilation as closely as possible. With a background flow of air, the flows of CO2 and N2 were adjusted until the desired end-tidal gas values were achieved. For protocol EX, subjects breathed air throughout the training periods. For protocol CO2, values for inspiratory PCO2 and PO2 were chosen that would raise PET,CO2 by 8 Torr above the normal level at rest and lower PET,O2 to 8 Torr below the normal level at rest.
Measurements of the ventilatory response to exercise on days before and after the training periods were made using a turbine volume transducer (Cardiokinetics) to measure respiratory volumes (Howson et al. 1986). All data were logged to a personal computer. Two sets of measurements were made under closed-loop conditions followed by two sets of measurements under open-loop conditions. For each measurement, there was an initial period of 5 min at rest, followed by 8 min of exercise, and then a final 5 min of rest, throughout which the subject was seated on the cycle ergometer. For the closed-loop measurements, subjects breathed air throughout. For the open-loop measurements, the end-tidal gases were regulated using an end-tidal forcing system (Robbins et al. 1982). PET,CO2 was held constant at 2 Torr above the subject's normal air-breathing value in exercise during the 8 min of exercise and at 2 Torr above the subject's normal air-breathing value at rest during the 5 min periods of rest before and after exercise. PET,O2 was held at the subject's normal level during exercise for the 8 min of exercise, and at the subject's normal level at rest for the 5 min periods of rest before and after exercise.
Data analysis
In order to assess visually the effects of the different protocols, breath-by-breath data from the pre- and post-training measurements were first averaged over 20 s intervals. This enabled the responses to be averaged across subjects for both the closed- and open-loop measurements. These average responses were then plotted.
To provide a statistical analysis of the significance of any changes observed, rest-to-exercise differences were calculated for PET,CO2 and for each exercise response. These were obtained by subtracting the average or PET,CO2 for the last 3 min of rest prior to the onset of exercise from the average or PET,CO2 for the final 3 min of exercise. For each subject, the pairs of values obtained on the same day were averaged. Differences between these responses for days −1, +1 and +2 for the different protocols were then assessed for statistical significance using ANOVA. In the ANOVA, subjects were treated as a random factor, and the fixed factors were set in one of the two ways, depending on the hypothesis under test.
To determine whether the different protocols had different effects, the data for days +1 and +2 were compared between protocols and with the control (day −1) data. To determine specifically whether the effects of protocol EX + CO2 for example, differed from all else, the days +1 and +2 data for protocol EX + CO2 were compared with pooled data from the day −1 measurements and the days +1 and +2 data from the other two protocols.
Daily average ratings of breathlessness (Borg scores) were calculated for each subject and these were averaged overall to give a mean score for each protocol. Differences between these scores were assessed statistically using ANOVA.
All statistical analysis was performed using the SPSS statistical software package. Significance was accepted at P < 0.05 and unless indicated otherwise, data are presented as the mean ±s.e.m.
RESULTS
Subjects
The individual physical characteristics of the subjects are given in Table 1, along with values for maximal O2 uptake ( ) and the work rate equivalent to 50 % of maximal. There may have been some bias away from regular sportsmen in the selection of subjects due to the limitations that the protocol placed on sporting activities. However, of the eight subjects selected, only one usually took no regular exercise.
Table 1.
Individual physical characteristics of subjects and selected preliminary test results
| Work rate at | Resting | Exercising | ||||||
|---|---|---|---|---|---|---|---|---|
| Subject | Age | Height | Weight | |
50 % of max | Pet,co2 | Pet,co2 | ΔPet,co2 |
| no. | (years) | (m) | (kg) | (1 min−1) | (W) | (Torr) | (Torr) | (Torr) |
| 1116 | 32 | 170 | 72 | — | 150 | 41.0 | 49.0 | 8.0 |
| 1194 | 21 | 170 | 64 | 2.52 | 90 | 39.0 | 43.0 | 4.0 |
| 1212 | 21 | 190 | 83 | 3.82 | 150 | 38.5 | 43.5 | 5.0 |
| 1220 | 24 | 174 | 71 | 3.42 | 150 | 41.5 | 47.0 | 5.5 |
| 1234 | 20 | 170 | 70 | 3.23 | 100 | 39.0 | 43.0 | 4.0 |
| 1246 | 23 | 175 | 70 | 3.16 | 130 | 36.0 | 46.5 | 10.5 |
| 1257 | 22 | 185 | 89 | 2.92 | 140 | 37.0 | 40.0 | 3.0 |
| 1294 | 23 | 185 | 87 | 4.43 | 160 | 37.0 | 46.0 | 9.0 |
| Mean | 23 | 177 | 76 | 3.36 | 134 | 39.0 | 45.0 | 6.1 |
| ± S.D. | 4 | 8 | 9 | 0.62 | 26 | 2.0 | 3.0 | 2.7 |
Closed-loop responses
The closed-loop responses to (air-breathing) exercise before and after training with the three protocols are shown in Fig. 2 and Fig. 3. Average values for PET,CO2, , respiratory frequency (fR) and tidal volume (VT) over the final 3 min of both rest and exercise are given in Table 2. Inspection of the figures suggests that there was no training effect of the repeated inspiratory CO2 load at rest (protocol CO2) in the sense that the regulation neither of PET,CO2 during exercise nor during exercise was affected by the training. Following training with repeated exercise (protocol EX), there was again no change in the level at which PET,CO2 was regulated during exercise compared with before training. However, during exercise was lower after the 70 training bouts of exercise than before, suggesting a physical training effect. In contrast to the other two training protocols, training with paired exercise and inspiratory CO2 load (protocol EX + CO2) resulted in the PET,CO2 during air-breathing exercise being regulated at a lower level than before training. during exercise following protocol EX + CO2 training was maintained at pre-training levels, instead of falling, as occurred in response to the physical training effect of protocol EX.
Figure 2.
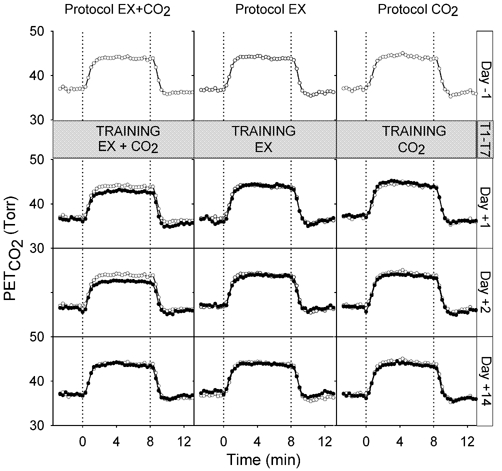
PET,CO2 measured in normal closed-loop (air-breathing) conditions during exercise (0–8 min) before training (day −1) and after training (days +1, +2 and +14). Pre-training (day −1) measurements (also shown in post-training panels for comparison), open symbols; post-training measurements, filled symbols. Values are breath-by-breath data averaged over 20 s intervals, averaged across subjects.
Figure 3.
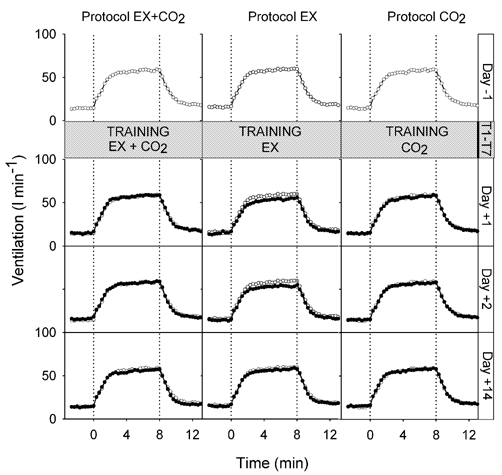
measured in normal closed-loop (air-breathing) conditions during exercise (0–8 min) before training (day −1) and after training (days +1, +2 and +14). Pre-training (day −1) measurements (also shown in post-training panels for comparison), open symbols; post-training measurements, filled symbols. Values are breath-by-breath data averaged over 20 s intervals, averaged across subjects.
Table 2.
Steady-state rest and exercise values for PET,CO2, , fR and VT during closed- and open-loop measurements of the ventilatory response to exercise before and after training, for all three protocols, averaged across subjects
| Protocol EX+CO2 | Protocol EX | Protocol CO2 | ||||||||||
|---|---|---|---|---|---|---|---|---|---|---|---|---|
| PET,CO2 (Torr) |
(1 min −1) |
fR (breaths min−1) | VT (1 min−1) | PET,CO2 (Torr) |
(1 min−1) |
fR (breaths min−1) | VT (1 min−1) | PET,CO2 (Torr) |
(1 min−1) |
fR (breaths min−1) | VT (1 min−1) | |
| Closed-loop rest | ||||||||||||
| Day−1 | 37.0±2.3 | 14.3±2.1 | 15.9±2.5 | 0.93±0.15 | 36.8±1.7 | 15.9±4.1 | 18.3±4.9 | 0.89±0.20 | 37.0±1.6 | 14.5±2.4 | 16.1±2.8 | 0.92±0.14 |
| Day +1 | 36.5±1.9 | 14.8±3.0 | 17.1±3.2 | 0.88±0.14 | 36.2±2.6 | 14.7±2.8 | 17.4±2.5 | 0.86±0.18 | 37.3±1.0 | 14.4±2.3 | 17.2±3.0 | 0.85±0.10 |
| Day +2 | 36.4±2.2 | 15.9±4.1 | 17.6±3.3 | 0.91±0.18 | 37.1±2.6 | 14.3±2.9 | 17.4±3.5 | 0.84±0.12 | 36.6±1.3 | 14.6±2.7 | 17.5±3.3 | 0.85±0.14 |
| Day +14 | 37.0±2.3 | 14.0±3.9 | 16.7±3.0 | 0.85±0.18 | 37.6±1.9 | 15.0±2.3 | 17.5±3.0 | 0.87±0.14 | 36.7±2.2 | 15.0±3.1 | 16.4±2.8 | 0.95±0.15 |
| Closed-loop exercise | ||||||||||||
| Day −1 | 43.8±3.3 | 58.1±7.7 | 25.0±4.6 | 2.40±0.54 | 43.8±3.7 | 59.4±9.0 | 25.4±5.4 | 2.41±0.53 | 44.0±2.2 | 58.3±8.8 | 25.0±5.0 | 2.34±0.50 |
| Day +1 | 42.7±2.8 | 58.4±9.7 | 26.6±5.2 | 2.25±0.51 | 44.0±3.2 | 54.3±7.5 | 24.2±4.3 | 2.31±0.57 | 44.3±2.9 | 57.1±9.6 | 25.2±4.3 | 2.31±0.40 |
| Day +2 | 42.5±2.6 | 58.1±10.5 | 26.4±4.0 | 2.25±0.53 | 43.7±3.4 | 53.8±6.9 | 25.2±5.1 | 2.22±0.62 | 43.6±2.8 | 57.1±8.9 | 25.2±4.6 | 2.31±0.42 |
| Day +14 | 43.5±2.9 | 56.4±12.0 | 26.2±4.2 | 2.20±0.62 | 43.7±2.9 | 57.5±10.5 | 25.8±4.8 | 2.27±0.47 | 43.6±2.7 | 56.0±7.8 | 24.9±3.5 | 2.36±0.57 |
| Open-loop rest | ||||||||||||
| Day−1 | 40.5±1.6 | 25.9±6.0 | 19.7±1.4 | 1.32±0.30 | 40.7±1.9 | 27.4±5.3 | 20.8±2.3 | 1.32±0.27 | 40.1±1.3 | 24.0±4.1 | 19.3±3.0 | 1.28±0.14 |
| Day +1 | 40.2±1.6 | 29.2±10.5 | 21.3±3.1 | 1.35±0.40 | 40.4±1.9 | 24.9±4.4 | 20.4±3.0 | 1.23±0.17 | 40.2±1.2 | 23.9±3.7 | 20.2±2.7 | 1.20±0.19 |
| Day +2 | 40.4±1.5 | 27.6±7.1 | 20.4±2.5 | 1.35±0.28 | 40.5±2.0 | 25.2±5.8 | 20.6±3.3 | 1.22±0.21 | 40.1±1.4 | 24.7±3.6 | 20.4±2.9 | 1.22±0.19 |
| Day +14 | 40.6±1.8 | 25.8±5.7 | 20.8±3.1 | 1.25±0.25 | 40.4±1.9 | 25.6±4.6 | 20.8±2.5 | 1.24±0.24 | 40.2±1.3 | 25.4±8.2 | 19.9±2.2 | 1.29±0.34 |
| Open-loop exercise | ||||||||||||
| Day−1 | 46.8±2.2 | 72.6±13.4 | 27.8±4.7 | 2.66±0.61 | 46.8±2.3 | 75.9±16.5 | 29.0±5.2 | 2.65±0.61 | 46.5±2.1 | 69.4±13.5 | 27.3±5.4 | 2.59±0.49 |
| Day +1 | 46.7±2.1 | 78.8±21.4 | 30.4±4.5 | 2.60±0.67 | 46.9±2.7 | 65.7±7.9 | 26.4±4.0 | 2.54±0.61 | 46.9±2.3 | 70.2±12.7 | 27.7±5.1 | 2.57±0.39 |
| Day +2 | 46.6±2.1 | 76.5±17.6 | 28.7±4.4 | 2.70±0.65 | 46.9±2.2 | 69.5±11.8 | 28.6±5.9 | 2.53±0.59 | 46.6±2.2 | 71.8±14.1 | 28.1±5.1 | 2.58±0.42 |
| Day +14 | 46.9±2.1 | 73.0±16.4 | 29.3±4.7 | 2.53±0.69 | 47.0±2.2 | 73.7±14.1 | 28.6±5.1 | 2.62±0.49 | 46.5±2.1 | 70.7±17.1 | 28.2±3.5 | 2.58±0.66 |
Values are means ±s.d. (steady-state rest values are breath-by-breath data averaged over the last 3 min of rest prior to the onset of exercise; steady-state exercise values are breath-by-breath data averaged over the last 3 min of exercise).
These observations were confirmed by the statistical analysis. Following training with protocol EX, increased less with exercise on days +1 and +2 compared with the other two protocols and with pre-training responses (reduction in = 4.1 ± 1.3 l min−1, ANOVA, P < 0.05). Following training with protocol EX + CO2, the increase in PET,CO2 with exercise was less on days +1 and +2 compared with the two control protocols and with pre-training responses (reduction in PET,CO2 = 1.3 ± 0.4 Torr, ANOVA, P < 0.05). By day +14 the responses of both PET,CO2 and to exercise had returned to normal.
Examining the pattern of breathing during the closed-loop response (see Table 2), there was no significant difference in changes in fR from rest to exercise between protocols. However, after training with protocol EX, VT increased less with exercise on days +1 and +2 compared with the other two protocols and with pre-training responses (P < 0.05). The response of VT had returned to normal by day +14.
Open-loop responses
The open-loop responses to exercise at a regulated PET,CO2 before and after training are shown in Fig. 4. Average values for PET,CO2, , fR and VT over the final 3 min of both rest and exercise are given in Table 2. Consistent with the expectations from the closed-loop responses, during exercise was higher after training with protocol EX + CO2 (increase in = 11.5 ± 3.8 l min−1), lower after training with protocol EX (reduction in = 13.2 ± 4.5 l min−1) and unchanged after training with protocol CO2. The increases in from rest to exercise were significantly different between day −1 and days +1 and +2 between protocols (ANOVA, P < 0.05). By day +14 the responses had returned to normal.
Figure 4.

measured in open-loop conditions (at regulated PET,CO2) during exercise (0–8 min) before training (day −1) and after training (days +1, +2 and +14). Pre-training (day −1) measurements (also shown in post-training panels for comparison), open symbols; post-training measurements, filled symbols. Values are breath-by-breath data averaged over 20 s intervals, averaged across subjects.
No significant difference was detected between protocols in the changes in VT from rest to exercise. ANOVA conducted on the changes in fR from rest to exercise did not quite reach significance (P = 0.07).
Sensations of breathlessness
The mean ±s.d. ratings of breathlessness for each of the training protocols were 1.7 ± 1.1 for protocol EX + CO2, 1.6 ± 1.0 for protocol EX and 1.3 ± 1.1 for protocol CO2. ANOVA revealed no significant difference between these values.
DISCUSSION
The major finding of this study is that repeated disturbances in chemoreception during exercise in humans modify the normal ventilatory response to exercise. In particular, repetitive occurrences of increased chemoreceptor activity during exercise result in an augmentation of subsequent ventilatory responses to exercise, which in a naturally occurring situation would act to strengthen the proportionality between and and tighten control over Pa,CO2.
Critique of the study
In this study, PET,CO2 has been used as a proxy measurement for Pa,CO2, whereas ideally, direct measurements of Pa,CO2 would have been made. However, with a study design where the same subjects undertook all three protocols, this would have required arterial catheterisation of our volunteers on at least six occasions, which we felt was difficult to justify. Although PET,CO2 is a fairly good approximation of Pa,CO2, there is nevertheless a difference between the two variables, and this difference changes with the level of exercise (Robbins et al. 1990). At rest, PET,CO2 is lower than Pa,CO2, but during exercise PET,CO2 rises to a value above Pa,CO2. Thus, if Pa,CO2 remains constant with exercise, PET,CO2 will rise. Robbins et al. (1990) reported that the difference between PET,CO2 and Pa,CO2 changed on average by ≈ 4 Torr from rest to 100 W exercise, which would seem to be in keeping with the average difference of ≈ 6 Torr from rest to the average work rate of 134 W in the present study.
A second complication of the present study was the finding that repeated bouts of exercise without an airway CO2 load (protocol EX) resulted in a reduction in the increment in with exercise in the days immediately following training. This was the result of a significant reduction in the increment of VT from rest to exercise after protocol EX. Although we did not expect this result, previous studies of exercise training, somewhat dissimilar from our own, have also reported a reduction in (Rasmussen et al. 1975; Casaburi et al. 1987). Theoretically, this could result from an increase in efficiency with which the exercise is undertaken, an alteration of metabolic substrate employed or a reduction in the respiratory dead space. The latter would seem less likely given that there were no significant changes in fR. Importantly, from our perspective the change that occurred with training was a change in without a change in PET,CO2. Such a change would be entirely in keeping with the notion that the respiratory response to exercise slowly adapts to ensure isocapnia when internal factors change.
In contrast to protocol EX, protocol CO2 had no effects on the ventilatory response to exercise. Thus, if the null hypothesis of this study were to hold true (i.e. that there is no learning associated with repeated episodes of chemoreceptor stimulation paired with exercise), then the effects observed with protocol EX + CO2 would need to be the same as those for protocol EX. This is clearly not the case. First, following training with exercise and CO2, the normal response to exercise has become hypocapnic, which is not the case after training with exercise alone. Secondly, at regulated PET,CO2 (open-loop responses), the ventilatory response to exercise following training with exercise and CO2 is increased, whereas it is decreased following training with exercise alone.
Comparison with other studies
Long-lasting changes in the control of during exercise, which are indicative of mechanisms involving learning, have been demonstrated in goats following surgery to denervate proprioceptors in the chest wall (Mitchell et al. 1988). After surgery, the normal ventilatory response to exercise was abolished, with goats becoming severely hypercapnic during exercise. Over repeated trials of exercise, a normal response was re-established. This can not be explained by functional recovery, and hence the authors concluded that it was due to adaptive control mechanisms that had modified components of the respiratory control system (Mitchell et al. 1990). They proposed that this mechanism was elicited by repeated associations of chemoreceptor feedback with exercise, and indeed, subsequently demonstrated that repeated exercise paired with hypercapnia (induced by increasing the respiratory dead space) augmented the subsequent ventilatory response to exercise alone (Martin et al. 1990).
In humans, results from similar studies pairing exercise with dead space have been far less convincing. It does appear that pairing exercise with dead space may have some effect on the time course of the rapid transient in at the start of exercise (Helbling et al. 1997; Turner & Sumners, 2002). Furthermore, there are two preliminary reports (Adams et al. 1992; Turner et al. 1996) that repeated pairings of dead space and exercise alter the subsequent steady-state ventilatory response to exercise. However, neither of these findings has been substantiated within the context of a full publication, and furthermore the preliminary findings of Adams et al. (1992) have been attributed to habituation to the experience of performing exercise in the laboratory in a later full publication by the same group of authors (Moosavi et al. 2002).
Three full publications and one preliminary publication have reported no effect of repeated pairings of dead space and exercise on the subsequent steady-state response to exercise (Helbling et al. 1997; Cathcart et al. 2000; Moosavi et al. 2002; Turner & Sumners, 2002). In all but one of these studies (Helbling et al. 1997), the period of conditioning has been undertaken within a single day. In the study by Helbling et al. (1997). the conditioning consisted of 16 sessions of arm-cranking exercise paired with added dead space over an 8 day period. In this study there was a 2 day gap in the middle of the training period, whereas the present study employed a training protocol of 7 consecutive days.
Unlike the studies by Helbling et al. (1997) and Turner & Sumners (2002). our primary focus was on the steady-state response to exercise. As such, a detailed analysis of the transient in ventilation before a steady state was achieved has not been undertaken. For this reason, we are unable to comment on how the transient might have been modified after the training protocols.
We consider that the principal difference between the present study and previous studies investigating a learned component to the ventilatory response to exercise in humans relates to the training protocol employed. In the present study there were 70 rest-to-exercise transitions in the training period, whereas for previous studies the maximum number has been 16. In general, it is well-recognised that the learning of a motor skill often requires many repetitions over several training sessions, and in addition a period of consolidation may be required in order for performance gains to be fully expressed (Karni et al. 1998). There is little reason to suppose that learning the respiratory response to exercise should be any different in this respect. Indeed, given the length of time over which learning has occurred, it may well be the case that longer protocols than that employed in the present study would have greater effects on the ventilatory response to exercise. Clearly, much more experimental work is required before the components that are important for learning to occur are properly identified.
A further difference between our study and those conducted previously lies in the nature of the respiratory stimulus that was paired with exercise. Previous studies (Helbling et al. 1997; Cathcart et al. 2000; Moosavi et al. 2002; Turner & Sumners, 2002) have all paired added dead space with exercise. However, it has been observed that dead space may have mechanical as well as chemical influences on , such as changes in the endogenous resistance that may affect the proprioceptors (Martin & Mitchell, 1993). We have avoided any possible mechanical influence on by inducing hypercapnia by adding CO2 to the inspired air. The dead space used by Turner & Sumners (2002) induced hypercapnia of 6–8 Torr, which is similar to the level used in the present study. We can assume that the degree of hypercapnia would have been similar in the study by Helbling et al. (1997) as they used a very similar dead space volume (1.5 l) to Turner & Sumners (2002). Moosavi et al. (2002) have stated that their protocol may have been adversely affected by using a small dead space volume (0.6 l), which induced a lesser degree of hypercapnia.
Congenital central hypoventilation syndrome
Congenital central hypoventilation syndrome (CCHS) is a syndrome in which patients have ineffective chemoreceptor regulation of breathing and severe hypoventilation during sleep. If Somjen's (1992) hypothesis is correct, such patients might be expected to have a ventilatory response to exercise that is poorly controlled in relation to metabolism because they may not have the chemoreceptor feedback necessary with which to learn the calibration of their exercise response. Shea et al. (1993) investigated the respiratory response to exercise in five children with CCHS together with five controls. On average, they found that there was a similar small increase in PET,CO2 in both groups. They concluded that chemoreceptors are not necessary for an appropriate ventilatory response to aerobic exercise. However, we do not consider that their data really support this conclusion. In particular, from the individual data plotted in their figures, we estimate that the variance of the change in PET,CO2 from rest to exercise is some five- to sixfold greater in the children with CCHS than in their normal controls. Finally, although it is clear that patients with CCHS lack a reflex stimulation of by CO2, it is not necessarily clear that the defect is in the afferent limb of the reflex loop and that these patients also lack chemoreception through which the ventilatory response to exercise could be calibrated.
Concluding remarks
In conclusion, the results of the present study demonstrate that humans, like goats, can learn the appropriate calibration of the feedforward mechanisms that regulate breathing in exercise, with the chemoreceptors providing the sensory feedback that is necessary for such learning to occur. Such a mechanism provides a solution to the longstanding problem of how, during exercise, feedforward stimuli can provide a respiratory response that is so tightly coupled to metabolism.
Acknowledgments
We thank Mr David O'Connor for his skilled technical assistance. This study was supported by the Wellcome Trust. Helen E. Wood held a Wellcome Prize Studentship.
REFERENCES
- Adams L, Moosavi S, Guz A. Ventilatory response to exercise in man increases by prior conditioning of breathing with added dead space. Am Rev Respir Dis. 1992;145:A882. [Google Scholar]
- Borg GAV. Psychophysical bases of perceived exertion. Med Sci Sports Exerc. 1982;14:377–381. [PubMed] [Google Scholar]
- Casaburi R, Storer TW, Wasserman K. Mediation of reduced ventilatory response to exercise after endurance training. J Appl Physiol. 1987;63:1533–1538. doi: 10.1152/jappl.1987.63.4.1533. [DOI] [PubMed] [Google Scholar]
- Cathcart AJ, Herrold N, Turner AP, Wilson J, Ward SA. Absence of long-term modulation in response to external dead space loading during moderate exercise in humans. J Physiol. 2000;44P:528P. doi: 10.1007/s00421-004-1218-y. [DOI] [PubMed] [Google Scholar]
- Haldane JS, Priestley JG. The regulation of the lung-ventilation. J Physiol. 1905;32:225–266. doi: 10.1113/jphysiol.1905.sp001081. [DOI] [PMC free article] [PubMed] [Google Scholar]
- Helbling D, Boutellier U, Spengler CM. Modulation of the ventilatory increase at the onset of exercise in humans. Respir Physiol. 1997;109:219–229. doi: 10.1016/s0034-5687(97)00054-6. [DOI] [PubMed] [Google Scholar]
- Howson MG, Khamnei S, O'Connor DF, Robbins PA. The properties of a turbine device for measuring respiratory volumes in man. J Physiol. 1986;382:12P. [Google Scholar]
- Karni A, Meyer G, Rey-Hipolito C, Jezzard P, Adams MM, Turner R, Ungerleider LG. The acquisition of skilled motor performance: fast and slow experience-driven changes in primary motor cortex. Proc Natl Acad Sci U S A. 1998;95:861–868. doi: 10.1073/pnas.95.3.861. [DOI] [PMC free article] [PubMed] [Google Scholar]
- Martin PA, Mitchell GS. Long-term modulation of the exercise ventilatory response in goats. J Physiol. 1993;470:601–617. doi: 10.1113/jphysiol.1993.sp019877. [DOI] [PMC free article] [PubMed] [Google Scholar]
- Martin PA, Mitchell GS, Brown KL, Kaarakka P. Paired exercise and chemoreceptor stimulation alter subsequent ventilatory responses to exercise. FASEB J. 1990;4:A540. [Google Scholar]
- Mitchell GS, Douse MA, Foley KT. Receptor interactions in modulating ventilatory activity. Am J Physiol. 1990;259:R911–920. doi: 10.1152/ajpregu.1990.259.5.R911. [DOI] [PubMed] [Google Scholar]
- Mitchell GS, Foley K, McGuirk S, Selby BD, Schaefer SA, Lange KJ. Effects of thoracic dorsal rhizotomy (TDR) on ventilatory control during mild exercise in goats. FASEB J. 1988;2:A1508. [Google Scholar]
- Moosavi SH, Guz A, Adams L. Repeated exercise paired with ‘imperceptible’ dead space loading does not alter the VE of subsequent exercise in humans. J Appl Physiol. 2002;92:1159–1168. doi: 10.1152/japplphysiol.00358.2001. [DOI] [PubMed] [Google Scholar]
- Pandit JJ, Robbins PA. Ventilation and gas exchange during sustained exercise at normal and raised CO2 in man. Respir Physiol. 1992;88:101–112. doi: 10.1016/0034-5687(92)90032-r. [DOI] [PubMed] [Google Scholar]
- Rasmussen B, Klausen K, Clausen JP, Trap-Jensen J. Pulmonary ventilation, blood gases, and blood pH after training of the arms or the legs. J Appl Physiol. 1975;38:250–256. doi: 10.1152/jappl.1975.38.2.250. [DOI] [PubMed] [Google Scholar]
- Robbins PA, Conway J, Cunningham DA, Khamnei S, Paterson DJ. A comparison of indirect methods for continuous estimation of arterial PCO2 in men. J Appl Physiol. 1990;68:1727–1731. doi: 10.1152/jappl.1990.68.4.1727. [DOI] [PubMed] [Google Scholar]
- Robbins PA, Swanson GD, Howson MG. A prediction-correction scheme for forcing alveolar gases along certain time courses. J Appl Physiol. 1982;52:1353–1357. doi: 10.1152/jappl.1982.52.5.1353. [DOI] [PubMed] [Google Scholar]
- Shea SA, Andres LP, Shannon DC, Banzett RB. Ventilatory responses to exercise in humans lacking ventilatory chemosensitivity. J Physiol. 1993;468:623–640. doi: 10.1113/jphysiol.1993.sp019792. [DOI] [PMC free article] [PubMed] [Google Scholar]
- Somjen GG. The missing error signal-regulation beyond negative feedback. News Physiol Sci. 1992;7:184–185. [Google Scholar]
- Turner DL, Greenway JR, Lawrence H, Lyons P, Taylor MR, Iqbal ZM. Long-term modulation of ventilatory control in exercising humans (Abstract) Neurosci Abstr. 1996;22:1602. [Google Scholar]
- Turner DL, Sumners DP. Associative conditioning of the exercise ventilatory response in humans. Respir Physiol Neurobiol. 2002;132:159–168. doi: 10.1016/s1569-9048(02)00075-7. [DOI] [PubMed] [Google Scholar]
- Wasserman K, Van Kessel AL, Burton GG. Interaction of physiological mechanisms during exercise. J Appl Physiol. 1967;22:71–85. doi: 10.1152/jappl.1967.22.1.71. [DOI] [PubMed] [Google Scholar]
- Zuntz N, Geppert J. Ueber die Natur der normalen Atemreize und den Ort ihrer Wirkung. Pflügers Arch Gesamte Physiol Menschen Tiere. 1886;38:337–338. [Google Scholar]