

Abstract
We investigated the properties of glycine receptors and glycinergic synaptic inputs at the axon terminals of rod bipolar cells (RBCs) in rats by patch-clamp recording. Glycine currents recorded from isolated axon terminals were larger than those from isolated somata/dendrites; this was confirmed by puffing glycine onto these two regions in retinal slices. The current density at terminal endings was more than one order of magnitude higher than the density at somatic/dendritic regions. Glycine currents from isolated terminals and isolated somata/dendrites showed similar sensitivity to picrotoxinin blockade. Single-channel opening recorded from isolated terminals and somata/dendrites displayed a similar main-state conductance of ≈46 pS. Application of glycine effectively suppressed depolarization-evoked increases in intracellular Ca2+ at the terminals. In the presence of GABAA and GABAC antagonists, strychnine-sensitive chloride currents were evoked in RBCs in retinal slices by puffing kainate onto the inner plexiform layer. No such currents were observed if the recorded RBCs did not retain axon terminals or if Ca2+ was replaced by Co2+ in the extracellular solution. The currents displayed discrete miniature-like events, which were partially blocked by tetrodotoxin. Consistent with early studies in the rabbit and mouse, this study demonstrates that glycine receptors are highly concentrated at the axon terminals of rat RBCs. The pharmacological and physiological properties of glycine receptors located in the axon terminal and somatic/dendritic regions, however, appear to be the same. This study provides evidence for the existence of functional glycinergic synaptic input at the axon terminals of RBCs, suggesting that glycine receptors may play a role in modulating bipolar cell synaptic transmission.
Glycine is one of the major inhibitory neurotransmitters in several regions of the CNS (Aprison, 1990), including the vertebrate retina (Yazulla, 1986; Massey & Redburn, 1987; Marc, 1989; Pourcho & Goebel, 1990). Retinal bipolar cells - the second-order neurons in the retina - relay visual information from photoreceptors to third-order neurons, amacrine, and ganglion cells (Werblin & Dowling, 1969). The axon terminals of bipolar cells, where synaptic transmission to third-order neurons occurs, also receive inhibitory synaptic inputs from amacrine cells, with GABA and glycine as the primary neurotransmitters. However, less is known about the properties and functions of glycine receptors at the axon terminals of bipolar cells than about those of GABA receptors, especially in mammals (Maple & Wu, 1998).
Mammalian retinas contain a single type of rod bipolar cell (RBC), which processes visual signals under scoptopic conditions (Bloomfield & Dacheux, 2001). Although the expression of functional glycine receptors in mammalian RBCs has been well-documented (Suzuki et al. 1990; Yeh et al. 1990; Karschin & Wässle, 1990; Gillette & Dacheux, 1995), it remains unclear whether glycine receptors play a role in RBC visual processing. Information about the cellular localization of glycine receptors may provide valuable insights. However, reports about the spatial distribution of glycine receptors on RBCs have not been consistent. Electrophysiological recording studies showed higher glycine sensitivity in the terminal region than in the somatic/dendriticregions of rabbit and mouse RBCs (Suzuki et al. 1990; Gillette & Dacheux, 1995), but this property was not observed in an early study in rat RBCs (Karschin & Wässle, 1990). Single-cell PCR studies detected the expression of mRNA for glycine α1 and β subunits in RBCs (Enz & Bormann, 1995), but other studies reported the almost complete absence of immunoreactivity for glycine subunits in the terminal region of RBCs (Grunert & Wässle, 1993; Greferath et al. 1994; Sassoe-Pognetto et al. 1994). Furthermore, it is not known whether there is functional glycinergic synaptic input onto the axon terminals of RBCs.
In this study, we investigated the properties and potential functions of glycine receptors at the axon terminals of RBCs in the rat. We first assessed the spatial distribution of glycine receptors on RBCs by direct patch-clamp recordings of isolated presynaptic terminals and by focal puffing of glycine in retinal slices. We found that glycine receptors are highly concentrated at the axon terminals of RBCs. The pharmacological and biophysical properties of glycine receptors located in the axon terminal and somatic/dendriticregions are similar. Furthermore, we present evidence for the existence of glycinergic synaptic inputs onto the axon terminals of RBCs and show that activation of glycine receptors could effectively suppress depolarization-evoked calcium influx into the axon terminals.
METHODS
Dissociation of bipolar cells
Bipolar cells were dissociated from Long-Evans rats <4 weeks of age as described previously (Pan & Lipton, 1995; Pan, 2000). All animal handling procedures were approved by the Institutional Animal Care Committee at Wayne State University, and were in accord with the NIH Guide for the Care and Use of Laboratory Animals. In brief, animals were deeply anaesthetized with CO2 and killed by decapitation. Retinas were removed and placed in a Hanks’ solution (mm): NaCl, 138; NaHCO3, 1; Na2HPO4, 0.3; KCl, 5; KH2PO4, 0.3; CaCl2, 1.25 or 2.5; MgSO4, 0.5; MgCl2, 0.5; Hepes-NaOH, 5; glucose, 22.2; with phenol red, 0.001 % v/v; pH 7.2. The retinas were incubated for ≈40-50 min at 34–37 °C in an enzymatic solution that consisted of Hanks’ solution (described above), supplemented with dl-cysteine, 0.2 mg ml−1; bovine serum albumin, 0.2 mg ml−1; and papain, ≈2 u ml−1. After several rinses in Hanks’ solution, the retinas were mechanically dissociated by gentle trituration with a glass pipette. The dissociated cells were plated onto culture dishes in normal or Ca2+-free Hanks’ solution. Cells were kept at room temperature and used for recordings within 5 h. The use of Ca2+-free Hanks’ solution for cell culture was found to help maintain healthier axon terminals of bipolar cells. The Ca2+-free Hanks’ solution is the same as the Hanks’ solution described above except for the omission of Ca2+ ions.
Isolated axon terminal preparation
The isolated axon terminal preparation of rat bipolar cells has previously been described (Pan, 2001; Pan et al. 2001). The identification of isolated terminals and somata/dendritesof RBCs was based on their morphological properties. It has been well-characterized that RBCs have bush-like dendrites, thick long axons, and large knob-shaped terminal endings (Greferath et al. 1990; Karschin & Wässle, 1990; Hartveit, 1996). In contrast, cone bipolar cells (CBCs) have sparser dendritic trees and thinner axons. Their terminal endings, in particular, are smaller but numerous (Eular & Wässle, 1995; Hartveit, 1996). These distinct morphological differences between RBCs and CBCs have also been observed in isolated preparations and confirmed by protein kinase C staining (Gillette & Dacheux, 1995; Pan, 2000). Previous studies reported that the vast majority of the isolated bipolar cells were PKC positive (Wood et al. 1988; Greferath et al. 1990; Pan, 2000). Since the dendrites of RBCs are so characteristic, in many cases, these cells could easily be recognized even without axons or axon terminals that had been lost during dissociation. Occasionally, isolated axon terminals were found after cell dissociation. We refer to them as RBC terminals for the following reasons (Pan, 2001). First, their morphological properties closely resemble those of the axon terminals of RBCs but not those of CBCs. Second, the properties of membrane currents, such as voltage-dependent Ca2+ currents, recorded from these isolated axon terminals were similar to those of intact RBCs but not to those of CBCs. In addition, we found that recording of intact CBCs by sealing on their terminal ends was extremely difficult if not entirely impossible, suggesting that the chance of successfully recording any possibly misidentified isolated axon terminals of CBCs would be extremely low. Therefore, we believe that at least the majority of our recordings of isolated axon terminals were from RBCs, although we cannot exclude the possibility of having recording from isolated terminal of CBCs.
Retinal slice preparation
Retinal slices were prepared by procedures previously described (Werblin, 1978; Pan et al. 2001). Retinal slices ≈150 μm thick were mounted in a glass-bottomed recording chamber with Vaseline strips. The recording chamber was mounted on the stage of an upright microscope equipped with a 40 × water immersion objective with differential interference contrast and epifluorescence optics. The recording chamber was continuously superfused with oxygenated Hanks’ solution at a rate of ≈2 ml min−1. RBCs were identified on the basis of their soma position in the distal portion of the inner nuclear layer and their large knob-shaped terminals in the most proximal portion of the inner plexiform layer (IPL) (Euler & Wässle, 1995; Hartveit, 1996).
Patch-clamp recordings
Recordings with patch electrodes in the whole-cell configuration were made by standard procedures with an EPC-9 amplifier and PULSE software (Heka Electronik, Germany). Electrodes were coated with SYLGARD (Dow Corning, Midland, MI, USA) and fire-polished. The resistance of the electrode was 7–10 MΩ and 13–16 MΩ when filled with a CsCl- and K-gluconate-based electrode solution, respectively. Series resistance was typically around 20 MΩ in soma recordings and higher in terminal and slice recordings but usually <40 MΩ. Series resistance was not compensated. Cell capacitance was cancelled, and the values were recorded. The sampling rate of the recordings was usually 2–10 kHz except in the long-duration synaptic current recordings in retinal slices of which the sampling rate was 1–2 kHz. The filter frequency (low-pass) was at least one-half to one-third of the sampling rate. All recordings were made in the Hanks’ solution described above with either 1.25 or 2.5 mm Ca2+ in isolated cell recordings and 2.5 mm Ca2+ in slice recordings. For recording currents evoked by puffing glycine, the electrode solution contained (mm): CsCl, 120; TEA-Cl, 20; MgCl2, 1; CaCl2, 0.5; EGTA, 5; and Hepes, 10. The pH was adjusted with CsOH to 7.4. Na-GTP (0.5 mm) and Na-ATP (2 mm) were added to the electrode solution in most recordings. The chloride reversal potential under this condition is ≈0 mV. For recording synaptic currents evoked by puffing kainate in retinal slices, the electrode solution contained (mm): K-gluconate, 133; KCl, 7; MgCl2, 4; EGTA, 0.1; Hepes, 10; Na-GTP, 0.5; and Na-ATP, 2. The pH was adjusted with KOH to 7.4. The calculated chloride reversal potential under this latter condition was −58 mV. Liquid junction potentials were measured (3 mV and 10 mV for the CsCl and K-gluconate-based electrode solutions, respectively) and corrected. The fluorescence dye Alexa 488 was added to the electrode solution at a concentration of 100 μm. The morphology of the recorded cells in retinal slices was examined after the recordings. Fluorescence images of some recorded cells were taken with a digital camera (SPOT). All recordings were performed at room temperature (≈22 °C).
Ca2+ imaging
The experimental procedures for Ca2+ imaging have been described previously (Pan & Lipton, 1995). Isolated cells were loaded with the membrane-permeable fluorescent dye fluo-3/AM (Molecular Probes, OR, USA) at a concentration of 20 μm that was supplemented with 0.0025 % pluronic acid and kept in the dark for 1 h. Then the cells were washed with Hanks’ solution three or four times and kept in darkness for another hour before fluorescence was measured. Fluorescence measurements were performed with a confocal laser-scanning microscope (Noran, WI, USA) coupled with imaging system software (Universal Imaging, PA, USA). Optical excitation was achieved using the 488 nm line of an argon laser. The emitted fluorescence passed through a 515 nm primary barrier filter before it reached the photomultiplier tube. The recording solution was the same as the Hanks’ solution described above with 2.5 mm Ca2+. Depolarization was evoked by puffing 40 mm K+ saline, formulated by replacement of equimolar Na+ in the Hanks’ solution. Recordings were all made from intact RBCs. The fluorescence images were acquired in the real-time mode (30 frames s−1). The time course of the averaged fluorescence from a small-defined region, e.g. axon terminals, and/orthe averaged fluorescence images of the recorded cells were stored.
Chemical agent application and data analysis
For isolated cell recordings, chemical agents were applied by local superfusion through multiple-barrelled, gravity-driven pipettes with a final outlet (diameter ≈70 μm) placed ≈200-300 μm from the cell. During Ca2+ imaging, high-K+ saline or high-K+ saline plus glycine was applied with puffer pipettes (diameter ≈1 μm; air pressure ≈20 psi) placed about 30–40 μm away from the cell. Puffing control saline (normal Hanks’) was not found to evoke any Ca2+ response. In retinal slice recordings, glycine or kainate also was applied with puffer pipettes. For applying glycine, the puffer pipette (diameter 0.5 μm; air pressure ≈10 psi) was placed ≈5-10 μm from the terminal or soma of the recorded cells. For monitoring the puffer pipette location and the spread of the puffer solution, the fluorescence dye Alexa 488 was added to the puffer solution. Based on visual inspection, the spread of the puffer solution from the terminal to soma or vice versa was minimal. It was confirmed that puffing glycine at the inner part of the IPL did not evoke any significant glycine current from a RBC that had lost the axon terminal. For applying kainate, the puffer pipette (diameter 1 μm; air pressure ≈25 psi) was placed in the middle of the IPL about 30 μm away from the terminal region of the recorded RBCs. The duration of puffing kainate was usually 50 ms. Puffing control solution was not found to evoke any currents. Other chemical agents in slice recordings were applied by bath superfusion. Alexa 488 dye was purchased from Molecular Probes (Eugene, OR, USA). Tetrodotoxin (TTX) was purchased from Alomone Lab (Jerusalem, Israel). All other chemicals were purchased from Sigma-Aldrich (St. Louis, MO, USA). Data were analysed off-line using PULSEFIT (Heka Electronik, Germany) and ORIGIN (Microcal Software, Northampton, MA, USA) programs. Data are presented as means ±s.e.m. unless otherwise specifically indicated.
RESULTS
Spatial distribution of glycine receptors
To examine the properties of glycine receptors located at the terminal region of RBCs, we performed patch-clamp recordings on isolated terminals of RBCs. Figure 1A shows a typical axon isolated terminal. In most cases, the isolated axon terminals retained a portion of the axonal process. Occasionally, terminals that contained almost no axon were found and recorded (Fig. 1B); we refer to the latter as terminal endings. For comparison, recordings were also made from RBCs that had lost their terminals (Fig. 1C), which we refer to as isolated somata/dendrites. Application of glycine evoked inward currents from all three preparations when the membrane potential was held at −60 mV. Figure 1D–F depict the corresponding currents evoked by 200 μm glycine from the cells shown in Fig. 1A–C, respectively. The glycine-evoked currents reversed at ≈0 mV. Figure 1G shows a sample recording from an isolated axon terminal by ramp stimulation in the control and in the presence of glycine (200 μm). The average reversal potential for the glycine-evoked currents was 3.4 ± 1.1 mV (n = 4), close to the expected chloride reversal potential under our recording conditions (see Methods). Furthermore, the glycine-evoked currents from both isolated terminals (n = 3) and isolated somata/dendrites (n = 3) were antagonized by strychnine. Figure 1H shows a sample recording from an isolated axon terminal evoked by glycine (200 μm) (black trace), by co-application of glycine and strychnine (2 μm), and by glycine after washing out strychnine (grey trace). These results indicate that the current evoked by glycine is mediated via strychnine-sensitive glycine receptors.
Figure 1. Glycine-evoked currents from isolated terminals and somata/dendritepreparations.
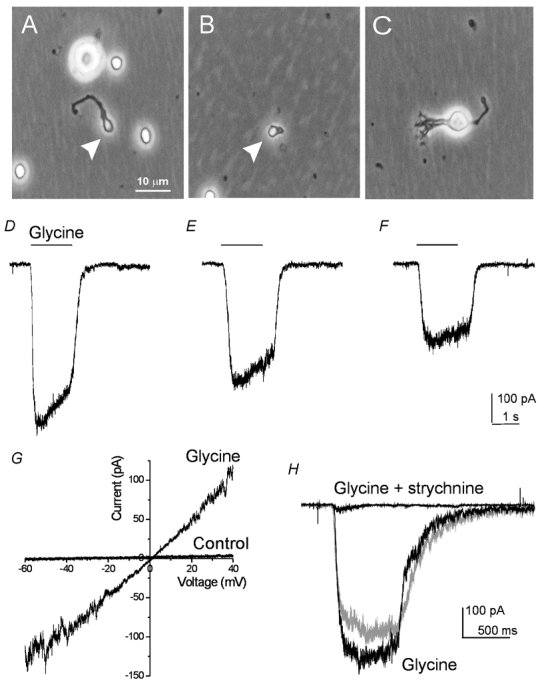
A–C, phase photomicrograph of an isolated axon terminal (A), a terminal ending (B), and an isolated soma/dendritethat contained no axon terminal (C). The terminals in A and B are indicated by arrowheads. D–F, glycine-evoked currents from the cells shown in A–C, respectively. G, sample recording from an isolated axon terminal by ramp stimulation at a speed of 100 mV s−1 in the control and in the presence of glycine (200 μm). The average reversal potential of the currents was 3.4 ± 1.1 mV (mean ±s.e.m., n = 4). H, sample recording of the currents from an isolated axon terminal evoked by glycine (200 μm), of co-application of glycine and strychnine (2 μm), and of glycine after washing out strychnine (grey trace).
The amplitude of the glycine current recorded from isolated terminals was always larger than that from isolated somata/dendrites (Figs. 1D and F). To ensure that cell dissociation did not alter this property, we examined the spatial distribution of the glycine-evoked currents from RBCs in retinal slices. In this set of experiments, recordings were made on the soma. RBCs were identified by dye filling (Fig. 2A). To reduce the possible chloride overload, especially in the axon terminals, cells were held at −30 mV instead of −60 mV in the slice recordings. Glycine (200 μm) was applied with a puffer pipette. Figure 2B shows sample recordings from a RBC. The evoked currents were again larger when glycine was puffed at the terminal (bottom trace) than when glycine was puffed onto the soma (top trace) in all test RBCs (n = 11). The average peak current from the terminals and the somata was 123 ± 43 pA and 79 ± 11 pA, respectively (Fig. 2C). The ratio of the peak current between terminals and somata was 1.9 ± 0.4 (n = 11). In addition, the evoked currents reversed close to the expected reversal potential of chloride (Fig. 2D). The value was −3.1 ± 0.7 mV (n = 5) for puffing at the terminals and 1.3 ± 0.2 mV for puffing at the somata. The small discrepancy between the terminal and soma could be due to a combination of several factors: (1) poor chloride concentration clamp in the axon terminals; (2) difference in the concentration of glycine channel-permeable metabolic molecules, such as bicarbonate; (3) voltage error due to uncompensated series resistance.
Figure 2. Comparison of current evoked by focal glycine puffing at the axon terminals and somata/dendritesin retina slices.
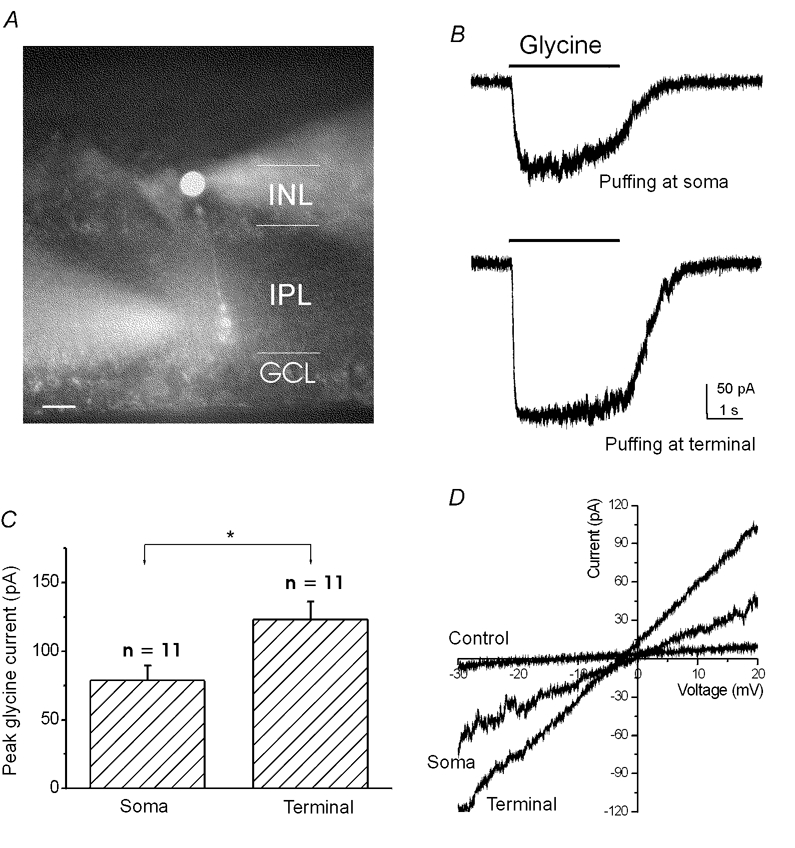
A, a morphologically identified RBC in the retinal slice. Both the recording electrode and puffer pipette contained Alexa 488. The puffer pipette was aimed at the axon terminal. INL, inner nuclear layer; IPL, inner plexiform layer; GCL, ganglion cell layer. Scale bar: 10 μm. B, sample currents evoked by puffing glycine at the soma (top trace) and at the axon terminal (lower trace). C, the average peak current was 123 ± 43 pA (mean ±s.e.m., n = 11) for puffing glycine at the axon terminals and 79 ± 11 pA for puffing glycine at the somata. *P < 0.05; One-way ANOVA test. D, the currents evoked by puffing glycine at the axon terminal and the soma with ramp stimulation from −30 to 20 mV at a speed of 100 mV s−1. The average reversal potential of the current was −3.1 ± 0.7 mV (mean ±s.e.m., n = 5) for puffing glycine at the axon terminal and 1.3 ± 0.2 mV for puffing glycine at the soma.
To quantify the spatial distribution of glycine receptors, we compared glycine-evoked current amplitudes and current densities recorded from the above-described three isolated cell preparations at the holding potential of −60 mV. The mean peak amplitude for isolated terminals, terminal endings, and isolated somata/dendriteswas 582 ± 51 pA (n = 25), 372 ± 46 pA (n = 5), and 241 ± 20 pA (n = 33), respectively (Fig. 3A). For these same recordings, the mean membrane capacitance for isolated terminals, terminal endings, and isolated somata/dendriteswas 1.33 ± 0.10 pF, 0.47 ± 0.16 pF, and 3.00 ± 0.12 pF, respectively (Fig. 3B). The mean current density calculated from these values, expressed as the ratio of current amplitude to capacitance, was 577 ± 95 pA pF−1 for isolated terminals, 1188 ± 345 pA pF−1 for terminal endings, and 82.2 ± 6.6 pA pF−1 for isolated somata/dendrites (Fig. 3C). The mean current densities of the isolated terminals and the terminal endings were approximately 7- and 14-fold greater than that of the somata/dendrites. Here, we could also estimate the current density in the axons; since the difference of the average currents and capacitances between isolated axon terminals and terminal endings was 210 pA and 0.86 pF, respectively, the average current density in the axons would be 244 pA pF−1. This suggests that glycine current density in the axons is intermediate between that of the terminal endings and somata/dendrites.
Figure 3. Comparison of glycine-evoked current amplitude and glycine current density from isolated axon terminals, terminal endings, and isolated somata/dendrites.
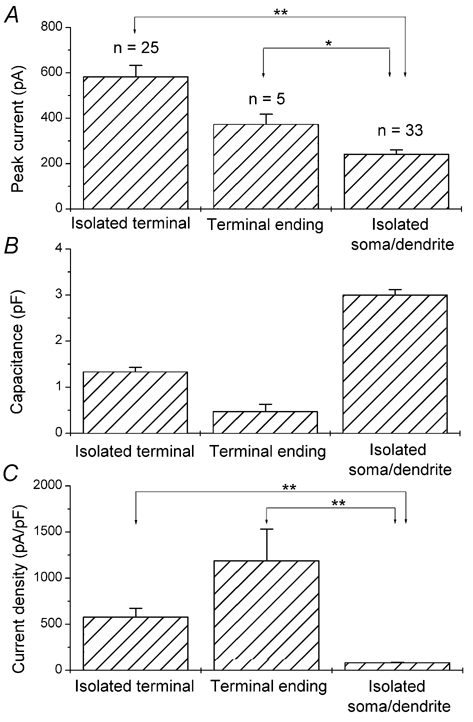
A, mean peak current evoked by 200 μm glycine at a holding potential of −60 mV. The value for isolated terminals, terminal endings, and isolated somata/dendriteswas 582 ± 51 pA (n = 25), 372 ± 46 pA (n = 5), and 241 ± 20 pA (n = 33), respectively. B, mean membrane capacitances. The value for isolated terminals, terminal endings, and isolated somata/dendriteswas 1.33 ± 0.10 pF, 0.47 ± 0.16 pF, and 3.00 ± 0.12 pF, respectively. C, mean glycine-evoked current density. The calculated mean current density, expressed as the ratio of current amplitude to capacitance, was 577 ± 95 pA pF−1 for isolated terminals, 1188 ± 345 pA pF−1 for terminal endings, and 82.2 ± 6.6 pA pF−1 for isolated somata/dendrites. The data are mean ±s.e.m. from the indicated number of cells. **P < 0.001; *P < 0.05 (one-way ANOVA test).
Pharmacological properties of glycine receptors at axon terminals
The high glycine current density at the terminals contrasts with the absence of the significant immunoreactivity of glycine α subunits in the terminal region of RBCs (Grunert & Wässle, 1993; Greferath et al. 1994; Sassoe-Pognetto et al. 1994). A single-cell PCR study reported that RBCs expressed mRNAs of glycine α1 and β subunits (Enz & Bormann, 1995). It is known that heteromeric α/β glycine receptors are more resistant to picrotoxinin (PTX) than are homomeric α glycine receptors (Pribilla et al. 1992; Shan et al. 2001). Enz and Bormann (1995) proposed, on the basis of the PTX sensitivity of the glycine current from the intact cell recordings, that the glycine receptors in rat RBCs are composed of heteromeric α1/β subunits. To determine whether the glycine receptors located in the axon terminal region had a molecular composition different from that of other regions of the cell, we compared the PTX sensitivity of the glycine current recorded from isolated axon terminals with that from isolated somata/dendrites. We found that a significant portion of the current evoked by 200 μm glycine recorded from isolated axon terminals remained in the presence of 100 μm PTX (Fig. 4A). This suggests that glycine receptors at the terminals also are composed, at least in part, of heteromeric α/β channels. Furthermore, glycine currents from isolated axon terminals and isolated somata/dendrites (Fig. 4B) displayed a similar sensitivity to PTX. The percentage of the current remaining in the presence of PTX was 33 ± 2 % (n = 5) for isolated axon terminals and 33 ± 4 % (n = 4) for isolated somata/dendrites (Fig. 4B).
Figure 4. Comparison of PTX sensitivity of glycine-evoked currents recorded from isolated axon terminals and isolated somata/dendrites.
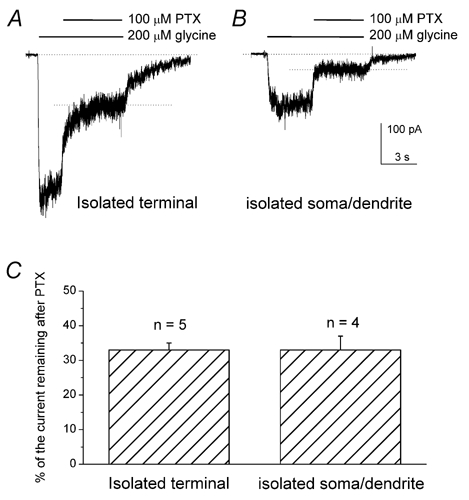
A, representative recording from an isolated axon terminal. B, representative recording from an isolated soma/dendrite. Application of PTX reduced the glycine-evoked current, which eventually reached a plateau (dotted lines). The degree of PTX blockade was calculated from the ratio of the plateau to peak current. C, bar graph of PTX inhibition. The mean percentage of glycine-evoked current that remained in the presence of PTX was 33 ± 2 % (mean ±s.e.m., n = 5) for isolated axon terminals and 33 ± 4 % (n = 4) for isolated somata/dendrites. Cells were held at −60 mV.
Single-channel conductance
It has been reported that the main-state single-channel conductances for homomeric glycine channels and heteromeric glycine channels are different (Bormann et al. 1993). In our whole-cell recordings of isolated cells, single-channel-like activities were observed in the late phase of the glycine response (right after the termination of glycine) in a time window of ≈3-5 s. In a small percentage of the recorded cells (6 of 30 terminals; 6 of 33 somata/dendrites), discrete single-channel events were clearly resolved (Fig. 5). Due to the short appearance of these events under our recording conditions, we did not directly examine their pharmacology and reversal potential. The results shown in Fig. 1 suggest that these are single-channel events of glycine receptors because, for example, strychnine blocked the macroscopic glycine currents, as well as any such single-channel-like activities in the late phase of the glycine response (Fig. 1H). Thus, this provided an additional avenue for comparing the properties of glycine receptors in the axon terminal region with those in the somatic/dendriticregions. Figure 5 shows sample traces from an isolated axon terminal (A) and an isolated soma/dendrite (B); single-channel events with mean current levels of 2.9 pA and 2.8 pA were observed at the holding potential of −60 mV for the isolated axon terminal and the isolated soma/dendriterecordings, respectively. These correspond to unitary conductances of 49 pS and 48 pS, respectively. Although single-channel events with conductances significantly lower or higher (ranging from 25 to 101 pS) than these values were occasionally observed, conductances close to these values were predominant in every recording in which single-channel events were observed. Thus, these values are likely to represent the main-state conductance. The mean value was 46.6 ± 1.3 pS (n = 6) for isolated terminals and 45.0 ± 1.1 pS (n = 6) for isolated somata/dendrites (Fig. 5C). These results suggest that the main-state conductances of glycine receptor channels are the same in the axon terminal and somatic/dendriticregions.
Figure 5. Single-channel events evoked by glycine during whole-cell patch-clamp recordings.
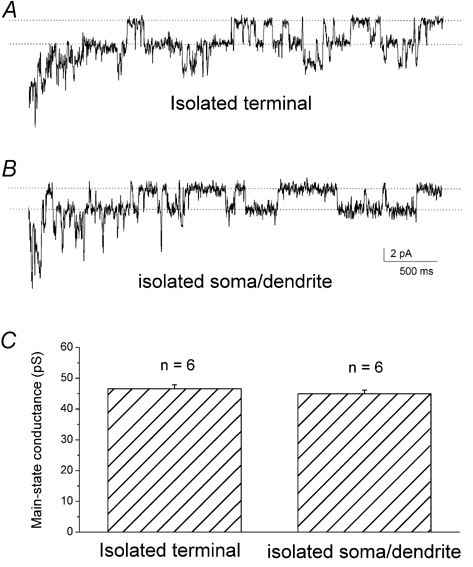
Single-channel events were observed in the late phase of the glycine response at a holding potential of −60 mV. A, single-channel events from an isolated axon terminal with a main-state unitary current level of 2.9 pA. B, single-channel events from an isolated soma/dendritewith a main-state unitary current level of 2.8 pA. C, bar graph of main single-channel conductance. The mean value was 46.6 ± 1.3 pS (mean ±s.e.m., n = 6) recorded from isolated terminals and 45.0 ± 1.1 pS (n = 6) from isolated somata/dendrites.
Activation of glycine receptors suppresses Ca2+ influx at the axon terminals
One possible function of glycine receptors at the axon terminals of bipolar cells is the regulation of transmitter release. Therefore, we examined the effect of glycine on the depolarization-evoked intracellular Ca2+ response. For this purpose, isolated bipolar cells were loaded with the Ca2+-sensitive fluorescent dye, fluo-3. Increases in intracellular Ca2+ at the axon terminals of RBCs were evoked by puffing high K+ (40 mm) (Fig. 6A). Previous studies have shown that the increase in the intracellular Ca2+ at the axon terminals under these recording conditions is mainly due to the influx of Ca2+ through L-type voltage-dependent Ca2+ channels because the Ca2+ increase was mostly blocked by nimodipine (Pan & Lipton, 1995). The high K+-evoked Ca2+ increase was completely eliminated when glycine (100–200 μm) was co-applied with high K+ (Fig. 6B; n = 9) as shown by the time course of the averaged fluorescence in the terminal region of a RBC. The inhibitory effect of glycine on the Ca2+ increase was antagonized when strychnine (10 μm) was co-applied with glycine and high K+ (Fig. 6C; n = 5). These results indicate that activation of glycine receptors can effectively block Ca2+ influx into the axon terminals.
Figure 6. Effect of glycine on K+-evoked Ca2+ responses at the axon terminals of RBCs.
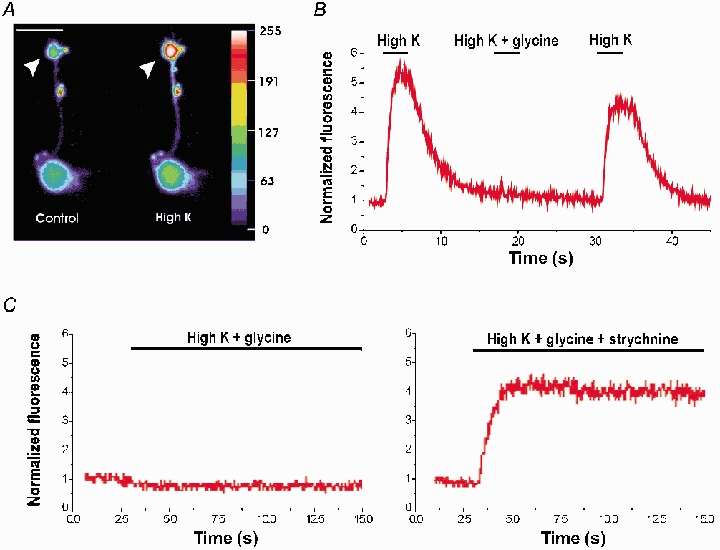
Bipolar cells were loaded with the Ca2+-sensitive dye fluo-3. A, sample fluorescence images of a RBC acquired in the control and during puffing high K+ (40 mm). Fluorescence intensity is present as a pseudocolour image with an arbitrary unit. The terminal is pointed by arrowheads. Scale bar: 10 μm. B, the time course of fluorescence intensity was averaged from the axon terminal region of a RBC. Puffing high K+ evoked an increase in intracellular Ca2+. The increase in intracellular Ca2+ was blocked when glycine (200 μm) was co-applied with high K+. C, the time course of fluorescence intensity recorded from the axon terminal of another RBC. No increase in intracellular Ca2+ was observed when glycine (100 μm) was co-applied with high K+ (left panel). The inhibition of glycine on intracellular Ca2+ increase was antagonized by adding strychnine (10 μm) in the puffer (right panel). The ordinate axis represents the fluorescence normalized to that of the basal level.
Glycinergic synaptic inputs at the axon terminals
We next determined whether there is functional glycinergic synaptic input at the axon terminals of RBCs. Patch-clamp recordings in the whole-cell configuration were made on RBCs in retinal slices. Kainate (500 μm) was puffed onto the IPL to depolarize amacrine cells. Ionotropic GABA receptors (GABAA and GABAC subtypes) were blocked by adding bicuculline (200 μm) and (1,2,5,6-tetrahydropyridine-4-yl)methylphosphinic acid (TPMPA, 100 μm) or 3-aminopropyl[methyl]-phosphinic acid (3-APMPA, 200–500 μm) to the bath solution. Under these conditions, application of kainate evoked discrete miniature-like currents in the majority of RBCs (31 of 34) when the membrane potential was held at 0 mV (Fig. 7). Spontaneous inhibitory postsynaptic currents, on the other hand, were only occasionally observed in some cells (data not shown).
Figure 7. Kainate-evoked glycine currents in retinal slices.
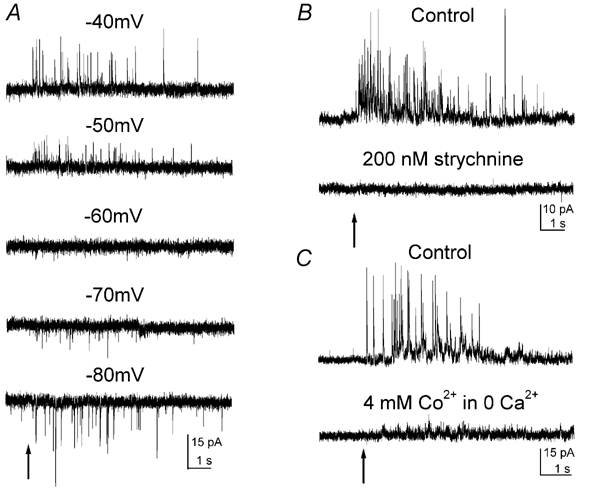
Kainate was puffed onto IPL for 50 ms as indicated by arrows. A, kainate-evoked currents from a RBC at different holding potentials. The currents reversed in polarity at around −60 mV. B, in another RBC, the kainate-evoked currents were completely blocked by the application of 200 nm strychnine. C, in a third RBC, the kainate-evoked currents were completely blocked by the application of 4 mm Co2+. Ca2+ was removed during Co2+ application. Except in A, all other recordings were made at a holding potential of 0 mV.
Kainate-evoked currents reversed polarity at around −60 mV (n = 3) (Fig. 7A; close to the predicted chloride reversal potential under our recording conditions (see Methods). Thus, all the following experiments were performed at the holding potential of 0 mV. The kainate-evoked currents were blocked by 200 nm strychnine (n = 2) (Fig. 7B). The effect of strychnine was partially reversible after prolonged washing (data not shown). These results indicate that kainate-evoked currents are mediated through glycine receptors. No currents were evoked by puffing kainate onto the IPL if the recorded RBCs did not retain axon terminals that were lost during slice preparation (data not shown; n = 5). This suggests that the glycine currents originate at the axon terminals of the RBCs. Furthermore, the currents from RBCs that retained axon terminals were blocked by 4 mm Co2+ (n = 5) (Fig. 7C). The effect of Co2+ was rapidly reversible after Co2+ was washed out (data not shown). To exclude the possibility that Co2+ might directly block glycine receptors, we examined the effect of Co2+ on glycine-evoked currents in isolated RBCs. Co2+ at 4 mm did not affect the peak of glycine currents, although it slightly accelerated the desensitization (n = 4; data not shown). Taken together, these results suggest that kainate-evoked glycine currents originate at the axon terminal through a Ca2+-dependent mechanism.
Properties of the glycinergic synaptic currents
As mentioned above, the glycinergic synaptic currents displayed miniature-like discrete events. This can be seen more clearly in the expanded time scale from a representative recording (Fig. 8A; middle trace). Glycinergic synaptic currents with similar properties have been reported in retinal bipolar cells of the tiger salamander (Maple & Wu, 1998) and the bullfrog (Du & Yang, 2002a).
Figure 8. Properties of kainate-evoked glycine currents.
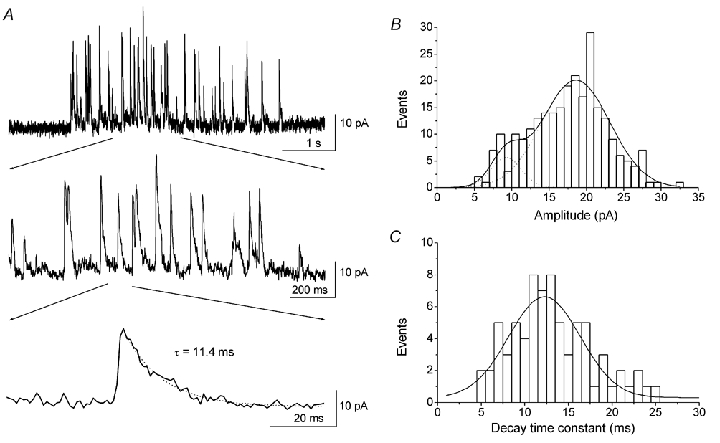
A, puffing kainate resulted in discrete miniature-like glycine currents, displayed here at different timescales. The amplitude of the miniature-like currents varied (see top and middle traces). The decay of the current was well fitted by a single exponential (bottom trace). B, amplitude histogram of kainate-evoked glycine currents for the cell shown in A. The histogram could be fitted by a two-Gaussian function with peaks at 9.2 pA and 18.5 pA. The mean amplitude of the miniature glycine currents was 17.6 ± 5.4 pA (mean ±s.d., 261 events). C, histogram of the decay time constant of glycine currents for the cell shown in A. The histogram was well fitted by a single Gaussian function with a peak at 12.3 ms. The mean decay time constant was 13.6 ± 4.7 ms (mean ±s.d., 74 events). Recordings were made at a holding potential of 0 mV.
The amplitude of the miniature-like currents was highly variable. Figure 8B shows the amplitude histogram of the discrete current events for the cell shown in Fig. 8A, which had a mean amplitude of 17.6 ± 5.4 pA (mean ±s.d., 261 events). The mean amplitude varied among different cells, ranging from 15 pA to 38 pA, with a mean value of 23.9 ± 1.4 pA (n = 17). The amplitude of the currents may be slightly underestimated due to the low sampling rates used in these recordings (see Methods). Interestingly, for the majority of the recorded cells, the amplitude histogram appears to show two peaks that could be fitted to a two-Gaussian function, as for the cell shown in Fig. 8B (peaks at 9.2 pA and 18.5 pA). The average values for the two peaks were 11.2 ± 0.7 pA and 25.2 ± 1.7 pA (n = 11).
The decay of the discrete current could be fitted relatively well by a single exponential (Fig. 8A, bottom trace). The decay time constant did not correlate with the amplitude of the current (data not shown). The histogram (Fig. 8C) of the decay time constant for the cell shown in Fig. 8A was fitted to a single Gaussian function with a peak at 12.3 ms. The mean decay time constant was 13.6 ± 4.7 ms (mean ±s.d., 74 events). The mean value also varied among different cells, ranging from 5 ms to 14 ms (8.4 ± 0.8 ms; mean ±s.e.m., n = 11).
The kainate-evoked glycinergic synaptic currents were partially blocked by tetrodotoxin (TTX) (Fig. 9). Interestingly, large-amplitude events were preferentially reduced in the presence of TTX (2–10 μm). To quantify this effect, we plotted the amplitude histograms for the resolvable events in the control and in the presence of TTX. The histogram again displayed two peaks (at 10.0 pA and 22.7 pA) (Fig. 9C). However, only a single peak (at 9.8 pA) remained in the presence of TTX. Similar results were obtained in all tested cells (n = 5). The mean amplitude of the synaptic currents was 23.3 ± 1.6 pA (n = 5) in the control and 15.7 ± 1.3 pA in the presence of TTX. In addition, in the presence of TTX, the number of synaptic events decreased to 53 ± 4 % (n = 5) of that of the control. These results indicate that TTX preferentially eliminates the large synaptic events and/ordecreases the large synaptic currents.
Figure 9. Effect of TTX on kainate-evoked glycine currents.
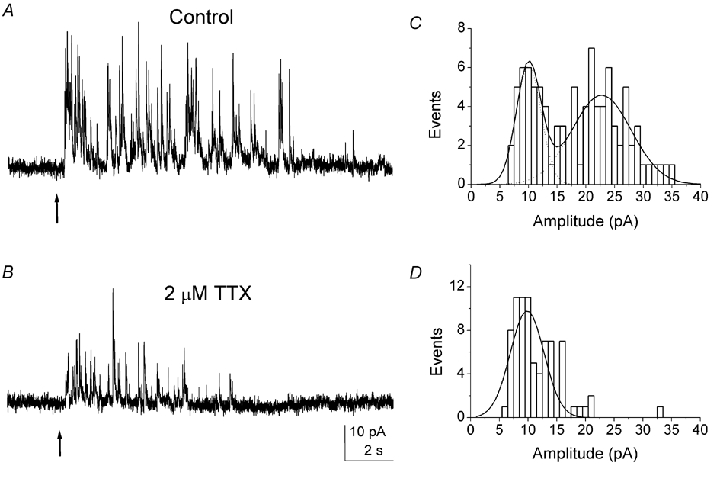
Representative recordings from a RBC under control conditions (A) and in the presence of 2 μm TTX (B). C and D, amplitude histograms for resolvable events under control conditions (C) and in the presence of TTX (D) for the same cell shown in A and B). The number of the large amplitude events in the histogram in the control was underestimated since many large events tended to be clustered and were excluded from the measurement. The amplitude histogram manifests two peaks at 10.0 pA and 22.7 pA. In the presence of TTX, only a single peak at 9.8 pA was evident. Recordings were made at a holding potential of 0 mV.
DISCUSSION
Glycine receptors are highly concentrated at the axon terminal
In this study, we demonstrated by direct recordings from isolated axon terminals that the absolute current amplitude was greater in the axon terminal than in the somatic/dendriticregions of rat RBCs. We further confirmed this finding by focally puffing glycine at the axon terminal and soma of RBCs in retinal slices. Thus, these results indicate that the total number of glycine receptors in the terminal region is greater than that in the somatic/dendriticregions in rat RBCs. Moreover, our results show that the average current density at the terminal endings is more than one order of magnitude higher than that at somata/dendrites.
It should be noted that, although the average current density is low in the somatic/dendriticregions, it is possible that the receptor density is high in the dendrites because our pooling of the current densities in the soma and dendrites in our measurements could have vastly underestimated the current density in the dendrites. However, despite a large variation in the intactness of the dendrites of the isolated cells, we did not notice a correlation between the current amplitude and the intactness of the dendrites or a large variation in the current amplitude among recorded isolated somata/dendrites. The latter implies that a significantly high density of glycine receptors in the dendrites is not likely. It also should be mentioned that the overall amplitude of the glycine current evoked by focal puffing of glycine in retinal slices was smaller than that in isolated cell recordings (after considering the difference in the holding voltage). This is probably due to the recorded bipolar cells in retinal slices being at least partially buried inside the tissue. The physical barrier of the tissue may result in a lower glycine concentration seen by the recorded cells. In this regard, the current at the terminals is more likely to be underestimated in the slice recordings because of our observation that the terminals of many recorded cells were located deeper in the tissue.
Our results are fully consistent with the finding in isolated rabbit RBCs (Gillette & Dacheux, 1995) that glycine-evoked currents were larger at the axon terminals than in the somata/dendritesbut are different from the report of Karschin & Wässle (1990) who observed smaller glycine currents in the terminals of rat RBCs. The glycine sensitivity to focal glycine pulses in mouse bipolar cells was also found to be highest at the terminals, although larger glycine pulses evoked larger currents at the soma (Suzuki et al. 1990). As discussed by these authors (Karschin &Wässle, 1990; Gillette & Dacheux, 1995), the variation might be due to technical difficulties involved in controlling focal glycine application. In addition, since these previous studies were performed in isolated preparations, the variation could also due to the variability in the health and/orintactness of the axon terminals, since the terminals are vulnerable to damage or disconnection during dissociation procedures (Pan, 2001). The direct recording from isolated axon terminals used in this study may thus have avoided some of these technical limitations.
Properties of glycine receptors at the axon terminals
In a single-cell PCR study, Enz and Borman (1995) detected mRNA expression for glycine α1 and β subunits in RBCs. Surprisingly, however, several studies reported the absence of significant immunoreactivity for the glycine α1 subunit in the innermost part of the IPL, where the synaptic terminals of RBCs are located (Grunert & Wässle, 1993; Greferath et al. 1994; Sassoe-Pognetto et al. 1994). Moreover, an antibody that recognized α1-3 subunits and β subunits also failed to recognize the axon terminals of RBCs (Grunert & Wässle, 1993; Greferath et al. 1994). This raises the question of whether the glycine receptors at the terminal region are different from those at other regions of the cells. Heterogeneous populations of glycine receptor channels have been reported in retina ganglion cells (Han et al. 1997) and hippocampal neurons (Yoon et al. 1998). That different glycine receptors are expressed in axon terminals and dendrites has been suggested by studies of bipolar cells in lower vertebrates (Maple & Wu, 1998; Du & Yang, 2002b). However, we did not find evidence in this study for the existence of different glycine receptors at the terminals and somata/dendritesin rat RBCs.
First, our results showed that the glycine receptors at the terminals are partially resistant to PTX, consistent with the report of Enz & Bormann (1995) in recordings of intact RBCs. This suggests that glycine receptors located in the terminal region, like those of the somata/dendrites, are also formed, at least in part, by α/β heteromeric channels. Second, our results show that glycine-evoked single channels recorded from isolated terminals and isolated somata/dendritesmanifest a virtually identical unitary conductance for the main-state. The main-state conductance of ≈46 pS observed in this study is similar to that recorded in outside-out patches from the somatic membrane of rat RBCs (Karschin & Wässle, 1990) and neurons in other preparations (Takahasi et al. 1992; Yoon et al. 1998). In the expression systems, the main-state conductances for α/β heteromeric channels have been reported to be ≈44-54 pS, whereas those of homomeric channels are much higher (86–111 pS) (Bormann et al. 1993). Thus, the single-channel properties observed in this study are also consistent with expression of dominant α/β heteromeric receptors both at the terminals and at the somatic/dendriticregions. However, it is worth noting that we occasionally observed large single-channel conductances (up to ≈100 pS) both at the axon terminals and at the somata/dendrites. Such large single-channel conductances have been reported to be the main-states of the homomeric glycine channels and a minor-state of certain heteromeric (α2/β) glycine channels (Bormann et al. 1993). This may suggest that RBCs also express homomeric glycine channels. However, since 100 μm PTX has been shown to almost completely block homomeric α glycine currents (Pribilla et al. 1992; Shan et al. 2001; our unpublished results for rat glycine α1 receptors), the identical percentage of PTX-suppressed glycine current we observed in isolated axon terminals and somata/dendritesmakes the existence of a significantly different mixture of homomeric and heteromeric glycine receptors in the two regions unlikely.
Taken together, our results suggest that glycine receptors at RBC axon terminals are likely to be composed mainly of α/β heteromeric receptors. The properties of the glycine receptors at the axon terminals appear to be indistinguishable from those in the other regions of the cell. Although our results are consistent with the idea of the expression of dominant α1/β glycine channels in RBCs (Enz & Bormann, 1995), why the known antibodies fail to recognize the glycine receptors in RBCs remains an unanswered question. Along this line, it has been proposed that RBCs express an unknown isoform of the glycine receptor (Greferath et al. 1994). It is also noteworthy that, although four glycine α subunits (α1-α4) have been cloned (Betz et al. 1999), the properties of the α4 subunit and its expression in the retina are largely unknown.
Regulation of calcium influx at the axon terminal
The functional role of GABA receptors in the regulation of the release of the bipolar cell transmitter has been well established as first proposed by Tachibana & Kaneko (1987). The regulation is believed to be accomplished by the activation of GABA receptors to suppress Ca2+ influx into the axon terminals (Heidelberger & Matthews, 1991; Pan & Lipton, 1995; Wellis & Werblin, 1995). In this study, we also demonstrated that activation of glycine receptors could effectively suppress Ca2+ influx into the axon terminals of RBCs, suggesting that activation of glycine receptors at the terminals could also regulate the release transmitter of bipolar cells.
The mechanism(s) for the activation of GABA and glycine receptors on the suppression of Ca2+ influx at the axon terminals, however, is not yet completely clear. The inhibitory effect would be consistent with hyperpolarization of the membrane potential to inactivate Ca2+ channels, since the reversal potential of chloride has been shown to be more hyperpolarized than the resting membrane potentials of bipolar cells (Billups & Attwell, 2002; but see Satoh et al. 2001). Alternatively, chloride influx could exhibit direct modulation of Ca2+ channel activity, as has been reported in photoreceptors (Thoreson et al. 2000).
Glycinergic input at the bipolar cell terminal
The localization of a high density of glycine receptors at the axon terminals of RBCs implies a potential role of glycine in RBC synaptic transmission. Supporting such an idea, in this study we found that the application of kainate onto the IPL in retinal slices could evoke glycine currents in RBCs, as evidenced by its sensitivity to strychnine. Our results suggest that the glycine current was generated by synaptic input at the axon terminals of RBCs, since the current was blocked by Co2+ and was not observed in cells with a severed axon terminal. The observation of functional synaptic glycine currents at the axon terminals of RBCs would be consistent with their known synaptic contact by glycinergic amacrine cells (Kolb & Nelson, 1983; Pourcho & Goebel, 1985; Freed et al. 1987; Kim et al. 1998), although the possibility that these glycine currents are evoked by other closely related endogenous amino acids could not be excluded (Pan & Slaughter, 1995).
Interestingly, the kainate-evoked glycine currents in rat RBCs displayed discrete miniature-like events. Glycinergic synaptic currents with such a property have also been observed in the bipolar cells of lower vertebrates (Maple & Wu, 1998; Du & Yang, 2002a,b). The discrete nature of glycine current implies sparse glycinergic synapses onto axon terminals of RBCs. This may also explain the lack of significant spontaneous glycinergic IPSCs in RBCs. The discrete nature of the glycinergic synaptic currents contrasts with the sustained nature of the GABAergic synaptic currents observed in bipolar cells (Hartveit, 1996,1999; Maple & Wu, 1998; Lukasiewicz & Shields, 1998; Shields et al. 2000). The distinct properties of glycinergic and GABAergic synaptic currents would be consistent with the anatomical studies showing that the vast majority of the reciprocal synapses and the majority of the non-reciprocal synapses at the axon terminal of RBCs are GABAergic (Freed et al. 1987; Strettoi et al. 1990; Kim et al. 1998). In addition, differences in single-channel conductance and kinetics of glycine and GABA receptors, especially GABAC, may also contribute to the distinct properties of their synaptic currents. On the other hand, like the GABAergic synaptic current observed at the axon terminal of bipolar cells (Hartveit, 1996), a brief kainate puff (50 ms) evoked a prolonged synaptic glycine activity. This suggests the existence of a similar sustained signal transmission mechanism for both GABA and glycine at the axon terminals of bipolar cells.
Also interestingly, the properties of synaptic glycine currents in rat RBCs differed from those of bipolar cells in lower vertebrates in several respects. First, the decay time constant in rat RBCs is shorter than that in bipolar cells of the tiger salamander (Maple & Wu, 1998; Du & Yang, 2002a,b). In addition, under a similar holding potential and chloride reversal potential, the mean amplitude of the glycine current appears to be significantly larger in rat RBCs (≈24 pA) than in bipolar cells of the tiger salamander (≈10 pA) (Maple & Wu, 1998; also see Du & Yang, 2002a). The variation in synaptic currents could be due to variation in postsynaptic receptor number (Nusser et al. 1997; Lim et al. 1999) and/orpresynaptic (synchronous) transmitter release (Ropert et al. 1990). Our results indicate that action potentials are involved, in part, in the kainate-evoked glycinergic synaptic current onto rat RBCs, since TTX markedly decreased the synaptic currents. In particular, the large synaptic events were preferentially affected in the presence of TTX, suggesting that the large glycine events are generated by action potential-dependent synchronous transmitter release. This also differs from that observed in bipolar cells of the tiger salamander, in which TTX decreased the number of glycinergic synaptic events at the axon terminals only slightly (Maple & Wu, 1998). Other studies have also reported that action potentials do not affect glycine modulation of bipolar-ganglion synaptic transmission in the tiger salamander (Cook et al. 1998; Bieda & Copenhagen, 1999).
Our results thus suggest that action potential-dependent long-range signal propagation could be involved in the glycine-mediated regulation of RBC synaptic transmission in mammalian retinas. The possible involvement of action potentials in the glycinergic synaptic inputs at the axon terminal of bipolar cells may be parallel to that of GABAergic synaptic inputs at the axon terminal of bipolar cells. TTX has been reported to reduce the reciprocal GABAergic input at the axon terminals of RBCs (Hartveit, 1999). Spike-dependent GABA inputs to the axon terminal of bipolar cells have been shown to contribute to the lateral inhibition in AII amacrine cells in the rabbit (Volgyi et al. 2002) and ganglion cells in the tiger salamander (Shields & Lukasiewicz, 2003).
Functional implications
Glycine and GABA are the principal inhibitory neurotransmitters in the retina (Yazulla, 1986; Massey & Redburn, 1987; Marc, 1989; Pourcho & Goebel, 1990). The contribution of GABAergic feedback at the axon terminal of bipolar cells to spatial and temporal visual processing has been well established. Results of this and other studies (Suzuki et al. 1990; Karschin & Wässle, 1990; Gillette & Dacheux, 1995) further raise the possibility that glycine also contributes to this processing in mammalian RBCs. One intriguing question is why the retina needs two seemingly redundant inhibitory neurotransmitter systems, since both of these transmitters mediate fast synaptic inhibition via the receptor-coupled chloride channels. The revelation of multiple subtypes of GABA receptors provides some answers (Johnston, 1986; Slaughter & Pan, 1992). Two ionotropic GABA receptors, GABAA and GABAC, are localized at the axon terminals of bipolar cells (Feigenspan & Bormann, 1998; Lukasiewicz, 1996; Zhang et al. 2001). These two GABA receptors exhibit distinct modulation of Ca2+ responses and transmitter release (Pan & Lipton, 1995; Lukasiewicz & Shields, 1998; Shields et al. 2000). The localization of glycine receptors at the axon terminal of bipolar cells may expand further the spatial and temporal range for the modulation at this synapse. The importance of using a dual transmitter system is supported by the finding of co-release of GABA and glycine in the spinal-cord and brainstem neurons (Jonas et al. 1998), where the nonlinear interactions between these two inhibitory transmitters with their different receptor kinetics have been shown to optimize the functional inhibition (O'Brien & Berger, 1999; Russier et al. 2002). It is interesting to note here that there is evidence for the co-localization of glycine and GABA in certain amacrine cells (Ball, 1987; Yazulla & Yang, 1988; Pourcho & Owczarzak, 1991), although it is unknown whether GABA and glycine are co-released in the retina. In addition, multiple GABA receptors and glycine receptors, with their different molecular identities, are known to be subject to differential modulation by endogenous modulators (Feigenspan & Bormann, 1994; Pan et al. 1995; Han & Slaughter, 1998). Further study of the kinetics of GABAergic and glycinergic synaptic currents and their modulations at the axon terminals of bipolar cells may provide new insight into the function of glycine receptors in retinal processing.
Acknowledgments
We thank Drs R. Pourcho and D. Goebel for comments on the manuscript. This research was supported by NIH grant 1 R01 EY12180 (Z.-H. Pan), 1 R01 EY05477 (S. A. Lipton), and Core grant 5 P01 EY04068.
REFERENCES
- Aprison MH. The discovery of the neurotransmitter role of glycine. In: Otterson OP, Storm-Mathisen J, editors. Glycine Neurotransmission. New York: Blackwell Science Inc; 1990. pp. 1–24. [Google Scholar]
- Ball AK. Immunocytochemical and autoradiographic localization of GABAergic neurons in the goldfish retina. J Comp Neurol. 1987;255:317–325. doi: 10.1002/cne.902550214. [DOI] [PubMed] [Google Scholar]
- Betz H, Kuhse J, Schmieden V, Laube B, Kirsch J, Harvey RJ. Structure and functions of inhibitory and excitatory glycine receptors. Ann N Y Acad Sci. 1999;868:667–676. doi: 10.1111/j.1749-6632.1999.tb11343.x. [DOI] [PubMed] [Google Scholar]
- Bieda MC, Copenhagen DR. Sodium action potentials are not required for light-evoked release of GABA or glycine from retinal amacrine cells. J Neurophysiol. 1999;81:3092–3095. doi: 10.1152/jn.1999.81.6.3092. [DOI] [PubMed] [Google Scholar]
- Billups D, Attwell D. Control of intracellular chloride concentration and GABA response polarity in rat retinal ON bipolar cells. J Physiol. 2002;545:183–198. doi: 10.1113/jphysiol.2002.024877. [DOI] [PMC free article] [PubMed] [Google Scholar]
- Bloomfield SC, Dacheux RF. Rod vision: pathways and processing in the mammalian retina. Prog Retin Eye Res. 2001;20:351–384. doi: 10.1016/s1350-9462(00)00031-8. [DOI] [PubMed] [Google Scholar]
- Bormann J, Rundstrom N, Betz H, Langosch D. Residues within transmembrane segment M2 determine chloride conductance of glycine receptor homo- and hetero-oligomers. EMBO J. 1993;12:3729–3737. doi: 10.1002/j.1460-2075.1993.tb06050.x. [DOI] [PMC free article] [PubMed] [Google Scholar]
- Cook PB, Lukasiewicz PD, McReynolds JS. Action potentials are required for the lateral transmission of glycinergic transient inhibition in the amphibian retina. J Neurosci. 1998;18:2301–2308. doi: 10.1523/JNEUROSCI.18-06-02301.1998. [DOI] [PMC free article] [PubMed] [Google Scholar]
- Du JL, Yang XL. Bullfrog retinal bipolar cells may express heterogeneous glycine receptors at dendrites and axon terminals. Neurosci Lett. 2002a;322:177–181. doi: 10.1016/s0304-3940(01)02523-x. [DOI] [PubMed] [Google Scholar]
- Du JL, Yang XL. Glycinergic synaptic transmission to bullfrog retinal bipolar cells is input-specific. Neuroscience. 2002b;113:779–784. doi: 10.1016/s0306-4522(02)00255-5. [DOI] [PubMed] [Google Scholar]
- Enz R, Bormann J. Expression of glycine receptor subunits and gephyrin in single bipolar cells of the rat retina. Vis Neurosci. 1995;12:501–507. doi: 10.1017/s0952523800008403. [DOI] [PubMed] [Google Scholar]
- Euler T, Wässle H. Immunocytochemical identification of cone bipolar cells in the rat retina. J Comp Neurol. 1995;361:461–478. doi: 10.1002/cne.903610310. [DOI] [PubMed] [Google Scholar]
- Feigenspan A, Bormann J. GABA-gated Cl- channels in the rat retina. Prog Retin Eye Res. 1998;17:99–126. doi: 10.1016/s1350-9462(97)00008-6. [DOI] [PubMed] [Google Scholar]
- Feigenspan A, Bormann J. Modulation of GABAC receptors in rat retinal bipolar cells by protein kinase C. J Physiol. 1994;481:325–330. doi: 10.1113/jphysiol.1994.sp020442. [DOI] [PMC free article] [PubMed] [Google Scholar]
- Freed MA, Smith RG, Sterling P. Rod bipolar array in the cat retina: pattern of input from rods and GABA-accumulating amacrine cells. J Comp Neurol. 1987;266:445–455. doi: 10.1002/cne.902660310. [DOI] [PubMed] [Google Scholar]
- Gillette MA, Dacheux RF. GABA- and glycine-activated currents in the rod bipolar cell of the rabbit retina. J Neurophysiol. 1995;74:856–875. doi: 10.1152/jn.1995.74.2.856. [DOI] [PubMed] [Google Scholar]
- Greferath U, Brandstatter JH, Wässle H, Kirsch J, Kuhse J, Grunert U. Differential expression of glycine receptor subunits in the retina of the rat: A study using immunohistochemistry and in situ hybridization. Vis Neurosci. 1994;11:721–729. doi: 10.1017/s0952523800003023. [DOI] [PubMed] [Google Scholar]
- Greferath U, Grunert U, Wässle H. Rod bipolar cells in the mammalian retina show protein kinase C-like immunoreactivity. J Comp Neurol. 1990;301:433–42. doi: 10.1002/cne.903010308. [DOI] [PubMed] [Google Scholar]
- Grunert U, Wässle H. Immunocytochemical localization of glycine receptors in the mammalian retina. J Comp Neurol. 1993;335:523–537. doi: 10.1002/cne.903350405. [DOI] [PubMed] [Google Scholar]
- Han Y, Slaughter MM. Protein kinases modulate two glycine currents in salamander retinal ganglion cells. J Physiol. 1998;508:681–690. doi: 10.1111/j.1469-7793.1998.681bp.x. [DOI] [PMC free article] [PubMed] [Google Scholar]
- Han Y, Zhang J, Slaughter MM. Partition of transient and sustained inhibitory glycinergic input to retinal ganglion cells. J Neurosci. 1997;17:3392–3400. doi: 10.1523/JNEUROSCI.17-10-03392.1997. [DOI] [PMC free article] [PubMed] [Google Scholar]
- Hartveit E. Membrane currents evoked by ionotropic glutamate receptor agonists in rod bipolar cells in the rat retinal slice preparation. J Neurophysiol. 1996;76:401–422. doi: 10.1152/jn.1996.76.1.401. [DOI] [PubMed] [Google Scholar]
- Hartveit E. Reciprocal synaptic interactions between rod bipolar cells and amacrine cells in the rat retina. J Neurophysiol. 1999;81:2923–2936. doi: 10.1152/jn.1999.81.6.2923. [DOI] [PubMed] [Google Scholar]
- Heidelberger R, Matthews G. Inhibition of calcium influx and calcium current by gamma-aminobutyric acid in single synaptic terminals. Proc Natl Acad Sci U S A. 1991;88:7135–7139. doi: 10.1073/pnas.88.16.7135. [DOI] [PMC free article] [PubMed] [Google Scholar]
- Johnston GAR. Multiplicity of GABA receptors. In: Olsen RW, Venter JC, editors. Benzodiazepine/GABA Receptors and Chloride Channels: Structure and Functional Properties. New York: Blackwell Science Inc; 1996. pp. 57–71. [Google Scholar]
- Jonas P, Bischofberger J, Sandkuhler J. Corelease of two fast neurotransmitters at a central synapse. Science. 1998;281:419–424. doi: 10.1126/science.281.5375.419. [DOI] [PubMed] [Google Scholar]
- Karschin A, Wässle H. Voltage- and transmitter-gated currents in isolated rod bipolar cells of rat retina. J Neurophysiol. 1990;63:860–876. doi: 10.1152/jn.1990.63.4.860. [DOI] [PubMed] [Google Scholar]
- Kim IB, Lee MY, Oh S, Kim KY, Chun M. Double-labeling techniques demonstrate that rod bipolar cells are under GABAergic control in the inner plexiform layer of the rat retina. Cell Tissue Res. 1998;292:17–25. doi: 10.1007/s004410051030. [DOI] [PubMed] [Google Scholar]
- Kolb H, Nelson R. Rod pathways in the retina of the cat. Vision Res. 1983;23:301–312. doi: 10.1016/0042-6989(83)90078-0. [DOI] [PubMed] [Google Scholar]
- Lim R, Alvarez FJ, Walmsley B. Quantal size is correlated with receptor cluster area at glycinergic synapses in the rat brainstem. J Physiol. 1999;516:505–512. doi: 10.1111/j.1469-7793.1999.0505v.x. [DOI] [PMC free article] [PubMed] [Google Scholar]
- Lukasiewicz PD. GABAC receptors in the vertebrate retina. Mol Neurobiol. 1996;12:181–194. doi: 10.1007/BF02755587. [DOI] [PubMed] [Google Scholar]
- Lukasiewicz PD, Shields CR. Different combinations of GABAA and GABAC receptors confer distinct temporal properties to retinal synaptic responses. J Neurophysiol. 1998;79:3157–3167. doi: 10.1152/jn.1998.79.6.3157. [DOI] [PubMed] [Google Scholar]
- Maple BR, Wu SM. Glycinergic synaptic inputs to bipolar cells in the salamander retina. J Physiol. 1998;506:731–744. doi: 10.1111/j.1469-7793.1998.731bv.x. [DOI] [PMC free article] [PubMed] [Google Scholar]
- Marc RE. The role of glycine in the mammalian retina. Prog Retin Res. 1989;8:67–107. [Google Scholar]
- Massey SC, Redburn DA. Transmitter circuits in the vertebrate retina. Prog Neurobiol. 1987;28:55–96. doi: 10.1016/0301-0082(87)90005-0. [DOI] [PubMed] [Google Scholar]
- Nusser Z, Cull-Candy S, Farrant M. Differences in synaptic GABAA receptor number underlie variation in GABA mini amplitude. Neuron. 1997;19:697–709. doi: 10.1016/s0896-6273(00)80382-7. [DOI] [PubMed] [Google Scholar]
- O'Brien JA, Berger AJ. Cotransmission of GABA and glycine to brain stem motoneurons. J Neurophysiol. 1999;82:1638–1641. doi: 10.1152/jn.1999.82.3.1638. [DOI] [PubMed] [Google Scholar]
- Pan Z-H. Differential expression of high- and two types of low-voltage-activated calcium currents in rod and cone bipolar cells of the rat retina. J Neurophysiol. 2000;83:513–527. doi: 10.1152/jn.2000.83.1.513. [DOI] [PubMed] [Google Scholar]
- Pan Z-H. Voltage-gated Ca2+ channels and GABA receptors revealed at presynaptic terminals of mammalian retinal bipolar cells. Vis Neurosci. 2001;18:279–288. doi: 10.1017/s095252380118212x. [DOI] [PubMed] [Google Scholar]
- Pan ZH, Bahring R, Grantyn R, Lipton SA. Differential modulation by sulfhydryl redox agents and glutathione of GABA- and glycine-evoked currents in rat retinal ganglion cells. J Neurosci. 1995;15:1384–1391. doi: 10.1523/JNEUROSCI.15-02-01384.1995. [DOI] [PMC free article] [PubMed] [Google Scholar]
- Pan Z-H, Hu HJ, Perring P, Andrade R. T-type Ca2+ channels mediate neurotransmitter release in retinal bipolar cells. Neuron. 2001;32:89–98. doi: 10.1016/s0896-6273(01)00454-8. [DOI] [PubMed] [Google Scholar]
- Pan Z-H, Lipton SA. Multiple GABA receptor subtypes mediate inhibition of calcium influx at rat retinal bipolar cell terminals. J Neurosci. 1995;15:2668–2679. doi: 10.1523/JNEUROSCI.15-04-02668.1995. [DOI] [PMC free article] [PubMed] [Google Scholar]
- Pan Z-H, Slaughter MM. Comparison of the actions of glycine and related amino acids on isolated third order neurons from the tiger salamander retina. Neuroscience. 1995;64:153–164. doi: 10.1016/0306-4522(94)00399-p. [DOI] [PubMed] [Google Scholar]
- Pourcho RG, Goebel DJ. A combined Golgi and autoradiographic study of 3H-glycine-accumulating amacrine cells in the cat retina. J Comp Neurol. 1985;233:473–480. doi: 10.1002/cne.902330406. [DOI] [PubMed] [Google Scholar]
- Pourcho RG, Goebel DJ. Autoradiographic and immunocytochemical studies of glycine-containing neurons in the retina. In: Ottersen OP, Storm-Mathisen J, editors. Glycine Neurotransmission. Chichester: Blackwell Science Inc; 1990. pp. 355–389. [Google Scholar]
- Pourcho RG, Owczarzak MT. Connectivity of glycine immunoreactive amacrine cells in the cat retina. J Comp Neurol. 1991;307:549–561. doi: 10.1002/cne.903070404. [DOI] [PubMed] [Google Scholar]
- Pribilla I, Takagi T, Langosch D, Bormann J, Betz H. The atypical M2 segment of the beta subunit confers picrotoxinin resistance to inhibitory glycine receptor channels. EMBO J. 1992;11:4305–4311. doi: 10.1002/j.1460-2075.1992.tb05529.x. [DOI] [PMC free article] [PubMed] [Google Scholar]
- Ropert N, Miles R, Korn H. Characteristic of miniature inhibitory postsynaptic currents in CA1 pyramidal neurons of rat hippocampus. J Physiol. 1990;428:707–722. doi: 10.1113/jphysiol.1990.sp018236. [DOI] [PMC free article] [PubMed] [Google Scholar]
- Russier M, Kopysova IL, Ankri N, Ferrand N, Debanne D. GABA and glycine co-release optimizes functional inhibition in rat brainstem motoneurons in vitro. J Physiol. 2002;541:123–137. doi: 10.1113/jphysiol.2001.016063. [DOI] [PMC free article] [PubMed] [Google Scholar]
- Sassoe-Pognetto M, Wässle H, Grunert U. Glycinergic synaptic in the rod pathway of the rat retina: cone bipolar cells express the α1 subunit of the glycine receptors. J Neurosci. 1994;14:5131–5146. doi: 10.1523/JNEUROSCI.14-08-05131.1994. [DOI] [PMC free article] [PubMed] [Google Scholar]
- Satoh H, Kaneda M, Kaneko A. Intracellular chloride concentration is higher in rod bipolar cells than in cone bipolar cells of the mouse retina. Neurosci Lett. 2001;310:161–164. doi: 10.1016/s0304-3940(01)02120-6. [DOI] [PubMed] [Google Scholar]
- Shan Q, Haddrill JL, Lynch JW. A single beta subunit M2 domain residue controls the picrotoxin sensitivity of alphabeta heteromeric glycine receptor chloride channels. J Neurochem. 2001;6:1109–1120. doi: 10.1046/j.1471-4159.2001.00124.x. [DOI] [PubMed] [Google Scholar]
- Shields CR, Lukasiewicz PD. Spike-dependent GABA inputs to bipolar cell axon terminals contribute to lateral inhibition of retinal ganglion cells. J Neurophysiol. 2003;89:2449–2458. doi: 10.1152/jn.00916.2002. [DOI] [PubMed] [Google Scholar]
- Shields CR, Tran MN, Wong RO, Lukasiewicz PD. Distinct ionotropic GABA receptors mediate presynaptic and postsynaptic inhibition in retinal bipolar cells. J Neurosci. 2000;20:2673–282. doi: 10.1523/JNEUROSCI.20-07-02673.2000. [DOI] [PMC free article] [PubMed] [Google Scholar]
- Slaughter MM, Pan Z-H. The physiology of GABAB receptors in the vertebrate retina. Prog Brain Res. 1992;90:47–60. doi: 10.1016/s0079-6123(08)63608-0. [DOI] [PubMed] [Google Scholar]
- Strettoi E, Dacheux RF, Raviola E. Synaptic connections of rod bipolar cells in the inner plexiform layer of the rabbit retina. J Comp Neurol. 1990;295:449–466. doi: 10.1002/cne.902950309. [DOI] [PubMed] [Google Scholar]
- Suzuki S, Tachibana M, Kaneko A. Effects of glycine and GABA on isolated bipolar cells of the mouse retina. J Physiol. 1990;421:645–662. doi: 10.1113/jphysiol.1990.sp017967. [DOI] [PMC free article] [PubMed] [Google Scholar]
- Tachibana M, Kaneko A. Gamma-aminobutyric acid exerts a local inhibitory action on the axon terminal of bipolar cells: evidence for negative feedback from amacrine cells. Proc Natl Acad Sci U S A. 1987;84:3501–3505. doi: 10.1073/pnas.84.10.3501. [DOI] [PMC free article] [PubMed] [Google Scholar]
- Takahashi T, Momiyama A, Hirai K, Hishinuma F, Akagi H. Functional correlation of fetal and adult forms of glycine receptors with developmental changes in inhibitory synaptic receptor channels. Neuron. 1992;9:1155–1161. doi: 10.1016/0896-6273(92)90073-m. [DOI] [PubMed] [Google Scholar]
- Thoreson WB, Nitzan R, Miller RF. Chloride efflux inhibits single calcium channel open probability in vertebrate photoreceptors: chloride imaging and cell-attached patch-clamp recordings. Vis Neurosci. 2000;17:197–206. doi: 10.1017/s0952523800172025. [DOI] [PubMed] [Google Scholar]
- Volgyi B, Xin D, Bloomfield SA. Feedback inhibition in the inner plexiform layer underlies the surround-mediated responses of AII amacrine cells in the mammalian retina. J Physiol. 2002;539:603–614. doi: 10.1113/jphysiol.2001.013133. [DOI] [PMC free article] [PubMed] [Google Scholar]
- Werblin FS. Transmission along and between rods in the tiger salamander retina. J Physiol. 1978;280:449–470. doi: 10.1113/jphysiol.1978.sp012394. [DOI] [PMC free article] [PubMed] [Google Scholar]
- Werblin FS, Dowling JE. Organization of the retina of the mudpuppy, Necturus maculosus. II. Intracellular recording. J Neurophysiol. 1969;32:339–355. doi: 10.1152/jn.1969.32.3.339. [DOI] [PubMed] [Google Scholar]
- Wellis DP, Werblin FS. Dopamine modulates GABAc receptors mediating inhibition of calcium entry into and transmitter release from bipolar cell terminals in tiger salamander retina. J Neurosci. 1995;15:4748–4761. doi: 10.1523/JNEUROSCI.15-07-04748.1995. [DOI] [PMC free article] [PubMed] [Google Scholar]
- Wood JG, Hart CE, Mazzei GJ, Girard PR, Kuo JF. Distribution of protein kinase C immunoreactivity in rat retina. Histochem J. 1988;20:63–68. doi: 10.1007/BF01746605. [DOI] [PubMed] [Google Scholar]
- Yazulla S. GABAergic mechanism in the retina. Prog Retin Res. 1986;5:1–52. [Google Scholar]
- Yazulla S, Yang CY. Colocalization of GABA and glycine immunoreactivities in a subset of retinal neurons in tiger salamander. Neurosci Lett. 1988;95:37–41. doi: 10.1016/0304-3940(88)90628-3. [DOI] [PubMed] [Google Scholar]
- Yeh HH, Lee MB, Cheun JE. Properties of GABA-activated whole-cell currents in bipolar cells of the rat retina. Vis Neurosci. 1990;4:349–357. doi: 10.1017/s0952523800004557. [DOI] [PubMed] [Google Scholar]
- Yoon KW, Wotring VE, Fuse T. Multiple picrotoxinin effect on glycine channels in rat hippocampal neurons. Neuroscience. 1998;87:807–815. doi: 10.1016/s0306-4522(98)00158-4. [DOI] [PubMed] [Google Scholar]
- Zhang D, Pan ZH, Awobuluyi M, Lipton SA. Structure and function of GABA(C) receptors: a comparison of native versus recombinant receptors. Trends Pharmacol Sci. 2001;22:121–132. doi: 10.1016/s0165-6147(00)01625-4. [DOI] [PubMed] [Google Scholar]