

Abstract
We examined desensitization by acetylcholine (ACh) and nicotine at the rat α4β2 neuronal nicotinic receptor stably expressed in HEK cells. For both agonists, the decay in response due to desensitization (‘onset’) was best fitted by the sum of two exponentials with the fast component dominant at concentrations > 1 μm. The time constants for onset were similar for both agonists, and showed little concentration dependence over the range of 0.1–100 μm. Recovery from desensitization also showed two exponential components. In contrast to the similarity in onset, nicotine produced longer lasting desensitization, resulting from an increase in the proportion of receptors in the slowly recovering population and from an increase in the time constant for the slow recovery process. The proportion of receptors in the slowly recovering population increased as the duration of the desensitizing pulse increased. Desensitization was also induced by low concentrations of agonist, with no apparent macroscopic response. A 100 s application of 10 nm nicotine desensitized 70 % of the peak response, while 100 s of 10 nm ACh desensitized only 15 %. At higher concentrations of agonist, which result in a macroscopic response, desensitization in the absence of activation also can occur. Nicotine is a very potent and efficacious desensitizing agent at this neuronal nicotinic receptor.
Acetylcholine (ACh) is the major endogenous ligand for nicotinic receptors, while nicotine is an example of a potent and addictive exogenous ligand. The psychological effects of nicotine are complex: nicotine can stimulate activity, enhance learning, increase attention and reduce anxiety (Rezvani & Levin, 2001; Picciotto et al. 2002). In addition, nicotine is a highly addictive drug. The combination of psychological effects and addiction result in extensive abuse of tobacco products around the world, with associated health problems.
Neuronal nicotinic receptors are likely to be responsible for the development and maintenance of nicotine addiction. These receptors are located both pre- and postsynaptically throughout the brain and have been shown to facilitate release of excitatory (Guo et al. 1998; Girod et al. 2000; Mansvelder & McGehee, 2000; Ji et al. 2001; Mansvelder et al. 2002; Lambe et al. 2003) and inhibitory (Guo et al. 1998; Lu et al. 1999; Mansvelder et al. 2002) neurotransmitters in a number of areas, including release of dopamine in the mesolimbic system (Zhou et al. 2001; Grady et al. 2002). The ability to elevate dopamine release in the mesolimbic system is a common feature of most addictive substances and appears to be a necessary component of addiction (Robbins & Everitt, 1999).
Neuronal nicotinic receptors are both activated and desensitized by nicotine. Smoking a cigarette results in prolonged exposure to nicotine at concentrations of 100 nm and higher (Gourlay & Benowitz, 1997; Rose et al. 1999), which is likely to initially activate and subsequently desensitize some types of nicotinic receptor in the brain (Quick & Lester, 2002). Desensitization is maintained by the continued presence of agonist, while removal of nicotine by conversion to cotinine is a slow process requiring tens of minutes. Activation of nicotinic receptors appears to have a role in both the acute and chronic effects of nicotine, as the nicotinic blocking agent mecamylamine attenuates most actions (cf. Rose et al. 2001). However, a role for desensitization has also been proposed (e.g. Dani & Heinemann, 1996). Most recently, several workers have suggested that selective desensitization of one receptor subtype, in the maintained activity of another subtype, may play a significant role in changing the plasticity of particular brain regions (Dani & De Biasi, 2001; Ji et al. 2001; Mansvelder et al. 2002; Mansvelder & McGehee, 2002; McGehee, 2002; Zhou et al. 2002; Wooltorton et al. 2003).
Neuronal nicotinic receptors are pentamers formed by a single alpha subunit (α7, α8 or α9) or a combination of α and β subunits (see reviews, Ortells & Lunt, 1995; Lindstrom et al. 1996). We studied the α4β2 nicotinic receptor because of its abundance in the brain and because it accounts for > 90 % of the high affinity nicotine binding sites in the brain (Flores et al. 1992; Picciotto et al. 1995; Marubio et al. 1999). Evidence for a role of the α4β2 receptor in nicotine addiction comes from cocaine substitution experiments in which cocaine addicted mice lacking the β2 subunit show a marked reduction in the ability of nicotine to substitute for cocaine upon cocaine withdrawal (Picciotto et al. 1998). Conversely, the amount of α4β2 receptor is found to be higher in the brains of smokers compared to non-smokers (Benwell et al. 1988). This enhanced expression could compensate for receptor desensitization by augmenting the response to nicotine. To start to clarify the possible roles of activation and desensitization of α4β2 receptors, we have examined the time and concentration dependence for desensitization by nicotine, and compared the actions of nicotine to those of ACh.
METHODS
Cells
The rat α4 and β2 neuronal nicotinic receptor subunits were stably expressed in HEK 293 cells as described previously (HN42 cells; Sabey et al. 1999); cDNAs for these subunits were provided to us by Dr Jim Patrick at the Baylor College of Medicine. Cells were grown at 37 °C in a humidified incubator at 5 % CO2, passaged bi-weekly and plated on to 100 mm tissue culture dishes (Corning, Corning, NY, USA) for subsequent passaging or on to 65 mm poly-d.l-lysine Biocoat dishes (Becton Dickinson, Bedford, MA, USA) for electrophysiology. Cells were maintained in a medium of Dulbecco's modified Eagle's medium plus Ham's F12 medium (1:1), 10 % fetal bovine serum, and the antibiotics penicillin (100 u ml−1), streptomycin (100 μg ml−1) and G418 (450 μg ml−1).
Electrophysiology
All salts, agonists and other chemicals were obtained from Sigma (St Louis, MO, USA). The extracellular solution was composed of double de-ionized water with (mm) 140 NaCl, 5 KCl, 2 MgCl2, 2 CaCl2, 10 glucose, 10 Hepes and the pH adjusted to 7.3 with NaOH. The pipette solution consisted of double de-ionized water with (mm) 140 CsCl, 4 NaCl, 4 MgCl2, 0.5 CaCl2, 10 Hepes and 5 EGTA, pH adjusted to 7.3 with CsOH. Frozen aliquots (< 1 ml) of 1 m agonist stock solutions were used to make the appropriate concentration(s) of agonist on the day of the experiment.
Drugs were applied by a three-line perfuser (Maconochie & Knight, 1989) in which the central line was used to apply drug-free recording solution and the adjacent lines perfused recording solution plus agonist at the appropriate concentrations. Using an open tip recording electrode and application of recording solution in the centre line and recording solution diluted by 90 % in the adjacent lines, the solution exchange time was ≈0.5-5 ms. Due to rapid rundown (permanent loss of response) of these receptors in excised patches, we performed our experiments in the whole-cell configuration with cells attached to the bottom of the tissue culture dish. To estimate the actual whole-cell solution exchange time, recording solution with 50 % of the NaCl replaced by an impermeable salt was used. The estimated exchange time was ≈10-50 ms, depending on the size and geometry of the cell (data not shown). The series resistance was about 10 MΩ, and was not compensated.
Due to the pronounced rectification exhibited by this receptor, responses from cells clamped at −100 mV are 3- to 5-fold higher than the response from cells clamped at −50 mV. Typically, the quality of the seal is diminished if the cells are held at −100 mV for a prolonged period of time (> 1 min). Therefore, cells were held at −50 mV and ramped to −100 mV ≈200 ms prior to drug application, and were maintained at this potential for the duration of the drug application.
The data were acquired with an EPC-7 amplifier (List Electronics, Darmstadt, Germany) and digitized by a PC-clone computer through a Digidata analog-digital converter (Axon Instruments, Foster City, CA, USA) using Clampex software (Axon Instruments). Data were filtered at 500 kHz (4-pole Bessel; Frequency Devices, Haverhill, MA, USA) and digitized at 1 ms intervals. Data analysis was completed with Clampfit (Axon Instruments), Sigma Plot (SPSS Science Inc., Chicago, IL, USA) and Microsoft Excel (Microsoft Corp., Seattle, WA, USA). All values show the means ±s.d. for three or more cells, unless otherwise noted.
Protocols for electrophysiology
We have already reported that the responses of cells show changes over time (Sabey et al. 1999). There often is an initial increase in peak response, followed by a decline. Accordingly, we obtained concentration–response data with interspersed control responses (see below), and test responses were normalized to the mean of adjacent control responses. To measure desensitization of peak responses, each test protocol (see below) was matched with a preceeding (by about 120 s) and following (by about 120 s) control application. The data were rejected if the following control response amplitude was less than 70 % of the preceeding control response amplitude. This criterion was particularly difficult to fulfil when very long applications of low concentrations of agonist were applied. Finally, there can be a change in the time course of responses: the decay of responses became faster with the duration of the whole-cell perfusion (Sabey et al. 1999). This results from an increase in both the rate of the fast desensitization process and its relative contribution to the overall decay. To reduce the consequences of this change, we analysed the onset of desensitization from only a limited number of agonist applications to a given cell. To remove systematic effects, the order of agonist application to a cell was not fixed.
The amplitude of the peak response was measured as the mean of a small interval centered at the peak value, the baseline value was measured from a period ≈40 ms prior to the agonist application and the residual response from the final ≈40 ms of a response.
For the concentration–response data, one perfusion line contained the test concentration of agonist, the second line contained recording solution without agonist and the third line contained a reference concentration of agonist (typically 1 μm ACh) to normalize the response to the test concentration. To construct the ACh concentration–response graph, responses were normalized to the response of the cell to 1 μm ACh. For the nicotine concentration response graph, responses to 30 nm and 100 nm nicotine were normalized to 1 μm ACh; while 1, 10 and 100 μm nicotine were directly compared to 1, 10 and 100 μm ACh respectively. All data for nicotine were subsequently renormalized to the response to 1 μm ACh. The mean concentration–response data were fitted with the empirical Hill equation providing a single estimate for the EC50 and Hill coefficient.
| (1) |
where I is the mean of the normalized peak response at agonist concentration x, A is the peak response predicted by eqn (1), EC50 is the concentration producing a half-maximal response and h is the Hill coefficient.
The onset of desensitization was determined by fitting the time course of a 5 s application of agonist (see Fig. 2). The fit was made from approximately 95 % of the maximal response to the end of the application, using the Levenberg-Marquardt algorithm implemented in Clampfit 9 (Axon Instruments) with time constants constrained to positive values. All fits were made using the following equation:
Figure 2. The onset of desensitization.
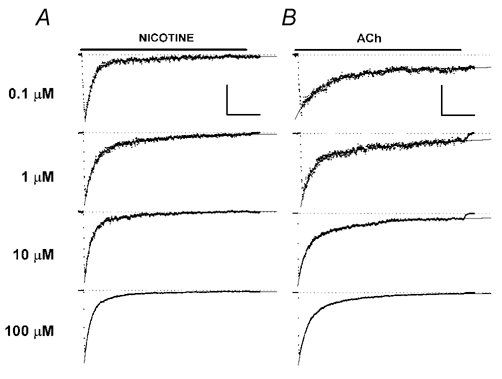
A, the left column shows responses to 0.1, 1, 10 and 100 μm nicotine (from top to bottom). In each case, the onset fit as described by the sum to two exponential components declining to a constant (see Methods), and the resulting fits are shown superimposed of the responses (thick lines through data). The fits have been extrapolated at the start and end, since the fit lines are often obscured by the data. Responses have been scaled to the same amplitude. The scale bars in the upper trace shows 1 s (all traces) and 50 pA (100 nm trace), 110 pA (1 μm), 210 pA (10 μm) and 280 pA (100 μm). B shows responses to 0.1, 1, 10 and 100 μm ACh, as for A. The vertical scale bar indicates 45 pA (100 nm trace), 120 pA (1 μm), 260 pA (10 μm) and 270 pA (100 μm). The thick horizontal bar at the top of each column indicates 5 s, while the dotted lines for each trace indicate the holding current. The applications of 100 nm agonist were 10 s in duration, and so do not show a decline to baseline. All other applications were 5 s long. Traces are from different cells. The traces were filtered at 100 Hz and decimated 5-fold for display.
| (2) |
A gives the amplitude of the component with time constant τ1, B the amplitude of the component with time constant τ2 and C the value of a constant. In some cases an unconstrained fit generated values for C which were positive and large (> 5 % of the response amplitude). In this case (9 of 108 total fits) the value for C was constrained to zero. Responses to low concentrations of agonist (100 nm nicotine or ACh) were often contaminated by baseline instability (‘wobble’ or drift) and so relatively few responses were deemed suitable for analysis and the fit parameters are less reliable than for larger responses.
Recovery data were measured by a two-pulse protocol. The first (desensitizing) pulse of agonist (P1, 2 s duration) induced desensitization, followed by an agonist-free wash (0.5-120 s) then a second agonist pulse (P2, 300 ms) to measure recovery. The agonist and concentration of agonist were the same for the two pulses. Because a residual response was present at the end of the first pulse, the amount of desensitization in the 2 s pulse was measured as the peak response (I1) minus the residual response (R): (I1 - R; see Fig. 4A). The amount of receptor recovery during the wash period was estimated from the peak response in the second pulse (I2) minus the residual current in the first pulse (I2 - R) and the fractional recovery (FR) was calculated from FR = (I2 - R)/(I1 - R). The resulting data were plotted as a function of the interpulse interval and were best fitted by the sum of two exponentials:
Figure 4. Recovery from desensitization is slower for nicotine.
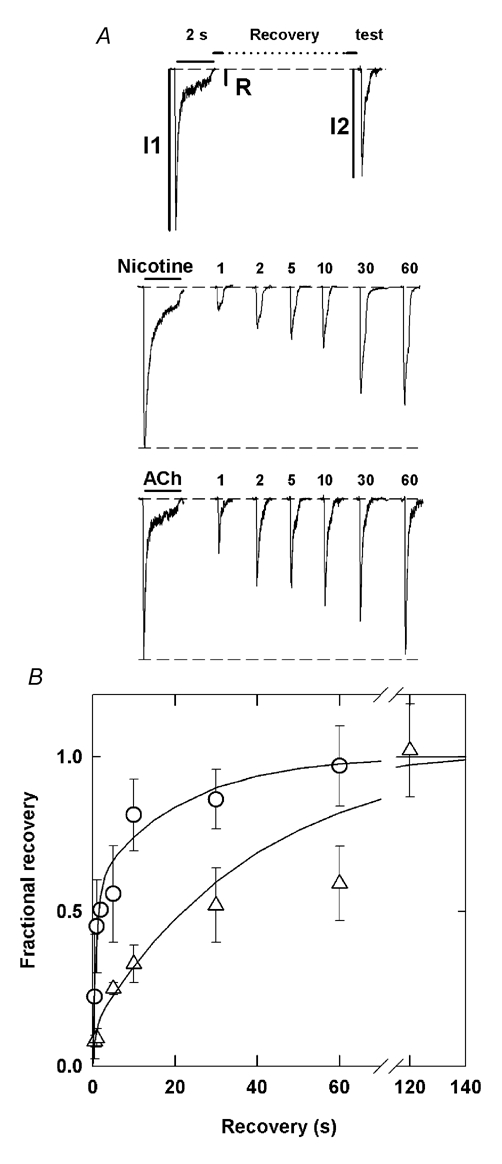
A, the top panel illustrates the pulse protocol used. Typical recovery data are shown for data obtained with a 2 s exposure to 10 μm nicotine or 100 μm ACh. The numbers above the test responses provide the recovery interval (s). The dashed lines indicate baseline current and the maximal control response. B, the fractional recovery (see Methods) is plotted in relation to the duration of the recovery interval. The lines through the data show the predictions of the best fitting sum of two exponentials, with values: ACh τfast = 700 ms (49 %) and τslow = 17 s (51 %); nicotine τfast = 750 ms (12 %) and τslow = 40 s (88 %). The traces were obtained from multiple cells; for display the amplitudes of the responses to the 2 s conditioning pulse were normalized to the same value, and the test responses were normalized by the same factor.
| (3) |
FR(t) is the fractional recovery at interpulse interval t, τ1 and τ2 are the exponential time constants and A is the fractional contribution of the component with time constant τ1.
In one series of experiments, receptors were desensitized using a 10 s application of 100 nm nicotine while recovery from desensitization was measured using 100 μm ACh (see Results). In this case, the residual response was estimated from the relative amplitude of the test response with no wash period and the fractional recovery was calculated as above.
To examine the development of the slowly recovering component of desensitization, we used a modification of the two-pulse protocol. The duration of P1 was varied from 0.5 to 20 s, while the interpulse interval was fixed at a value of 5 s. As described in Results, the rapidly recovering component of desensitization has a time constant of less than 1 s, so the 5 s wash period was chosen to allow recovery of the majority of receptors in the rapidly recovering population. The fractional recovery after 5 s was calculated as described above, then analysed as a function of the duration of P1, and fit using the following equation:
| (4) |
FR(d) is the fractional recovery observed at a duration of P1 equal to d, A is the fractional contribution of the component with time constant τ1 and C is a constant (the minimum fractional recovery).
The ability of 10 nm nicotine or ACh to desensitize was assayed by applying a control pulse of ACh (100 μm, 300 ms) to assay baseline response. After a 2 min wash, the low concentration of agonist was applied for 10 s or 100 s, then the cell was immediately (no wash) tested with 100 μm ACh. Finally, the cell was washed for 2–4 min and the responsiveness of the cell was tested again with 100 μm ACh. If the second control was less than 70 % of the response to the initial control, the data were rejected.
Activation and desensitization were directly compared by applying nicotine (0.1 or 1 μm) for 1 s to both activate and desensitize receptors (conditioning pulse). Desensitization was tested by immediately (no wash) exposing the cells to 100 μm nicotine for 1 s. The peak response to 100 μm nicotine was compared to the mean response to preceeding and following applications of 100 μm nicotine without a pre-exposure to a low concentration of nicotine. Activation was estimated from the total charge transfer during the 1 s conditioning pulse. To account for different response amplitudes between different cells, the charge transfer during the 1 s pulse was normalized to the mean amplitude of the preceeding and following control responses.
RESULTS
Concentration–response relationships
The response to several concentrations of ACh and nicotine from the rat α4β2 neuronal nicotinic receptor are shown in Fig. 1A and B, and the mean concentration–response data are shown in Fig. 1C and D. At concentrations less than 100 μm, nicotine activates a larger response when compared to ACh at the same concentration. At nicotine concentrations above 100 μm there is a reduction in response (Fig. 1), which is likely to reflect a blocking action by nicotine (see below). Since the α4β2 receptor exhibits strong rectification (Haghighi & Cooper, 1998; Sabey et al. 1999), it was not possible to relieve block by holding the cell at positive potentials. Accordingly, we were not able to determine the true maximal response to nicotine. The fit of the Hill equation to the data shown in Fig. 1C provided the following parameter estimates: ACh EC50 = 44 μm and Hill coefficient = 0.8; nicotine 14 μm and 0.7. (The response to 500 μm nicotine was excluded from the fit.) The maximal responses, expressed relative to the response to 1 μm ACh, were 13.4 and 13.2 for ACh and nicotine, respectively.
Figure 1. Responses to ACh and nicotine.
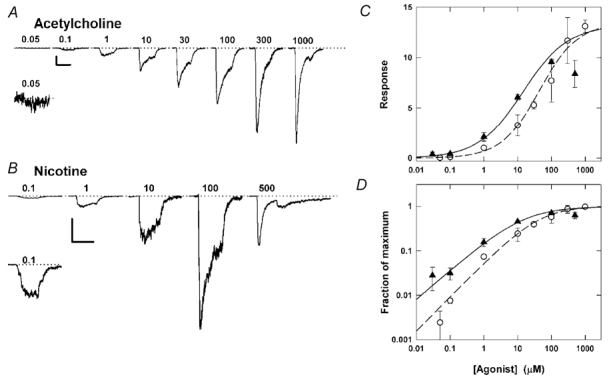
A, the response of cells to 300 ms applications of ACh at 0.05-1000 μm are shown. The inset shows the response to 50 nm ACh at a higher amplitude resolution. The traces are from a total of five cells in which the response to 1 μm ACh was similar (an average response of 165 pA). For each cell, the response to 1 μm ACh was adjusted (by < 10 %) to match the average 1 μm response, and responses at all other concentrations were scaled accordingly. B, responses, from a single cell, to 300 ms pulses of 0.1-500 μm nicotine. The inset shows the response to 100 nm nicotine at a higher amplitude resolution. Note that the response to 500 μm nicotine is reduced below that to 100 μm, and that a ‘rebound current’ appears at the end of the application. C, the relative current, normalized to the response to 1 μm ACh, is shown on a semi-logarithmic plot. The concentration–response data were fitted with the empirical Hill equation (see Methods) and provide the following estimates for the EC50, Hill coefficient and maximal response: for ACh 44 μm, 0.8 and 13.4; for nicotine 14 μm, 0.7 and 13.2. The response to 500 μm nicotine shows a decline from the response to 100 μm nicotine and was not included in the fitted concentration response data. D, the concentration–response data for nicotine and ACh graphed on a double logarithmic plot, normalized to the fit maximal response to better illustrate the slope of the concentration–response relationship and the fraction of receptors activated at each concentration. (Triangles: nicotine, circles: ACh. Data are means ±s.d. for 3–22 cells, except for response to 1 mm ACh which is the mean for 2 cells.)
The lowest concentration of ACh shown in the concentration–response relationship is 50 nm, while the lowest concentration shown for nicotine is 30 nm (Fig. 1). Based on the fitted concentration–response data, the response to 10 nm ACh should be ≈2 % and to 10 nm nicotine should be ≈10 % of the response to 1 μm ACh. Numerous attempts to measure a response to 10 nm nicotine or ACh met with failure. The difficulty encountered in measuring responses to very low concentrations may indicate a steeper slope for the concentration response relationship at concentrations below 30 nm.
The peak response at concentrations of nicotine greater than 100 μm is attenuated (Fig. 1 and Fig. 2). The attenuation increases at more negative potentials (data not shown). ACh, on the other hand, does not appear to be as effective at blocking the receptor (Fig. 1 and Fig. 2). It is likely that the block by nicotine reflects open channel block (Rush et al. 2002). In practical terms, this observation indicated that our experiments should focus on concentrations of nicotine of 10 μm or less.
Other groups have shown that the concentration–response data for rat α4β2 nicotinic receptors is better described by the sum of two Hill equations (Zwart & Vijverberg, 1998; Buisson et al. 2000; Covernton & Connolly, 2000) rather than a single component. This observation suggests that there are two populations of receptors with different affinities on the surface of cells, although a more complicated activation scheme of a single population of receptors could generate similar data. Our data are less complete than those in these previous studies. However, the low values for the Hill coefficient that we obtained are consistent with the possibility that two populations of receptors exist on the cells we have studied. We did not attempt to fit the sum of two Hill equations to the data for nicotine, as the response to high concentrations was attenuated. When the data obtained with ACh were fit (with the Hill coefficients constrained to be identical), the values obtained were for the higher apparent affinity component EC50 = 2 μm (20 % of total) and for the lower apparent affinity component EC50 = 123 μm (80 %).
Desensitization onset is similar for ACh and nicotine
Both nicotine and ACh desensitize α4β2 receptors (Fig. 2). Inspection of the traces indicates that the onset of desensitization is qualitatively similar for both nicotine and ACh, and over the concentration range from 0.1-100 μm. That is, the desensitization during the 5 s application is biphasic and the residual current is much less than half of the peak current at all concentrations.
The decay in current took place along a time course that was best fitted by the sum of two exponentials declining to a constant, indicating the presence of two or more desensitized states (Fenster et al. 1997). The time constants for the decay were similar for nicotine and ACh at a given concentration and showed very little dependence on agonist concentration (Fig. 3A). Similarly, there was little change in the time constants as a function of fractional activation of receptors, even though these concentrations of agonist covered a wide range of the concentration–response curve for the peak response (Fig. 3B). The value for the steady-state response was estimated in two ways. First, the residual current 5 s after the start of the response was determined, and compared to the peak current (end/peak ratio; Fig. 3C). Second, the mean value for the fitted constant was computed (fraction constant; Fig. 3C). If the mean fitted constant is taken as an estimate for the level of steady-state desensitization, then even 100 nm nicotine desensitizes more than 90 % of the response (mean fitted constant 0.04 ± 0.10, n = 8) while ACh desensitizes most of the response (0.14 ± 0.10, n = 4). The relative amplitude of the rapidly desensitizing component increases with concentration (Fig. 3D; probability that the linear regression coefficient differs from zero is P < 0.001 for both ACh and nicotine). However, it is possible that channel block by 100 μm nicotine has a significant effect on the apparent amplitude of the fast component.
Figure 3. The onset of desensitization shows little dependence on agonist concentration or fractional activation.

A, the fast and slow time constants for the onset of desensitization are shown as a function of agonist concentration. There is little change in the time constants over this 1000-fold range of concentration. B, time constants are plotted as a function of fractional activation. C, the mean value for the fit constant term (open symbols; see Methods) and the residual current at 5 s (filled symbols) are plotted as a function of agonist concentration. There is a decline in the estimated steady-state response with increasing concentration. D, the ratio of the fit amplitude for the fast component to that for the slow component is shown as a function of agonist concentration. The relative amount of the rapidly decaying component increases with agonist concentration. The dashed lines in A and B show a slope of −1. (Triangles: nicotine, circles: ACh. Data are means ±s.d. for 4–21 cells.)
The data shown in Fig. 3 indicate that nicotine and ACh are similar in that the time constants for the two components are indistinguishable at all concentrations, and change little with concentration. They differ in that nicotine has a larger contribution from the rapidly decaying component (P < 0.03 for 1 μm and 100 μm, not significant for other concentrations), and a smaller end/peakratio at 100 nm (P < 0.04).
If equilibration of receptors into desensitized state(s) was directly related to receptor activation, it might be expected that the rate of entry would be linearly related to either concentration or fractional activation, at least over some agonist concentration range (Katz & Thesleff, 1957; Feltz & Trautmann, 1982; Dilger & Liu, 1992). The dashed lines in Fig. 3A and B indicate an inverse linear relationship between time constant and either agonist concentration or receptor activation. The difference between the experimental observations and the dashed lines suggest that desensitization does not require receptor activation.
Nicotine induces long-lived desensitization
Nicotine and ACh are remarkably similar in terms of the apparent rate of development of desensitization. To further examine the properties of desensitization induced by these two agonists, we measured the rate of recovery from desensitization using a two-pulse protocol (Fig. 4). We used 10 μm nicotine or 100 μm ACh for these experiments, with three reasons for choosing these concentrations. First, the increased amplitude at concentrations higher than 1 μm improves the accuracy of our measurements. Next, the lower concentration of nicotine was necessary to avoid the possibility of extensive channel block by nicotine (see above). Finally, as shown in the concentration–response curve (Fig. 1D), these concentrations activate a similar fraction of the maximal response (43 % by 10 μm nicotine and 65 % by 100 μm ACh). Receptors were desensitized by a 2 s application, then washed for a variable time and the response tested with the same concentration of agonist. Recovery showed a biphasic time course for both nicotine and ACh, further indicating that the α4β2 receptor has at least two desensitized states. The time constant for the rapid phase of recovery is similar for both agonists (about 0.7 s). However, the fast component of recovery for receptors desensitized by ACh accounts for ≈50 % of recovery, compared to only ≈10 % for nicotine (Fig. 4B). The time constant for the slow recovery from desensitization by nicotine was somewhat larger than for ACh (40 s for nicotine, 17 s for ACh). Therefore, the overall recovery from desensitization by ACh proceeds much more rapidly than from desensitization by nicotine.
Duration of agonist application affects recovery
In the previous recovery experiments, the duration of the agonist application was fixed at 2 s for both nicotine and ACh. We then examined the effect of longer or shorter durations of desensitizing applications of agonist. For reasons outlined in the previous section, and for continuity, we maintained the same concentrations of agonists (10 μm nicotine and 100 μm ACh). The duration of the agonist-free wash was fixed at 5 s. The recovery data (Fig. 4B) indicate that the time constant for fast recovery is ≈0.7 s for both 100 μm ACh and 10 μm nicotine. Therefore, a 5 s interpulse interval is sufficient to allow the majority of rapidly recovering receptors to recover (> 99 %). Accordingly, a decrease in the amount of recovery with increasing pulse duration would indicate an increase in the percentage of slowly recovering receptors. The data in Fig. 5B indicate that the percentage of rapidly recovering receptors decreases as the pulse duration of either agonist increases, indicating that the prolonged application of ligand drives the receptors into a slowly recovering (SR) state(s). The decline in response is not well described by a single exponential, but requires the sum of two exponential components plus a constant. This observation suggests that there is more than one SR state, in addition to the rapidly recovering desensitized state.
Figure 5. Prolonged duration of desensitization promotes entry into a slowly recovering state.

A two-pulse protocol was used in which the desensitizing pulse duration was variable and the drug free wash was fixed at 5 s (see Methods). A, traces show the decrease in recovery as the duration of the desensitizing pulse increases. Typical responses to 10 s agonist applications are shown, with the tick marks showing durations of 0.5, 1, 2, 5 and 10 s. The numbers above the test responses provide the duration of the desensitizing pulse. B, the fractional recovery is plotted in relation to the duration of the desensitizing pulse duration. The lines through the data show the predictions of the best fitting sum of two exponentials declining to a constant, with values: ACh τfast = 300 ms (30 %) and τslow = 6 s (56 %) and 13 % residual response; nicotine τfast = 200 ms (78 %) and τslow = 8 s (19 %) and 3 % residual response. As in Fig. 4, receptors were desensitized by 10 μm nicotine or 100 μm ACh. Cells were held at −100 mV during the agonist application and −50 mV during the 5 s wash. The data were obtained from multiple cells; for display the amplitudes of the responses to the conditioning pulse were normalized to the same value, and the test responses were normalized by the same factor.
At all pulse durations tested the fraction of receptors recovering during the 5 s wash was lower for nicotine than it was for ACh, indicating that nicotine is more efficient at inducing SR desensitization. In fact, a 500 ms pulse of 10 μm nicotine was sufficient to drive the majority of receptors into the SR states while pulse durations > 2 s are necessary for 100 μm ACh to induce a majority of SR desensitization.
Although the fractional recovery decreased as the pulse length increased, recovery was never zero for either agonist, even after 20 s of agonist exposure. A possible explanation for the minimal fractional recovery is that partial recovery from the SR states occurred during the 5 s wash. From the time constants fit to the data for recovery from a 2 s application of agonist (Fig. 5B), we would expect that between 12 % (nicotine) and 25 % (ACh) of receptors in the SR state would recover during a 5 s interval. This calculated value is greater than the observed minimum recovery (3 % for nicotine and 13 % for ACh; Fig. 5B). The difference between the minimum recovery predicted from the analysis of recovery from 2 s applications and that seen after longer agonist applications is consistent with the idea that there are more than one SR state. The data indicate that greater durations of exposure result in greater entry into slowly recovering desensitized states, and that nicotine is more effective at promoting entry into both of the long-lived desensitized states than is ACh.
Low concentrations of nicotine produce desensitization in the absence of measurable activation
In the experiments presented thus far, desensitization was induced by concentrations of agonist that produce significant receptor activation. We tested the α4β2 receptors with a 10 or 100 s pulse of 10 nm nicotine or 10 nm ACh to determine the amount of receptor desensitization which could be induced in the absence of a macroscopic response. Desensitization was measured as a reduction in the peak response to a test pulse of 100 μm ACh. We used 100 μm ACh to assay responsiveness to ensure that we determined the desensitization produced in the majority of the receptors present, rather than selectively assaying a possible high affinity population of receptors. No response to 10 nm nicotine (Fig. 6A) or ACh was seen, even in cells that had a robust response to 1 μm ACh.
Figure 6. Application of a subactivating concentration of ACh or nicotine can desensitize receptors.
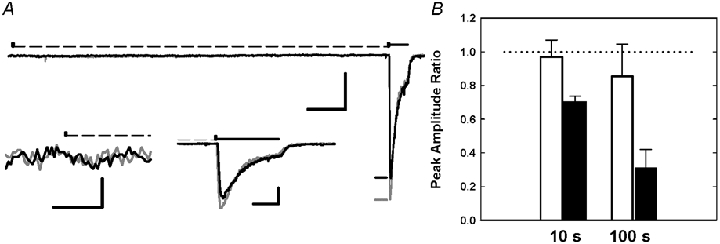
A, representative set of current traces indicating desensitization induced by a 10 s pulse of 10 nm nicotine (scale bars 100 pA and 1 s). There are 2 traces superimposed; the dark trace shows the response obtained when the 10 s pulse contained 10 nm nicotine, while the lighter trace shows the response obtained about 2 min later when the 10 s pulse was bath saline. Both traces show the response to a test pulse 100 μm ACh, applied immediately after the end of the 10 s pre-pulse. The timing of the 10 s prepulse is indicated by the dashed line above the trace, while the test pulse is indicated by the heavy line. The short horizontal lines just before the responses to 100 μm ACh indicate the peak values for the responses. The inset traces show time expanded views of the start of the 10 s applications (left; scale bars 6 pA and 100 ms) and the responses to 100 μm ACh (right; scale bars 100 pA and 200 ms). B, 10 nm ACh or nicotine was applied for 10 or 100 s followed by a test pulse of 100 μm ACh. Desensitization was measured as the ratio of the peak amplitude of the test pulse following exposure to 10 nm agonist compared to the average peak amplitude of a 100 μm ACh control response ≈100 s before and ≈120 s after the test pulse. The bars show desensitization after pre-exposure to ACh (open) or nicotine (black) (mean ±s.d.).
The results (Fig. 6B) show that a 10 s exposure to 10 nm ACh caused no desensitization (relative test response 0.97 ± 0.05, n = 4; P = 0.63 by a paired t test) but a 10 s exposure to 10 nm nicotine produced a 30 % reduction in response (0.70 ± 0.01, n = 6; P < 0.001). Longer exposure (100 s) to 10 nm ACh produced a small reduction in response (0.86 ± 0.08, n = 3; P = 0.21), while nicotine produced a striking reduction (0.31 ± 0.06, n = 3; P < 0.01). Both ACh and nicotine were pre-applied at 10 nm, which was chosen only to provide a non-activating concentration (see above).
100 nm nicotine produces less activation but similar desensitization compared to 1 μm nicotine
A modified protocol was used to directly compare receptor activation and desensitization at low concentrations of nicotine (Fig. 7). We applied a two-part pulse consisting of a 1 s pulse of a low concentration of nicotine (100 nm or 1 μm) to both activate and desensitize receptors, followed immediately by a 1 s pulse of 100 μm nicotine to test desensitization.
Figure 7. Nicotine at 100 nm produces less activation but similar levels of desensitization compared to 1 μm nicotine.
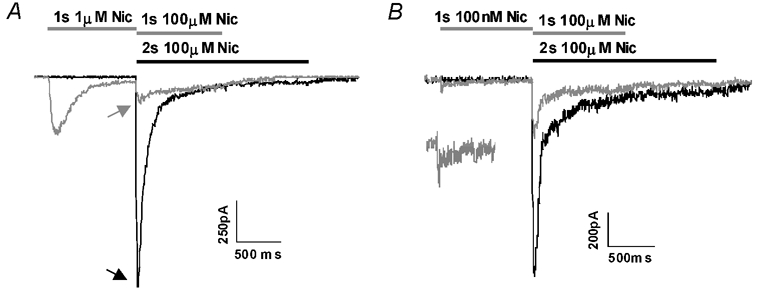
A, activation and desensitization were produced by a 1 s application of 1 μm nicotine, then a test pulse of 100 μm nicotine was immediately applied to assess desensitization. Two traces are superimposed: the lighter trace shows the response to a 1 s application of 1 μm nicotine followed immediately by a 1 s application of 100 μm nicotine. The darker trace shows the response to a 2 s application of nicotine (without a pre-pulse), obtained ≈2 min before the lighter trace. The two traces are aligned at the start of the application of 100 μm nicotine, to indicate the amount of desensitization (peak responses indicated by arrows). Activation was estimated from the charge transfer during the response to the initial 1 s application, normalized to the responses to 100 μm nicotine, while desensitization was measured by the relative responses to 100 μm nicotine with and without the 1 s conditioning pulse (see Methods). B, the same protocol was applied, using 100 nm rather than 1 μm nicotine in the 1 s pre-pulse.
Preapplication of 1 μm nicotine reduced the peak response to 100 μm nicotine to 20 % of control (0.23 ± 0.10, n = 3). Similarly, a 1 s application of 100 nm nicotine caused a 74 % reduction (to 0.26 ± 0.05, n = 3). In contrast, the normalized receptor activation (see Methods) induced by 100 nm nicotine (13 ± 5, n = 3) was much less than the activation produced by 1 μm nicotine (131 ± 33, n = 3). This 10-fold reduction of charge transfer coupled with only a slight reduction in the ability to desensitize indicates that a majority of desensitization induced by 100 nm nicotine occurs without receptor activation.
Recovery from desensitization induced by 100 nm nicotine
Since the majority of receptors desensitized by 100 nm nicotine appeared not to open prior to desensitization, we wondered what effect this has on receptor recovery. To measure recovery, cells were desensitized with 100 nm nicotine for 10 s, followed by a drug-free wash of variable duration (0–100 s), then a test pulse of 100 μm ACh. When desensitization was measured without a wash, the response to 100 μm ACh was decreased by about 90 % (to a relative response of 0.11 ± 0.05; n = 4). This was taken as the residual response, and the fractional recovery was calculated from this.
The recovery data were best fitted by the sum of two exponentials (Fig. 8). Rapid recovery from 10 s of 100 nm nicotine occurred with a time constant of 0.8 s, and constituted about 25 % of the recovery, compared to 0.7 s (about 10 %) for a 2 s pulse of 10 μm nicotine. The slower component had a time constant of about 22 s at 100 nm nicotine (75 % of the recovery) compared to 40 s (90 %) at 10 μm nicotine. These results demonstrate that even at a low concentration, where receptor activation is minimized, nicotine can still cause the majority of receptors to accumulate in desensitized states that exhibit slow recovery.
Figure 8. Slow recovery following a prolonged exposure to a low concentration of nicotine.
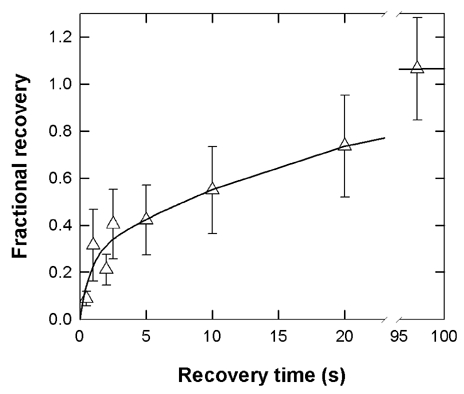
Recovery from desensitization produced by a 10 s exposure to 100 nm nicotine is shown. The fractional recovery occurred along a time course showing two exponentials, with best fitting values of: τfast = 780 ms (25 % or recovery) and τslow = 22.3 s (75 % of recovery). Data show means ±s.d. for 4–13 points, except for recoveries at 0.5 and 2 s which are data from 2 cells each.
DISCUSSION
Nicotine and ACh appear to have similar potencies and efficacies for activation of the α4β2 receptor, although the strong block at higher concentrations of nicotine limits the maximal observable response. They also produce similar time courses for the decay of responses during prolonged agonist applications at concentrations of 100 nm or greater. However, they differ greatly in terms of the time course of recovery from desensitization, with nicotine producing a greater proportion of more slowly recovering receptors. Both nicotine and ACh are able to produce desensitization at concentrations which do not activate a significant fraction of the receptor population, but nicotine, again, appears to be more effective than ACh. Indeed, nicotine is remarkably effective at desensitizing the α4β2 nicotinic receptor.
Desensitization of α4β2 receptors is clearly a complex process. As has been demonstrated earlier, the onset of desensitization for muscle nicotinic receptors (Feltz & Trautmann, 1982; Cachelin & Colquhoun, 1988) and α4β2 receptors (Fenster et al. 1997; Fenster et al. 1999a; Sabey et al. 1999; Buisson et al. 2000) is biphasic. Similarly, recovery from desensitization shows at least two exponential components (Feltz & Trautmann, 1982; Fenster et al. 1997; Buisson & Bertrand, 2001). Finally, desensitization does not require receptor activation to occur (Katz & Thesleff, 1957; Feltz & Trautmann, 1982; Cachelin & Colquhoun, 1988; Fenster et al. 1999b). The present data confirm these observations, and extend them by demonstrating that nicotine is remarkably effective at producing a long-lived form of desensitization. The present data have also examined the concentration dependence of desensitization and activation on the same population of receptors, and for both nicotine and ACh. Finally, the data have critically assessed the role of sub-activating concentrations of nicotine in producing desensitization.
Recent reports of two populations of α4β2 receptors
Before proceeding, it is necessary to consider recent results which can affect the interpretation of the data presented in this paper. It has been reported that the cell surface population of the rat α4β2 neuronal nicotinic receptors is heterogeneous when receptor subunits are expressed in non-neural cells (Zwart & Vijverberg, 1998; Buisson et al. 2000; Covernton & Connolly, 2000). The two populations of receptors differ in terms of the concentration of ACh required for half-maximal activation, having a high affinity (EC50 1–2 μm) and low affinity (EC50 60–100 μm) component. In related studies, it has been reported that prolonged (8–24 h) treatment with low concentrations of nicotine (0.1-10 μm) increases the percentage of high affinity human α4β2 receptors expressed in HEK cells (Buisson & Bertrand, 2001; Nelson et al. 2003). This change in receptor properties may be due a conversion of existing receptors (Buisson & Bertrand, 2001) or the insertion of new, high affinity receptors, with a different stoichiometry (Nelson et al. 2003). Some previous studies have indicated that the two populations might differ in terms of desensitization as well as apparent affinity (Zwart & Vijverberg, 1998; Buisson & Bertrand, 2001), with the high affinity population being more resistant to desensitization. In cells that have not been treated with nicotine, the high affinity population is the minority population (about 20 % of total; Buisson et al. 2000; Buisson & Bertrand, 2001; Nelson et al. 2003).
It is likely that our cells also contain two populations of α4β2 receptors, as our concentration–activation relationships resemble those reported earlier. Our data would be consistent with the idea that about 20 % of the maximal response could reflect the activity of a high affinity population of receptors, based on a fit of the concentration–response relationship for ACh. The existence of two populations of receptors could provide an immediate explanation for some of our observations - for example, the existence of multiple kinetic populations. This idea is very unlikely to account for the data. In terms of the extent of desensitization, we found that very low concentrations of nicotine could desensitize more than half of the response to a high concentration of agonist, indicating that receptors with a low affinity for activation were desensitized. Similarly, the onset of desensitization showed similar rates over a wide range of concentrations. The recovery from desensitization showed two components, but nicotine and ACh (at approximately equi-effective concentrations for activation) produced very different proportions of receptors in the rapidly and slowly recovering populations. Finally, the fraction of receptors in the slowly recovering population increased with increasing duration of the desensitizing application, indicating that the populations identified in terms of recovery are interconvertible. Accordingly, the qualitative aspects of the data clearly do not arise from the existence of multiple populations. However, some of the quantitative aspects of the data may well have been affected.
Our experimental protocols were not specifically designed to separate possible differences between populations. However, there did not seem to be major differences. The desensitization to 100 nm nicotine had a similar onset to desensitization to 100 μm nicotine, although there was a larger steady-state response predicted in the case of 100 nm nicotine (about 6 % compared to less than 1 %). Similarly, the recovery from desensitization by 100 nm nicotine showed two components with similar time constants as during recovery from desensitization by 10 μm nicotine, although the rapidly recovering component was larger.
To reduce the complications which might result from the existence of multiple populations, we usually tested the degree of desensitization using a high concentration of agonist to assay responsiveness of both the high and low affinity populations of receptors. Other ways in which this could affect the interpretation our data are indicated at various points in the remainder of the Discussion.
Activation by nicotine and ACh
The EC50 we find for nicotine (14 μm) is similar to values that have been previously reported for the α4β2 receptor (from 2 to 12 μm; Buisson et al. 1996; Fenster et al. 1997; Buisson & Bertrand, 2001). The arterial concentration of nicotine following inhalation of tobacco smoke typically reaches a concentration between 100 and 500 nm (Gourlay & Benowitz, 1997; Rose et al. 1999), which would acutely activate about 4–10 % of the maximal receptor response. The maintained level of nicotine in the blood of smokers is also close to 100 nm (Russell, 1987). The nicotine concentration in brain is likely to be somewhat higher than in the blood, perhaps twofold (Nordberg et al. 1989).
The reported values of the EC50 for ACh are more variable, ranging from 3 to 80 μm (Buisson et al. 1996, 2000; Sabey et al. 1999; Buisson & Bertrand, 2001; Curtis et al. 2002), in comparison to the value of 44 μm we observed. The concentration of ACh in the cerebrospinal fluid is about 5 nm or less (De Kock et al. 1997; Frolich et al. 1998).
There are multiple desensitized states
The onset of desensitization shows two components, in agreement with previous studies of desensitization of muscle (Feltz & Trautmann, 1982; Cachelin & Colquhoun, 1988) and α4β2 (Fenster et al. 1997; Sabey et al. 1999; Nelson et al. 2003) nicotinic receptors. Recovery from desensitization also shows at least two components, with indications of a third desensitized state. Again, other studies of nicotinic receptors have indicated the existence at least two desensitized states which differ in terms of the rate of recovery from desensitization (Feltz & Trautmann, 1982; Fenster et al. 1997; Paradiso & Brehm, 1998; Buisson et al. 2000). It is interesting that Cachelin & Colquhoun (1988). based on a comparison of results obtained using macroscopic and single channel techniques, have proposed that there are at least three desensitized states for the muscle nicotinic receptor.
Our data are unusual in that they demonstrate that recovery from desensitization induced by nicotine and ACh differ in time course, with recovery from nicotine occurring more slowly. Studies of the recovery from desensitization for muscle type receptors have, in general, found no dependence of the recovery rate on the nature of the agonist (Katz & Thesleff, 1957; Feltz & Trautmann, 1982), although there is one report that recovery from desensitization by carbamylcholine is more rapid than from ACh (Dilger & Liu, 1992). Similarly, recovery of neuronal nicotinic receptors on PC12 cells did not depend on the nature of the agonist (Boyd, 1987).
The difference in recovery arises from the fact that nicotine, at an approximately equi-effective concentration for activation, is much more effective than ACh at promoting entry of the receptor into a slowly recovering state. The recovery from desensitization by a number of agonists has not been systematically examined for the α4β2 receptor. However, it has been reported that the very high affinity agonist, epibatidine, is even more effective than nicotine at producing slowly recovering desensitization of α4β 2 receptors, and recovery can be extremely slow (Buisson et al. 2000).
The physical basis for this difference is not known, but might result from a higher affinity of nicotine (and epibatidine) for the desensitized form of this receptor. It is known that the α4β2 receptor has a very high affinity for agonists when equilibrium binding is measured in biochemical studies (Gopalakrishnan et al. 1996), although the affinity shown by the receptors on the surface of cells is presently debated (Fenster et al. 1999b; Zhang & Steinbach, 2003). Accordingly, it is of some interest whether one of the desensitized states identified physiologically might correspond to the affinity measured biochemically. The equilibrium affinity for agonists, measured using homogenates of cells stably expressing rat or human α4β2 receptors, are about 2.7 nm ACh (Gopalakrishnan et al. 1996), 0.4 nm nicotine (Sabey et al. 1999) and 0.07 nm epibatidine (Gopalakrishnan et al. 1996). For ACh and nicotine, if we assume that the rate of slow recovery from desensitization by 2 s pulses reflects agonist dissociation, the association rates calculated from the dissociation constants for a simple bimolecular binding interaction are 2 × 10⁷ and 6 × 10⁷m−1 s−1 for ACh and nicotine, respectively. These rates are not unreasonable. However, when the mean association rate is used to calculate an apparent dissociation rate for epibatidine, the predicted time constant is about 340 s, which is much faster than the recovery observed (Buisson et al. 2000). Accordingly, it is possible that the slowly recovering desensitized state corresponds to the equilibrium binding observed in homogenates but the data do not fully agree with this idea. We do not have enough data regarding the possible very slowly recovering desensitized state to consider it in this light.
As discussed earlier, it is very unlikely that the multiple populations of receptors explain these qualitative conclusions.
Desensitization occurs rapidly from both closed and open receptors
We do not have an adequate kinetic scheme for the activation and desensitization of the α4β2 receptor, and the possible existence of multiple receptor populations provides additional complications. Accordingly, we do not know how the desensitized states are connected to other states of the receptor. It seems likely, however, that a cyclic model will be appropriate (cf. Katz & Thesleff, 1957; Feltz & Trautmann, 1982; Boyd, 1987; Cachelin & Colquhoun, 1988). Figure 9 shows the scheme proposed for the muscle nicotinic receptor by Cachelin & Colquhoun (1988). which we will use as a basis for discussion.
Figure 9. A cyclic kinetic scheme for desensitization.
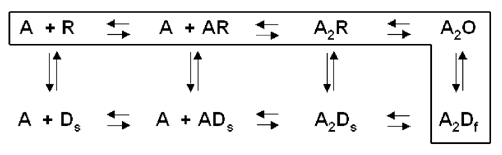
The cyclic scheme proposed by Cachelin & Colquhoun (1988) for the muscle receptor is shown. A resting receptor is shown by R, a receptor with an open channel by O, an agonist molecule by A, the rapidly recovering desensitized state by Df and the slowly recovering state by Ds. In the case of the muscle nicotinic receptor, equilibration between A2O and A2Df is more rapid than between R and Ds and the agonist binding and unbinding steps are much more rapid than any transitions to or from desensitized states. The box encloses the pathway for the initial onset of desensitization at relatively high concentrations of agonist, for the muscle receptor.
In the case of the muscle receptor, at concentrations of agonist which produce significant activation (greater than about 10 % of receptors) the major path for desensitization occurs through the doubly liganded open state (Cachelin & Colquhoun, 1988; Dilger & Liu, 1992; Auerbach & Akk, 1998). Accordingly, the rate of onset of desensitization increases as the proportion of open receptors increases. However, a path between closed channel states and desensitized states clearly exists (Katz & Thesleff, 1957), and previous studies have shown that prolonged applications of low concentrations of agonist can desensitize both muscle and α4β2 receptors (Bufler et al. 1993; Fenster et al. 1997). In terms of the scheme in Fig. 9, for the muscle receptor the rates between resting receptors with closed channels and desensitized receptors must be relatively low compared to the rate between receptors with open channels and desensitized channels.
We find that the rates of desensitization onset for nicotine and ACh at the α4β2 receptor change little over a range of 0.1-100 μm. This suggests that α4β2 receptors desensitize at similar rates from both closed and open channel states, and that even mono-liganded receptors with closed channels desensitize rapidly. This idea is supported by the finding that very low concentrations of nicotine and ACh can produce desensitization with no observable activation, and that at low concentrations of nicotine (0.1 and 1 μm) there is no association between the development of desensitization and total charge transfer.
The cyclic scheme in Fig. 9 has the rapidly and slowly recovering desensitized states connected, as do the other cyclic schemes mentioned above. Such a connection is likely to be present for α4β2 receptors, as indicated by the observation that prolonged incubations change the relative numbers of receptors in the two populations (see also Feltz & Trautmann, 1982; Boyd, 1987; Fenster et al. 1999a).
The physical nature of the multiple desensitized states is not known. In the case of muscle receptors, at least two desensitized states are observed in experimental conditions in which metabolic activity is minimal, indicating that the receptor itself has the ability to adopt more than one desensitized conformation. However, the rates for entry into and exit from desensitized states can be affected by post-translational modifications, although the quantitative nature of the changes is not fully resolved. In the case of the neuronal receptors, it has been proposed that one or more of the slowly recovering processes may reflect changes in phosphorylation (Boyd, 1987; Eilers et al. 1997; Fenster et al. 1999a). Our data do not directly address this question. The present data show that nicotine and ACh have differential effects on entry into the slowly recovering state, which suggests that the states which we have examined reflect conformational changes in the receptor and do not directly require post-translational modifications. The possibility was discussed above that the slow recovery process might reflect agonist dissociation (see also Buisson et al. 2000). In this case, the cyclic scheme for the α4β2 receptor would differ from that for the muscle receptor, in that the conformational changes would no longer be rate limiting for transitions out of some desensitized states.
The possible existence of multiple populations of receptors is unlikely to affect the qualitative interpretation we have given. Very low concentrations of nicotine can desensitize the majority of the response to a high concentration of agonist (100 μm ACh or nicotine). Hence, both high and low affinity receptors can be desensitized by these very low concentrations of agonist.
Nicotine can produce profound desensitization at very low concentrations
As noted, the arterial concentration of nicotine immediately after smoking a cigarette reaches about 100 nm or more, and even the trough level between cigarettes may be close to 100 nm (Russell, 1987; Gourlay & Benowitz, 1997; Rose et al. 1999). Brain levels are likely to be comparable, or somewhat larger. Based on our results obtained with 10 nm and 100 nm nicotine, the concentration reached by smokers will produce essentially complete desensitization of α4β2 receptors. In contrast, the estimated 5 nm concentration of ACh in the CSF (De Kock et al. 1997; Frolich et al. 1998) is likely to produce relatively little desensitization.
Other reports have been made that nicotine is extremely effective at producing desensitization of α4β2 receptors. For example, when receptors are expressed in Xenopus oocytes, the estimated concentration of nicotine producing half-desensitization is about 30–60 nm (Fenster et al. 1997; Fenster et al. 1999b). However, the desensitization seen in oocytes is remarkably slower both in onset and in recovery than when receptors are expressed in somatic cells. Previous reports have been made that 100 nm nicotine produces extensive (but not complete) desensitization of α4β2 receptors in HEK cells, when applied for 3 min or 8 h (Buisson et al. 2000; Buisson & Bertrand, 2001).
Nicotinic receptors expressed on neurons
The receptor subtypes expressed on neurons are not clearly identified. However, several actions of nicotine have been shown to undergo relatively rapid and complete desensitization at low concentrations of nicotine. The nicotine-induced release of GABA from synaptosomes desensitizes with an apparent IC50 of 26 nm (Lu et al. 1999). Spontaneous release of dopamine in brain slices from the striatum is diminished by exogenous nicotine, with an apparent IC50 of about 30 nm (Zhou et al. 2001). The slow (non-α7) nicotinic response on dopaminergic neurons from the midbrain is desensitized by approximately 45 % by 20 nm nicotine (Wooltorton et al. 2003), while the nicotine-induced enhancement of GABAergic spontaneous synaptic currents can be blocked fully by a long-term application of 100 nm nicotine (Mansvelder et al. 2002). The time and concentration dependence of these actions cannot be directly compared to the results we have obtained, as a result of technical differences, but the results clearly indicate parallels between our results and some properties of nicotinic responses on neurons.
A striking finding from studies of mice that have been genetically modified to ablate expression of the α4 (Marubio et al. 1999) or β2 (Picciotto et al. 1995) subunit is that the animals are surprisingly normal in their behaviour. This observation supports the suggestions that nicotine alters activity in the nervous system by modulating the release of transmitters (McGehee & Role, 1996; Wonnacott, 1997), rather than being directly involved in mediating synaptic transmission. The specific subtypes of nicotinic receptors involved in enhancing release of excitatory and inhibitory transmitters differ, and recent studies have supported the idea that the ability of nicotine to preferentially desensitize responses of one receptor subtype may result in changes in the level of inhibition or excitation in neural networks (Dani & De Biasi, 2001; Ji et al. 2001; Mansvelder & McGehee, 2002).
Conclusion
We have shown that nicotine is highly efficacious at inducing and maintaining desensitization of the α4β2 neuronal nicotinic receptor. Very low concentrations of nicotine can produce profound and relatively slowly recovering desensitization; these levels are present in the circulation of smokers both immediately after smoking and during the troughs between cigarettes. Endogenous levels of ACh would not be sufficient to maintain the sustained levels of desensitization that are produced by nicotine.
Acknowledgments
We thank Jessie Zhang and Sarah Marrus for cell culture, and Gustav Akk for comments and advice. This research was supported by NIH grant R01 NS22356 (J.H.S.).
REFERENCES
- Auerbach A, Akk G. Desensitization of mouse nicotinic acetylcholine receptor channels. A two-gate mechanism. J Gen Physiol. 1998;112:181–197. doi: 10.1085/jgp.112.2.181. [DOI] [PMC free article] [PubMed] [Google Scholar]
- Benwell MEM, Balfour DJK, Anderson JM. Evidence that tobacco smoking increases the density of (−)-[3H]nicotine binding sites in human brain. J Neurochem. 1988;50:1243–1247. doi: 10.1111/j.1471-4159.1988.tb10600.x. [DOI] [PubMed] [Google Scholar]
- Boyd ND. Two distinct kinetic phases of desensitization of acetylcholine receptors of clonal rat PC12 cells. J Physiol. 1987;389:45–67. doi: 10.1113/jphysiol.1987.sp016646. [DOI] [PMC free article] [PubMed] [Google Scholar]
- Bufler J, Franke C, Witzemann V, Ruppersberg JP, Merlitze S, Dudel J. Desensitization of embryonic nicotinic acetylcholine receptors expressed in Xenopus oocytes. Neurosci Lett. 1993;152:77–80. doi: 10.1016/0304-3940(93)90487-6. [DOI] [PubMed] [Google Scholar]
- Buisson B, Bertrand D. Chronic exposure to nicotine upregulates the human (alpha)4(beta) nicotinic acytylcholine receptor function. J Neurosci. 2001;21:1819–1829. doi: 10.1523/JNEUROSCI.21-06-01819.2001. [DOI] [PMC free article] [PubMed] [Google Scholar]
- Buisson B, Gopalakrishnan M, Arneric SP, Sullivan JP, Bertrand D. Human alpha4beta2 neuronal nicotinic acetylcholine receptor in HEK 293 cells: A patch-clamp study. J Neurosci. 1996;16:7880–7891. doi: 10.1523/JNEUROSCI.16-24-07880.1996. [DOI] [PMC free article] [PubMed] [Google Scholar]
- Buisson B, Vallejo YF, Green WN, Bertrand D. The unusual nature of epibatidine responses at the alpha4beta2 nicotinic acetylcholine receptor. Neuropharmacology. 2000;39:2561–2569. doi: 10.1016/s0028-3908(00)00158-1. [DOI] [PubMed] [Google Scholar]
- Cachelin AB, Colquhoun D. Desensitization of the acetylcholine receptor of frog end-plates measured in a vaseline-gap voltage clamp. J Physiol. 1988;415:159–188. doi: 10.1113/jphysiol.1989.sp017717. [DOI] [PMC free article] [PubMed] [Google Scholar]
- Covernton PJO, Connolly JG. Multiple components in the agonist concentration–response relationships of neuronal nicotinic acetylcholine receptors. J Neurosci Methods. 2000;96:63–70. doi: 10.1016/s0165-0270(99)00185-5. [DOI] [PubMed] [Google Scholar]
- Curtis L, Buisson B, Bertrand S, Bertrand D. Potentiation of human alpha4beta2 neuronal nicotinic acetylcholine receptor by estradiol. Mol Pharmacol. 2002;61:127–135. doi: 10.1124/mol.61.1.127. [DOI] [PubMed] [Google Scholar]
- Dani JA, De Biasi M. Cellular mechanisms of nicotine addiction. Pharmacol Biochem Behav. 2001;70:439–446. doi: 10.1016/s0091-3057(01)00652-9. [DOI] [PubMed] [Google Scholar]
- Dani JA, Heinemann S. Molecular and cellular aspects of nicotine abuse. Neuron. 1996;16:905–908. doi: 10.1016/s0896-6273(00)80112-9. [DOI] [PubMed] [Google Scholar]
- De Kock M, Eisenach J, Tong C, Schmitz AL, Scholtes JL. Analgesic doses of intrathecal but not intravenous clonidine increase acetylcholine in cerebrospinal fluid in humans. Anesth Analg. 1997;84:800–803. doi: 10.1097/00000539-199704000-00019. [DOI] [PubMed] [Google Scholar]
- Dilger JP, Liu Y. Desensitization of acetylcholine receptors in BC3H-1 cells. Pflugers Arch. 1992;420:479–485. doi: 10.1007/BF00374622. [DOI] [PubMed] [Google Scholar]
- Eilers H, Schaeffer E, Bickler PE, Forsayeth JR. Functional deactivation of the major neuronal nicotinic receptor caused by nicotine and a protein kinase C-dependent mechanism. Mol Pharmacol. 1997;52:1105–1112. [PubMed] [Google Scholar]
- Feltz A, Trautmann A. Desensitization at the frog neuromuscular junction: a biphasic process. J Physiol. 1982;322:257–272. doi: 10.1113/jphysiol.1982.sp014036. [DOI] [PMC free article] [PubMed] [Google Scholar]
- Fenster CP, Beckman ML, Parker JC, Sheffield EB, Whitworth TL, Quick MW, Lester RA. Regulation of alpha4beta2 nicotinic receptor desensitization by calcium and protein kinase C. Mol Pharmacol. 1999a;55:432–443. [PubMed] [Google Scholar]
- Fenster CP, Rains MF, Noerager B, Quick MW, Lester RAJ. Influence of subunit composition on desensitization of neuronal acetylcholine receptors at low concentrations of nicotine. J Neurosci. 1997;17:5747–5759. doi: 10.1523/JNEUROSCI.17-15-05747.1997. [DOI] [PMC free article] [PubMed] [Google Scholar]
- Fenster CP, Whitworth TL, Sheffield EB, Quick MW, Lester RA. Upregulation of surface alpha4beta2 nicotinic receptors is initiated by receptor desensitization after chronic exposure to nicotine. J Neurosci. 1999b;19:4804–4814. doi: 10.1523/JNEUROSCI.19-12-04804.1999. [DOI] [PMC free article] [PubMed] [Google Scholar]
- Flores CM, Rogers SW, Pabreza LA, Wolfe BB, Kellar KJ. A subtype of nicotinic cholinergic receptor in rat brain is composed of alpha 4 and beta 2 subunits and is up-regulated by chronic nicotine treatment. Mol Pharmacol. 1992;41:31–37. [PubMed] [Google Scholar]
- Frolich L, Dirr A, Gotz ME, Gsell W, Reichmann H, Riederer P, Maurer K. Acetylcholine in human CSF: methodological considerations and levels in dementia of Alzheimer type. J Neural Transm. 1998;105:961–973. doi: 10.1007/s007020050105. [DOI] [PubMed] [Google Scholar]
- Girod R, Barazangi N, McGehee D, Role LW. Facilitation of glutamatergic neurotransmission by presynaptic nicotinic acetylcholine receptors. Neuropharmacology. 2000;39:2715–2725. doi: 10.1016/s0028-3908(00)00145-3. [DOI] [PubMed] [Google Scholar]
- Gopalakrishnan M, Monteggia LM, Anderson DJ, Molinari EJ, Piattonikaplan M, Donnelly-Roberts D, Arneric SP, Sullivan JP. Stable expression, pharmacologic properties and regulation of the human neuronal nicotinic acetylcholine alpha(4)beta(2). receptor. J Pharmacol Exp Ther. 1996;276:289–297. [PubMed] [Google Scholar]
- Gourlay SG, Benowitz NL. Arteriovenous differences in plasma concentration of nicotine and catecholamines and related cardiovascular effects after smoking, nicotine nasal spray, and intravenous nicotine. Clin Pharmacol Ther. 1997;62:453–463. doi: 10.1016/S0009-9236(97)90124-7. [DOI] [PubMed] [Google Scholar]
- Grady SR, Murphy KL, Cao J, Marks MJ, McIntosh JM, Collins AC. Characterization of nicotinic agonist-induced [(3)H]dopamine release from synaptosomes prepared from four mouse brain regions. J Pharmacol Exp Ther. 2002;301:651–660. doi: 10.1124/jpet.301.2.651. [DOI] [PubMed] [Google Scholar]
- Guo JZ, Tredway TL, Chiappinelli VA. Glutamate and GABA release are enhanced by different subtypes of presynaptic nicotinic receptors in the lateral geniculate nucleus. J Neurosci. 1998;18:1963–1969. doi: 10.1523/JNEUROSCI.18-06-01963.1998. [DOI] [PMC free article] [PubMed] [Google Scholar]
- Haghighi AP, Cooper E. Neuronal nicotinic acetylcholine receptors are blocked by intracellular spermine in a voltage-dependent manner. J Neurosci. 1998;18:4050–4062. doi: 10.1523/JNEUROSCI.18-11-04050.1998. [DOI] [PMC free article] [PubMed] [Google Scholar]
- Ji D, Lape R, Dani JA. Timing and location of nicotinic activity enhances or depresses hippocampal synaptic plasticity. Neuron. 2001;31:131–141. doi: 10.1016/s0896-6273(01)00332-4. [DOI] [PubMed] [Google Scholar]
- Katz B, Thesleff S. A study of the ‘desensitization’ produced by acetylcholine at the motor end- plate. J Physiol. 1957;138:63–80. doi: 10.1113/jphysiol.1957.sp005838. [DOI] [PMC free article] [PubMed] [Google Scholar]
- Lambe EK, Picciotto MR, Aghajanian GK. Nicotine induces glutamate release from thalamocortical terminals in prefrontal cortex. Neuropsychopharmacology. 2003;28:216–225. doi: 10.1038/sj.npp.1300032. [DOI] [PubMed] [Google Scholar]
- Lindstrom J, Anand R, Gerzanich V, Peng X, Wang F, Wells G. Structure and function of neuronal nicotinic acetylcholine receptors. Progr Brain Res. 1996;109:125–137. doi: 10.1016/s0079-6123(08)62094-4. [DOI] [PubMed] [Google Scholar]
- Lu Y, Marks MJ, Collins AC. Desensitization of nicotinic agonist-induced [3H]gamma-aminobutyric acid release from mouse brain synaptosomes is produced by subactivating concentrations of agonists. J Pharmacol Exp Ther. 1999;291:1127–1134. [PubMed] [Google Scholar]
- McGehee DS. Nicotinic receptors and hippocampal synaptic plasticity. it's all in the timing. Trends Neurosci. 2002;25:171–172. doi: 10.1016/s0166-2236(00)02127-5. [DOI] [PubMed] [Google Scholar]
- McGehee DS, Role LW. Presynaptic ionotropic receptors. Curr Opin Neurobiol. 1996;6:342–349. doi: 10.1016/s0959-4388(96)80118-8. [DOI] [PubMed] [Google Scholar]
- Maconochie DJ, Knight DE. A method for making solution changes in the sub-millisecond range at the tip of a patch pipette. Pflugers Arch. 1989;414:589–596. doi: 10.1007/BF00580996. [DOI] [PubMed] [Google Scholar]
- Mansvelder HD, Keath JR, McGehee DS. Synaptic mechanisms underlie nicotine-induced excitability of brain reward areas. Neuron. 2002;33:905–919. doi: 10.1016/s0896-6273(02)00625-6. [DOI] [PubMed] [Google Scholar]
- Mansvelder HD, McGehee DS. Long-term potentiation of excitatory inputs to brain reward areas by nicotine. Neuron. 2000;27:349–357. doi: 10.1016/s0896-6273(00)00042-8. [DOI] [PubMed] [Google Scholar]
- Mansvelder HD, McGehee DS. Cellular and synaptic mechanisms of nicotine addiction. J Neurobiol. 2002;53:606–617. doi: 10.1002/neu.10148. [DOI] [PubMed] [Google Scholar]
- Marubio LM, Arroyo-Jimenez MD, Cordero-Erausquin M, Lena C, Novere NL, D'Exaerde AD, Huchet M, Damaj MI, Changeux JP. Reduced antinociception in mice lacking neuronal nicotinic receptor subunits. Nature. 1999;398:805–810. doi: 10.1038/19756. [DOI] [PubMed] [Google Scholar]
- Nelson ME, Kuryatov A, Choi CH, Zhou Y, Lindstrom J. Alternate stoichiometries of alpha4beta2 nicotinic acetylcholine receptors. Mol Pharmacol. 2003;63:332–341. doi: 10.1124/mol.63.2.332. [DOI] [PubMed] [Google Scholar]
- Nordberg A, Hartvig P, Lundqvist H, Antoni G, Ulin J, Langstrom B. Uptake and regional distribution of (+)-(R)- and (−)-(S)-N-[methyl-11C]nicotine in the brains of Rhesus monkey: an attempt to study nicotinic receptors in vivo. J Neural Transm. 1989;1:195–205. doi: 10.1007/BF02248669. [DOI] [PubMed] [Google Scholar]
- Ortells MO, Lunt GG. Evolutionary history of the ligand-gated ion-channel superfamily of receptors. Trends Neurosci. 1995;18:121–127. doi: 10.1016/0166-2236(95)93887-4. [DOI] [PubMed] [Google Scholar]
- Paradiso K, Brehm P. Long-term desensitization of nicotinic acetylcholine receptors is regulated via protein kinase A-mediated phosphorylation. J Neurosci. 1998;18:9227–9237. doi: 10.1523/JNEUROSCI.18-22-09227.1998. [DOI] [PMC free article] [PubMed] [Google Scholar]
- Picciotto MR, Brunzell DH, Caldarone BJ. Effect of nicotine and nicotinic receptors on anxiety and depression. Neuroreport. 2002;13:1097–1106. doi: 10.1097/00001756-200207020-00006. [DOI] [PubMed] [Google Scholar]
- Picciotto MR, Zoli M, Lena C, Bessis A, Lallemand Y, Novere NL, Vincent P, Pich EM, Brulet P, Changeux JP. Abnormal avoidance learning in mice lacking functional high-affinity nicotine receptor in the brain. Nature. 1995;374:65–67. doi: 10.1038/374065a0. [DOI] [PubMed] [Google Scholar]
- Picciotto MR, Zoli M, Rimondini R, Lena C, Marubio LM, Pich EM, Fuxe K, Changeux JP. Acetylcholine receptors containing the beta2 subunit are involved in the reinforcing properties of nicotine. Nature. 1998;391:173–177. doi: 10.1038/34413. [DOI] [PubMed] [Google Scholar]
- Quick MW, Lester RA. Desensitization of neuronal nicotinic receptors. J Neurobiol. 2002;53:457–478. doi: 10.1002/neu.10109. [DOI] [PubMed] [Google Scholar]
- Rezvani AH, Levin ED. Cognitive effects of nicotine. Biol Psychiatry. 2001;49:258–267. doi: 10.1016/s0006-3223(00)01094-5. [DOI] [PubMed] [Google Scholar]
- Robbins TW, Everitt BJ. Drug addiction: bad habits add up. Nature. 1999;398:567–570. doi: 10.1038/19208. [DOI] [PubMed] [Google Scholar]
- Rose JE, Behm FM, Westman EC. Acute effects of nicotine and mecamylamine on tobacco withdrawal symptoms, cigarette reward and ad lib smoking. Pharmacol Biochem Behav. 2001;68:187–197. doi: 10.1016/s0091-3057(00)00465-2. [DOI] [PubMed] [Google Scholar]
- Rose JE, Behm FM, Westman EC, Coleman RE. Arterial nicotine kinetics during cigarette smoking and intravenous nicotine administration: implications for addiction. Drug Alcohol Depend. 1999;56:99–107. doi: 10.1016/s0376-8716(99)00025-3. [DOI] [PubMed] [Google Scholar]
- Rush R, Kuryatov A, Nelson ME, Lindstrom J. First and second transmembrane segments of alpha3, alpha4, beta2, and beta4 nicotinic acetylcholine receptor subunits influence the efficacy and potency of nicotine. Mol Pharmacol. 2002;61:1416–1422. doi: 10.1124/mol.61.6.1416. [DOI] [PubMed] [Google Scholar]
- Russell MAH. Nicotine intake and its regulation by smokers. In: Martin WR, Van Loon GR, Iwamoto ET, Davis L, editors. Tobacco Smoking and Nicotine. New York: Blackwell Science Inc; 1987. pp. 25–50. [Google Scholar]
- Sabey K, Paradiso K, Zhang J, Steinbach JH. Ligand binding and activation of rat nicotinic alpha 4 beta 2 receptors stably expressed in HEK293 cells. Mol Pharmacol. 1999;55:58–66. [PubMed] [Google Scholar]
- Wonnacott S. Presynaptic nicotinic ACh receptors. Trends Neurosci. 1997;20:92–98. doi: 10.1016/s0166-2236(96)10073-4. [DOI] [PubMed] [Google Scholar]
- Wooltorton JR, Pidoplichko VI, Broide RS, Dani JA. Differential desensitization and distribution of nicotinic acetylcholine receptor subtypes in midbrain dopamine areas. J Neurosci. 2003;23:3176–3185. doi: 10.1523/JNEUROSCI.23-08-03176.2003. [DOI] [PMC free article] [PubMed] [Google Scholar]
- Zhang J, Steinbach JH. Cytisine binds with similar affinity to nicotinic alpha4beta2 receptors on the cell surface and in homogenates. Brain Res. 2003;959:98–102. doi: 10.1016/s0006-8993(02)03733-2. [DOI] [PubMed] [Google Scholar]
- Zhou FM, Liang Y, Dani JA. Endogenous nicotinic cholinergic activity regulates dopamine release in the striatum. Nat Neurosci. 2001;4:1224–1229. doi: 10.1038/nn769. [DOI] [PubMed] [Google Scholar]
- Zhou FM, Wilson CJ, Dani JA. Cholinergic interneuron characteristics and nicotinic properties in the striatum. J Neurobiol. 2002;53:590–605. doi: 10.1002/neu.10150. [DOI] [PubMed] [Google Scholar]
- Zwart R, Vijverberg HPM. Four pharmacologically distinct subtypes of alpha 4 beta 2 nicotinic acetylcholine receptor expressed in Xenopus laevis oocytes. Mol Pharmacol. 1998;54:1124–1131. [PubMed] [Google Scholar]