The antiproliferative complex Tob–hCaf1 was purified and crystallized using the sitting-drop vapour-diffusion method. The crystal diffracted to around 2.6 Å resolution.
Keywords: Tob, CCR4-associated factor 1, antiproliferation
Abstract
The Tob/BTG family is a group of antiproliferative proteins that contain two highly homologous regions named Box A and Box B. These proteins all associate with CCR4-associated factor 1 (Caf1), which belongs to the ribonuclease D family of deadenylases. The antiproliferative region of human Tob (residues 1–138) and intact hCaf1 were co-expressed in Escherichia coli, purified and successfully cocrystallized. The crystal belongs to the tetragonal space group I422, with unit-cell parameters a = b = 150.9, c = 113.9 Å, and is estimated to contain one heterodimer per asymmetric unit. The crystal diffracted to around 2.6 Å resolution.
1. Introduction
The Tob/BTG family is a group of antiproliferative proteins (Tirone, 2001 ▶; Matsuda et al., 2001 ▶). This family consists of Tob (Matsuda et al., 1996 ▶), Tob2 (Ikematsu et al., 1999 ▶), BTG1 (Rouault et al., 1992 ▶), BTG2/Tis21/PC3 (Rouault et al., 1996 ▶; Fletcher et al., 1991 ▶; Bradbury et al., 1991 ▶), PC3B (Buanne et al., 2000 ▶) and ANA/BTG3 (Yoshida et al., 1998 ▶; Guehenneux et al., 1997 ▶) in mammalian cells. These proteins have been reported to inhibit cell proliferation when expressed exogenously in cultured cells. The N-terminal region of the Tob/BTG-family proteins is thought to be responsible for the antiproliferative function since it is highly conserved. This region includes two homologous regions named Box A and Box B (Guehenneux et al., 1997 ▶). The Tob/BTG-family proteins are involved in cell-cycle regulation in a variety of cells, such as T lymphocytes, osteoblasts, fibroblasts, epithelial cells, neuronal cells and germ cells. For example, in mice defective in tob the rate of occurrence of tumours in the lungs, liver and lymph nodes is higher than that in wild-type mice (Yoshida et al., 2003 ▶) and levels of tob expression are often decreased in human lung cancers (Yoshida et al., 2003 ▶).
The antiproliferative activities of the Tob/BTG-family proteins are a consequence of their association with target proteins in cells. Much evidence has been accumulated that suggests that CCR4-associated factor 1 (Caf1), also known as Cnot7, is a common binding partner for Tob/BTG family proteins (Prévôt et al., 2001 ▶; Ikematsu et al., 1999 ▶; Bogdan et al., 1998 ▶; Rouault et al., 1998 ▶). Caf1 is a component of the CCR4–NOT deadenylase complex and is involved in deadenylation of the poly(A) tail of mRNA, which is the first major step in mRNA degradation in eukaryotes (Parker & Song, 2004 ▶; Meyer et al., 2004 ▶). Tob interacts with Caf1 and poly(A)-binding protein (PABP) simultaneously, thus enhancing mRNA degradation through recruiting the CCR4–NOT complex to stimulate deadenylation (Ezzeddine et al., 2007 ▶).
The recognition between Tob and Caf1 is critical for deadenylation and antiproliferative activities. In this report, we describe the expression, purification, crystallization and preliminary crystallographic analysis of the Tob–hCaf1 complex.
2. Expression and purification
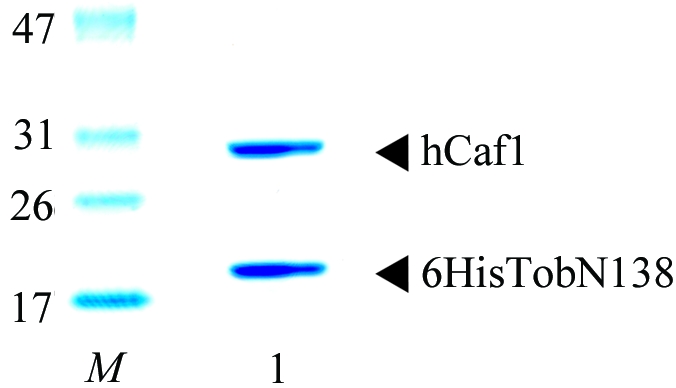
In order to elucidate the antiproliferative activity of Tob, the antiproliferative region of human Tob comprising the amino-terminal 138 residues (which we refer to as TobN138) and intact hCaf1 were co-expressed in Escherichia coli. The gene of TobN138 was subcloned under a hexahistidine tag (6His) into the pET-28 plasmid and the gene for hCaf1 was subcloned into the pET-11 plasmid (Novagen). These plasmids were co-transformed in E. coli BLR (DE3) pLysS for native proteins and the methionine-auxotroph strain B834 (DE3) for SeMet-labelled proteins. Cells were cultured to an OD600 of 0.5 at 303 K and induced with 1 mM isopropyl β-d-1-thiogalactopyranoside for 18 h. After cell lysis, the protein was applied onto Ni–NTA agarose resin (Qiagen) and eluted with a gradient of 0–250 mM imidazole in 50 mM Tris–HCl pH 8.0, 150 mM NaCl and 1 mM ABSF. The 6HisTobN138–Caf1 complex was separated from 6HisTobN138 monomer using a Superdex 75pg 26/60 gel-filtration column (Amersham) equilibrated with 50 mM Tris–HCl pH 8.0, 150 mM NaCl and 0.5 mM EDTA. The heterodimer fraction was loaded onto a Mono Q HR10/10 anion-exchange column (Amersham) equilibrated with 20 mM Tris–HCl pH 8.0. The heterodimer was eluted using a 160 ml linear gradient of 0–1 M NaCl. Fractions containing the heterodimer were dialyzed against 10 mM Tris–HCl pH 8.0, 30 mM NaCl, 0.1 mM EDTA and 5 mM dithiothreitol (DTT) and stored at 193 K prior to crystallization. To determine the amino-terminal sequences and molecular weights of 6HisTobN138 and hCaf1, the proteins were separated using a Poros R2/M reverse-phase column (Applied Biosystems). The protein sequences determined using a PPSQ-21 protein sequencer (Shimazu) indicated that the N-terminal methionine was removed from both the 6HisTobN138 and hCaf1 proteins. The molecular weights of 6HisTobN138 and hCaf1 were determined to be 18 736 Da (calculated molecular weight 18 733 Da) and 32 617 Da (calculated molecular weight 32 613 Da), respectively, using a Voyager DE-PRO MALDI–TOF mass spectrometer (Applied Biosystems). The purified protein complex was concentrated to 20 mg ml−1 and used for crystallization (Fig. 1 ▶).
Figure 1.

SDS–PAGE of 6HisTobN138–hCaf1 complex (lane 1) on 5–20% gradient gel. Lane M contains molecular-weight markers (labelled in kDa). Proteins were stained with Coomassie Brilliant Blue.
3. Crystallization
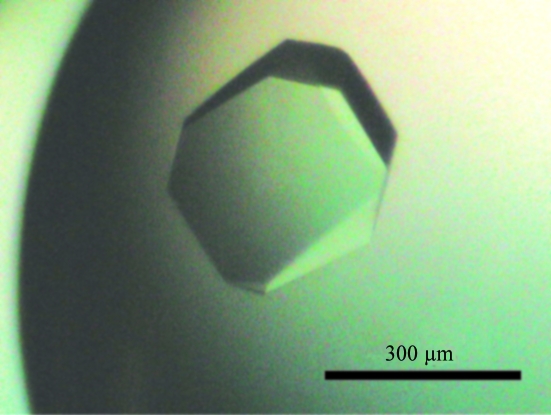
Initial crystallization conditions for native and SeMet-labelled protein complexes were obtained by sparse-matrix screening (Hampton, Aliso Viejo, California, USA). In the sitting-drop vapour-diffusion method, 1 µl 20 mg ml−1 6HisTobN138–hCaf1 complex (10 mM Tris–HCl pH 8.0, 30 mM NaCl, 0.1 mM EDTA and 5 mM DTT) was mixed with an equal volume of reservoir solution [80 mM Tris–HCl pH 8.0, 160 mM sodium acetate, 10 mM DTT, 12%(w/v) PEG 4000 and 12% glycerol]. The protein/reservoir mixture was equilibrated against 100 µl reservoir solution at 293 K and small crystals (<0.02 mm) were obtained after 24 h. To prepare the seed stock, 1 µl of a drop containing small crystals was diluted with 30 µl of the same reservoir solution and vortexed with a Teflon ball (Hampton) in a microtube. 1 µl of serial dilutions (10−1-fold to 10−8-fold) of seed stock was mixed with 1 µl 20 mg ml−1 protein solution and equilibrated against 100 µl reservoir solution at 293 K. After 48 h at 293 K, microseeding generated crystals of dimensions 0.3 × 0.3 × 0.1 mm (Fig. 2 ▶). To prepare heavy-atom derivatives, crystals were soaked at 293 K in reservoir solutions without DTT and EDTA that contained either 1 mM neodymium chloride (for 20 h) or 0.1 mM methylmercuric acetate (for 1 h).
Figure 2.
Crystal of 6HisTobN138–hCaf1 complex. The scale bar is 300 µm in length.
4. Preliminary X-ray analysis
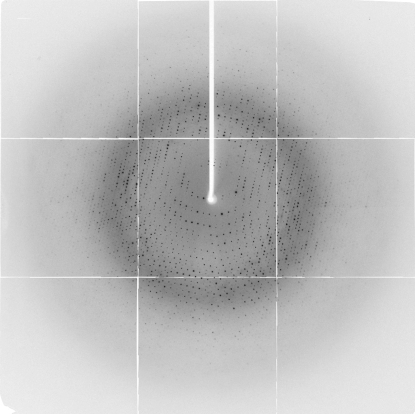
All diffraction data for the 6HisTobN138–Caf1 complex were collected at 100 K using synchrotron radiation with a PX210 CCD detector (Oxford) at the Osaka University beamline BL44XU in SPring-8. Prior to data collection, the crystal was cryoprotected by incubation for 5 min in reservoir solution containing 15% PEG 4000 and 30% glycerol. After soaking, the crystals were mounted in cryoloops (Hampton) and frozen in liquid nitrogen. Diffraction data were processed using the program MOSFLM (Leslie, 1992 ▶) and intensities were scaled using SCALA from the CCP4 program suite (Collaborative Computational Project, Number 4, 1994 ▶) and HKL-2000 (Otwinowski & Minor, 1997 ▶; Fig. 3 ▶). The diffraction data statistics are shown in Table 1 ▶. The crystal belonged to the tetragonal space group I422, with unit-cell parameters a = b = 150.9, c = 113.9 Å. The acceptable range of the volume-to-weight ratio (V M) value (Matthews, 1968 ▶) indicates that the crystal contains one heterodimer per asymmetric unit (the V M value is 3.16 Å3 Da−1). The solvent content of the crystal was estimated as 61%. The phases were determined by the multiple isomorphous replacement method using crystals of heavy-atom derivatives and SeMet-labelled protein. The crystal structure was recently determined and will be described elsewhere (PDB code 2d5r).
Figure 3.
Diffraction pattern of 6HisTobN138–hCaf1.
Table 1. Data-collection statistics.
Values in parentheses are for the last shell.
| Native | NdCl3 soak | Methylmercuric acetate soak | SeMet derivative | |
|---|---|---|---|---|
| Wavelength (Å) | 1.0000 | 1.0000 | 1.0000 | 1.0000 |
| Temperature (K) | 100 | 100 | 100 | 100 |
| Space group | I422 | I422 | I422 | I422 |
| Unit-cell parameters (Å, °) | a = b = 150.9, c = 113.9, α = β = γ = 90 | a = b = 151.9, c = 114.1, α = β = γ = 90 | a = b = 152.2, c = 114.7, α = β = γ = 90 | a = b = 151.5, c = 114.0, α = β = γ = 90 |
| Resolution (Å) | 58–2.6 (2.7–2.6) | 76–3.1 (3.3–3.1) | 48–4.0 (4.2–4.0) | 59–2.7 (2.9–2.7) |
| Measured reflections | 141379 | 87455 | 39768 | 263973 |
| Unique reflections | 19646 | 11705 | 5937 | 18504 |
| Completeness (%) | 97.9 (98.9) | 94.9 (94.9) | 99.9 (99.9) | 99.9 (99.9) |
| I/σ(I) | 5.6 (2.4) | 4.3 (2.3) | 6.7 (5.0) | 3.5 (2.1) |
| Rmerge† | 0.103 (0.268) | 0.132 (0.270) | 0.095 (0.128) | 0.133 (0.227) |
R
merge = 
 , where I
i(hkl) is the observed intensity and
  is the average intensity over symmetry-equivalent measurements.
Acknowledgments
We thank Dr Atsushi Nakagawa, Dr Eiki Yamashita and all the staff of the BL44XU Macromolecule Assemblies of Osaka University for assistance with X-ray data collection. This work was supported by CREST of Japan Science and Technology (JST), Grants-in-Aid for scientific research (15770063 and 16017203) and the National Project on Protein Structural and Functional Analyses from the Ministry of Education, Culture, Sports, Science and Technology (MEXT), Japan.
References
- Bogdan, J. A., Burton, C. A., Pedicord, D. L., Sukovich, D. A., Benfield, P. A., Corjay, M. H., Stoltenborg, J. K. & Dicker, I. B. (1998). Biochem. J.336, 471–481. [DOI] [PMC free article] [PubMed]
- Bradbury, A., Possenti, R., Shooter, E. M. & Tirone, F. (1991). Proc. Natl Acad. Sci. USA, 88, 3353–3357. [DOI] [PMC free article] [PubMed]
- Buanne, P., Corrente, G., Micheli, L., Palena, A., Lavia, P., Spadafora, C., Lakshmana, M. K., Rinaldi, A., Banfi, S., Quarto, M., Bulfone, A. & Tirone, F. (2000). Genomics, 68, 253–263. [DOI] [PubMed]
- Collaborative Computational Project, Number 4 (1994). Acta Cryst. D50, 760–763.
- Ezzeddine, N., Chang, T. C., Zhu, W., Yamashita, A., Chen, C. Y., Zhong, Z., Yamashita, Y., Zheng, D. & Shyu, A. B. (2007). Mol. Cell. Biol.27, 7791–8001. [DOI] [PMC free article] [PubMed]
- Fletcher, B. S., Lim, R. W., Varnum, B. C., Kujubu, D. A., Koski, R. A. & Herschman, H. R. (1991). J. Biol. Chem.266, 14511–14518. [PubMed]
- Guehenneux, F., Duret, L., Callanan, M. B., Bouhas, R., Hayette, S., Berthet, C., Samarut, C., Rimokh, R., Birot, A. M., Wang, Q., Magaud, J. P. & Rouault, J. P. (1997). Leukemia, 11, 370–375. [DOI] [PubMed]
- Ikematsu, N., Yoshida, Y., Tsuzuku, J. K., Ohsugi, M., Onda, M., Hirai, M., Fujimoto, J. & Yamamoto, T. (1999). Oncogene, 18, 7432–7441. [DOI] [PubMed]
- Leslie, A. G. W. (1992). Jnt CCP4/ESF–EACBM Newsl. Protein Crystallogr.26
- Matsuda, S., Rouault, J. P., Magaud, J. P. & Berthet, C. (2001). FEBS Lett.497, 67–72. [DOI] [PubMed]
- Matsuda, S., Tsuzuku, J. K., Ohsugi, M., Yoshida, M., Emi, M., Nakamura, Y., Onda, M., Yoshida, Y., Nishiyama, A. & Yamamoto, T. (1996). Oncogene, 12, 705–713. [PubMed]
- Matthews, B. W. (1968). J. Mol. Biol.33, 491–497. [DOI] [PubMed]
- Meyer, S., Temme, C. & Wahle, E. (2004). Crit. Rev. Biochem. Mol. Biol.39, 197–216. [DOI] [PubMed]
- Otwinowski, Z. & Minor, W. (1997). Methods Enzymol.276, 307–326. [DOI] [PubMed]
- Parker, R. & Song, H. (2004). Nature Struct. Mol. Biol.11, 121–127. [DOI] [PubMed]
- Prévôt, D., Morel, A. P., Voeltzel, T., Rostan, M. C., Rimokh, R., Magaud, J. P. & Corbo, L. (2001). J. Biol. Chem.276, 9640–9648. [DOI] [PubMed]
- Rouault, J. P. et al. (1996). Nature Genet.14, 482–486. [DOI] [PubMed]
- Rouault, J. P., Prévôt, D., Berthet, C., Birot, A. M., Billaud, M., Magaud, J. P. & Corbo, L. (1998). J. Biol. Chem.273, 22563–22569. [DOI] [PubMed]
- Rouault, J. P., Rimokh, R., Tessa, C., Paranhos, G., Ffrench, M., Duret, L., Garoccio, M., Germain, D., Samarut, J. & Magaud, J. P. (1992). EMBO J.11, 1663–1670. [DOI] [PMC free article] [PubMed]
- Tirone, F. (2001). J. Cell. Physiol.187, 155–165. [DOI] [PubMed]
- Yoshida, Y. et al. (2003). Genes Dev.17, 1201–1206. [DOI] [PMC free article] [PubMed]
- Yoshida, Y., Matsuda, S., Ikematsu, N., Tsuzuku, J. K., Inazawa, J., Umemori, H. & Yamamoto, T. (1998). Oncogene, 16, 2687–2693. [DOI] [PubMed]


