

Abstract
The endocannabinoids anandamide and 2-arachidonoylglycerol, as well as several anandamide-related N-acylethanolamines, belong to a family of lipid transmitter regulating fundamental physiological processes, including neurotransmission and neuroinflammation. Their precise quantification in biological matrices can be achieved by gas chromatography/mass spectrometry (GC-MS), but this method typically requires multiple time-consuming purification steps, such as solid-phase extraction followed by HPLC. Here we report a novel solid-phase extraction procedure allowing for single-step and thus higher-throughput purification of endocannabinoids and N-acylethanolamines before GC-MS quantification. We determined the minimal amount of mouse brain tissue required to reliably detect endocannabinoids and N-acylethanolamines when using this approach and provide direct evidence for quantification accuracy by using radioactive and deuterated standards spiked into mouse brain samples. Using this approach we found that mouse brain contains much higher levels of anandamide (> 1 nmol/g of tissue) than previously reported, whereas levels of 2-arachidonoylglycerol and other N-acylethanolamines are well-within the range of previous reports. In addition we show that mouse brain amounts of endocannabinoids and N-acylethanolamines differ depending on animal gender, as well as on whether the tissue was fixed or not. Our study shows that endocannabinoids and N-acylethanolamines levels quantified in mouse brain by GC-MS closely depend on tissue amount and preparation, as well as on animal gender, and that depending on such parameters, anandamide levels could be underestimated.
Keywords: Anandamide, 2-arachidonoylglycerol, levels, AEA, 2-AG, GC/MS
INTRODUCTION
Endocannabinoids (eCBs) are lipid transmitters that act through cannabinoid receptors and regulate many physiological processes, including neurotransmission and neuroinflammation [1]. Several pathological conditions result in the disruption of eCB production and inactivation, and thus a better understanding of this signaling mechanism and how it is affected by pathologies may lead to novel therapeutic approaches [2–4]. Two major classes of eCBs have been identified: the N-acylethanolamines (N-AEs), which include arachidonoylethanolamine (AEA, also known as anandamide), and the glycerolacylesters, which include 2-arachidonoylglycerol (2-AG). The majority of what is known about eCB production, pharmacology and inactivation focuses on AEA and 2-AG.
AEA was identified in 1992 and shown to bind to CB1 and CB2 receptors with high affinity and regulate signal transduction pathways as partial agonist [5;6]. Accordingly its injection into rodents mimics the effects produced by Δ9-tetrahydrocannabinol (THC), which also acts as a partial agonist at CB1 and CB2 receptors [7]. Presence of AEA was demonstrated in intact tissues (including rodent brains) and cells in culture (including neurons, astrocytes and microglial cells in primary culture) [8–12]. The existence of 2-AG has been known for decades, but its role as an eCB was only demonstrated in 1995. Micromolar concentrations of 2-AG are required to activate CB1 and CB2 receptors, where it acts as a full agonist [13;14]. Many cell types, including neurons and glial cells, produce 2-AG [15].
Several laboratories have suggested the existence of additional eCBs, including noladin ether and virodhamine [16;17], but the presence of such lipids in intact tissue has been questioned [18]. In 1993, two other N-AEs, N-homo-γ-linolenoylethanolamine (HEA) and N-docosatetraenoylethanolamine (DEA), were found in brain, and shown to activate CB1 receptors with nanomolar affinity [19;20]. Our laboratory confirmed the presence of both these N-AEs in intact brain and showed that focal cerebral ischemia leads to their accumulation in the diseased tissue [21]. Our laboratory also showed that HEA and DEA are produced in an activity-dependent manner by neurons, astrocytes and microglial cells in culture, and that they stimulate microglial cell migration [11;12]. N-Palmitoylethanolamine (PEA), N-oleoylethanolamine (OEA) and N-stearoylethanolamine (SEA) do not bind cannabinoid receptors and hence are not considered bona fide eCBs. PEA likely activates a CB2-like receptor and PPARα [22;23], OEA activates PPARα and possibly GPR119 [24;25] and SEA activates an unknown receptor [26].
The fact that a wide variety of cell functions are modulated by eCBs and N-AEs, and that pathophysiological conditions lead to differential changes in their amounts has fueled interest in accurately quantifying these lipids in biological matrices. The most widely used methods to quantify these lipids remain GC-MS and LC-MS. However, GC-MS is hampered by painstaking purifications of the biological samples prior to analysis (for example solid-phase chromatography followed by either HPLC or thin layer chromatography [27]; [11;28–31]. Here we report the development of a more efficient purification method that provides samples ready for GC-MS analysis and allows for higher throughput quantification of these lipids. We also determined the minimal amount of tissue required to reliably detect eCBs and N-AEs, and provide direct evidence for the accuracy of this approach by using radioactive and deuterated standards spiked into mouse brain samples. We found that AEA brain levels are 10 fold higher than those previously reported. We also used this method to determine if these lipids were present at comparable amounts in male and female mouse brain, as well as in samples prepared by following different methods.
MATERIALS AND METHODS
Materials
[3H]AEA, [3H]PEA and [3H]2-AG were from American Radiolabeled Chemicals (St Louis, MO) and the National Institute on Drug Abuse drug supply system. CHCl3 and CH3OH were of analytical grade, and ethylacetate and acetone of GC grade and were all from Fisher Scientific (Pittsburgh, PA). Silica (230–400 mesh, 60 Å pore diameter) was from Sigma (St Louis, MO) and bis(trimethylsilyl)trifluoroacetamide (BSTFA) from Alltech (Deerfield, IL). 2-AG and 2H5-2-AG were from Cayman Chemicals (Ann Harbor, MI). N-AEs and 2H4-N-AEs were synthesized in our laboratory as previously described [11].
Tissue preparation
All experiments were carried out according to the guidelines of the Institutional Animal Care and Use Committee of the University of Washington, Seattle. Specifically, mice (C57BL/6.J) were either: 1) deeply anesthetized with 0.5 ml of pentobarbital (25 mg)/ketamine (3.25 mg)/xylazine (0.22 mg) and perfused with PBS, 2) deeply anesthetized with 0.5 ml of pentobarbital (25 mg)/ketamine (3.25 mg)/xylazine (0.22 mg), perfused with PBS followed by paraformaldehyde (4%) or 3) directly decapitated. Skulls were rapidly opened by using surgical scissors, and brains removed and cut along their longitudinal axis. Each half brain was then individually wrapped in aluminum foil and snap-frozen in either liquid nitrogen or on dry ice. Typically less than 90 s elapsed between decapitation and freezing of the tissues. The latter were then stored at −80°C until analysis.
Lipid extraction and purification
Each frozen half brain was weighed, placed into CHCl3 (100 mg/ml, 4°C), homogenized with a tissue grinder (15,000 rpm for 1 min) and sonicated (2 × 10 sec). An aliquot corresponding to the desired amount of tissue in CHCl3 (e.g. 300 μl of homogenate when needing 30 mg of tissue) was added to 10 ml of ice-cold CHCl3 containing deuterated standards (200 pmol of [2H4]AEA, [2H4]DEA, [2H4]HEA, [2H4]OEA, [2H4]PEA, [2H4]SEA and [2H5]2-AG). Folch extraction was performed by adding ice-cold CH3OH (5 ml) and PBS (2.5 ml), yielding the desired 4:2:1 ratio (v/v/v, CHCl3:CH3OH:H2O). The mixture was vigorously shaken and sonicated (5 min at 4°C) for thorough lipid extraction. Centrifugation (5 min at 800 g) was used to separate both phases, and the organic phase was recovered into a glass vial and dried under N2. To accelerate the drying process, we systematically placed samples on a heating plate. Dried organic phases were then reconstituted in 2 ml of CHCl3 by vortexing and kept at room temperature (< 5 min) before solid phase extraction. Solid-phase extraction columns were made in our laboratory by using Pasteur pipettes filled with 0.7 ml of silica-CHCl3 slurry (1:1, v/v). Prior to loading each sample, columns were conditioned with 2 × 2 ml of CHCl3, 2 × 2 ml of CH3OH, and 2 × 2 ml of CHCl3. Samples in CHCl3 (2 × 1 ml) were then loaded onto the columns, followed by 2 ml of CHCl3. eCBs and N-AEs were eluted with 2 ml of ethylacetate: acetone (1:1) (see results for rationale) and eluates dried under N2 and derivatized with BSTFA (50 min at 55°C). After evaporation of excess BSTFA under N2, samples were dissolved in hexane (100 μl) and kept at −20°C until GC-MS analysis.
GC-MS analysis of eCBs and N-AEs
Derivatized samples were dried under N2 and thoroughly re-suspended in hexane (4–6 μl) and injected (split-less mode) into a CP3800 Varian GC (CP-Sil8 CB 30 m silica column) equipped with a capillary injector (1177, 250°C) containing a silanized liner with a carbofrit. Helium (0.5 ml/min) was used as gas carrier. The sequence used for the oven temperature was: 150°C for 1 min followed by a 20°C/min increase up to 300°C, which was held for 5.5 min to allow complete elution of the seven analytes. After 4.5 min, the temperature was then further increased to 350°C (2.5 min) before holding it at 325°C for an additional 10 min, allowing thorough column cleaning. A Varian Saturn 2000 mass spectrometer was coupled to the GC and CH3OH used for ionization (trap temperature was 230°C). For each run, total ion currents were recorded. Hexane (i.e. blank) injections were performed between samples to avoid memory effects.
Calibration curves were generated by subjecting non-deuterated and deuterated standards to the same procedure as the biological samples. Specifically, mixtures of non-deuterated and deuterated eCBs and N-AEs were subjected to Folch extraction and solid-phase purification prior to GC-MS analysis. Ion currents generated by the diagnostic fragments of each lipid (see Table 1 and supplemental material) were determined manually. For N-AEs, diagnostic fragments included TMS derivatives and acylethylamine radicals (see results for rationale). For 2-AG, we added the ion currents generated by the diagnostic fragments of both 2-AG and 1-AG, as described [27;32;33]. Thus, isotope dilution calibration curves were generated by calculating the ratio of ion currents generated by set amounts of each non-deuterated standard (0, 2, 10, 20, 30, and 200 pmol) and 200 pmol of corresponding deuterated standards, followed by linear regression.
Table 1.
Retention times and m/z ratio of each eCBs and N-acylethanolamine measured.
| Compound | Retention time (min) | Ion (m/z) |
|---|---|---|
| [2H4]PEA | 7.38 a, b | 286 |
| PEA | 282 | |
| [2H4]OEA | 8.32 | 312 |
| OEA | 308 | |
| [2H4]SEA | 8.43 | 314 |
| SEA | 310 | |
| [2H4]AEA | 9.14 | 334 |
| AEA | 330 | |
| [2H4]HEA | 9.24 | 336 |
| HEA | 332 | |
| [2H4]PEA | 9.42 | 286; 376; 448 |
| PEA | 282; 372; 444 | |
| [2H4]DEA | 10.30 | 362 |
| DEA | 358 | |
| [2H4]OEA | 10.47 | 312; 402; 474 |
| OEA | 308; 398; 470 | |
| [2H4]SEA | 10.62 | 314; 404; 476 |
| SEA | 310; 400; 472 | |
| [2H5]2-AG | 11.23 | 438 |
| 2-AG | 433 | |
| [2H4]AEA | 11.56 | 334; 424; 496 |
| AEA | 330; 420; 492 | |
| [2H4]HEA | 11.82 | 336; 426; 498 |
| HEA | 332; 422; 494 | |
| [2H4]DEA | 13.56 | 362; 452 |
| DEA | 358; 448 |
The retention times underlined correspond to the N-acylethyl chromatographic peak.
Note that the retention times of labeled compound slightly differs from the retention time of the corresponding deuterated compound due to the isotopic discrimination of the GC.
RESULTS
Before quantifying eCBs and N-AEs amounts in biological matrices by GC-MS, these lipids must be pre-purified. Typically, solid-phase extraction followed by HPLC is used, but HPLC is quite time-consuming since each sample must be run sequentially. Thus we sought to optimize the solid-phase extraction purification step with the goal of obtaining a one-step process affording samples ready for GC/MS analysis. We tested several solvent systems that have a narrower window of solvent polarity and yet still efficiently elute eCBs and N-AEs while eliminating more contaminants. Our previous solvent system was CHCl3:CH3OH (9:1 v/v), with polarity indices (P′) of 4.1 and 5.1, respectively. We chose to replace CHCl3 by ethylacetate since it is more polar (P′ = 4.4). We also replaced CH3OH by acetone since both solvents have the same polarity index but acetone is less toxic and has a lower boiling point and thus evaporates more rapidly. To assess for the amount of eCBs and N-AEs eluted from the silica, we used [3H]AEA, [3H]PEA and [3H]2-AG. As expected, these lipids were not eluted by CHCl3, but were efficiently eluted by either a 9:1 (v/v) mixture of CHCl3:CH3OH, pure CH3OH or pure acetone (Fig. 1). Pure ethylacetate eluted 25–35 % of the N-AEs and 75% of the 2-AG. We then tested 3:1, 1:1, and 1:3 ratios of ethylacetate: acetone (v/v), all of which provided a near complete elution of the lipids. Based on these results, we selected a 1:1 mixture of ethylacetate: acetone. These results show that a narrower window of solvent polarity allows for an efficient one-step purification of eCBs and N-AEs.
Figure 1. Selection of the elution solvent system.

Solutions containing eCBs and N-AEs (200 pmol) and [3H]AEA, [3H]PEA, or [3H]2-AG (6000–8000 dpm) were chloroform extracted (CHCl3: MeOH: PBS 10:5:2.5) and organic layer dried under nitrogen. Residues were transferred on a silica column using 3 ml of CHCl3. Several solvent systems were assayed for their ability to elute analytes from the silica. Results are expressed as percentage of radioactivity added onto the silica and are the mean of 2 to 4 experiments performed in duplicate. Errors bars represent the SEM.
We determined the GC-MS analytical properties (i.e. retention times and fragmentation pattern) of eCBs and N-AEs standards (both non-deuterated and deuterated) subjected to Folch extraction followed by our new solid-phase extraction procedure (Fig 2). For each non-deuterated and deuterated N-AE, we found peaks that eluted with shorter retention times, the mass spectra of which corresponded to N-acylethyl radicals (Fig 2C and Table 1). For example, the predominant peaks for AEA and [2H4]AEA eluted at 11.56 min and are preceded by peaks eluting at 9.14 min with m/z of 330 and 334 (from AEA and [2H4]AEA, respectively). These earlier peaks were also present when standards were directly injected into the GC/MS and thus do not represent a fragmentation artifact occurring during Folch extraction or our new solid-phase extraction procedure (Fig. 2A). Considering this result, and to increase the accuracy of our quantification method, we opted to include these peaks when analyzing N-AEs. Table 1 shows the fragments that we selected when analyzing each peak. For example, three fragments were selected for the PEA-TMS peak that migrated at 9.42 min: m/z values of 282 ([M+H-90]+ (i.e. ion produced by the loss of TMS alcohol), m/z values of 372 ([M+H]+ i.e. protonated PEA-TMS), and m/z values of 444 (i.e. the double TMS PEA adduct). Using these parameters, we found linear calibration curves, indicating that increasing amounts of non-deuterated standards mixed with a set amount of corresponding deuterated standard yield a linear increase in signal ratios (supplementary data). Thus our new analytical approach provides accurate eCB and N-AE quantification capability.
Figure 2. Representative chromatograms showing the seven analytes.

Representative total ion currents spectra of direct injection of non-deuterated and deuterated standards (A), column ethylacetate: acetone eluate (B), non-deuterated and deuterated standards after Folch extraction and solid-phase purification (C), and mouse brain lipid extract following Folch extraction and solid-phase purification (D).
Next we determined the amount of mouse brain tissue that is required to reliably quantify all seven eCBs and N-AEs using this improved method and isotope dilution. Indeed, the deuterated standards used for isotope dilution always contain a small amount of non-deuterated standard (typically a few percent) and thus we wanted to determine the amount of mouse brain tissue required to generate a ratio that is statistically greater than the ratio obtained with deuterated standards alone. To do so, we homogenized mouse brains in chloroform, sampled increasing amount of tissue (i.e. 3, 10, 20 and 30 mg), and purified and analyzed them by GC/MS. We found that 10 mg of brain gave a 2-AG/[2H5]2-AG ratio that was statistically greater than the ratio obtained with standard alone, while 30 mg of brain was required for the N-AEs/[2H4]N-AEs ratios to be statistically greater from the ratios obtained with corresponding N-AE standards alone (Fig. 3A). This result indicates that 30 mg of tissue is required to reliably quantify eCBs and N-AEs in mouse brain tissue. When using this approach, we found much higher levels of anandamide (1.08 nmol/g) than previously reported, while levels of 2-AG and other N-AEs were well-within the range of previous reports (Fig 4). Our results indicate that 30 mg of mouse brain tissue is necessary to enable efficient quantification of anandamide.
Figure 3. A. Influence of brain homogenate amounts on the N-AEs/[2H4]N-AEs and 2-AG/[2H5]2-AG ratios.
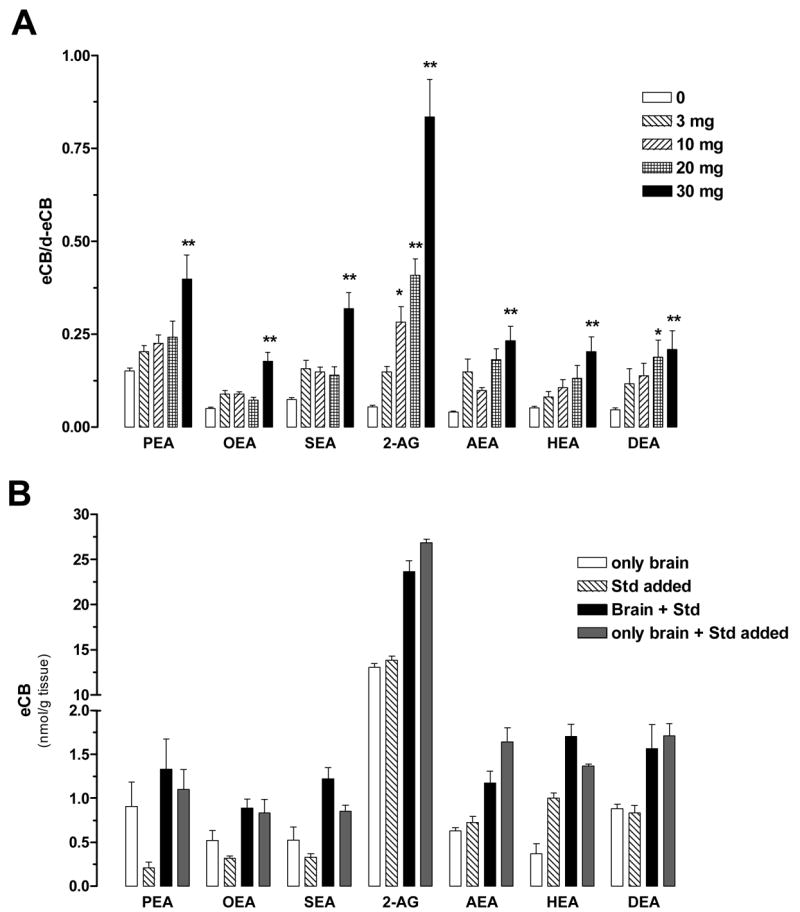
Increasing amounts of mouse brain homogenate (half brains from 3 months old female mice homogenized in CHCl3, 100 mg/ml) were used to determine the non-deuterated/deuterated ratios using 200 pmol of [2H5]2-AG [2H4]N-AEs. Values are the mean ± SEM (n = 5–7 half brains from independent mice, in duplicate). * P<0.05 and ** P<0.01 compared to the ratios obtained in the absence of tissue homogenate (ANOVA one-way, Dunnett’s post test). B. Testing quantification reliability by spiking eCBs and N-AEs standards into mouse brain homogenates. eCBs and N-AEs levels were quantified in mouse brain in the presence (black bars) or absence (open bars) of a set amount of non-deuterated standard (hatched bars). The mathematical sum (gray bars) of the open and hatched bars is not statistically different from the black bars. Values are the mean ± SEM (n = 3–4 half brains from independent mice, in duplicate). (ANOVA one-way, Dunnett’s post test).
Figure 4. Comparison of eCBs and PEA and OEA amounts reported in mouse brain.
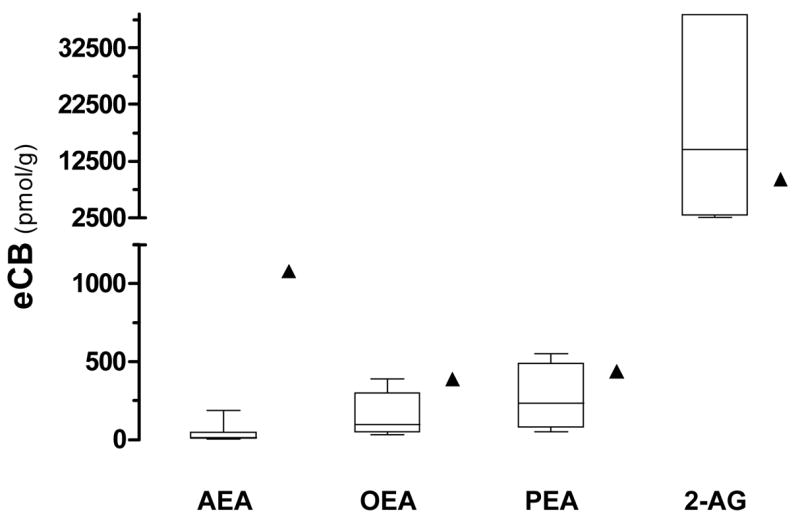
Comparison of AEA, OEA, PEA and 2-AG levels found in this study (▲) with those reported in the literature (median and 25th and 75th percentile) for whole mouse brains.
Two experiments were performed to directly test the reliability of our data. First we tested whether the presence of 30 mg of brain tissue might affect the efficiency by which eCBs and N-AEs are extracted from tissue when using a Folch extraction followed by solid-phase purification. Thus we systematically quantified the radioactivity produced by [3H]AEA, [3H]PEA and [3H]2-AG undergoing extraction and purification either alone or in the presence of 30 mg brain tissue. We found that – independently of the presence of brain tissue – over 97 % of the initial amount of each lipid was recovered after extraction and purification (Table 2). Second we tested whether tissue-derived eCBs and N-AEs spiked with a set amount of standard eCBs and N-AEs equal to the mathematical sum of their amounts quantified independently. Figure 3B shows that this was indeed the case, as the mathematical sum of tissue-derived eCB and N-AEs (open bars) plus a set amount of standards (hatched bars) was calculated (gray bars), and is not different from the levels of eCBs and N-AEs quantified in tissue spiked with these standards (black bars). These results show that our method allows for reliable quantification of eCBs and N-AEs in biological matrices.
Table 2. Open-bed chromatography in the presence of brain homogenate.
Distribution of the [3H]PEA, [3H]AEA, and [3H]2-AG in the different fractions (% of the total radioactivity).
| [3H]PEA | [3H]AEA | [3H]2-AG | ||||
|---|---|---|---|---|---|---|
| Brain homogenate (mg) | 0 | 30 | 0 | 30 | 0 | 30 |
| Flow through (CHCl3; 3mL) | 0.6 ± 0.1 | 0.8 ± 0.2 | 0.4 ± 0.1 | 0.3 ± 0.1 | 0.6 ± 0.1 | 0.4 ± 0.1 |
| Elution (EtoAc-Acetone, 2 mL) | 97.9 ± 0.3 | 97.7 ± 0.4 | 97.3 ± 0.2 | 97.5 ± 0.2 | 97.7 ± 0.4 | 98.0 ± 0.1 |
| Solid phase (SiOH) | 1.5 ± 0.3 | 1.4 ± 0.2 | 2.4 ± 0.1 | 2.2 ± 0.2 | 1.7 ± 0.3 | 1.6 ± 0.1 |
A solution containing the seven eCBs and N-AEs (200 pmol) and [3H]AEA, [3H]PEA, or [3H]2-AG (6000–8000 dpm) was chloroform extracted (CHCl3: CH3OH: PBS 10:5:2.5) in the presence or absence of mouse brain homogenate (30 mg) and the organic layer dried under nitrogen. The residue was transferred on a silica column using 3 ml of CHCl3. The eCBs were eluted using 2 ml of EtoAc-Acetone (1:1). Results for each fraction are expressed as percentage of the total radioactivity present on the column (n= 2 experiments in duplicate). Errors bars represent SEM.
Finally we tested whether the high levels of anandamide detected here could be due to the mode in which mouse brain tissue were prepared. Thus we quantified eCBs and N-AEs amounts in brains of female mice prepared according to four widely used techniques. Group I included mice that were anesthetized, PBS-perfused and their brains snap-frozen in liquid nitrogen. Group II included mice that were anesthetized, PBS-perfused and paraformaldehyde fixed, and their brain frozen in liquid nitrogen. Groups III and IV included mice that were directly decapitated and their brain snap-frozen either in liquid nitrogen (group III) or on dry ice (group IV). N-AEs levels tended to be higher in tissue that was frozen on dry ice and PFA-fixed versus tissue that was frozen in liquid nitrogen and PBS-perfused, but this difference did not reach statistical significance (Fig. 5A). The only clear difference we found was in the amount of 2-AG quantified in PFA-fixed brains, which was 3-fold lower than in non-fixed tissue. We also compared eCBs and N-AEs levels in female and male mouse brains using one protocol of tissue preparation (i.e. decapitation and liquid nitrogen snap-freezing) to determine if animal gender determines eCB and N-AE levels (Fig. 5B). We found that AEA, HEA and DEA levels were 2–3-fold higher in female brain compared to male brain. These results show that different amount in eCBs and N-AEs are found in mouse brain depending on animal gender and the method used to prepare samples.
Figure 5. eCBs and N-AEs levels in mouse brain.
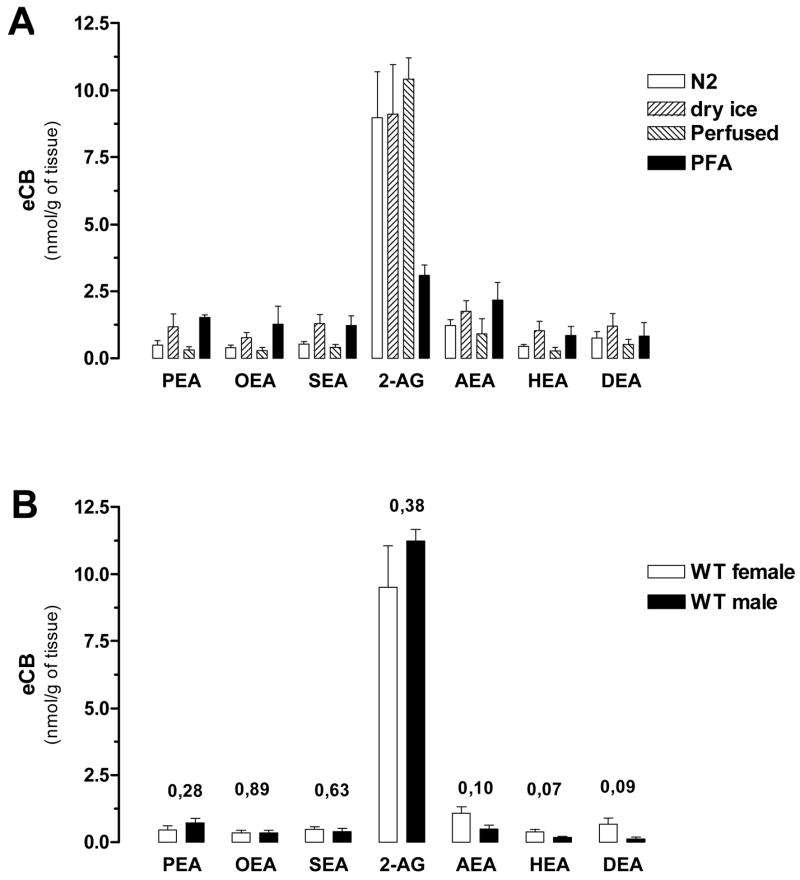
A. Different procedures used to prepare brain tissue affect eCB and N-AE levels. Mice were killed by decapitation and their brains were then either snap frozen in liquid nitrogen (N2) or frozen by placing them on dry ice (dry ice). Other mice were anesthetized and PBS-perfused (perfused) or anesthetized, PBS-perfused and PFA-fixed (PFA). For each condition, 30 mg of tissue homogenate were used for quantifications. Values are the mean ± SEM (n = 4–7 half brains from independent mice, in duplicate). (ANOVA one-way, Dunnett’s post test, P> 0.05). B. Male and female mice brains were snap frozen in liquid nitrogen and 30 mg of tissue homogenate used for eCBs and N-AEs quantification. Values are mean ± SEM (n = 4–7 half brains from independent mice, in duplicate). (Unpaired t-test, the P values are indicated)
DISCUSSION
GC-MS is commonly used to quantify eCBs and N-AEs in biological matrices. We have improved this method at two levels: we 1) optimized the solid-phase purification step allowing for higher through-put analysis and 2) determined the amount of tissue required to reliably quantify eCBs and N-AEs in mouse brain. We directly tested the reliability of our quantifications by using tritiated and deuterated standards spiked into mouse brain samples. Finally, we found different levels of specific eCBs and N-AEs in mouse brain depending on animal gender and tissue preparation.
The hydrophobic nature of eCBs and N-AEs, as well as their low abundance compared to their respective precursors and degradation products, renders the quantification of these lipid transmitters by GC-MS unreliable when samples are analyzed directly following Folch extraction. Therefore, additional pre-purification steps are commonly used (e.g. solid phase extraction followed by HPLC or TLC). Many laboratories, including ours, routinely use silica gel as first purification step using a CHCl3:CH3OH mixture to elute eCBs and N-AEs from silica gel columns [34], although a recent report showed that reverse-phase extraction is also effective [35]. While a CHCl3:CH3OH mixture completely elutes eCBs and N-AEs from the silica, its wide window of solvent polarity also elutes contaminants, warranting the additional (i.e. HPLC) purification step. Here we identified a 1:1 mixture of ethylacetate: acetone, which has a narrower window of polarity index, as a solvent system achieving complete elution of eCBs and N-AEs while reducing contaminant elution from the silica. Thus this solvent system allows for single-step and thus higher throughput purification of eCBs and N-AEs ready for GC-MS analysis.
When analyzing the chromatogram of standard eCBs and N-AEs that had undergone the extraction and purification procedure, we found additional fragments corresponding to ions produced by the loss of TMS alcohol. It is likely that the high temperature of the GC-MS injector (250°C) leads to loss of the TMS alcohol moiety from the lipids. Thus the ion currents produced by these additional fragments were systematically taken into account when generating calibration curves. To assess if the AEA/[2H4]AEA ratio is affected by the integration of the N-arachidonylethyl peak (see result section and table 1) we compared the ratios obtained for the PBS perfused brains with and without the incorporation of this additional fragment. The ratio value obtained including the N-arachidonylethyl peak (0.196±0.06) was within the same range as the value obtained for the N-arachidonylethanolamine alone (0.201±0.06), indicating that while improving the signal-to-noise ratio, incorporating this fragment in our calculations does not account for the increase in AEA amount measured here when comparing to the literature (Fig 4). Note that GC-MS analysis of strict silica eluate (i.e. without any sample loaded onto it, Fig 2B) did not generate an ion current peak corresponding to the AEA fragment that had loss the TMS moiety, showing that this peak truly comes from AEA.
Thirty milligram of mouse brain tissue is required to reliably quantify N-AEs. To our knowledge this is the first report on the systematic determination of the minimum amount of tissue required to reliably quantify eCBs and N-AEs in mouse brain. When analyzing lower amounts of tissue, the ratio resulting from tissue-derived eCBs and N-AEs and respective deuterated standards is not significantly different from the ratio obtained with deuterated standards alone. Conversely, 2-AG levels are reliably detected using 10 mg of brain tissue, most likely because of its higher amount in brain [27]. We believe that determining the minimal amount of tissue required to measure ratios that are significantly above the signal-to-noise ratios measured with deuterated standards alone enable efficient quantification and improves quantification accuracy. As a matter of fact, when we analyzed either 3 mg or 10 mg of mouse brain tissue, we found 50 pmol/g and 200 pmol/g of AEA, respectively [21;36], whereas here we measured 1.08 nmol/g of AEA when analyzing 30 mg of tissue. To ascertain that the amounts of eCBs and N-AEs measured in 30 mg of mouse brain tissue were indeed accurate, we spiked a set amount of non-deuterated standards to brain homogenates and found that the resulting quantification corresponds to the mathematical sum of eCBs and N-AEs measured in brain plus the actual non-deuterated standards. Although post-mortem accumulation of AEA has been observed [30;37;38], this phenomena is unlikely to be responsible for the higher levels of AEA found here since less than 90 sec elapsed between sacrifice and freezing of the brain. Furthermore, other N-AEs also increase in post-mortem tissue and we found here only AEA levels to be higher. In light of the controls that we performed, we suggest that the higher amounts of mouse brain AEA levels measured here are due to the use of greater amount of tissue (i.e. 30 mg) and reflect more accurately the actual AEA levels than analysis performed with smaller amount of tissue. While many laboratories have reported 10–100 pmol amounts of AEA per gram of tissue (Fig 4), some laboratories have also reported nmol amounts of AEA. For example, Maccarrone and co-workers measured 16 nmol/g of tissue of AEA in whole mouse brain [39]. The same laboratory found similar amounts of AEA and 2-AG (0.2 and 0.1 nmol/g of proteins, respectively) in mouse cortex and hippocampus [40], as well as in human brain tissue [41]. Together with these reports, our results suggest that healthy mouse brain contains nanomolar amounts of anandamide.
Are eCB and N-AE levels in mouse brain comparable when the tissue is prepared according to four commonly used procedures? We found that PEA, OEA, SEA, and HEA levels were higher when brain tissue was frozen on dry ice compared to perfused with PBS and frozen in liquid nitrogen. AEA and DEA levels are similar in all four conditions. A striking result was that 2-AG levels were significantly and selectively reduced in PFA-fixed brains compared to other modes of tissue preparation. The anesthesia procedure is unlikely to account for this difference since the PBS perfused mice received the same anesthesia procedure and yet 2-AG amount in this tissue is not different from mice that were euthanized directly without anesthesia. Note that we had reported the quantification of eCBs in PFA-fixed CNS tissue and can now conclude that the reported 2-AG levels would have been 2–3 fold higher if the tissue had not been fixed with PFA [42]. We also found that brain AEA, HEA and DEA levels had a tendency to be higher (up to 3-fold) in female compared to male, albeit not reaching statistical significance. This result suggests that the effects of estrogen cycle should also be taken account into consideration in female cases.
In summary we describe a new method allowing for higher throughput and reliable GC-MS quantification of anandamide, 2-AG and five pharmacologically active N-AEs. Our controls show that tissue amount and preparation constitute critical parameters when quantifying these lipid transmitters since we found higher levels of AEA in mouse brain than had previously been reported.
Supplementary Material
Acknowledgments
We thank Cong Xu for expert assistance with animal handling and euthanasia. This work was supported by NIH (DA021389 and NS39912).
ABBREVIATIONS
- 2-AG
2-arachidonoylglycerol
- AEA
anandamide or N-arachidonoylethanolamine
- BSTFA
bis(trimethylsilyl)trifluoroacetamide
- DEA
N-docosatetraenoylethanolamine
- eCB
endocannabinoid
- HEA
N-homo-γ-linolenoylethanolamine
- OEA
N-oleoylethanolamine
- P′
polarity index
- PEA
N-palmitoylethanolamine
- SEA
N-stearoylethanolamine
Footnotes
Publisher's Disclaimer: This is a PDF file of an unedited manuscript that has been accepted for publication. As a service to our customers we are providing this early version of the manuscript. The manuscript will undergo copyediting, typesetting, and review of the resulting proof before it is published in its final citable form. Please note that during the production process errors may be discovered which could affect the content, and all legal disclaimers that apply to the journal pertain.
REFERENCE LIST
- 1.Pacher P, Batkai S, Kunos G. The endocannabinoid system as an emerging target of pharmacotherapy. Pharmacol Rev. 2006;58:389–462. doi: 10.1124/pr.58.3.2. [DOI] [PMC free article] [PubMed] [Google Scholar]
- 2.Baker D, Pryce G, Croxford JL, Brown P, Pertwee RG, Makriyannis A, Khanolkar A, Layward L, Fezza F, Bisogno T, Di Marzo V. Endocannabinoids control spasticity in a multiple sclerosis model. FASEB J. 2001;15:300–302. doi: 10.1096/fj.00-0399fje. [DOI] [PubMed] [Google Scholar]
- 3.Marsicano G, Goodenough S, Monory K, Hermann H, Eder M, Cannich A, Azad SC, Cascio MG, Gutierrez SO, van der Stelt M, Lopez-Rodriguez ML, Casanova E, Schutz G, Zieglgansberger W, Di Marzo V, Behl C, Lutz B. CB1 Cannabinoid Receptors and On-Demand Defense Against Excitotoxicity. Science. 2003;302:84–88. doi: 10.1126/science.1088208. [DOI] [PubMed] [Google Scholar]
- 4.Steffens M, Schulze-Bonhage A, Surges R, Feuerstein TJ. Fatty acid amidohydrolase in human neocortex-activity in epileptic and non-epileptic brain tissue and inhibition by putative endocannabinoids. Neurosci Lett. 2005;385:13–17. doi: 10.1016/j.neulet.2005.05.019. [DOI] [PubMed] [Google Scholar]
- 5.Devane WA, Hanus L, Breuer A, Pertwee RG, Stevenson LA, Griffin G, Gibson D, Mandelbaum A, Etinger A, Mechoulam R. Isolation and structure of a brain constituent that binds to the cannabinoid receptor. Science. 1992;258:1946–1949. doi: 10.1126/science.1470919. [DOI] [PubMed] [Google Scholar]
- 6.Felder CC, Joyce KE, Briley EM, Mansouri J, Mackie K, Blond O, Lai Y, Ma AL, Mitchell RL. Comparison of the pharmacology and signal transduction of the human cannabinoid CB1 and CB2 receptors. Mol Pharmacol. 1995;48:443–450. [PubMed] [Google Scholar]
- 7.Felder CC, Veluz JS, Williams HL, Briley EM, Matsuda LA. Cannabinoid agonists stimulate both receptor- and non-receptor-mediated signal transduction pathways in cells transfected with and expressing cannabinoid receptor clones. Mol Pharmacol. 1992;42:838–845. [PubMed] [Google Scholar]
- 8.Di Marzo V, Fontana A, Cadas H, Schinelli S, Cimino G, Schwartz JC, Piomelli D. Formation and inactivation of endogenous cannabinoid anandamide in central neurons. Nature. 1994;372:686–691. doi: 10.1038/372686a0. [DOI] [PubMed] [Google Scholar]
- 9.Giuffrida A, Parsons LH, Kerr TM, Rodriguez dF, Navarro M, Piomelli D. Dopamine activation of endogenous cannabinoid signaling in dorsal striatum. Nat Neurosci. 1999;2:358–363. doi: 10.1038/7268. [DOI] [PubMed] [Google Scholar]
- 10.Walker JM, Huang SM, Strangman NM, Tsou K, Sanudo-Pena MC. Pain modulation by release of the endogenous cannabinoid anandamide. Proc Natl Acad Sci USA. 1999;96:12198–12203. doi: 10.1073/pnas.96.21.12198. [DOI] [PMC free article] [PubMed] [Google Scholar]
- 11.Walter L, Franklin A, Witting A, Moller T, Stella N. Astrocytes in Culture Produce Anandamide and Other Acylethanolamides. J Biol Chem. 2002;277:20869–20876. doi: 10.1074/jbc.M110813200. [DOI] [PubMed] [Google Scholar]
- 12.Walter L, Franklin A, Witting A, Wade C, Xie Y, Kunos G, Mackie K, Stella N. Nonpsychotropic cannabinoid receptors regulate microglial cell migration. J Neurosci. 2003;23:1398–1405. doi: 10.1523/JNEUROSCI.23-04-01398.2003. [DOI] [PMC free article] [PubMed] [Google Scholar]
- 13.Mechoulam R, Ben Shabat S, Hanus L, Ligumsky M, Kaminski NE, Schatz AR, Gopher A, Almog S, Martin BR, Compton DR. Identification of an endogenous 2-monoglyceride, present in canine gut, that binds to cannabinoid receptors. Biochem Pharmacol. 1995;50:83–90. doi: 10.1016/0006-2952(95)00109-d. [DOI] [PubMed] [Google Scholar]
- 14.Sugiura T, Kondo S, Sukagawa A, Nakane S, Shinoda A, Itoh K, Yamashita A, Waku K. 2-Arachidonoylgylcerol: A Possible Endogenous Cannabinoid Receptor Ligand in Brain. Biochem Biophys Res Commun. 1995;215:89–97. doi: 10.1006/bbrc.1995.2437. [DOI] [PubMed] [Google Scholar]
- 15.Stella N. Cannabinoid signaling in glial cells. Glia. 2004;48:267–277. doi: 10.1002/glia.20084. [DOI] [PubMed] [Google Scholar]
- 16.Hanus L, Abu-Lafi S, Fride E, Breuer A, Vogel Z, Shalev DE, Kustanovich I, Mechoulam R. 2-arachidonyl glyceryl ether, an endogenous agonist of the cannabinoid CB1 receptor. Proc Natl Acad Sci USA. 2001;98:3662–3665. doi: 10.1073/pnas.061029898. [DOI] [PMC free article] [PubMed] [Google Scholar]
- 17.Porter AC, Sauer JM, Knierman MD, Becker GW, Berna MJ, Bao J, Nomikos GG, Carter P, Bymaster FP, Leese AB, Felder CC. Characterization of a Novel Endocannabinoid, Virodhamine, with Antagonist Activity at the CB1 Receptor. J Pharmacol Exp Ther. 2002;301:1020–1024. doi: 10.1124/jpet.301.3.1020. [DOI] [PubMed] [Google Scholar]
- 18.Oka S, Tsuchie A, Tokumura A, Muramatsu M, Suhara Y, Takayama H, Waku K, Sugiura T. Ether-linked analogue of 2-arachidonoylglycerol (noladin ether) was not detected in the brains of various mammalian species. J Neurochem. 2003;85:1374–1381. doi: 10.1046/j.1471-4159.2003.01804.x. [DOI] [PubMed] [Google Scholar]
- 19.Hanus L, Gopher A, Almog S, Mechoulam R. Two new unsaturated fatty acid ethanolamides in brain that bind to the cannabinoid receptor. J Med Chem. 1993;36:3032–3034. doi: 10.1021/jm00072a026. [DOI] [PubMed] [Google Scholar]
- 20.Pertwee R, Griffin G, Hanus L, Mechoulam R. Effects of two endogenous fatty acid ethanolamides on mouse vasa deferentia. Eur J Pharmacol. 1994;259:115–120. doi: 10.1016/0014-2999(94)90499-5. [DOI] [PubMed] [Google Scholar]
- 21.Franklin A, Parmentier-Batteur S, Walter L, Greenberg DA, Stella N. Palmitoylethanolamide increases after focal cerebral ischemia and potentiates microglial cell motility. J Neurosci. 2003;23:7767–7775. doi: 10.1523/JNEUROSCI.23-21-07767.2003. [DOI] [PMC free article] [PubMed] [Google Scholar]
- 22.Calignano A, La Rana G, Giuffrida A, Piomelli D. Control of pain initiation by endogenous cannabinoids. Nature. 1998;394:277–281. doi: 10.1038/28393. [DOI] [PubMed] [Google Scholar]
- 23.Lo Verme J, Fu J, Astarita G, La Rana G, Russo R, Calignano A, Piomelli D. The nuclear receptor peroxisome proliferator-activated receptor-alpha mediates the anti-inflammatory actions of palmitoylethanolamide. Mol Pharmacol. 2005;67:15–19. doi: 10.1124/mol.104.006353. [DOI] [PubMed] [Google Scholar]
- 24.Fu J, Gaetani S, Oveisi F, Lo Verme J, Serrano A, Rodriguez de Fonseca F, Rosengarth A, Luecke H, Di Giacomo B, Tarzia G, Piomelli D. Oleylethanolamide regulates feeding and body weight through activation of the nuclear receptor PPAR-α. Nature. 2003;425:90–93. doi: 10.1038/nature01921. [DOI] [PubMed] [Google Scholar]
- 25.Overton HA, Babbs AJ, Doel SM, Fyfe MC, Gardner LS, Griffin G, Jackson HC, Procter MJ, Rasamison CM, Tang-Christensen M, Widdowson PS, Williams GM, Reynet C. Deorphanization of a G protein-coupled receptor for oleoylethanolamide and its use in the discovery of small-molecule hypophagic agents. Cell Metab. 2006;3:167–175. doi: 10.1016/j.cmet.2006.02.004. [DOI] [PubMed] [Google Scholar]
- 26.Maccarrone M, Pauselli R, Di Rienzo M, Finazzi-Agro A. Binding, degradation and apoptotic activity of stearoylethanolamide in rat C6 glioma cells. Biochem J. 2002;366:137–144. doi: 10.1042/BJ20020438. [DOI] [PMC free article] [PubMed] [Google Scholar]
- 27.Stella N, Schweitzer P, Piomelli D. A second endogenous cannabinoid that modulates long-term potentiation. Nature. 1997;388:773–778. doi: 10.1038/42015. [DOI] [PubMed] [Google Scholar]
- 28.Di Marzo V, Breivogel C, Bisogno T, Melck D, Patrick G, Tao Q, Szallasi A, Razdan RK, Martin BR. Neurobehavioral activity in mice of N-vanillyl-arachidonyl-amide. Eur J Pharmacol. 2000;406:363–374. doi: 10.1016/s0014-2999(00)00687-7. [DOI] [PubMed] [Google Scholar]
- 29.Witting A, Walter L, Wacker J, Moller T, Stella N. P2X7 receptors control 2-arachidonoylglycerol production by microglial cells. Proc Natl Acad Sci USA. 2004;101:3214–3219. doi: 10.1073/pnas.0306707101. [DOI] [PMC free article] [PubMed] [Google Scholar]
- 30.Schmid PC, Krebsbach RJ, Perry SR, Dettmer TM, Maasson JL, Schmid HHO. Occurrence and postmortem generation of anandamide and other long-chain N-acylethanolamines in mammalian brain. FEBS Letters. 1995;375:117–120. doi: 10.1016/0014-5793(95)01194-j. [DOI] [PubMed] [Google Scholar]
- 31.Kondo S, Sugiura T, Kodaka T, Kudo N, Waku K, Tokumura A. Accumulation of various N-acylethanolamines including N-arachidonoylethanolamine (anandamide) in cadmium chloride-administered rat testis. Arch Biochem Biophys. 1998;354:303–310. doi: 10.1006/abbi.1998.0688. [DOI] [PubMed] [Google Scholar]
- 32.Bisogno T, Berrendero F, Ambrosino G, Cebeira M, Ramos JA, Fernandez-Ruiz JJ, Di Marzo V. Brain regional distribution of endocannabinoids: implications for their biosynthesis and biological function. Biochem Biophys Res Commun. 1999;256:377–380. doi: 10.1006/bbrc.1999.0254. [DOI] [PubMed] [Google Scholar]
- 33.Berrendero F, Sepe N, Ramos JA, Di Marzo V, Fernandez-Ruiz JJ. Analysis of cannabinoid receptor binding and mRNA expression and endogenous cannabinoid contents in the developing rat brain during late gestation and early postnatal period. Synapse. 1999;33:181–191. doi: 10.1002/(SICI)1098-2396(19990901)33:3<181::AID-SYN3>3.0.CO;2-R. [DOI] [PubMed] [Google Scholar]
- 34.Fontana A, Di Marzo V, Cadas H, Piomelli D. Analysis of anandamide, an endogenous cannabinoid substance, and of other natural N-acylethanolamines, Prostaglandins. Leukotrienes and Essential Fatty Acids. 1995;53:301–308. doi: 10.1016/0952-3278(95)90130-2. [DOI] [PubMed] [Google Scholar]
- 35.Hardison S, Weintraub ST, Giuffrida A. Quantification of endocannabinoids in rat biological samples by GC/MS: Technical and theoretical considerations. Prostaglandins Other Lipid Mediat. 2006;81:106–112. doi: 10.1016/j.prostaglandins.2006.08.002. [DOI] [PubMed] [Google Scholar]
- 36.Witting A, Chen L, Cudaback E, Straiker A, Walter L, Rickman B, Moller T, Brosnan C, Stella N. Experimental autoimmune encephalomyelitis disrupts endocannabinoid-mediated neuroprotection. Proc Natl Acad Sci USA. 2006;103:6362–6367. doi: 10.1073/pnas.0510418103. [DOI] [PMC free article] [PubMed] [Google Scholar]
- 37.Kempe K, Hsu FF, Bohrer A, Turk J. Isotope Dilution Mass Spectrometric Measurements Indicate That Arachidonylethanolamide, the Proposed Endogenous Ligand of the Cannabinoid Receptor, Accumulates in Rat Brain Tissue Post Mortem but Is Contained at Low Levels in or Is Absent from Fresh Tissue. J Biol Chem. 1996;271:17287–17295. doi: 10.1074/jbc.271.29.17287. [DOI] [PubMed] [Google Scholar]
- 38.Patel S, Carrier EJ, Ho WSV, Rademacher DJ, Cunningham S, Reddy DS, Falck JR, Cravatt BF, Hillard CJ. The postmortal accumulation of brain N-arachidonylethanolamine (anandamide) is dependent upon fatty acid amide hydrolase activity. J Lipid Res. 2005;46:342–349. doi: 10.1194/jlr.M400377-JLR200. [DOI] [PubMed] [Google Scholar]
- 39.Maccarrone M, Bari M, Finazzi-Agro A. Quantification of anandamide content in animal cells and tissues: the normalization makes the difference. Lipids Health Dis. 2002;1:4. doi: 10.1186/1476-511X-1-4. [DOI] [PMC free article] [PubMed] [Google Scholar]
- 40.Maccarrone M, Attina M, Bari M, Cartoni A, Ledent C, Finazzi-Agro A. Anandamide degradation and N-acylethanolamines level in wild-type and CB1 cannabinoid receptor knockout mice of different ages. J Neurochem. 2001;78:339–348. doi: 10.1046/j.1471-4159.2001.00413.x. [DOI] [PubMed] [Google Scholar]
- 41.Maccarrone M, Attina M, Cartoni A, Bari M, Finazzi-Agro A. Gas chromatography-mass spectrometry analysis of endogenous cannabinoids in healthy and tumoral human brain and human cells in culture. J Neurochem. 2001;76:594–601. doi: 10.1046/j.1471-4159.2001.00092.x. [DOI] [PubMed] [Google Scholar]
- 42.Witting A, Weydt P, Hong S, Kliot M, Moller T, Stella N. Endocannabinoids accumulate in spinal cord of SOD1 G93A transgenic mice. J Neurochem. 2004;89:1555–1557. doi: 10.1111/j.1471-4159.2004.02544.x. [DOI] [PubMed] [Google Scholar]
Associated Data
This section collects any data citations, data availability statements, or supplementary materials included in this article.