Abstract
Iron regulatory proteins (IRPs) are cytoplasmic RNA binding proteins that are central components of a sensory and regulatory network that modulates vertebrate iron homeostasis. IRPs regulate iron metabolism by binding to iron responsive element(s) (IREs) in the 5′ or 3′ untranslated region of ferritin or transferrin receptor (TfR) mRNAs. Two IRPs, IRP1 and IRP2, have been identified previously. IRP1 exhibits two mutually exclusive functions as an RNA binding protein or as the cytosolic isoform of aconitase. We demonstrate that the Ba/F3 family of murine pro-B lymphocytes represents the first example of a mammalian cell line that fails to express IRP1 protein or mRNA. First, all of the IRE binding activity in Ba/F3-gp55 cells is attributable to IRP2. Second, synthesis of IRP2, but not of IRP1, is detectable in Ba/F3-gp55 cells. Third, the Ba/F3 family of cells express IRP2 mRNA at a level similar to other murine cell lines, but IRP1 mRNA is not detectable. In the Ba/F3 family of cells, alterations in iron status modulated ferritin biosynthesis and TfR mRNA level over as much as a 20- and 14-fold range, respectively. We conclude that IRP1 is not essential for regulation of ferritin or TfR expression by iron and that IRP2 can act as the sole IRE-dependent mediator of cellular iron homeostasis.
Keywords: iron metabolism, cytosolic aconitase/iron-sulfur protein/RNA binding protein/translational control
Nearly all organisms require iron for viability because of the large number of functions that iron-containing proteins perform. However, the relative insolubility of uncomplexed iron at physiological pH and the propensity of iron to initiate formation of reactive oxygen species raises potential problems regarding its safe and efficient use. Mammals possess a network of proteins that promote the transport, use, and storage of iron (1–4). Diferric transferrin transports iron between tissues and binds to cell surface transferrin receptors (TfR). The diferric transferrin–TfR complex is internalized, resulting in delivery of iron to the cytoplasm and recycling of apo-Tf and TfR to the cell surface. Iron delivered to the cytoplasm is used for synthesis of various iron-containing proteins or is stored in the multisubunit iron storage protein ferritin. The coordinated iron-dependent modulation of TfR and ferritin synthesis performs a key role in iron homeostasis.
Alterations in ferritin and TfR synthesis are linked to cellular iron status through the action of cytosolic RNA binding proteins called iron regulatory proteins (IRPs) (refs. 1–4 and references therein). IRP1 or IRP2 binds to RNA stem-loop structures, termed “iron responsive elements” (IREs), in the 5′ or 3′ untranslated region, respectively, of ferritin and TfR mRNAs. Binding of IRP1 or IRP2 to ferritin or TfR mRNAs has divergent effects on their utilization. When bound to the IRE of ferritin mRNAs, IRPs block translation of the mRNA thereby reducing ferritin synthesis. In contrast, interaction of the binding protein(s) with the multiple IREs in TfR mRNA stabilizes the mRNA against degradation. At least two other mammalian mRNAs, those encoding erythroid 5-aminolevulinate synthase and mitochondrial aconitase, appear to be targets of IRP action because they contain an IRE in their 5′ untranslated region. The potential for IRP mediation of the synthesis of erythroid 5-aminolevulinate synthase suggests an important role of IRPs in erythroid heme formation and hence whole body iron utilization. The presence of an IRE in the mRNA encoding the tricarboxylic acid cycle enzyme mitochondrial aconitase points to a role for IRPs in modulating mitochondrial utilization of citrate. Taken together, it is clear that IRPs are major modulators of intracellular and interorgan iron metabolism.
The extent to which both IRPs, IRP1 and IRP2, are simultaneously required for regulation of iron metabolism remains to be determined. IRP1 and IRP2 respond to numerous effectors including iron, phorbol ester, NO, and oxidative stress, suggesting that the presence of multiple IRE-binding proteins provides the means to broaden the circumstances under which iron metabolism may be regulated (referenced in refs. 1–4). IRP1 is the most abundant IRE binding protein in nearly all mammalian tissues examined to date (5–7). The relative abundance of the two proteins varies between different tissues, and, when examined by immunoblotting, both IRPs have appeared to be ubiquitously expressed (5, 6). Although this differential pattern of expression of IRPs suggests that variation exists in their function and/or regulation, there are no examples of cell types that clearly lack expression of either binding protein. On the basis of these and other observations, it remains to be determined if both IRPs must be simultaneously expressed to maintain cellular iron homeostasis.
We describe here the identification of a family of murine pro-B lymphocytes, derived from and including Ba/F3 cells, that does not express IRP1 at the protein or mRNA level. Our results indicate that IRP1 is not required for alterations of ferritin and transferrin receptor expression induced by iron. The Ba/F3 family of cells should be of use in further investigations of the individual and interacting roles of these regulatory RNA binding proteins in the modulation of mammalian iron homeostasis.
MATERIALS AND METHODS
Materials.
The following sources were used: [32P]-labeled nucleotides, DuPont NEN; [35S]Met/Cys, ICN; T7 RNA polymerase, New England Biolabs; RQ1 DNase, RNasin, and Taq polymerase, Promega; avian myeloblastosis virus reverse transcriptase, Perkin—Elmer; deoxynucleotide triphosphates, Boehringer Mannheim; 2-mercaptoethanol (2-ME), Fluka; cell culture products and TRIzol, GIBCO/BRL; bovine serums, HyClone; oligonucleotides, Research Genetics (Huntsville, AL); and Sequenase DNA sequencing system, Amersham.
Cell Culture.
Unless noted otherwise, all cell lines were grown as described in each reference. The murine pro-B lymphocyte cell lines Ba/F3, Ba/F3-EpoR, and Ba/F3-gp55 were supplied by Alan D’Andrea (Dana–Farber Cancer Center, Boston) (8). Murine DS 19 erythroleukemia cells were supplied by Shigeru Sassa (Rockefeller University, New York) (9). Rauscher erythroleukemia clone EMSIII was from Arthur Sytkowski (New England Deaconess Hospital, Boston) (10). HepG2 human hepatoma cells were grown in Eagle’s minimal essential medium with 10% fetal calf serum. Rat 2 (RF2) fibroblast, rat FT02B hepatoma, and human HL60 cells were grown as described (11). Hemin or desferal treatments were performed as described (11).
Gel Retardation Analysis.
RNA binding assays using the first 73 nt of the rat l-ferritin IRE were performed by electrophoretic mobility shift assay (EMSA) (11). To enhance viewing of the normal and supershifted RNA/protein complexes, the free RNA band, which migrates well below these complexes, is not shown. Antibody supershift assays were performed by incubating cell lysates with IgG and all of the components required for the RNA binding assay, except RNA, for 2 h at 4°C. Then, [32P]RNA was added at a final concentration of 1 nM. After 10 min, the samples were electrophoresed at 4°C as described (11). The anti-IRP1 IgG used for supershift assays is an antipeptide antibody against residues 130–151 of IRP1. The anti-IRP2 IgG was produced against the region 140–214 of rat IRP2 (see below), which contains the IRP2-specific 73-amino acid loop (5, 12). EMSA results were quantified by cutting out the bound and free RNA bands from dried gels followed by scintillation counting as described (11).
Metabolic Labeling and Antibody Production.
Biosynthesis of IRP1, IRP2, or ferritin subunits was determined by pulse-labeling with [35S]Met/Cys as described (11). Immunoprecipitations used IgG against rat liver ferritin, rat liver IRP1 (11), or residues 140–214 of rat IRP2.
To produce antibodies against IRP2, a cDNA encoding a His-tagged version of residues 140–214 of rat IRP2 was expressed in Escherichia coli and purified by nickel chelate chromatography. New Zealand white rabbits were intradermally injected with 285 μg of peptide in adjuvant followed by booster injections of 100 μg of peptide.
RNA Isolation.
Total cellular RNA was isolated with TRIzol™ and used for RNase protection assays. For reverse transcriptase-PCR (RT-PCR), cytoplasmic RNA was isolated by homogenizing cells in 0.3 M sucrose, 25 mM Hepes (pH 8.0), 3 mM MgCl2, 0.25 mM EGTA, 0.5 mM DTT, and 0.1% Nonidet P-40 using a manually driven Potter Elvehjem homogenizer (Fischer). Homogenates were centrifuged at 9000 × g for 5 min at 4°C. RNA was isolated with TRIzol™ from the top 50% of this postnuclear supernatant.
RT-PCR.
For RT-PCR, 1 μg of cytoplasmic RNA and buffers from Promega were used. After one cycle at 94°C for 3 min, at 55°C for 1 min, and at 72°C for 1 min, the reaction was continued for 44 cycles except the 94°C step was reduced to 1 min. Products were fractionated on 2% agarose TBE (89 mM Tris/89 mM boric acid/2 mM EDTA, pH 8.3) gels. The primers used were:
IRP1.
A murine cDNA was obtained using 5′-GCGGATCCTACTGGGCCATCTTTCGGAT-3′′ (oligo 1) and 5′-GCTCTAGAGGCAGAGAGCTATGAGCGCATTCAC-3′ (oligo 2) to amplify a 297-bp fragment.
IRP2.
A human and rat IRP2 cDNA was made with 5′-GGAATTCCATATGATACAGAATGCACCAAAT-3′ (oligo 3) and 5′-CGGGATCCTCATGTTTCAGGT-TCAGCCAC-3′ (oligo 4) to amplify a 248-bp fragment.
Transferrin Receptor.
A murine cDNA was made with 5′-GAAGATCTTAA-AACTCATTGTCAATATTCC-3′ (oligo 5) and 5′-CGGAATTCTCTGGCTCTCTCACACTCTCTCAG-3′ (oligo 6) to amplify a 188-bp fragment.
All amplified fragments were subcloned and sequenced to confirm their identity. The deduced amino acid sequence between residues 140 and 214 of murine (Ba/F3-gp55) IRP2 matched the sequence of the rat protein at all but one position. Residue 164 of rat IRP2 is a Pro (13). Ba/F3-gp55 cells and murine liver IRP2 have a Ser at this position (results not shown; GenBank accession no. AF016402).
RNase Protection Assays.
RNase protection assays were performed using a kit from Ambion as described (11). [32P]-labeled antisense RNAs were generated using T7 or SP6 RNA polymerases. Glyceraldehyde phosphate dehydrogenase (GAPDH) mRNA was used as the control.
RESULTS
Absence of IRP1 RNA Binding Activity in a Murine Pro-B Lymphocyte Cell Line.
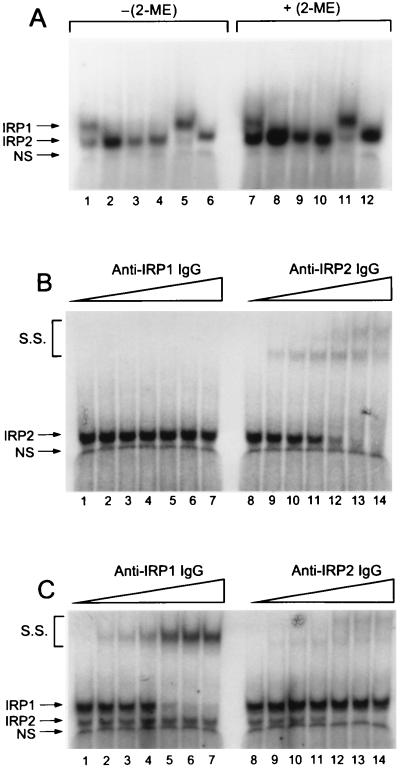
In examining the regulation of IRP function during cell proliferation, we found that the murine Ba/F3 pro-B lymphocyte cell line and its derivatives, Ba/F3-EpoR and Ba/F3-gp55, lacked RNA binding activity that could be attributed to IRP1 when analyzed by EMSA (Fig. 1A, lanes 2–4). Two other murine cell lines, the erythroleukemias DS19 and Rauscher (Fig. 1A, lanes 1 and 5, respectively), contained both IRP1 and IRP2 RNA binding activity as did murine liver (results not shown). Latent forms of both IRPs can be activated to bind RNA in the presence of 2-ME (6, 11, 14). Therefore, we particularly were interested in determining if 2-ME induced the appearance of IRP1 RNA binding activity in the Ba/F3 family of cells. We found that 2-ME stimulated IRE binding activity in all of the cell lines tested but did not result in appearance of IRP1 RNA binding activity in the Ba/F3 family of cells (Fig. 1A, lanes 7–12).
Figure 1.
Comparison of IRE Binding Activity in the Ba/F3 Family of Cells with Murine and Human Cell Lines. (A) EMSA of Rauscher (Lanes 1 and 7), Ba/F3 (Lanes 2 and 8), Ba/F3-EpoR (Lanes 3 and 9), Ba/F3-g55 (Lanes 4 and 10), DS19 (Lanes 5 and 11) & HL60 (Lanes 6 and 12). EMSAs were done in the absence (−2-ME, lanes 1–6) or presence (+2% 2-ME, lanes 7–12) of reductant. (B) Antibody supershift assays were performed using 15 μg of Ba/F3-gp55 lysate protein plus anti-IRP1 IgG (lanes 1–7) or anti-IRP2 IgG (lanes 8–14) as described in Materials and Methods. Lanes: 1 and 8, no IgG; 2 and 9, 0.25 μg; 3 and 10, 0.50 μg; 4 and 11, 1.0 μg; 5 and 12, 5.0 μg; 6 and 13, 10 μg; and 7 and 14, 15 μg. (C) Antibody supershift assays were performed using 1.5 μg of Raucher cell lysate protein plus anti-IRP1 IgG or anti-IRP2 IgG as indicated for B. The RNA/protein complexes formed were IRP1 and IRP2; S.S. refers to the supershifted species formed by binding of IgG to the protein–RNA complex. These data are representative of the results obtained in multiple experiments. Free RNA, which migrated well below the RNA protein complexes and band NS, is not shown in these autoradiograms.
In HL60 cells and other human cell lines, IRP1 and IRP2 comigrate when examined by EMSA (Fig. 1A, lanes 6 and 12; refs. 5, 6, 11). It seemed possible that posttranslational or other modification of murine IRP1 in Ba/F3 cells might cause it to comigrate with IRP2. Therefore, we determined if one or both antibodies that specifically bind either IRP1 or IRP2 could affect the RNA/protein complex formed by Ba/F3 cell extracts. Anti-IRP1 IgG failed to affect the RNA binding activity in lysates of Ba/F3-gp55 cells (Fig. 1B, lanes 1–7). In contrast, anti-IRP2 IgG caused a dose-dependent “supershifting” of the RNA binding activity, ultimately causing a complete shifting of the activity from its normal position (Fig. 1B, compare lanes 8 and 14). A nonspecific complex (NS) was unaffected by either antibody. The free RNA, which migrated well below the NS complex, was not affected by any of the antibodies (results not shown). When we performed supershift assays with lysates of another murine cell line, we found that IRP1 or IRP2 was specifically affected by one, but not both, of the antibodies. Thus, addition of the anti-IRP1 IgG specifically and completely shifted the IRP1 complex of Rauscher cells (Fig. 1C, lanes 1–7). Neither the IRP2 nor the NS complex was affected by the anti-IRP1 IgG. It is important to note that when the anti-IRP2 IgG was added to a lysate of Rauscher cells, only the IRP2 complex was affected (Fig. 1C, lanes 8–14). Thus, in lysates from Rauscher cells, these two antibody preparations demonstrated clear specificity for either IRP1 or IRP2. These observations provided convincing evidence that Ba/F3-gp55 cells contain IRP2 but not IRP1 RNA binding activity.
Synthesis of IRP1 Protein Is Not Detectable in Ba/F3 Cell Lines.
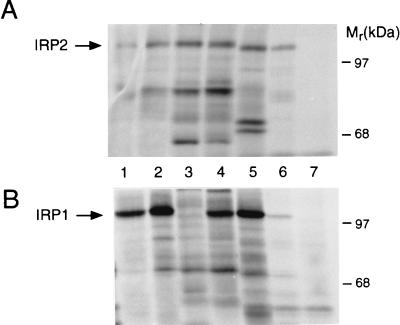
To determine if the lack of IRP1 RNA binding activity in the Ba/F3 family of cells was due to the presence of a form of the binding protein incapable of binding RNA or to the lack of synthesis of the binding protein, we pulse-labeled several different cell lines with [35S]Met/Cys and individually immunoprecipitated each IRP. The cell lines examined were Rat 2, FTO2B, Rauscher, Hep G2, HL60, and Ba/F3-gp55. IRP2 synthesis was detected in all of the cell lines, with Ba/F3-gp55 cells exhibiting a high level of synthesis of the binding protein (Fig. 2A, lanes 1–6). In contrast, IRP1 synthesis was detected in all of the cell lines except for Ba/F3-gp55 cells (Fig. 2B, compare lanes 1, 2, and 4–6 with lane 3). Similar results were obtained with Ba/F3 and Ba/F3-EpoR cells (results not shown).
Figure 2.
IRP1 synthesis is not detectable in the Ba/F3 family of cells. Cells were labeled with [35S]Met/Cys for 30 min (see Materials and Methods). An amount of lysate containing 15 × 106 cpm of trichloroacetic acid-insoluble material was immunoprecipitated with 30 μg of anti-IRP1 or anti-IRP2 IgG. The anti-IRP1 IgG was produced with rat liver IRP1, and the anti-IRP2 IgG was directed against residues 140–214 of IRP2 (see Materials and Methods). Lanes: 1, rat 2 fibroblasts; 2, FTO2B rat hepatoma cells; 3, Ba/F3-gp55 cells; 4, Rauscher murine erythroleukemia cells; 5, human HepG2 hepatoma cells; 6, human HL60 cells; and 7, human HL60 cells immunoprecipitated with preimmune serum. (A) Immunoprecipitation of IRP2. (B) Immunoprecipitation of IRP1. These data are representative of results obtained in multiple experiments. The figure is an autoradiogram.
The mRNA Encoding IRP1 Is Not Detectable in Ba/F3 Cells.
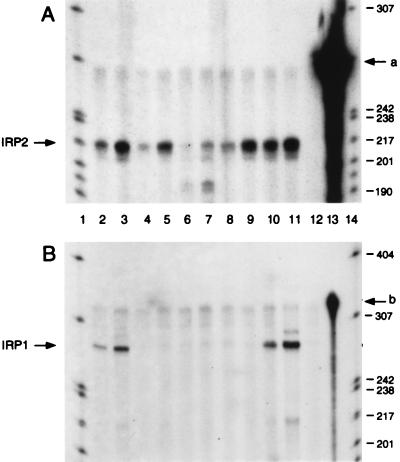
IRP1 mRNA from rat and perhaps other species contains sequences in its 5′ untranslated region, including multiple upstream ORFs, that may mediate translational regulation of its synthesis (15). To determine if the inability to detect murine IRP1 protein in Ba/F3-gp55 cells was due to a translational down-regulation of its expression or to the absence of IRP1 mRNA, we determined if the mRNA was present. First, we examined if IRP2 and IRP1 mRNA could be detected in total RNA from several cell lines using RNase protection assays. IRP2 mRNA was detectable in all cell lines tested including Ba/F3 cells and its derivatives (Fig. 3A, lanes 2–11). IRP1 mRNA was present in both Rauscher and DS19 cell lines (Fig. 3B, lanes 2 and 3 and 10 and 11). However, IRP1 mRNA was not detectable when RNA isolated from any member of the Ba/F3 family of cells was used (Fig. 3B, lanes 4–9). A faint band was present in the lanes from protection assays of Ba/F3 RNA, but it also was seen in the minus RNA control lane (Fig. 3B, compare lanes 4–9 with lane 12).
Figure 3.
Analysis of mRNAs encoding IRP1 or IRP2 in the Ba/F3 family of cells by ribonuclease protection assay. (A and B) Lanes: 1 and 14, end-labeled MspI digest of pBR322; 2 and 3, 10 and 30 μg, respectively, of Rauscher cell RNA; 4 and 5, 10 and 30 μg, respectively, of Ba/F3 cell RNA; 6 and 7, 10 and 30 μg, respectively, of Ba/F3-EpoR cell RNA; 8 and 9, 10 and 30 μg, respectively, of Ba/F3-gp55 cell RNA; 10 and 11, 10 and 30 μg, respectively, of DS19 cell RNA; 12, digested probe control; and 13, undigested probe. (A) IRP2. (B) IRP1. These data are representative of results obtained in multiple experiments.
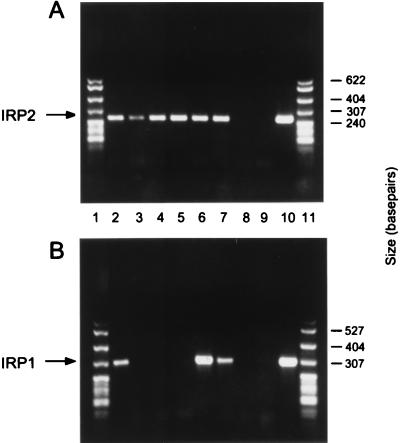
We also determined whether expression of IRP1 and IRP2 mRNAs could be detected using the more sensitive procedure RT-PCR. Oligonucleotide primers for IRP2 mRNA amplified a band of the correct size when cytoplasmic RNA from the Ba/F3 family of cells as well as the Rauscher, DS19, and HL60 cell lines was used (Fig. 4A, lanes 2–7). When primers specific for IRP1 were used, a different result emerged. DS19, Rauscher, and HL60 cells contained IRP1 mRNA (Fig. 4B, lanes 2 and 6 and 7). In clear contrast, IRP1 mRNA could not be detected when RNA from the Ba/F3 family of cells were used (Fig. 4B, lanes 3–5). Taken together, our results using RNase protection assays and RT-PCR revealed that all cell lines tested contained IRP2 mRNA but that only the Ba/F3 cell line, and its derivatives, lacked IRP1 mRNA.
Figure 4.
Analysis of mRNAs encoding IRP1 or IRP2 in the Ba/F3 family of cells by RT-PCR. (A) Cytoplasmic RNA isolated from several cell lines was used to amplify a portion of the IRP2 mRNA. Lanes: 1 and 11, MspI-digested pBR322; 2, Rauscher; 3, Ba/F3; 4, Ba/F3-EpoR; 5, Ba/F3-gp55; 6, DS19; 7, HL60; 8, minus RNA control; 9, minus DNA control; 10, IRP2 plasmid as a positive control. (B) Cytoplasmic RNA isolated from several cell lines was used to amplify a portion of the IRP1 mRNA. Lanes: 1 and 11, MspI-digested pBR322; 2, Rauscher, 3, Ba/F3; 4, Ba/F3-EpoR; 5, Ba/F3-gp55; 6, DS19; 7, HL60; 8, minus RNA control; 9, minus DNA control; and 10, IRP1 plasmid as a positive control. The same RNA samples were used for the RT-PCR reactions shown in A and B. These data are representative of the results obtained in multiple experiments.
Relative Abundance and Iron Regulation of IRP2 RNA Binding Activity in Ba/F3 Cells.
We wished to determine if there was an enhancement of IRP2 RNA binding activity in the Ba/F3 family of cells relative to the amount of IRP2 binding activity in cell lines expressing both binding proteins. Therefore, we performed quantitative EMSAs on all the cell lines. Spontaneous IRP2 RNA binding activity, measured in the absence of 2-ME, was between 40 and 80 fmol/mg protein in the Ba/F3 family of cells. This was comparable to the amount of IRP2 RNA binding activity in DS19 cells but was significantly lower than the activity in Rauscher cells (Table 1). The Ba/F3 family of cells exhibited the lowest total IRE binding activity of the cells lines tested (Table 1).
Table 1.
Comparison of RNA binding activity of IRP1 and IRP2 in several mammalian cell lines
| Cell Line | IRP1, fmol/mg protein | IRP2, fmol/mg protein | Total, fmol/mg protein |
|---|---|---|---|
| Rauscher | 599 ± 63a | 305 ± 55a | 904 ± 114a |
| Ba/F3 | 0c | 58.4 ± 15.2b | 58.4 ± 15.2bc |
| Ba/F3-EpoR | 0c | 64.7 ± 17.7b | 64.7 ± 17.7bc |
| Ba/F3-gp55 | 0c | 57.1 ± 18.0b | 57.1 ± 18.0c |
| DS19 | 81.5 ± 9.4b | 46.7 ± 16.8b | 125.7 ± 14.5b |
| HL60 | — | — | 101.5 ± 15bc |
The RNA binding activity of IRP1 and IRP2 were determined by quantitative EMSA analysis using a [32P]RNA comprised of the first 73 nt of the rat l-ferritin IRE as described in Materials and Methods. Results are mean ± SEM from four independent experiments. Means with different superscripts are significantly different from one another (P < 0.05).
In cell lines containing both IRP1 and IRP2, iron excess can lead to nearly complete loss of IRP2 protein (5, 12, 13). Thus, it was of interest to determine the extent to which iron affected IRP2 RNA binding activity and abundance in the Ba/F3 family of cells. Ba/F3-gp55 cells were treated with normal media or media containing the iron source hemin (50 μM) or the iron chelator desferal (100 μM) for 5 h, and the amount of IRP2 RNA binding activity was determined by quantitative EMSA. Compared with control cells, the level of spontaneous IRE binding activity decreased 58% in hemin-treated cells and increased 67% in desferal-treated cells (Fig. 5A). The reduction in IRP 2 RNA binding activity induced by hemin was not fully recoverable by addition of 2-ME to the lysate (Fig. 5A), which is consistent with the known effect of iron to reduce the concentration of IRP2 protein (12, 13). Compared with control cells, the hemin-dependent decrease in RNA binding by IRP2 was not due to a reduction in synthesis of the protein as detected by pulse-labeling with [35S]Met/Cys (Fig. 5B). However, hemin treatment resulted in a decreased steady state level of IRP2 protein as determined by immunoblotting (Fig. 5C). Our results suggest that iron induces IRP2 degradation in Ba/F3-gp55 cells as it does in other cell types (12, 13).
Figure 5.
Hemin and desferal modulate IRE binding activity and abundance in Ba/F3-gp55 cells. (A) IRP2 RNA binding activity measured without (columns 1–3) or with (columns 4–6) 2% 2-ME. Results are mean ± SEM. for n = 6 independent experiments. (B) The autoradiogram shown here reflects an examination of the effect of hemin or desferal on the incorporation of [35S]Met/Cys into IRP2 in Ba/F3-gp55 cells. 1, control cells; 2; hemin-treated cells; and 3, desferal-treated cells. The arrow indicates the position of migration of IRP2. (C) The level of IRP2 protein was determined by immunoblotting. (A–C) Cells were treated with 50 μM hemin and 100 μM desferal for 5 h. The level of IRP2 was quantified by reflectance densitometry using a PDI Systems (Huntington, NY) computerized densitometer. For each panel, bars not sharing a common superscript are significantly different from one another (P < 0.05).
Iron Regulation of TfR mRNA Abundance and Ferritin Synthesis in Ba/F3-gp55 Cells.
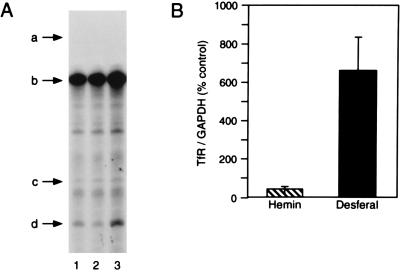
The Ba/F3 family of cells express only IRP2, so it was of interest to determine how alterations in iron status affected TfR mRNA level or ferritin protein biosynthesis. We treated Ba/F3-gp55 cells with either normal media or media containing hemin (20 μM) or desferal (100 μM) for 5 h. Compared with control cells, hemin decreased and desferal increased TfR mRNA levels relative to GAPDH mRNA as detected by RNase protection assay (Fig. 6A, bands d and b, respectively). The level of TfR mRNA was 14-fold higher in desferal-treated cells compared with cells treated with hemin (Fig. 6B).
Figure 6.
Hemin and desferal regulate TfR mRNA abundance in Ba/F3-gp55 cells. (A) RNA isolated from Ba/F3-gp55 cells treated with no additions (lane 1), 20 μM hemin for 5 h (lane 2), or 100 μM desferal (lane 3) for 5 h (lane 3) was used for RNase protection assays. Twenty micrograms of total cellular RNA was used. The arrows refer to the RNA species: a, GAPDH probe; b, protected GAPDH RNA; c, TfR probe; d, protected TfR RNA. (B) Quantitation of the level of TfR mRNA in Ba/F3-gp55 cells treated with hemin or desferal for 5 h. TfR mRNA level was normalized to that of GAPDH. The results shown represent the mean ± SEM for four independent experiments. The results were quantified by densitometry of autoradiograms using a PDI Systems computerized densitometer.
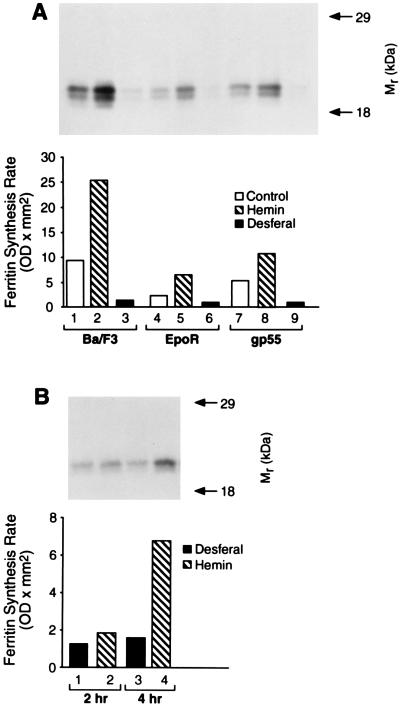
The effect of iron status on ferritin synthesis was measured in the Ba/F3 family of cells by pulse-labeling the cells with [35S]Met/Cys followed by immunoprecipitation with anti-ferritin IgG. Hemin treatment (50 μM) of the Ba/F3 cell lines resulted in a 2- to 3-fold stimulation of ferritin synthesis within 5 h (Fig. 7A). Desferal reduced ferritin synthesis in all of the Ba/F3 cell lines (Fig. 7A). The difference in ferritin synthesis between hemin- and desferal-treated cells varied such that, in BaF3/EpoR, it was 6-fold, and in Ba/F3 cells, it was 20-fold (Fig. 7A).
Figure 7.
Iron regulation of ferritin synthesis in the Ba/F3 family of cells. (A) Ferritin synthesis was determined in Ba/F3 (lanes 1–3), Ba/F3-EpoR (lanes 4–6), or Ba/F3-gp55 cells (lanes 7–9). Each panel contains an autoradiogram above a histogram of the results. (A) The Ba/F3 family of cells was treated with no addition, hemin (50 μM), or desferal (100 μM) for 5 h. (B) Ba/F3-gp55 cells were pretreated with desferal (100 μM) for 3 h before addition of actinomycin D (5 μg/ml) for another 1 h. The media was then changed to contain hemin or desferal as indicated above with the continued presence of actinomycin D for 3.5 h before the cells were pulse-labeled with [35S]Met/Cys for 30 min. The results were quantified by densitometry of autoradiograms using a PDI Systems computerized densitometer.
The ability of hemin to stimulate ferritin synthesis in Ba/F3-gp55 cells was not blocked by actinomycin D, indicating that new RNA synthesis was not necessary for hemin action. Ba/F3-gp55 cells were pretreated with or without desferal for 3 h followed by an additional 1 h in the same media supplemented with actinomycin D (5 μg/ml). The cells were then incubated with hemin (50 μM) or desferal for an another 1.5 or 3.5 h before addition of [35S]Met/Cys for 30 min; actinomycin D was kept in the media during this final 2- or 4-h period. Under these conditions, hemin still stimulated ferritin synthesis in desferal-pretreated cells by 4-fold within 4 h (Fig. 7B, lanes 3 and 4).
DISCUSSION
Two IRPs, IRP1 and IRP2, have been identified in vertebrate species, and it previously appeared that both binding proteins were ubiquitously expressed in mammalian tissues (5, 6). These two regulatory RNA binding proteins were identified based on their specific interaction with IREs as well as their capacity to modulate translation of IRE-containing mRNAs in vitro (referenced in refs. 1–4). Their similar affinity for IREs in natural mRNAs has raised the question of why two IRPs exist. However, two general observations have provided potential explanations for the existence of multiple IRE binding proteins. First, the recent observation of differences in binding specificities for synthetic RNAs has suggested that different RNA targets for the two IRPs might exist in vivo (16, 17). Second, multiple factors, including NO, oxidative stress, and phosphorylation differentially modulate the activity of IRP1 and IRP2, suggesting that the presence of more than one IRE binding protein expands the circumstances under which the IRE-mediated changes in iron metabolism can occur (1–4). Nevertheless, it has remained unresolved whether the presence of both IRPs is absolutely essential for the maintenance of iron homeostasis in mammalian cells.
Our observation that Ba/F3 and its transgenic derivatives, Ba/F3-EpoR and Ba/F3-gp55, do not contain IRP1 protein and mRNA represents the first report of a mammalian cell or tissue that fails to express this IRE binding protein. The lack of IRP1 expression is of interest for several reasons. First, our results indicate that IRP2 can function as the sole iron-dependent regulator of IRE-mediated gene expression. We demonstrated significant effects of iron status on expression of ferritin and TfR in Ba/F3 cells and its derivatives. The iron-dependent changes in ferritin and TfR occurred over a similar period of time and extent of regulation as observed in cells expressing both IRPs (1–4). Furthermore, at least in the case of ferritin, this occurred posttranscriptionally. Thus, IRP2 appears to effectively promote the full range of regulation of ferritin and TfR expression in response to changes in intracellular iron levels in the absence of expression of IRP1. Second, in most cell lines and tissues examined to date, IRP1 expression appears to significantly exceed that of IRP2 (5–7). However, the amount of IRP2 RNA binding activity in Ba/F3 cells is similar to its expression in cell lines that possess IRP1. Thus, our results indicate that the cellular level of IRP2 RNA binding activity is not enhanced when IRP1 RNA binding activity fails to be expressed. In this regard, Ba/F3 cells and their derivatives will be of use in investigating the potential effect of varying the relative abundance of IRP1 and IRP2 RNA binding activity on the regulation of the expression of the various targets of IRP action. Third, on the basis of the lack of IRP1, it appears that the cytosolic aconitase activity is not required for cell viability. However, full verification of this conclusion awaits the results of ongoing experiments concerning direct measurement of aconitase activity in the cytosolic compartment of Ba/F3 cells. Therefore, this cell line may be useful for studies of the role of cytosolic aconitase in intermediary metabolism. Fourth, the absence of IRP1 protein or mRNA in the Ba/F3 line of pro-B cells raises the question as to what is the molecular basis for the IRP1-negative phenotype of these cells. It remains to be determined if the lack of IRP1 expression at the protein and mRNA level is due to a rearrangement or deletion of the IRP1 gene in the Ba/F3 family of cells or if, instead, it reflects a directed modulation of IRP1 gene expression during B cell differentiation. We are currently investigating these alternative possibilities.
Taken together, we conclude that the RNA binding and aconitase activities of IRP1 are not required for the viability of mammalian cells and that IRP2 is fully capable of maintaining cellular iron homeostasis in response to perturbations in intracellular iron levels. Our observation raises the provocative question as to whether or not IRP1 fulfills roles in cellular iron metabolism other than as a regulator of ferritin and TfR expression. Taken together, Ba/F3 cells and their derivatives should be a useful cellular system in which to selectively examine the regulation of IRP2 function as well as for expression of variants of IRP1 in the absence of expression of the wild type protein.
Acknowledgments
We thank Drs. D’Andrea, Sassa, and Sytkowski for cell lines. This work was supported by National Institutes of Health Grant (R29)DK-47219, United States Department of Agriculture Grant 94–37200-0361, the College of Agricultural and Life Sciences Hatch Project 3951 (R.S.E.), United States Department of Agriculture Grant 93–37200-8816 (K.L.S.), and United States Department of Agriculture Grant 96–35200-3273 (K.P.B.).
ABBREVIATIONS
- GAPDH
glyceraldehyde phosphate dehydrogenase
- IRP
iron regulatory protein
- IRE
iron responsive element
- 2-ME
2-mercaptoethanol
- RT-PCR
reverse transcription PCR
- Tf
transferrin
- TfR
transferrin receptor
- EMSA
electrophoretic mobility shift assay
- NS
nonspecific complex
Footnotes
Data deposition: The sequence reported in this paper has been deposited in the GenBank database (accession no. AF016402).
References
- 1.Eisenstein R S, Kennedy M C, Beinert H. In: Metal Ions and Gene Regulation. Silver S, Walden W, editors. New York: Chapman and Hall; 1997. [Google Scholar]
- 2.Hentze M W, Kühn L C. Proc Natl Acad Sci USA. 1996;93:8175–8182. doi: 10.1073/pnas.93.16.8175. [DOI] [PMC free article] [PubMed] [Google Scholar]
- 3.Rouault T A, Klausner R D. J Biol Inorg Chem. 1996;1:494–499. [Google Scholar]
- 4.Theil E C. Biochem J. 1994;304:1–11. doi: 10.1042/bj3040001. [DOI] [PMC free article] [PubMed] [Google Scholar]
- 5.Guo B, Brown F M, Phillips J D, Yu Y, Leibold E A. J Biol Chem. 1995;268:16529–16535. doi: 10.1074/jbc.270.28.16529. [DOI] [PubMed] [Google Scholar]
- 6.Henderson B R, Seiser C, Kühn L C. J Biol Chem. 1993;268:27327–27334. [PubMed] [Google Scholar]
- 7.Rothenberger S, Mullner E W, Kühn L C. Nucleic Acids Res. 1990;18:1175–1179. doi: 10.1093/nar/18.5.1175. [DOI] [PMC free article] [PubMed] [Google Scholar]
- 8.Li J P, D’Andrea A D, Lodish H F, Baltimore D. Nature (London) 1990;343:762–764. doi: 10.1038/343762a0. [DOI] [PubMed] [Google Scholar]
- 9.Fujita H, Yamamoto M, Yamagami T, Hayashi N, Sassa S. J Biol Chem. 1991;266:17494–17502. [PubMed] [Google Scholar]
- 10.Sytkowski A J, Salvado A J, Smith G M, McIntyre C J, deBoth N J. Science. 1980;210:74–76. doi: 10.1126/science.6932101. [DOI] [PubMed] [Google Scholar]
- 11.Schalinske K L, Eisenstein R S. J Biol Chem. 1996;271:7168–7176. doi: 10.1074/jbc.271.12.7168. [DOI] [PubMed] [Google Scholar]
- 12.Iwai K, Klausner R D, Rouault T A. EMBO J. 1995;21:5350–5357. doi: 10.1002/j.1460-2075.1995.tb00219.x. [DOI] [PMC free article] [PubMed] [Google Scholar]
- 13.Guo B, Phillips J D, Yu Y, Leibold E A. J Biol Chem. 1995;270:21645–21651. doi: 10.1074/jbc.270.37.21645. [DOI] [PubMed] [Google Scholar]
- 14.Hentze M W, Rouault T A, Harford J B, Klausner R D. Science. 1989;244:357–359. doi: 10.1126/science.2711187. [DOI] [PubMed] [Google Scholar]
- 15.Yu Y, Radisky E, Leibold E A. J Biol Chem. 1992;267:19005–19010. [PubMed] [Google Scholar]
- 16.Henderson B R, Menotti E, Kühn L C. J Biol Chem. 1996;271:4900–4908. doi: 10.1074/jbc.271.9.4900. [DOI] [PubMed] [Google Scholar]
- 17.Butt J, Kim H-Y, Basilion J P, Cohen S, Iwai K, Philpott C C, Altschul S, Klausner R D, Rouault T A. Proc Natl Acad Sci USA. 1996;93:4345–4349. doi: 10.1073/pnas.93.9.4345. [DOI] [PMC free article] [PubMed] [Google Scholar]


