Abstract
Caveolae form the terminus for a major pathway of intracellular free cholesterol (FC) transport. Caveolin mRNA levels in confluent human skin fibroblasts were up-regulated following increased uptake of low density lipoprotein (LDL) FC. The increase induced by FC was not associated with detectable change in mRNA stability, indicating that caveolin mRNA levels were mediated at the level of gene transcription. A total of 924 bp of 5′ flanking region of the caveolin gene were cloned and sequenced. The promoter sequence included three G+C-rich potential sterol regulatory elements (SREs), a CAAT sequence and a Sp1 consensus sequence. Deletional mutagenesis of individual SRE-like sequences indicated that of these two (at −646 and −395 bp) were essential for the increased transcription rates mediated by LDL-FC, whereas the third was inconsequential. Gel shift analysis of protein binding from nuclear extracts to these caveolin promoter DNA sequences, together with DNase I footprinting, confirmed nucleoprotein binding to the SRE-like elements as part of the transcriptional response to LDL-FC. A supershift obtained with antibody to SRE-binding protein 1 (SPEBP-1) indicated that this protein binds at −395 bp. There was no reaction at −395 bp with anti-Sp1 antibody nor with either antibody at −646 bp. The cysteine protease inhibitor N-acetyl-leu-leu-norleucinal (ALLN), which inhibits SREBP catabolism, superinhibited caveolin mRNA levels regardless of LDL-FC. This finding suggests that SREBP inhibits caveolin gene transcription in contrast to its stimulating effect on other promoters. The findings of this study are consistent with the postulated role for caveolin as a regulator of cellular FC homeostasis in quiescent peripheral cells, and the coordinate regulation by SREBP of FC influx and efflux.
In most peripheral cells, the expression of low density lipoprotein (LDL) receptors is strongly down-regulated, even by the low levels of LDL present in extracellular fluid. As a result, these cells, which internalize free cholesterol (FC) selectively from LDL at a rate proportional to medium LDL concentration, respond to changes in FC content by modifying the rate of FC efflux (1). Plasma membrane caveolae represent a major site from which FC exits the cell for transfer to medium plasma lipoproteins, particularly high density lipoprotein (2, 3).
Caveolae are invaginated cell-surface microdomains (60–80 nm diameter) expressed in many quiescent peripheral cells (4). LDL-FC, internalized through clathrin-coated pits, is transferred in endosomal vesicles to the region of the trans-Golgi network (3). This FC, together with newly synthesized sterol, is returned to the cell surface caveolae by a temperature-sensitive, nocodazole-dependent pathway, probably as part of the FC-glycolipid “rafts” also carrying GPI-anchored proteins (4).
Caveolae contain FC-binding proteins (caveolins) that play a key role in the organization of these organelles at the cell surface. Transformed cells normally contain few if any caveolae, and caveolin is reduced or completely absent (5, 6). Transfection of lymphoblastoma cells with full-length caveolin cDNA was associated with the expression of morphologically authentic caveolae (7). The expression of caveolae at the cell surface is regulated by the FC content of the cell (8). These findings suggest that the expression of caveolin may represent a mechanism by which FC efflux can be modulated in response to changes in cellular cholesterol content. Consistent with this hypothesis, we recently showed that caveolin mRNA levels and FC efflux were up-regulated when medium LDL levels, and the uptake of LDL-FC, were increased (9) Fibroblasts transfected with caveolin antisense DNA also had a reduced rate of FC efflux (9). Finally, incubation of fibroblast monolayers with oxysterols or progesterone, which inhibited FC transport from the trans-Golgi network (4), also reduced equilibrium caveolin mRNA levels (9). In particular, cholesterol epoxides, major oxysterols of minimally modified LDL (10), and human atherosclerotic plaque (11) halved caveolin mRNA levels and FC transport.
Caveolin 1, the largest and first identified product of the caveolin gene family, contains 178 aa and is coded by a 2.2-kb mRNA (12, 13). Neither the sequence nor transcriptional regulation of the 5′ flanking region of the caveolin gene has been described. In the present research, we show that the caveolin gene promoter contains sterol regulatory element (SRE)-like sequences comparable to those identified for several genes promoting cholesterol influx and cholesterol and fatty acid synthesis (14–16). These sequences were found to control the response of caveolin to LDL-derived FC.
MATERIALS AND METHODS
Cell Culture.
Normal human skin fibroblasts were cultured to near confluence in 3.5- or 6-cm dishes in DMEM containing 10% bovine fetal serum before use in individual experiments described below.
Blood was drawn into ice-cooled plastic tubes from normolipemic human volunteers who had fasted overnight. Streptokinase (150 units ml−1, final concentration) was included as anticoagulant (17). Plasma was obtained by centrifugation (2,000 × g, 30 min, 2–4°C). Plasma total cholesterol was 185–210 mg⋅dl−1, and LDL cholesterol was 65–130 mg⋅dl−1. Fibroblast monolayers were transferred to 7% or 80% (vol/vol) human plasma for 3 h before measurement of caveolin mRNA levels (9). This range approximates to the LDL concentration to which different peripheral cells may be exposed in vivo (1). In some experiments, native plasma was replaced by plasma from which LDL had been removed by heparin-agarose affinity chromatography (19). In others, incubation with 7% or 80% plasma was carried out in the presence of 25 μM N-acetyl-leu-leu-norleucinal (ALLN) (Boehringer Mannheim), a cysteine protease inhibitor (20). To determine the turnover rate of caveolin mRNA, actinomycin D (Calbiochem; 2.5 μg⋅ml−1) was added to the incubation medium. mRNA levels were then followed as a function of time.
mRNA Preparation and Northern Blot Analysis.
Total RNA was extracted from fibroblast monolayers that had been rapidly cooled on ice and washed four times with cold PBS (pH 7.4). Total RNA was purified using RNeasy kits (Qiagen, Chatsworth, CA). A total of 4 μg of RNA from each sample was applied to 1% agarose-formaldehyde denaturing gels. The fractionated RNA was transferred to 2 μm pore nylon screens by capillary blotting.
A full-length caveolin cDNA had been previously isolated from a human lung library (9). Random-primed 32P-labeled cDNA was hybridized with the nylon filters at 65°C. Blots were visualized on Kodak X-Omat AR film. The images obtained were digitized using a computerized densitometer (ImageQuant, Molecular Dynamics) normalized to total 28S RNA.
Genomic Sequencing of the Caveolin Promoter Region.
A human blood leukocyte genomic library (CLONTECH) was screened by plaque hydridization using as probe a 32P-labeled 30-bp oligonucleotide antisense to 1–30 bp of the caveolin coding sequence (12). Approximately 106 phage were screened on nylon filters (Amersham). Prehybridization was carried out overnight at 42°C in 50% formamide, 5× standard saline citrate (SSC), 20 mM Tris buffer (pH 7.5), 50% dextran sulfate, and 0.1% SDS. Hybridization was done under the same conditions. The filters were washed with 2× SSC/0.1% SDS at room temperature, then with 1× SSC/0.1% SDS at 37°C, and then at 42°C. Four strongly hybridizing clones were digested with BamHI. A 4-kb digestion product was identified by Southern hybridization. This fragment was recovered from agarose gel following electrophoresis and subcloned into pTZ19. Double-stranded sequencing was performed on the subcloned DNA fragment by the dideoxy method (21) using Sequenase 2.0 DNA sequencing kits (Amersham). The 4-kb fragment was found to include ≈1.0 kb of sequence 5′ to the translational start site, together with the first exon including the 5′ untranslated region, the first intron, the second exon, and part of intron 2.
Primer Extension Analysis.
Transcription start sites were determined by rapid amplification of cDNA ends (RACE). Total RNA was isolated from human skin fibroblasts to synthesize first strand cDNA. A 30-base oligonucleotide was used corresponding to bp 301–330 of the reported cDNA sequence of caveolin. The reaction was carried out in the presence of Superscript 11RT. Synthesized cDNA was tailed using dCTP in the presence of 1.5 mM MgCl2 and 50 mM KCl in 20 mM Tris⋅HCl buffer (pH 8.4) and terminal deoxynucleotidyl transferase. The dC-tailed cDNA was amplified by PCR using a nested gene-specific primer corresponding to bp 121–150 of caveolin cDNA, and an anchor primer (5′-CUACUACUACUAGGCCACGCGTCGACTAGTACGGGIIGGGIIGGGIIG-3′). The amplified DNA product was blunt-ended in the presence of 10 units each of T4 polynucleotide kinase and DNA polymerase I in 10× DNA polymerase buffer (0.5 M Tris⋅HCl, pH 7.5/0.1 M MgCl2/10 mM DTT/0.5 mg⋅ml−1 BSA/200 μM dNTPs) and 1.0 mM ATP. This DNA was then cloned into the SmaI site of a pTZ vector and sequenced using the vector primer.
Plasmid Construction.
The pGL3 luciferase vector (Promega) was used for cloning purposes. A 705-bp BglII restriction fragment corresponding to −781 to −76 bp (relative to the translational start site) was isolated from the 4-kb genomic fragment described above. This fragment was subcloned into the BglII site of the vector. The orientation of the insert was identified by restriction mapping and DNA sequencing.
Mutations of sequences within the promoter were created by deletional mutagenesis on single strand DNA, using the Sculptor mutagenesis kit (Amersham). On the basis of the caveolin gene promoter sequence, three oligonucleotides were designed: (i) from −664 to −620 with bases −646 to −637 deleted, (ii) from −412 to −363 with bases −395 to −386 deleted, and (iii) from −302 to −262 with bases −287 to −278 deleted. These were used to generate the promoter mutants designated Δ1, Δ2, and Δ3, respectively.
Transient Transfection.
Normal skin fibroblasts were plated at a density of 5–8 × 10⁵ cells per 6-cm dish. These cells were transfected with 10 μg per dish of the wild-type (705 bp) caveolin promoter fragment subcloned in the forward and reverse orientation in the luciferase expression vector pGL3. Transfection was carried out in the same way with pGL3 vector containing the mutant caveolin promoters Δ1, Δ2 and Δ3. Cotransfection with pSV-β-galactosidase (Promega) expressing galactosidase under control of the simian virus early promoter served as an internal control. All transfections were carried out using a calcium phosphate coprecipitation method (Profectin; Promega). The dishes were incubated for 16 h at 37°C. The cells were then refed DMEM plus 10% fetal calf serum. After a further 30 h incubation, the cells were changed to DMEM containing 7% or 80% (vol/vol) native human plasma, or plasma-LDL obtained following affinity chromatography (19). After 3 h the cells were washed twice with PBS and then solubilized with lysis buffer (Promega). Cell extracts were centrifuged at 12,000 rpm for 5 min. A total of 20 μl of lysate supernatant was used to measure normalized luciferase activity using the assay system described by the supplier. After 10–20 sec, luciferase activity was determined using an analytical luminometer (Monolight 2010; Analytical Luminescence Laboratories, San Diego).
Electrophoretic Mobility Shift and Supershift Assays.
The assay was carried out using a Bandshift kit from Pharmacia. Nuclear extract was prepared from the purified nuclei of confluent human skin fibroblasts equilibrated in 7% (vol/vol) plasma medium (22). Three oligonucleotide probes were synthesized, designated cav-287, cav-395, and cav-646. Their sequences are as follows: cav-287, 5′-CTGCCCAAGCACCCCAGCGCGGGACAAC-3′; cav-395, 5′-GCGTCGGCTCCCTCCACCCCTGCTGAGATGATGCACTG-3′; and cav-646, 5′-CAAAAGTACACCACAGGCACCCACACAGATTCCTT-3′.
The complementary oligonucleotides were annealed and the probes 32P-end labeled. A total of 0.5 pmol of end-labeled probe and 4 μg of nuclear extract were used in each reaction in a volume of 20 μl. To compete for nonspecific DNA binding protein, 1 μg of polydI⋅dC was included in each reaction. In competition assays, a 200-fold molar excess of unlabeled competitor DNA was added. Homologous double-stranded oligonucleotide was added 5 min before addition of radiolabeled probe. Competition was also carried out using mutant double-stranded oligonucleotides corresponding to cav-287, cav-395, and cav-646. Reaction mixtures were incubated at room temperature for 30 min. For the supershift assays, nuclear extracts were preincubated with antibody for 1 h on ice before addition of other reaction components. Product DNA–protein complexes were resolved from free DNA on 5% (wt/vol) polyacylamide gels in TAE buffer. Gels were dried, and labeled complexes were visualized by autoradiography. In some incubations polyclonal antibodies to nucleoproteins reactive with G+C-rich promoter sequences (SRE-binding protein 1 (SREBP-1) and Sp proteins 1–4 (Santa Cruz Biotechnology) were included with the mixture of oligonucleotide and nuclear extract. Formation of a ternary complex was identified by the supershift of labeled complexes following electrophoresis as described above.
DNase I Footprinting.
A probe encompassing bp −646 to −637 was prepared from the coding strand of the 705-bp fragment obtained by BglII digestion of the wild-type promoter. This fragment was digested with AflIII and the 237-bp BglII–AflIII fragment was isolated. DNA containing the −395 to −386 sequence was prepared by digesting the 705-bp promoter fragment with AflIII. The 350-bp fragment produced was digested with Bsu36I. The 225-bp AflIII–Bsu36I DNA fragment obtained was purified as described above.
A total of 104 cpm of end-labeled probe was incubated with nuclear extract in a reaction volume of 20 μl, which also contained 1 μg of (poly)dI⋅dC, 10% glycerol, 50 mM NaCl, 2.5 mM MgCl2, 0.5 mM DTT, 0.5 mM EDTA, and 0.05% Nonidet P-40 in 10 mM Tris⋅HCl (pH 7.5). After incubation for 30 min at room temperature, 5 μl of a solution containing 5 mM CaCl2/10 mM MgCl2 was added, and then 0.33 unit of freshly diluted DNase I. 0.074 U of DNase I was used for probes without nuclear extract. After 1 min the reaction was stopped with 140 μl of 64 μg⋅ml−1 of yeast RNA, 192 mM Na-acetate, 32 mM EDTA, and 0.14% (wt/vol) SDS. DNA was extracted with chloroform/phenol and precipitated in ethanol. DNA was run out on 8% polyacrylamide sequencing gels containing 7 M urea. Autoradiography was then carried out as described above.
RESULTS
Transcriptional Regulation of the Caveolin Gene.
Actinomycin D inhibits DNA transcription at the level of DNA-dependent RNA polymerase. In the presence of actinomycin (2.5 μg⋅ml−1) caveolin mRNA levels in unstimulated cells decayed as a function of time according to log-linear kinetics. In parallel experiments, caveolin mRNA levels were first up-regulated with 80% (vol/vol) plasma (3 h, 37°C). Actinomycin was then added, and mRNA levels followed over the same time course. In a third series of experiments, the cells were incubated with both cholesterol α-epoxide (50 μM) and 80% (vol/vol) plasma for 3 h at 37°C before addition of actinomycin. The rate of decrease in caveolin mRNA levels in the presence of actinomycin (t½ 8.0 ± 1 h, n = 4) did not differ in activated and baseline cells. After an 8-h incubation at 37°C, caveolin mRNA level (relative to total RNA) was 0.52, 0.48, and 0.47 for baseline cells, for cells activated with 80% (vol/vol) plasma, and for cells activated with 80% (vol/vol) plasma in the presence of 50 μM cholesterol α-epoxide, respectively. These results indicate that the change in equilibrium caveolin mRNA levels following transfer to 80% plasma in the presence or absence of cholesterol α-epoxide was mediated mainly or exclusively at the level of transcription rather than by changes in mRNA stability. This conclusion is consistent with the 3- to 5-fold increase in caveolin mRNA levels previously observed after 3 h in cells transferred from 7% (vol/vol) to 80% (vol/vol) plasma medium (9).
Structure of the Caveolin Gene Promoter Region.
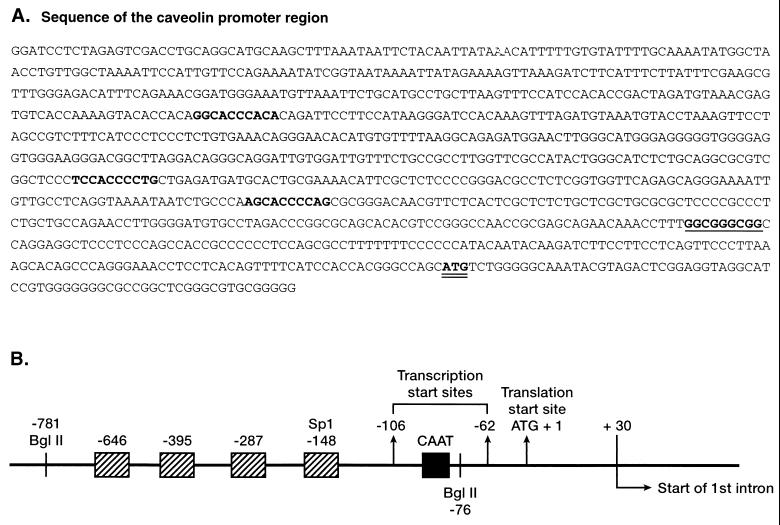
Approximately 1 kb of genomic DNA upstream of the start of exon 1 was sequenced as described under Materials and Methods. Two PCR products 366 and 410 bases in length were detected by RACE and sequenced. The data showed that transcriptional start sites were located 62 and 106 bp upstream of the ATG translational start site. The translational start site was designated as +1 and the two transcriptional start sites as −62 and −106 (Fig. 1). There is a CAAT sequence at −84 bp. A G+C-rich box whose base sequence was identical with that of the consensus for SpI (CCGCCC) was identified at −148. Three sites showing 50–60% homology with the 10-base SRE (ATCACCCCAC) of the LDL receptor protein were present −646, −395, and −287 bp upstream of the translational start site.
Figure 1.
The 5′ flanking region, exon 1, and part of intron 1 of the human caveolin gene sequence. Promoter structure of the caveolin gene. Three potential SREs are in bold face. The Sp1 consensus site is in bold face underlined. The translational ATG start site is shown double underlined.
Deletional Mutagenesis of Caveolin Gene Promoter Sites.
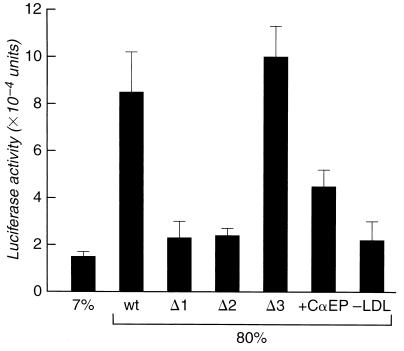
Wild-type promoter DNA, or mutant promoters Δ1, Δ2, or Δ3 were ligated 5′ to the luciferase gene of the expression vector pGL3. The mutants lacked the SRE-like G+C-rich boxes at −646, −395, and −287 bp, respectively (Fig. 1). These constructs were used to transfect human fibroblast monolayers as described. Three hours after transfer of the cells to 80% (vol/vol) plasma medium, luciferase expression was 4- to 6-fold greater compared with that in cells in baseline [7% (vol/vol)] plasma medium (Fig. 2). In contrast, galactosidase activity in cells cotransfected with galactosidase expression vector driven by the simian virus 40 early promoter was unchanged (±7%) under the same conditions. Luciferase expression in cells incubated with 80% (vol/vol) plasma was reduced by 60% in the presence of 50 μM cholesterol α-epoxide. Expression was reduced ≈80% when LDL had been selectively removed from plasma by affinity chromatography.
Figure 2.
Luciferase activity from pGL3 driven by wild-type or mutant caveolin promoters. Δ1, Δ2, and Δ3 refer to promoter mutants from which SRE-like sequences at −646, −395, and −287 bp (Fig. 1) had been deleted. Fibroblast monolayers transiently transfected with wild-type or mutant caveolin promoters (Δ1, Δ2, or Δ3) were incubated with 80% (vol/vol) native human plasma for 3 h at 37°C. Other transfected cells monolayers were incubated with 80% (vol/vol) native plasma in the presence of 50 μM cholesterol α-epoxide (CαEP) or with plasma from which LDL had been removed by heparin affinity chromatography. Values shown are means ± one SD for three to five determinations. Luciferase yield, determined as described, did not differ significantly from baseline values when the wild-type caveolin promoter was inserted in reverse orientation, or in the absence of cell lysate (data not shown).
Deletional mutagenesis of individual SRE-like sequences within the caveolin promoter was carried out as described. Deletion of the SRE-like sequence at −646 bp was associated with an almost complete (≈90%) loss of the stimulation of luciferase expression observed when cells were transfected with vector containing the wild-type promoter (Fig. 2). A comparable loss of activity was observed when the second SRE-like site at −395 bp was deleted. In contrast, when the SRE-like sequence at −287 bp was selectively excised from the promoter, luciferase expression was slightly higher than with the wild-type sequence. Together, these results indicate that the SRE-like sequences at −646 and at −395 bp are both required for the response of the caveolin gene promoter to LDL-derived cholesterol, because deletion of either was associated with an almost complete loss of activity. In contrast, the third site was inactive in this assay.
Gel Shift Analysis of the Caveolin Gene Promoter Region.
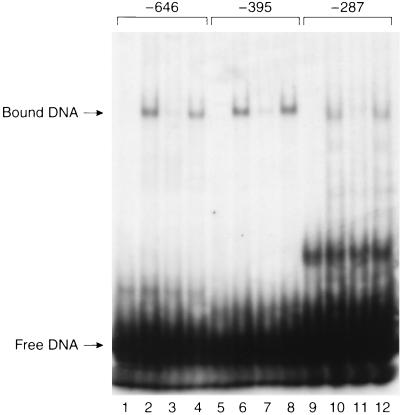
The gel shift experiments were carried out to determine whether nucleoproteins were complexed with the SRE-like elements of the caveolin gene promoter as part of the transcriptional response to LDL. Incubation of nuclear extract with 32P-labeled promoter DNA fragments was carried out as described. Binding of a nucleoprotein to the DNA fragment generates a labeled complex of increased molecular weight (relative to unbound DNA) with a decreased migration rate during electrophoresis. As shown in Fig. 3, the wild-type DNA fragment corresponding to the promoter region surrounding each SRE-like sequence formed a single-shifted DNA–protein complex. A 200-fold excess of unlabeled homologous oligonucleotide competitor displaced nucleoprotein binding to the labeled DNA (Fig. 3). In contrast, inclusion of an equivalent molar concentration of DNA lacking the 10-base SRE-like sequence led to no loss of shifted label. These results confirm that nuclear extract contains nucleoprotein binding to the SRE-like sequences in the caveolin gene promoter region.
Figure 3.
Gel shift assays of wild-type or mutant DNA fragments including the SRE-like sequences at −646, −395, and −287 bp. 32P-labeled synthetic oligonucleotides (cav-646, cav-395, cav-287) were incubated in the absence of nuclear extract (lanes 1, 5, and 9), in the presence of nuclear extract (lanes 2, 6, and 10), with both nuclear extract and cold homologous DNA (lanes 3, 7, and 11) or with both nuclear extract and unlabeled mutant DNA (Δ1, Δ2, or Δ3 for cav-646, cav-395, or cav-287, respectively)(lanes 4, 8, and 12). The bound and unbound DNA fractions were resolved on polyacrylamide gels as described.
DNase I Footprint Analysis.
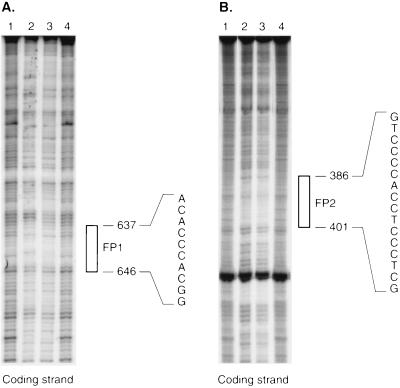
The data obtained using promoter constructs ligated to luciferase indicated the presence of two essential SRE-like sequences at −646 and −395 bp in the 5′ flanking region of the caveolin gene. DNase I protection assays were carried out using end-labeled DNA fragments encompassing either the −646 or the −395 bp site. Fragments were incubated with nuclear extract, and the sequence of protected bases in both cases was determined. In the case of the first site, the protected region extended from −646 to −637 bp (Fig. 4). For the second, it extended between −401 and −386 bp.
Figure 4.
(A) Footprinting of the DNA fragment including SRE-like sequence at −646 bp. (B) Footprinting of the DNA fragment including the SRE-like sequence at −395 bp. Both probes had been end-labeled as described and were incubated in the presence of 5 or 30 μg of nuclear extract (lanes 2 and 3) or without nuclear extract (lanes 1 and 4). Following digestion with DNase I, G+A Maxam–Gilbert sequencing reactions were carried out on the same end-labeled fragments to serve as size markers. The protected regions are shown as FP-1 (corresponding to SRE-like sequence 1) and FP-2 (corresponding to SRE-like sequence 2).
Mechanism of SRE-Mediated Regulation of Caveolin Gene Transcription.
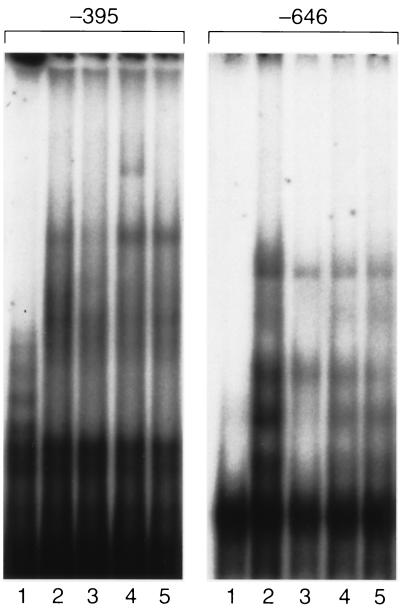
The identity of nucleoproteins binding to the essential caveolin G+C-rich boxes at −646 and −395 bp was further analyzed by incubating each oligonucleotide and nuclear extract from cells equilibrated with 7% (vol/vol) plasma with anti-SREBP-1 or anti-Sp1 antibodies (Fig. 5). Formation of an IgG–nucleoprotein–DNA ternary complex was indicated by the presence of a supershift complex following reaction of the G+C-rich sequence at −395 bp. No complex was detected following addition of antibody against Sp1 -family (Fig. 5) or Sp2, −3 or −4 (data not shown). The G+C-rich sequence at −646 bp did not react with any of the antibodies tested.
Figure 5.
Gel supershift assays of the essential SRE-like sequences at −646 and −395 bp in the presence of antibodies against SREBP-1 and Sp1. Nuclear extract was preincubated with 5 μg of anti-SREBP-1 or anti-Sp1 as described. Lanes: 1, free probe; 2, probe plus 4 μg nuclear extract; 3, probe plus nuclear extract plus cold DNA; 4, probe plus nuclear extract plus anti-SREBP-1; 5, probe plus nuclear extract plus anti-Sp1.
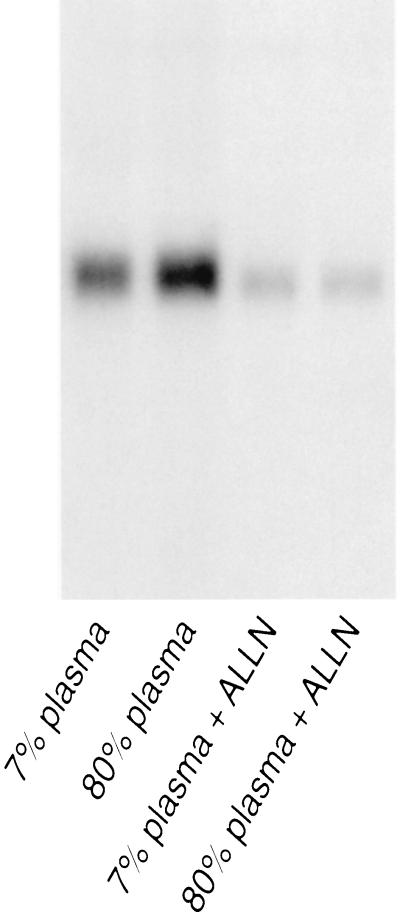
The biologically active, soluble fragment of SREBP promotes the transcription of FC-dependent genes including the LDL receptor protein. Release of soluble SREBP from the endoplasmic reticulum is mediated by the action of two proteases, one sterol-inhibited (20, 23). Soluble SREBP is degraded by a third, cysteine-dependent, protease (20). As a result, LDL cholesterol inhibited LDL receptor gene transcription rates, whereas the cysteine protease inhibitor ALLN superactivated this and other SREBP-dependent genes regardless of the level of FC. In contrast, in the present experiments, ALLN superinhibited the expression of the caveolin gene (Fig. 6). Caveolin mRNA levels were reduced to the same, minimal level, whether the cells were equilibrated in 7% (vol/vol) or 80% (vol/vol) plasma.
Figure 6.
Effects of ALLN on caveolin mRNA levels. Cells in 7% or 80% human plasma–DMEM were incubated (3 h, 37°C) in the presence or absence of 25 μM ALLN. Following incubation, mRNA was extracted and purified as described. Following electrophoresis, Northern blot analysis was carried out using full-length 32P-labeled caveolin cDNA.
DISCUSSION
Many steps of cellular cholesterol metabolism in peripheral cells are mediated by gene products whose equilibrium mRNA levels are FC-sensitive. These steps include reactions catalyzed by the LDL receptor protein, and HMG CoA synthase, HMG CoA reductase, farnesyl pyrophosphate synthase, and squalene oxidase among enzymes of FC synthesis (13–15, 24). Equilibrium mRNA levels for all these proteins are reduced when cellular FC levels increase, often as a result of changes both in transcription rate and in mRNA stability (13). As a result, entry of new FC into regulatory pools within the cell is decreased. In contrast, caveolin mRNA levels are increased under the same conditions, and efflux of FC from the cell is stimulated (9). Nevertheless, the present study shows that these opposite effects may be achieved using the same mechanisms.
Nucleoprotein-mediated regulation of the genes coding for HMG CoA reductase and the LDL receptor protein have been studied in particular detail (20, 23). The transcription factor SREBP-1 (the adipocyte determination and differentiation factor, ADD1) (25) plays a major role. A soluble SREBP fragment released from the endoplasmic reticulum enters the nucleus to bind to one of several SREs in the LDL receptor promoter, stimulating transcription. Transcriptional regulation also involves Sp1, a second nucleoprotein binding to an adjacent site (26). Two essential SRE-like sequences were identified within the caveolin promoter at −395 and −646 bp. The first of these binds SREBP-1, as shown by the supershift obtained when the corresponding antibody was present (Fig. 5) but not Sp1 or other Sp family proteins. No binding of SREBP-1 or Sp proteins to the G+C-rich box at −646 bp could be identified under the same conditions. SREBP-1 and a related transcriptional factor (SREBP-2) are considered equivalent in effect (27). This finding makes it unlikely that other SREBP-related proteins react at −646 bp. Nevertheless, the present study clearly shows that SREBP-1 can bind to the promoter region of caveolin, a gene up-regulated by FC, as well as LDL receptor protein and HMG CoA reductase, genes whose expression is FC-suppressed. Two alternative mechanisms might explain this divergence. FC originating from the selective uptake of FC from LDL might increase the cleavage of SREBP at the endoplasmic reticulum, whereas FC from the endocytosis of intact LDL or cholesterogenesis does the opposite. This result would need identification in the cell (for example by vesicle marker proteins) for FC of different origins. Alternatively FC might have a consistent, inhibitory effect on the cleavage of SREBP; in this case, the mature SREBP fragment would stimulate the transcription of the LDL receptor and reductase and inhibit the transcription of caveolin.
These alternatives were distinguished with the inhibitor ALLN. By the first mechanism, ALLN would activate caveolin transcription; by the second, it would inhibit it. ALLN strongly inhibited caveolin mRNA levels even below the level expressed in cells equilibrated in 7% (vol/vol) plasma. ALLN completely prevented the activation of caveolin mRNA levels observed in 80% (vol/vol) plasma in the absence of inhibitor. This finding suggests that SREBP-1 inhibits caveolin transcription, in contrast to its effects on other FC-sensitive promoters, although effects of ALLN with other nuclear factors may also be important. Further research will be needed to indicate if the up-regulation of caveolin gene transcription in 80% (vol/vol) plasma medium is mediated by the physical displacement of SREBP-1 from the −395 bp site, and the possible roles of other transcription factors and enhancer proteins.
FC-sensitive genes mediated by the SREBP mechanism have so far involved only the input side of regulation, the endocytosis of LDL or the new synthesis of FC. In quiescent cells including confluent fibroblasts, the activity of these pathways is very low, yet cellular FC level was actively regulated at the level of efflux (2, 9). The present study suggests that the SRE/SREBP mechanism, previously shown to regulate FC influx, can regulate both influx and efflux. This finding extends the role of SREBP to quiescent cells, and suggests it may exert coordinate control over all the major pathways of cholesterol homeostasis. Finally, the observation that caveolin expression is regulated by the SRE/SREBP pathway substantiates the role of caveolin and caveolae, recently identified, as a significant element in FC homeostasis.
Acknowledgments
The expert technical assistance of Lolita Evangelista is acknowledged. This research was supported by the National Institutes of Health via Arteriosclerosis Special Center of Research Grants HL 14237 and HL 57976.
ABBREVIATIONS
- LDL
low density lipoprotein
- FC
free cholesterol
- SRE
sterol regulatory element
- SREBP-1
SRE-binding protein 1
- RACE
rapid amplification of cDNA ends
- ALLN
N-acetyl-leu-leu-norleucinal
Footnotes
Data deposition: The sequence reported in this paper has been deposited in the GenBank database (accession number AF019742).
References
- 1.Fielding C J, Fielding P E. J Lipid Res. 1997;38:1503–1521. [PubMed] [Google Scholar]
- 2.Fielding P E, Fielding C J. Biochemistry. 1995;34:14288–14292. doi: 10.1021/bi00044a004. [DOI] [PubMed] [Google Scholar]
- 3.Fielding P E, Fielding C J. Biochemistry. 1996;35:14932–14938. doi: 10.1021/bi9613382. [DOI] [PubMed] [Google Scholar]
- 4.Parton R G, Simons K. Science. 1995;269:1398–1399. doi: 10.1126/science.7660120. [DOI] [PubMed] [Google Scholar]
- 5.Fra A M, Williamson E, Simons K, Parton R G. J Biol Chem. 1994;269:30745–30748. [PubMed] [Google Scholar]
- 6.Koleske A J, Baltimore D, Lisanti M P. Proc Natl Acad Sci USA. 1995;92:1381–1385. doi: 10.1073/pnas.92.5.1381. [DOI] [PMC free article] [PubMed] [Google Scholar]
- 7.Fra A M, Williamson E, Simons K, Parton R G. Proc Natl Acad Sci USA. 1995;92:8655–8659. doi: 10.1073/pnas.92.19.8655. [DOI] [PMC free article] [PubMed] [Google Scholar]
- 8.Smart E J, Ying Y S, Conrad P A, Anderson R G W. J Cell Biol. 1994;127:1185–1197. doi: 10.1083/jcb.127.5.1185. [DOI] [PMC free article] [PubMed] [Google Scholar]
- 9.Fielding C J, Bist A, Fielding P E. Proc Natl Acad Sci USA. 1997;94:3753–3758. doi: 10.1073/pnas.94.8.3753. [DOI] [PMC free article] [PubMed] [Google Scholar]
- 10.Berliner J A, Territo M C, Sevanian A, Ramin S, Kim J A, Bamshad B, Esterson M, Fogelman A M. J Clin Invest. 1990;85:1260–1266. doi: 10.1172/JCI114562. [DOI] [PMC free article] [PubMed] [Google Scholar]
- 11.Hulten L M, Lindmark H, Diczfalusy U, Bjorkem I, Ottosson M, Liu Y, Bondjers G, Wiklund O. J Clin Invest. 1996;97:461–468. doi: 10.1172/JCI118436. [DOI] [PMC free article] [PubMed] [Google Scholar]
- 12.Glenney J R. FEBS Lett. 1992;314:45–48. doi: 10.1016/0014-5793(92)81458-x. [DOI] [PubMed] [Google Scholar]
- 13.Scherer P E, Tang Z, Chun M, Sargiacomo M, Lodish H F, Lisanti M P. J Biol Chem. 1995;270:16395–16401. doi: 10.1074/jbc.270.27.16395. [DOI] [PubMed] [Google Scholar]
- 14.Goldstein J L, Brown M S. Nature (London) 1990;343:425–430. doi: 10.1038/343425a0. [DOI] [PubMed] [Google Scholar]
- 15.Spear D H, Ericsson J, Jackson S M, Edwards P A. J Biol Chem. 1994;269:25212–25218. [PubMed] [Google Scholar]
- 16.Vallett S M, Sanchez H B, Rosenfeld J M, Osborne T F. J Biol Chem. 1996;271:12247–12253. doi: 10.1074/jbc.271.21.12247. [DOI] [PubMed] [Google Scholar]
- 17.Miida T, Fielding C J, Fielding P E. Biochemistry. 1990;29:10469–10474. doi: 10.1021/bi00498a007. [DOI] [PubMed] [Google Scholar]
- 18.Kostner G M. Clin Chem. 1976;22:695. [PubMed] [Google Scholar]
- 19.Fielding P E, Fielding C J. J Biol Chem. 1986;261:5233–5236. [PubMed] [Google Scholar]
- 20.Wang X, Sata R, Brown M S, Hua X, Goldstein J L. Cell. 1994;77:53–62. doi: 10.1016/0092-8674(94)90234-8. [DOI] [PubMed] [Google Scholar]
- 21.Sanger F, Nicklen S, Coulson A R. Proc Natl Acad Sci USA. 1977;74:5463–5468. doi: 10.1073/pnas.74.12.5463. [DOI] [PMC free article] [PubMed] [Google Scholar]
- 22.Schreiber E, Matthias P, Muller M M, Schaffner W. Nucleic Acids Res. 1989;17:6419. doi: 10.1093/nar/17.15.6419. [DOI] [PMC free article] [PubMed] [Google Scholar]
- 23.Sakai J, Duncan E A, Rawson R B, Hua X, Brown M S, Goldstein J L. Cell. 1996;85:1037–1046. doi: 10.1016/s0092-8674(00)81304-5. [DOI] [PubMed] [Google Scholar]
- 24.Guan G, Jiang G, Koch R L, Schechter I. J Biol Chem. 1995;270:21958–21965. doi: 10.1074/jbc.270.37.21958. [DOI] [PubMed] [Google Scholar]
- 25.Tontonoz P, Kim J B, Graves R A, Spiegelman B M. Mol Cell Biol. 1993;13:4753–4759. doi: 10.1128/mcb.13.8.4753. [DOI] [PMC free article] [PubMed] [Google Scholar]
- 26.Dawson P A, Hofmann S L, van der Westhuyzen D R, Sudhof T C, Brown M S, Goldstein J L. J Biol Chem. 1988;263:3372–3379. [PubMed] [Google Scholar]
- 27.Sheng Z, Otani H, Brown M S, Goldstein J L. Proc Natl Acad Sci USA. 1995;92:935–938. doi: 10.1073/pnas.92.4.935. [DOI] [PMC free article] [PubMed] [Google Scholar]


