Abstract
To examine the role of intercellular interaction on cell differentiation and gene expression in human prostate, we separated the two major epithelial cell populations and studied them in isolation and in combination with stromal cells. The epithelial cells were separated by flow cytometry using antibodies against differentially expressed cell-surface markers CD44 and CD57. Basal epithelial cells express CD44, and luminal epithelial cells express CD57. The CD57+ luminal cells are the terminally differentiated secretory cells of the gland that synthesize prostate-specific antigen (PSA). Expression of PSA is regulated by androgen, and PSA mRNA is one of the abundant messages in these cells. We show that PSA expression by the CD57+ cells is abolished after prostate tissue is dispersed by collagenase into single cells. Expression is restored when CD57+ cells are reconstituted with stromal cells. The CD44+ basal cells possess characteristics of stem cells and are the candidate progenitors of luminal cells. Differentiation, as reflected by PSA production, can be detected when CD44+ cells are cocultured with stromal cells. Our studies show that cell–cell interaction plays an important role in prostatic cytodifferentiation and the maintenance of the differentiated state.
Cells of a multicellular organism function as integral units. They interact with their neighbors through diffusible signals and direct contact. The process of homeostasis could not be regulated if this intercellular communication did not exist. For example, the exchange of information helps to balance such vital opposing processes of proliferation and programmed cell death. A defect in this network leads either to the excessive growth of hyperplasia and neoplasia or to the excessive cell death of hypoplasia and atrophy.
In this study, we examine the role of intercellular interaction in prostate tissue. The human prostate is composed of ducts and acini embedded in a stromal matrix of fibroblastic and myofibroblastic cells. In the glandular epithelium are two predominant epithelial cell types - secretory luminal cells and subjacent basal epithelial cells (1, 2). The luminal cells produce prostate-specific antigen (PSA) and prostatic acid phosphatase (PAP), which are secreted into the seminal fluid (3). The biological role of basal cells is not clear. Because they have properties of stem cells (4), they may constitute the reservoir of progenitors that mature into luminal cells. This possibility is best illustrated by animal studies of the effect of androgen on the prostate (5). Castration of male rats typically leads to a rapid involution of the prostate. The gland recovers equally rapidly upon hormone replacement. Androgen removal has a deleterious effect on the luminal cells but a minimal one on the basal cells (6). Because luminal cells are postmitotic and basal cells are not, regeneration of the gland must therefore result from the proliferation of the surviving basal cells (7).
In prostate cancer, malignant cells appear to arise from the transformation of luminal cells. This statement is based on the observation that the cytokeratin-subtype composition of tumor cells matches that of luminal cells and never that of basal cells (8). Furthermore, like luminal cells but unlike basal cells, many cancer cells make PSA and PAP. In our study of differential gene expression in prostate cancer, it became clear that a number of basal-cell markers not normally found in luminal cells were expressed by cancer cells. One such gene is the transcription factor ETS2. ETS2 expression was localized to the basal cells in benign tissue. Expression was also found in samples of high Gleason grade cancer (ref. 9; in situ hybridization localized ETS2 mRNA to the basal cells in benign glands. M. Tenant, A.Y.L., and S. Plymate, unpublished results). The Gleason scale codifies the degree of dedifferentiation exhibited by the cancer glands. This finding suggested to us that poorly differentiated cancers tend to express more basal-cell markers. Some of these basal cell markers have biological properties that confer growth and survival advantage on their host cells. For example, ETS2, functions in cellular proliferation (10); BCL2, another gene expressed in basal cells, has been shown to be associated with suppression of apoptosis in hormone-independent prostate carcinomas (11). That some cancer cells can express basal-cell markers led us to propose a model of prostate cell lineage and cancer progression in which basal cells differentiate to become luminal cells, and cancer or transformed luminal cells dedifferentiate to assume characteristics of basal cells (11). Thus, in normal development, genes such as ETS2 are switched off but are switched on in cancer progression. If basal cells are indeed the progenitor of luminal cells, then progression in prostate cancer would seem to be a reversal of the differentiation pathway. It is therefore important to establish the precise lineage relationship among these cells, as well as to determine the ordered sequence of gene expression in the pathway of normal development and to identify the perturbations in this orderly sequence that leads to cancer. Our strategy is to isolate the different cell populations and to reconstitute them in vitro. For instance, as the epithelial differentiation process is under the influence of stromal elements (12), the isolated basal cells can be cultured with stromal cells under various experimental conditions and the appearance of luminal cells can be monitored by assays that score for PSA secretion.
MATERIALS AND METHODS
Prostate Cells.
Prostate tissue specimens were obtained either from glands resected at radical prostatectomy, from cystoprostatectomy specimens resected for bladder carcinoma, or from organ donors. Only benign samples were used for the isolation of cells. The histologic composition of the samples was assessed by examining frozen sections adjacent to the experimental tissue samples when the specimen was received fresh from the operating room. Samples were dissected using sterile techniques. Only tissue that was superfluous to that required for pathologic characterization was taken. Tissue specimens were rinsed in Hanks’ balanced salt solution (HBSS) and minced with razor blades to about 1 mm3 in size. Ten milliliters of 5% fetal bovine serum–RPMI 1640 medium (BioWhittaker) supplemented with gentamicin and fungicide was added to 1–2 g of minced tissue. Powder collagenase type I (GIBCO/BRL) was added, and the mixture was digested overnight at 37°C with gentle stirring (13). The suspension was passed the next day through a 70-μm mesh nylon filter (Falcon 2350, Becton Dickinson) and then aspirated with a 23-gauge needle. Prostatic epithelial cells were separated from the stromal cells by centrifugation in a Percoll density gradient (14). Two 10-ml iso-osmotic Percoll (Pharmacia) solutions were prepared as follows: (i) ρ = 1.07: 5 ml Percoll, 0.9 ml 1.5 M NaCl, 4.1 ml H2O; and (ii) ρ = 1.035: 2.3 ml Percoll, 0.9 ml 1.5 M NaCl, 6.8 ml H2O. Five milliliters of the less dense solution was placed in a 15-ml conical tube. Five milliliters of the denser solution was then added from the bottom up. One milliliter of cells in HBSS was layered on the gradient and the tubes were centrifuged at 500 × g for 30 min. Epithelial cells banded at the interface of the two Percoll solutions, and stromal cells accumulated at the top of the gradient. Cells were collected with an 18-gauge needle, diluted with HBSS, and pelleted.
Flow Cytometry of Prostate Cells.
Cells were resuspended in 50–100 μl 0.1% BSA–PBS solution, and 20 μl of the appropriate antibody conjugate (50 μg/ml) was added per 106 cells. Cells were also incubated without antibody as a negative control. After a 30-min incubation at room temperature, 1 ml of 0.1% BSA–PBS was added. The suspension was centrifuged and resuspended in 0.5 ml 0.1% BSA–PBS. The samples were analyzed by flow cytometry within 2 h. The cell sorter was developed and originally designed for precision high-speed sorting of human chromosomes and is capable of analyzing and sorting 40,000 cells/s (15). In these experiments, the sort rate was 200–400 cells/s, and the collection vessels were grounded to minimize loss to charge build-up. The sorted cells were collected in PBS. A Coulter machine was also used in some early experiments. αCD44-PE (R-phycoerythrin-conjugated anti-human CD44, clone G44–26, 575-nm peak fluorescence) and αCD57-FITC (fluorescein isothiocyanate-conjugated anti-human CD57, clone NK-1, 530-nm peak fluorescence) were obtained from PharMingen), αCD57-PE (R-PE-conjugated anti-human CD57, clone NK-1) and αCD57-QR (Quantum Red, 670-nm peak fluorescence) were obtained from Sigma. αCD44 is a mouse IgG2b, κ monoclonal, and αCD57 is a mouse IgM, κ monoclonal.
Gene Expression Analysis.
Sorted cells were centrifuged, and 0.5 ml STAT60 solution (Tel-Test “B”, Friendswood, TX) was added for the isolation of RNA. Gene expression of relevant markers in the various samples was determined by reverse transcription–PCR (RT-PCR) on cDNA preparations of the isolated RNA as described (9). PCR products were resolved by agarose gel electrophoresis. Positive results were based on the presence of DNA bands of the expected size. All correct sized PCR products were cloned and their identity verified by DNA sequence determination.
Coculture of Epithelial and Stromal Cells.
Stromal cells collected from a Percoll gradient were cultured and may be treated with mitomycin C (Sigma) at 25 μg (50 μl of a 0.5 mg/ml stock in HBSS) to 1–6 × 10⁷ cells/ml for 20 min at 37°C. The cells were washed with excess HBSS and 5% fetal bovine serum. Cells were mixed and added to a culture dish coated with Matrigel (Becton Dickinson) as described by the manufacturer. Matrigel contains laminin, collagen IV, heparan sulfate proteoglycans, entactin, nidogen, transforming growth factor β, fibroblast growth factor, tissue plasminogen activator, and other growth factors. Phenol red-free RPMI 1640 medium supplemented with 10% fetal bovine serum, 10−8 M 5α-dihydrotestosterone (DHT), and antibiotics was added.
PSA Assay.
Culture media were diluted 1:1 with HBSS, and PSA was assayed by the automated IMx analyzer (Abbott Laboratories). The lowest detectable range was 0.06–0.1 ng/ml.
RESULTS AND DISCUSSION
Methodology to Isolate Prostate Cell Subpopulations.
We developed a procedure to isolate the two major epithelial cell populations by utilizing their differential expression of surface markers CD44 and CD57 and flow cytometry. In the normal prostate, basal cells express CD44 (16), whereas luminal cells express CD57 (17, 18). Collagenase digestion of prostate tissue was used to prepare single cells. The stromal cells were separated from the epithelial cells by Percoll density gradients. Epithelial cells were then sorted on the basis of their fluorescence after staining with antibody conjugates against CD44 or CD57.
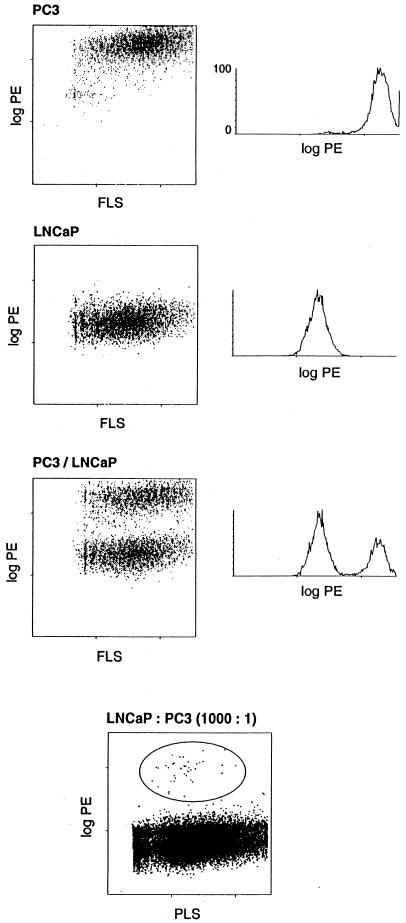
The effect of collagenase digestion on the cell surface antigens and the viability of prostate cells after flow sorting was first examined by using the human prostate cancer cell lines PC3 and LNCaP. The two cell lines were mixed, placed in the collagenase digestion medium overnight, and banded in Percoll. αCD44-PE was used to separate the CD44+ PC3 cells from the CD44− LNCaP cells (19). After sorting, the positive and negative populations (Fig. 1) were cultured separately overnight and examined microscopically the next day. The two cell types can be readily distinguished by their appearance. No appreciable contamination of either culture by the other cell line was observed. It was also possible to sort 103 PC3 cells from 106 LNCaP cells (Fig. 1). These experiments demonstrated the efficiency of the method in isolating specific populations of prostate cells.
Figure 1.
Flow analysis of cultured cells. Mixture of LNCaP and PC3 cells sorted by αCD44-PE. The left diagram of each top three panel shows scatter plots of fluorescence vs. forward light scatter (FLS) intensity. The right diagram displays the histogram along the fluorescence axis. Fluorescence is expressed in arbitrary units that are proportional to the logarithm of the fluorescence intensity. The cells used are identified for each panel. The bottom panel shows a sort of 103 PC3 cells from 106 LNCaP cells. The positive cells are circled and are represented by 45 events among the 52,216 total events (0.08%) scored in this dot plot. PLS is right-angle light scatter.
Flow Analysis of Cells from Benign Prostate Tissue.
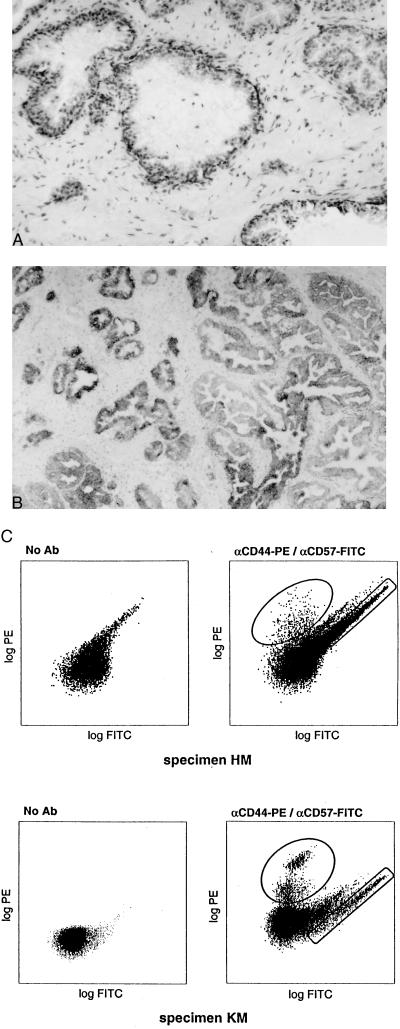
The specificity of the two antibodies for prostate tissue was established by immunohistochemistry as shown in Fig. 2 A and B. αCD44 stained the basal epithelia and, faintly, the stroma; αCD57 stained exclusively the luminal epithelia. In contrast to cultured cell lines, prostate cells prepared from tissue specimens displayed an autofluorescent population comprising 10% or more of the cells (Fig. 2C). The autofluorescence remained after an overnight culture of the single epithelial cells (bottom panels, Fig. 2C). In a two-color sort with αCD44-PE and αCD57-FITC the autofluorescence did not interfere with the CD44+ population but did with the CD57+ one. This drawback was overcome by the use of PE-conjugated αCD57 to sort CD57+ cells. Aliquots of the sorted cells were checked by fluorescence microscopy for purity. In the two-color sorts, no cross-contamination of the green and orange fluorescent populations was observed. Although the absolute yield of the immunoreactive cell populations varied among the different tissue specimens analyzed, their proportion ranged from 5 to 10% of the total sampled. For example, a two-color sort of CD44+ and CD57+ cells from a 3.7-g specimen scored 16,500 CD44+ and 34,000 CD57+ events. A one-color sort of CD57+ cells from a 3-g specimen scored 660,000-positive and 9,200,000-negative events. By extrapolation, we could expect to obtain at least 8 × 10⁶ CD57+ cells from a single 40-g prostate. This amount is adequate for the construction of cell-type-specific cDNA libraries and for tissue reconstitution experiments. The large negative fraction remained unstained even when higher amounts of antibodies were used.
Figure 2.
Tissue specificity of antibodies and flow analysis of prostate cells. Immunohistochemistry of αCD44 (A) and αCD57 (B). The former stains basal epithelial cells and the latter luminal epithelial cells. (C) Flow cytometry of prostate cells prepared from specimens HM and KM. KM cells were cultured overnight prior to flow analysis. Autofluorescence, along the diagonal, was observed when no antibody was used. It overlaps to some extent the FITC population. The PE-positive population is well separated. The circled populations were sorted.
Genes Expressed in CD44+ Prostate Epithelial Cells.
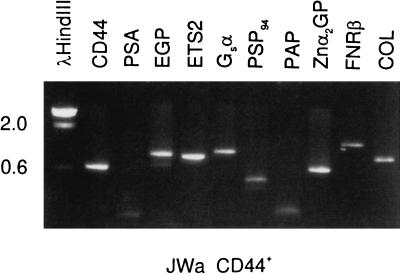
CD44+ epithelial cells were sorted from specimen JWa (16.8 g). Gene expression of these cells was examined by PCR with gene-specific primers. The result is shown in Fig. 3. As expected for basal epithelial cells, these cells were positive for CD44 and epithelial glycoprotein (EGP; ref. 20), the basal cell-specific transcription factor ETS2, collagenase (COL), a target gene for ETS2 (10), guanine nucleotide binding protein (Gsα), prostate secretory protein of 94 amino acid residues (PSP94), zinc glycoprotein (Znα2GP), and fibronectin receptor (FNRβ). References for these genes and others mentioned later can be found in refs. 9 and 11. The sorted CD44+ cells were negative for PSA and PAP.
Figure 3.
Gene-expression analysis of sorted CD44+ epithelial cells. The single cells were stained with αCD44-PE and αCD57-FITC, followed by a 30-min incubation on ice with 7-aminoactinomycin D. A total of 300,000 CD44+ and 160,000 CD57+ events were sorted. About 25% of the unstained population was 7-aminoactinomycin D positive. The CD44+ cells were homogenized and RNA prepared for gene-expression analysis. The selected genes are identified above the ethidium bromide-stained gel containing PCR products resolved by agarose gel electrophoresis. DNA size markers in kb to the left are from λHindIII. Expected PCR product sizes are as follows: CD44, 600 bp, PSA, 460 bp, EGP, 890 bp, ETS2, 850 bp, Gsα, 980 bp, PSP94, 430 bp, PAP, 670 bp, Znα2GP, 590 bp, FNRβ, 1210 bp, and COL, 750 bp. The stained material in the PSA and PAP lanes are nonspecific products <200 bp.
Genes Expressed in CD57+ Prostate Epithelial Cells.
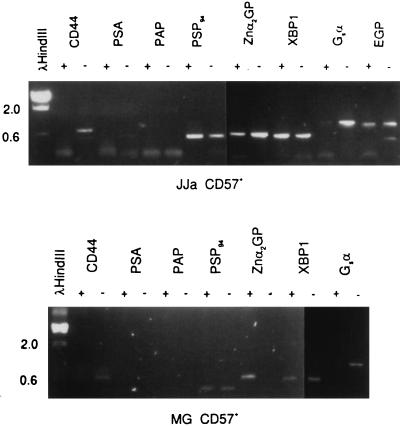
CD57+ cells were sorted from specimens JJa (5.6 g) and MG (2.8 g) and were processed for gene-expression analysis. As expected, both CD57+ populations were negative for CD44 whereas the CD57− populations were positive (Fig. 4). The CD57 gene has not yet been cloned (21). Both CD57+ and CD57− cells were positive for PSP94 and EGP. CD57+ cells were negative for the basal cell-specific ETS2. Of the other markers analyzed, Gsα may be one that is expressed more in the CD44+ cells than the CD57+ cells. Unexpected was the absence of PSA and PAP expression in the CD57+ populations. For PSA, this was confirmed by the low amount of detectable PSA protein in the overnight culture medium of epithelial cells. The PSA concentration was about 0.2 ng/ml in contrast to that in the collagenase digestion media of >1,000 ng/ml (Table 1). Specimens not precultured overnight and assayed before sorting also lacked PSA production (data not shown). There is no evidence that a large proportion of CD57+ cells that do not make PSA existed. Addition of 10−8 M DHT failed to induce PSA expression.
Figure 4.
Gene-expression analysis of sorted CD57+ epithelial cells. Sorted cells from specimens JJa and MG are shown. The epithelial fraction after collagenase digestion was cultured overnight and sorted with αCD57-PE the next day into CD57+ and CD57− populations. A total of 740,000 CD57+ and 680,000 CD57− cells from JJa; and 160,000 CD57+ and 1,050,000 CD57− cells from MG respectively were obtained. Gene markers are identified above the gel lanes; + represents CD57+ cells and − represents CD57− cells. Correct product sizes in bp are as indicated in the legend to Fig. 3; XBP1 is 570 bp. Stained material near the bottom of the gel represent small nonspecific products.
Table 1.
PSA production in culture media
| PSA Levels, ng/ml
|
||
|---|---|---|
| Epithelial | Stromal | |
| JJa | 0.21 | 5.97 |
| MG | 0.23 | 13.73 |
| RPo | 5.74* | 3.06 |
| Collagenase digestion medium | >1,000 | |
| LNCaP | >1,000 | |
PSA values in the cell-type culture medium are shown. Prostate cells were prepared from specimens JJa, MG, and RPo. Because stromal cells themselves do not produce PSA, the detected PSA was probably produced by contaminating epithelial cells. This is reflected by the wide variation in PSA values. A better separation can be achieved by two successive Percoll gradients. LNCaP is a PSA-producing cell line.
The RPo epithelial culture contained enough contaminant stromal cells to be discernible under microscopic examination.
PSA Production in CD57+ Cells Depends on Interaction with Stromal Cells.
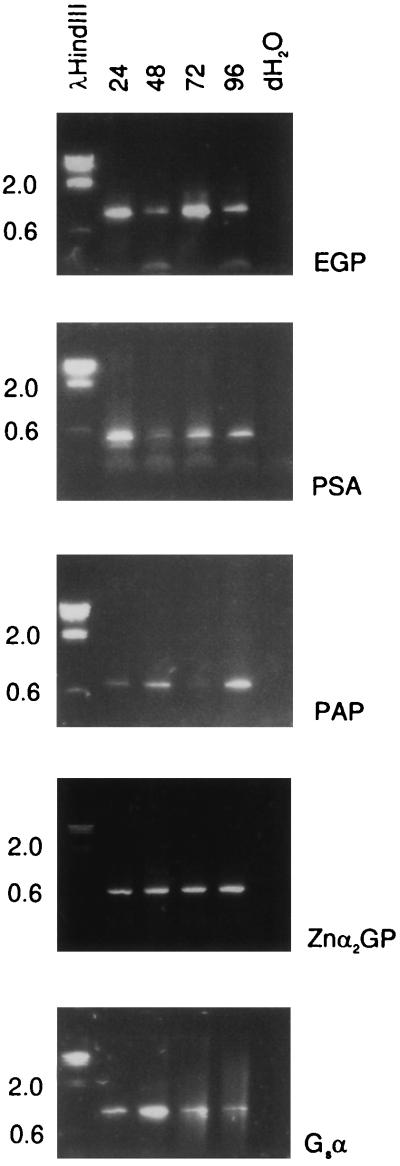
The following experiment demonstrates that the lack of PSA mRNA or protein in the sorted CD57+ cells was not due to a general lability of PSA-producing cells. Small pieces of prostate tissue were minced and left at room temperature for 24, 48, 72, or 96 h. At each time point, the samples were homogenized (without collagenase treatment) and assayed for expression of PSA, PAP, EGP, Znα2GP, and Gsα. Message for all these genes was detected at all time points (Fig. 5). Thus, PSA expression was not shut off when contact of luminal cells with other cell types was maintained. It is also remarkable that PSA expression in these tissue pieces persisted in the absence of exogenous androgen because PSA mRNA has an apparently short half-life as suggested by the collagenase treatment result. We propose that the dissolution of the glandular architecture—loss of stromal contact and an intact basement membrane—extinguishes PSA and PAP synthesis in the separated CD57+ cells.
Figure 5.
Prostate RNA stability. RT-PCR products of cDNA prepared from tissue pieces kept at room temperature for 24, 48, 72, and 96 h (indicated above the lanes) are resolved in lanes 2–5. Lane 1 contains DNA size markers. Lane 6 marked dH2O is a blank control. The expected PCR product sizes are as indicated in the legend to Fig. 3.
Some production of PSA was observed in cultures of isolated epithelial cells in the presence of stromal cells (see Table 1). We carried out in vitro tissue reconstitution experiment to determine if stromal influence can in fact restore PSA expression in sorted CD57+ cells. CD57+ cells and CD57− cells were sorted from specimen LFo. Stromal cells were purified by Percoll gradients. The three cell types—stromal, CD57+, CD57−—were cultured separately overnight. Then, stromal cells and CD57+ or CD57− cells were mixed and cultured in the presence of Matrigel and DHT. Samples of the different media were assayed for PSA on subsequent days (Table 2). CD57+ cells produced a low or negligible amount of PSA in the absence of stromal cells. However, CD57+ cells cocultured with stromal cells produced increasing amounts of PSA during the course of the experiment, and after the culture medium was replaced PSA production continued. Another important finding was that the CD57+ cells survived up to at least 13 days in the presence of stromal cells (indicated by PSA production). Stromal cells also induced PSA production in the CD57− population. This production could be due to residual luminal cells or differentiation of CD44+ cells as discussed below.
Table 2.
Induction of PSA expression via intercellular interactions
| Cells in culture | PSA Levels, ng/ml
|
|||||
|---|---|---|---|---|---|---|
| Days of culture
| ||||||
| 1 | 3 | 4 | 6 | 6 + 4 | 6 + 7 | |
| CD57− | 0.55 | 0.23 | 0.30 | ND | 0.33 | 0.54 |
| Stroma | ND | 0.87 | 0.84 | ND | 0.69 | ND |
| CD57+/stroma | ND | 2.27 | 3.91 | 6.03 | 4.50 | 5.68 |
| CD57−/stroma (a) | ND | 2.09 | 3.47 | 5.43 | 3.88 | 5.38 |
| CD57−/stroma (b) | ND | 2.70 | 4.30 | 4.55 | 1.76 | 2.69 |
A total of 118,000 CD57+ and 1.5 × 10⁶ CD57− cells were collected by flow sorting on the basis of αCD57-PE fluorescence from specimen LFo. The epithelial cells were cultured overnight and were mixed with stromal cells at a ratio of 1/1 in Matrigel on day 1. CD57− cells were seeded at 105 (a) and 5 × 10⁵ (b) with stromal cells and one at 105 without stromal cells. The secreted PSA values for the different cultures on the subsequent days are indicated. The culture medium was changed on day 6, and the cultures were monitored for 7 more days. ND, not done. CD57+ before coculture = 0.73.
Basal Cells Differentiate into Luminal Cells in the Presence of Stromal Cells.
Sorted basal cells were cultured with stromal cells and the emergence of presumptive luminal cells was assayed by PSA secretion. The stromal and sorted CD44+ cells of specimen WHa were cocultured in the presence of Matrigel and DHT, and media samples were taken on the subsequent days for PSA measurement (Table 3). PSA was not detected in the cultures of either stromal cells or CD44+ cells alone but was detected in cocultured stromal and CD44+ cells.
Table 3.
PSA production in cocultured CD44+ cells
| Cells in culture | PSA Levels, ng/ml
|
||
|---|---|---|---|
| Days in culture
| |||
| 3 | 4 | 6 | |
| Stroma (a) | 0.02 | ND | 0.00 |
| Stroma (b) | 0.06 | ND | 0.00 |
| CD44− | 0.00 | 0.00 | ND |
| CD44+/stroma | 0.24 | 0.30 | 0.38 |
Flow-sorted CD44+ cells and Percoll-purified stromal cells are derived from specimen WHa. Cells were mixed and assayed on days 3, 4, and 6 for secreted PSA protein. Stroma (a) and (b) are two separate cultures. CD44− is the unstained population. CD44+ before coculture = 0.00.
We have shown by flow cytometry that the two principal prostatic epithelial cell types can be separated on the basis of their differential expression of surface markers CD44 and CD57. The simple method of exhaustive collagenase digestion of tissue gives a satisfactory preparation of single cells suitable for flow analysis without further processing. The yield of cells is reduced by an autofluorescent population, and by its overlap with the FITC channel precluding the use of two-color sort. Quantum Red also showed overlap with autofluorescence. Discovery of new differentially expressed surface markers will make this method very useful to identify more subpopulations if they exist. With the isolated cell populations we were then able to show that it is possible to reproduce the biological processes of cytodifferentiation and maintenance of the differentiated state in prostatic cells by a reconstitution system. Both maintenance and PSA production of luminal (CD57+) cells and differentiation of basal (CD44+) cells into PSA-producing luminal cells require interaction of stromal cells. This requirement was suggested by the work of Cunha and colleagues (12) who performed tissue recombinants in animals.
If normal CD57+ cells lose PSA synthesis once they are free of the surrounding tissue, would cancer cells behave differently? In prostate cancer patients, circulating PSA-producing cells can be detected by ultrasensitive RT-PCR assays (22). Furthermore, PSA+ cells have been identified (23). Our preliminary results showed that cancer cells appear to behave similarly in that PSA synthesis is sensitive to stromal influence. It is possible then that prostatic cancer cells do not circulate as single cells but rather in cell cluster, or that an inductive blood factor is present. Or that PSA synthesis in some cancer cells becomes independent of stromal influence, like the PSA-producing LNCaP cells. Cancer cells might also land in an accommodating extraprostatic site, such as the marrow, where PSA expression can be sustained (24).
Our data also showed that another pathway beside that mediated by the androgen receptor controls PSA and PAP expression in epithelial cells. Note that both PSA and PAP are markers of terminal differentiation. PSP94, another abundantly expressed gene (by both epithelial cell types), is not similarly regulated. This pathway which is under stromal influence is apparently not operative in LNCaP. To date, virtually all studies on the regulation of PSA and PAP expression have been carried out with cultured LNCaP cells (25, 26). Our experimental system can now be used to identify the factors that control the expression of these genes in normal cells.
Acknowledgments
We thank Susan Saiget of PharMingen for discussion; Lisha Brown, Hui Wang, and Marianne Brown for assistance; and Barbara Trask for critical review of the manuscript. Support for this work is provided by the CaPCURE Foundation, the Department of Veterans’ Affairs, and the National Science Foundation Center for Molecular Biotechnology, Award BIR9214821-AM.
ABBREVIATIONS
- PSA
prostate-specific antigen
- PAP
prostatic acid phosphatase
- HBSS
Hanks’ balanced salt solution
- PE
phycoerythrin
- FITC
fluorescein isothiocyanate
- RT-PCR
reverse transcription–PCR
- DHT
5α-dihydrotestosterone
- EGP
epithelial glycoprotein
References
- 1.Cunha G R, Donjacour A A, Cooke P S, Mee S, Bigsby R M, Higgins S J, Sugimura Y. Endocr Rev. 1987;8:338–362. doi: 10.1210/edrv-8-3-338. [DOI] [PubMed] [Google Scholar]
- 2.Aumüller G. Bull Assoc Anatom. 1991;75:39–42. [PubMed] [Google Scholar]
- 3.Lilja H, Abrahamsson P A. Prostate. 1988;12:29–38. doi: 10.1002/pros.2990120105. [DOI] [PubMed] [Google Scholar]
- 4.Bonkhoff H, Remberger K. Prostate. 1996;28:98–106. doi: 10.1002/(SICI)1097-0045(199602)28:2<98::AID-PROS4>3.0.CO;2-J. [DOI] [PubMed] [Google Scholar]
- 5.Walensky L D, Coffey D S, Chen T, Wu T, Pasternack G R. Cancer Res. 1993;53:4720–4726. [PubMed] [Google Scholar]
- 6.English H F, Kyprianou N, Isaacs J T. Prostate. 1989;15:233–250. doi: 10.1002/pros.2990150304. [DOI] [PubMed] [Google Scholar]
- 7.Bonkhoff H, Stein U, Remberger K. Prostate. 1994;24:114–118. doi: 10.1002/pros.2990240303. [DOI] [PubMed] [Google Scholar]
- 8.Okada H, Tsubura A, Okamura A, Senzaki H, Naka Y, Komatz Y, Morii S. Virchows Arch A. 1992;421:157–161. doi: 10.1007/BF01607049. [DOI] [PubMed] [Google Scholar]
- 9.Liu A Y, Corey E, Vessella R L, Lange P H, True L D, Huang G M, Nelson P S, Hood L. Prostate. 1997;30:145–153. doi: 10.1002/(sici)1097-0045(19970215)30:3<145::aid-pros1>3.0.co;2-l. [DOI] [PubMed] [Google Scholar]
- 10.Butticè G, Kurkinen M. Contrib Nephrol. 1994;107:101–107. doi: 10.1159/000422967. [DOI] [PubMed] [Google Scholar]
- 11.Liu A Y, Corey E, Bladou F, Lange P H, Vessella R L. Int J Cancer. 1996;65:85–89. doi: 10.1002/(SICI)1097-0215(19960103)65:1<85::AID-IJC15>3.0.CO;2-H. [DOI] [PubMed] [Google Scholar]
- 12.Hayward S W, Cunha G R, Dahiya R. Ann NY Acad Sci. 1996;784:50–62. doi: 10.1111/j.1749-6632.1996.tb16227.x. [DOI] [PubMed] [Google Scholar]
- 13.Kassen A, Sutkowski D M, Ahn H, Sensibar J A, Kozlowski J M, Lee C. Prostate. 1996;28:89–97. doi: 10.1002/(SICI)1097-0045(199602)28:2<89::AID-PROS3>3.0.CO;2-I. [DOI] [PubMed] [Google Scholar]
- 14.Fong C J, Sherwood E R, Sutkowski D M, Abu-Jawdeh G M, Yokoo H, Bauer K D, Kozlowski J M, Lee C. Prostate. 1991;19:221–235. doi: 10.1002/pros.2990190304. [DOI] [PubMed] [Google Scholar]
- 15.Asbury C L, Esposito R, Farmer C, van den Engh G. Cytometry. 1996;24:234–242. doi: 10.1002/(SICI)1097-0320(19960701)24:3<234::AID-CYTO6>3.0.CO;2-H. [DOI] [PubMed] [Google Scholar]
- 16.Terpe H-J, Stark H, Prehm P, Günthert U. Histochemistry. 1994;101:79–89. doi: 10.1007/BF00269353. [DOI] [PubMed] [Google Scholar]
- 17.Wahab Z A, Wright G L. Int J Cancer. 1985;36:677–683. doi: 10.1002/ijc.2910360610. [DOI] [PubMed] [Google Scholar]
- 18.May E E, Perentes E. Histopathology. 1987;11:295–304. doi: 10.1111/j.1365-2559.1987.tb02634.x. [DOI] [PubMed] [Google Scholar]
- 19.Liu A Y. Cancer Lett. 1994;76:63–69. doi: 10.1016/0304-3835(94)90135-x. [DOI] [PubMed] [Google Scholar]
- 20.Simon B, Podolsky D K, Moldenhauer G, Isselbacher K J, Gattoni-Celli S, Brand S J. Proc Natl Acad Sci USA. 1990;87:2755–2759. doi: 10.1073/pnas.87.7.2755. [DOI] [PMC free article] [PubMed] [Google Scholar]
- 21.Arber D A, Weiss L M. Appl Immunohistochem. 1995;3:137–152. [Google Scholar]
- 22.Corey E, Arfman E, Liu A Y, Vessella R L. Clin Chem. 1997;43:443–452. [PubMed] [Google Scholar]
- 23.Brandt B, Junker R, Griwatz C, Heidl S, Brinkmann O, Semjonow A, Assmann G, Zänker K S. Cancer Res. 1996;56:4556–4561. [PubMed] [Google Scholar]
- 24.Melchior S W, Corey E, Ellis W J, Ross A A, Layton T J, Oswin M M, Lange P H, Vessella R L. Clin Cancer Res. 1997;3:249–256. [PubMed] [Google Scholar]
- 25.Banas B, Blaschke D, Fittler F, Hörz W. Biochim Biophys Acta. 1994;1217:188–194. doi: 10.1016/0167-4781(94)90033-7. [DOI] [PubMed] [Google Scholar]
- 26.Garcia-Arenas R, Lin F-F, Lin D, Jin L-P, Shih C C-Y, Chang C, Lin M-F. Mol Cell Endocrinol. 1995;111:29–37. doi: 10.1016/0303-7207(95)03544-h. [DOI] [PubMed] [Google Scholar]


