

Abstract
Hydration forces are thought to result from the energetic cost of water rearrangement near macromolecular surfaces. Raman spectra, collected on the same collagen samples on which these forces were measured, reveal a continuous change in water hydrogen-bonding structure as a function of separation between collagen triple helices. The varying spectral parameters track the force-distance curve. The energetic cost of water “restructuring,” estimated from the spectra, is consistent with the measured energy of intermolecular interaction. These correlations support the idea that the change in water structure underlies the exponentially varying forces seen in this system at least over the 13–18-Å range of interaxial separations.
The structure of water surrounding collagen has been studied by a wide variety of techniques and is considered a paradigm for protein hydration. It is commonly accepted that at least some water in collagen fibers differs from bulk, ambient water. Within the most simple scheme, this interstitial water is separated into two distinct classes—tightly bound and “free” or bulk-like (1, 2). More elaborate models imagine three or even more fractions (3–8). Tightly bound waters are believed to stabilize the triple helix by participating in the H-bond backbone (see ref. 9 for a review). In a larger context, however, the specific role of water in collagen assembly, structure and stability is still an open question.
New insights into the structure and the role of water near collagen come from the high-resolution x-ray structure of a collagen-like peptide (10, 11). Malleable clusters and chains of H-bonded waters form a complex network connected to polar side chains and to backbone carbonyls on the peptide triple helices. The uncharged helices do not show any direct contacts; water directly mediates the interaction between them.
This interpretation of the x-ray results correlates well with the picture that has emerged from direct measurement of force-distance curves between triple helices. It has been argued that the measured short-range repulsion, which prevents collagen molecules from coming too close to each other, originates from the energetic cost of removal of the interstitial water (12–14). The longer-range attraction, which prevents the molecules from coming too far apart and which induces self-assembly of collagen fibers from solution, appears to be associated with formation of hydrogen bonded water bridges at specific recognition sites (13). The arguments, however, have been based so far on the process of elimination of other explanations for the observed forces, rather than on direct observation of changes in water structure.
The present study establishes more explicit connection between forces and water structure by observing Raman spectra from the same samples on which osmotic stress force measurements have been made. We analyze the changes in the O—H and N—H vibrational bands measured in the 3,100–3,800-cm−1 range as a function of separation between collagen triple helices and correlate these changes with the measured forces.
METHODS
Preparation of collagen films and osmotic stress measurements of the force-distance curves were previously described in detail (12–14). Briefly, type I collagen was extracted from rat tail tendons, dissolved in 0.5 M acetic acid (pH 2.8), treated by pepsin (100 mg/g of tendons in two doses, 24 h at 4°C each), and purified by a triple salt fractionation procedure. The purity of the protein and the extent of covalent crosslinking in the fibers were verified by SDS/PAGE. Collagen solutions in 0.5 M acetic acid (pH 2.8, ≈1 g total dry weight of the protein) were slowly concentrated in Amicon 8050 high-pressure cell until a solid, optically transparent film was formed. The film was further dried by equilibrating against 50 wt% solution of polyethylene glycol (average molecular mass 8 kDa; United States Biochemical) for 2–3 days at 4°C. Then the film was separated from the dialysis membrane, washed in water (10 mM Tris⋅Cl, 2 mM EDTA, pH 7.5) to remove polyethylene glycol, air dried at 4°C, and stored under nitrogen at 4°C.
Small, rectangular (≈10 × 5 × 0.5 mm) pieces were cut from the film and equilibrated for at least a week either in polyethylene glycol [0.4 kDa (Spectrum Chemical) or 8 kDa (United States Biochemical)] solutions of known osmotic pressure or in vapor of known relative humidity above saturated salt solutions, as described (13). The samples were extracted from the equilibrating solution (vapor), wiped, sealed in thin plastic wrap to prevent water loss, and clamped vertically in the laser beam immediately before the Raman measurements were made. The film was irradiated by a finely focused laser beam (4,880 Å) through the edge and parallel to the film face, so that the beam was localized in the middle of the film and did not touch the faces. The total beam path in the film was determined by the width of the film that varied from 3 to 6 mm.
The measurements were conducted at room temperature (≈20°C) without thermostating. A low power laser beam (40–50 mW) was used to prevent local heating of the samples in the beam path. No heating was detected from monitoring time-dependent changes in the temperature-sensitive water spectrum. In particular, the water spectrum in fully hydrated collagen was very close to that characteristic for bulk water at room temperature. Further testing showed that significant heating and subsequent protein damage after prolonged exposure (discoloration of the beam path) were observed only at much higher beam intensity (>0.5–1.0 W).
Raman spectra were collected with a Jobin Yvon (Longjumeau, France) HG-2S concave holographic grating double monochromator controlled by J.Y. prism software from a computer. Alignment of the sample and associated adjustments were performed visually and by monitoring the signal at 2,945 cm−1 that corresponds to the strongest C—H vibrational line. The spectra corresponded to X(Z+Y, Z+X)Y Raman geometry, although no polarization scramblers were used. Rapid polarization scrambling occurred in the sample film itself. The loss of water during Raman measurement was negligible as judged by comparison of integral intensities of the O—H vibrational lines from several consecutive scans.
A single spectrum from 2,700 cm−1 to 4,000 cm−1 was typically measured from strongly hydrated samples, which had relatively low background and good signal/noise ratio. In contrast, we used several 2,000–4,000 cm−1 scans for less hydrated samples with higher fluorescent background and lower signal/noise ratio. We fitted the background in a wider frequency range and then averaged the background-corrected spectra to improve the signal/noise ratio.
Spectral intensity was calibrated using the C—H vibrational modes as a convenient internal standard, since collagen was practically the only source of the C—H Raman signal. All spectra were thus normalized to give the same integrated intensity in the 2,850–3,040 cm−1 frequency region, where the C—H modes dominate. Deconvolution of spectral bands in the 3,150–4,000 cm−1 region into Gaussian peaks was performed by nonlinear fitting using peakfit 4.0 software (Jandel, San Rafael, CA). The OH peaks are traditionally assumed to have Gaussian shape (15) because of inhomogeneous broadening of the spectral lines (from a Gaussian distribution of OH oscillators with frequencies shifted due to variations in the hydrogen-bond environment).
The samples were sealed in x-ray cells for measurement of the interaxial distance immediately after the Raman measurements. Bragg spacings were the same as measured previously (13) at the same osmotic pressures. The design and the equipment used for the x-ray experiments were described (12–14, 16). The interaxial spacings were calculated from the Bragg spacings by approximating collagen fibers as arrays of hexagonally packed cylinders. From the interaxial spacing in dry fibers the cylinder diameter was estimated to be 12.1 Å. The volume fraction of water was defined as the volume fraction not occupied by the cylinders.
RESULTS
Spectra from Collagen Solvated in Excess H2O and in Excess D2O.
O—H vibrations in bulk water have a characteristic Raman spectrum from 3,000–3,800 cm−1 (17, 18). This typical water signal is also clearly visible in the unprocessed 30–4,000 cm−1 Raman spectrum from collagen solvated in excess water (pH 7.5, 10 mM Tris/2 mM EDTA) shown in Figure 1. In this paper we concentrate on the 3,150–3,800 cm−1 frequency range, where the collagen Raman spectrum is dominated by O—H vibrations in interstitial water, as shown below. We exclude from our analysis the signal between 3,000–3,150 cm−1 because of overlapping collagen vibrational modes that are difficult to separate.
Figure 1.

Raman spectra of collagen (Stokes): (a) Unprocessed spectrum of collagen solvated in H2O. The relatively high noise level in the spectrum is due to the low power of the laser beam (40 mW) used to avoid local heating. (b) Collagen initially solvated in excess H2O at pH 7.5, 20°C for at least a week, then transferred into D2O for a short period of time. The average of several spectra, obtained with equilibration times in D2O from 0.5–2.0 h, is shown. To obtain the average, we subtracted background and scaled the spectra to the same integrated CH intensity as described in Results. Practically all OH protons are exchanged within 30 min, as seen from the observed frequency shift characteristic for OD vibrations. (Note that integrated intensities of the OH and OD bands normalized by the corresponding integrated CH intensities are approximately the same.) After the H/D exchange is complete, the NH (amide) vibrations centered at 3,329 cm−1 become clearly visible (the peak is enhanced in the insert). Intensity of this peak changes only after several days in D2O.
One of the distinguishing features of the water signal is a characteristic frequency shift after the H to D exchange (15). This expected shift is observed after the collagen sample, first solvated in excess H2O, is transferred into excess D2O, and reequilibrated for 0.5–2.0 h (Fig. 1b). The signal in the 3,150–3,800 cm−1 frequency range is almost completely lost and replaced by a strong signal in the ≈2,200–2,800 cm−1 region.
N—H Vibrational Mode from Protein Backbone Amides.
A small, residual peak centered at 3,329 cm−1 remains between 3,150–3,800 cm−1 after D2O equilibration (Fig. 1b). We also observed the same peak in all Raman spectra of collagen solvated in H2O at all water contents. We quantified its contribution to these spectra by numerous rounds of Gaussian deconvolutions and found that:
(i) This is the only band in 3,150–3,800 cm−1 spectral region whose position and integrated intensity obtained by the deconvolutions of H2O-collagen spectra are independent of water content. Both the center and the integrated intensity of this band are approximately the same as those measured directly in the H/D exchange experiment.
(ii) The peak broadens with decreasing water content. The width of the peak is plotted in Fig. 2 as a function of interaxial spacing between collagen molecules determined by x-ray diffraction.
Figure 2.

The half-width of N—H (amide) vibrations obtained from Gaussian deconvolution of the 3,329 cm−1 peak in H2O-collagen at different interaxial spacings between collagen molecules. First, we fitted the half-width and the intensity assuming only that the peak frequency was the same at all spacings. We found no systematic changes in integral intensity (area) of the peak with the spacing. The integral intensity was approximately the same as that directly measured in the H/D exchange experiment (see Fig. 1). Then, we refitted the peaks with both the peak frequency and the integral intensity constant, so that the only adjustable parameter for this peak was the half-width. An estimated error for the values of the peak half-width is ±5 cm−1. The dotted line shows the half-width of the N—H peak obtained in the H/D exchange experiment.
A 3,330 cm−1 peak was observed previously (19, 20) in IR spectra of hydrated and dry collagen and it was assigned as an amide A band from N—H vibrations of protein backbone amides. The 3,329 cm−1 peak in our spectra appears to be its Raman counterpart. Indeed, its integrated intensity does not depend on the water content and it is practically unaffected by the H/D exchange for several hours.
Significant reduction in the integrated intensity of the 3,329 cm−1 peak is observed only after equilibration in D2O for several days. This is consistent with the slow rate of amide proton exchange in collagen previously observed by a different, more direct experimental technique (21). Only ≈30% of amides exchange their protons within the first 30 min in soluble collagen (21), but even these protons may exchange much slower in collagen aggregates (21), particularly in well ordered, thick collagen films.
The 3,330 cm−1 position of the amide A band is characteristic for collagen and collagen-like polypeptides (19, 20), but it is slightly higher than the 3,300 cm−1 typical for most proteins (20). Various interpretations of this difference have been discussed based on the unique structure of the collagen triple helix (20). The broadening of the 3330 cm−1 band, observed here at low water content, suggests that the hydration structure of the triple helix might contribute to the unusual position of the peak as well.
The contribution of the amide band to the Raman spectra is small compared with that of the O—H modes. Nevertheless, its subtraction from the 3,150–3,800 cm−1 spectra improves the accuracy of the O—H mode analysis, particularly when the Gaussian deconvolution is applied. A small error associated with the subtraction does not affect interpretation of the results. All further OH spectra are shown after subtraction of this band.
Analysis of the O—H Raman Modes.
The normalized intensity of the Raman spectra, integrated from 3,150–3,800 cm−1 after subtraction of the amide contribution, is found to be proportional to the volume fraction of water determined from x-ray diffraction (Fig. 3b). The good fit by a straight line passing through the origin indicates that the signal is indeed dominated by the contribution from O—H vibrations in interstitial water. In particular, (i) there are no significant water-filled voids in the collagen array that would not be detected by x-ray diffraction but would contribute to the Raman signal; (ii) there is no significant Raman signal from residual aqueous polyethylene glycol solution that could be retained in microscopic cracks on the sample surface.
Figure 3.

(a) Raman OH spectra of bulk water (dotted line, 1) and of solvated collagen (2–4) measured in the X(Z+Y, Z+X)Y geometry without a polarization scrambler in front of the slit. The intensity and the shape of the OH signal change with the decreasing interaxial spacing between the collagen helices: 17.3 Å (2), 14.7 Å (3), and 13.0 Å (4). The OH spectra of collagen were obtained by subtraction of the 3329 cm−1 amide band from the net signal (as described in Materials and Methods). The raw data and the running average (40 cm−1 averaging window width) are shown by the thin and the bold lines correspondingly. The spectra were scaled using the integral intensity of the CH signal as a normalizing factor. The ratio of the integrated intensities of OH to CH signals is proportional to the volume ratio of water to collagen in the sample as shown in the graph (b). The water/collagen volume ratio was independently determined from x-ray data on the same samples. The solid line in the graph (b) shows the linear fit made to pass through the origin. Estimated errors for the OH/CH ratio and for the water/collagen volume ratio are ±0.2. A small systematic error (≈10–20%) in the water/collagen volume ratio is possible because of nonideal hexagonal packing of the molecules.
The O—H Raman spectrum of collagen hydrated in excess water is close to that of bulk, ambient water (Figure 3a). Two characteristic peaks (at ≈3,250 cm−1 and ≈3,450 cm−1) and a shoulder (at ≈3,600 cm−1) are clearly visible. The 3,250 cm−1 band is polarized, as in bulk water. Its relative intensity can be varied by changing the polarization geometry of the incoming laser beam and collected scattered light. However, the depolarization ratio is difficult to quantify because of polarization scrambling in the samples.
The OH spectrum changes its shape as the spacing between collagen molecules decreases (Fig. 3a). The intensity increasingly shifts toward lower frequencies. These spectral changes were quantified in several different ways with and without deconvolution of different contributing O—H vibrational modes (Fig. 4).
Figure 4.

Spectral parameters for O—H vibrations at different interaxial spacings derived from measurements in X(Z+Y, Z+X)Y geometry without use of a polarization scrambler in front of the slit. (a) Integral intensity ratio of vibrations in the 3,150–3,350 cm−1 range to vibrations in the 3,350–3,750 cm−1 range calculated directly from the spectra without deconvolution. The selection of 3,350 cm−1 as the dividing frequency is arbitrary. The same trend is observed for other dividing frequencies that separate two main water peaks (≈3,250 cm−1 and ≈3450 cm−1). (b) Intensity ratio of the ≈3,250 cm−1 band to the ≈3,450 cm−1 band obtained from Gaussian deconvolution. (c) Center of mass frequency for the OH spectrum in the range from 3,150–3,750 cm−1 obtained directly from the spectra without deconvolution. (d) Frequency difference between the centers of the ≈3,250 cm−1 and ≈3,450 cm−1 bands calculated from Gaussian deconvolution. The dotted lines show the same parameters obtained for the bulk water spectrum in the same X(Z+Y, Z+X)Y geometry. Estimated errors in spectral parameters obtained without Gaussian deconvolution are ±0.05 (a) and ±5 cm−1 (c). The main source of the error is the baseline subtraction procedure. Estimated errors for the parameters obtained by Gaussian deconvolution are higher—±0.1 (b) and ±10 cm−1 (d)—due to the extra step of nonlinear fitting of the spectra.
Deconvolution relied on a simplified model using the minimum required number of Gaussians (two or three, depending on the water content). After numerous deconvolution trials we found that: (i) Two lower frequency Gaussians, centered at ≈3,250 cm−1 and ≈3,450 cm−1, had approximately the same width. (ii) The third Gaussian peak, centered at ≈3,600 cm−1, was required for accurate fits only at high water content. At low water content its intensity became comparable to the noise level. The most reliable fits, with reasonably low parameter dependencies, were obtained with these restrictions.
The results of the quantitative analysis are illustrated in Fig. 4. With the decreasing interaxial distance between collagen triple helices: (i) the intensity ratio of the 3,250 cm−1 to the 3,450 cm−1 bands increases (Fig. 4 a and b), (ii) the “center of mass” of the 3,150–3,750 cm−1 Raman signal shifts toward lower frequencies (Fig. 4c), and (iii) the separation between the centers of the two major bands decreases (Fig. 4d). Note that the integral intensity ratio of lower frequency contribution (3,150–3,350 cm−1) to higher frequency contribution (3,350–3,750 cm−1), shown in Fig. 4a, is practically identical to the intensity ratio of the 3,250 cm−1/3,450 cm−1 bands (Fig. 4b) obtained by Gaussian deconvolution.
All parameters of the O—H spectra, calculated with and without Gaussian deconvolution, and the width of the N—H peak have approximately the same dependence on the interaxial spacing between the collagen triple helices (Fig. 5a). This agreement shows that the observed spectral change is not an artifact but rather a manifestation of changes in the structure of interstitial water. The distance dependence of the observed changes is closely similar to the force-distance curve measured on the same samples (Fig. 5b).
Figure 5.
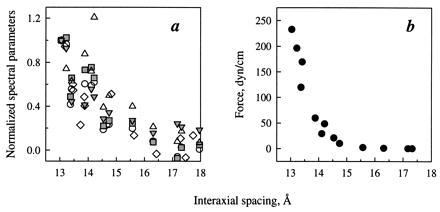
(a) O—H spectral parameters from Fig. 4 and the NH half-width (Fig. 2) plotted in the same, normalized scale. The parameters were linearly scaled to be equal to zero in bulk water (for NH half-width we used the H/D exchange experiment value as 0) and to be equal to one in the sample containing the least amount of water. The same symbols as in Figs. 2 and 4 are used. (b) Intermolecular force vs. interaxial spacing for the same samples. An estimated error of the force measurement is ≈25%.
DISCUSSION
Collagen presents an opportunity to look at protein hydration many different ways. It has proved to be a particularly apt test bed for the idea that hydration forces are in fact due to perturbed water near the protein surface: (i) A hydration force model has produced very accurate quantitative prediction for the measured interaction decay length (13). (ii) Hydrogen-bonded water clusters holding apart collagen-like peptide triple helices have been seen by high resolution x-ray diffraction experiments (11). (iii) Involvement of the solvent hydrogen-bond network in collagen triple helix interaction has been further demonstrated by comparing the forces in hydrogen-bonding and nonhydrogen-bonding nonaqueous solvents (14). (iv) Distance-dependent variation of several spectral and thermodynamic parameters of interstitial water has been observed by a number of experimental techniques (1, 3–8).
A direct connection between water structure and the energetic cost of water removal has been difficult to demonstrate. Here we have been able to obtain Raman spectra on the same samples on which forces are measured. We believe that this is a step toward establishing the needed force-structure relationship.
We are able to distinguish three main components of the spectrum ≈3,250 cm−1, ≈3,450 cm−1, and ≈3,600 cm−1. It has been suggested that the 3,250 cm−1 and 3,450 cm−1 bands are associated with different modes of O—H vibrations in the hydrogen-bonded network of water molecules while the 3,600 cm−1 band is due to vibrations in nonhydrogen-bonded O—H (e.g., see ref. 22 and references therein). The ratio of the intensities of the first two components in bulk water is sensitive to water hydrogen-bond network rearrangements caused by temperature and pressure. For example, changes in the 3,250/3,450 cm−1 intensity ratio vs. temperature correlate well with changes in the bulk water radial distribution function measured by x-ray and neutron scattering (22).
Deviation from bulk-water values of the 3,250/3,450 cm−1 intensity ratio and other spectral parameters (Figs. 4 and 5) clearly indicates that the interstitial water structure changes with decreasing distance between collagen molecules. The observed spectral change cannot be explained by an undetected local heating of water in the beam path since the OH spectrum from fully hydrated collagen corresponds to the typical water spectrum at room temperature (Figs. 3a and 4). The OH spectra from partially dehydrated collagen correspond to cooled or even supercooled water (22) rather than the heated one.
The very extent of the spectral change indicates that rearrangement of the water hydrogen-bond network may incur the energetic cost responsible for the measured forces. The magnitude of change in the 3,250/3,450 cm−1 intensity ratio observed upon pushing collagen triple helices to the closest separation (Fig. 4b) is approximately the same as that from cooling bulk water by 65 ± 15°C. This does not imply that the actual change in the hydrogen-bond network is the same, but the specific heat [from 18 cal/(mol K) at 20°C to 25 cal/(mol K) at −40°C, ref. 23] does allow us to estimate that the cost of the rearrangement is of the order of 1 kcal/mol (1 kcal = 4.18 kJ). This cost is the same as the work of removing a molecule (18 cm3) of water from collagen fibers at this separation (where osmotic pressure is ≈109.4 erg/cm3 ≈60 cal/cm3; 1 erg = 0.1 μJ). We must note that while this estimate demonstrates the energetic significance of water hydrogen-bond rearrangement, it does not clarify the mechanism of force transduction.
The observed spectral changes appear to be caused by continuous rearrangement in the water hydrogen-bond network rather than removal of bulk-like water, wherein strongly bound water contributes proportionally more to the average Raman signal. Spectra can conceivably be fitted by a simplified two-state model, but this model is already at odds with x-ray diffraction data (10, 11) as well as with several kinds of measurements that require multistate models (3–8). Continuous rearrangement of H-bonds is consistent with present and all previous data. In particular, it is suggested by the progressive broadening of the 3,329 cm−1 amide line (Fig. 2), which tracks the changes in O—H spectral parameters (Fig. 5). The amide vibrations are most likely affected by changes in their primary hydration shell (the strongly bound waters), whose structure responds to decreasing separation between the helices.
Though still controversial (24–26), spatially varying perturbation of water has been long considered one of the most likely sources of observed exponential repulsive “hydration” forces measured between polar macromolecular surfaces. Because the energy per water molecule is small, it is usually difficult to observe changes in water itself. High resolution x-ray measurements, on collagen-like peptide (11) and on insulin (27) crystals do suggest the kind of extended rearrangement that underlies a solvation-based model of interaction. Raman spectra, sensitive to the structure of water hydrogen-bond network and to conditions near amides, establish that this rearrangement in hydration layers not only occurs but also varies continuously with protein separation. It may now be possible to strengthen the link between water structuring and intermolecular forces by collecting correlative Raman spectra on other systems where hydration forces have been measured: lipid multilayers (25, 28), DNA helices (29), guanosine helices (30), and polysaccharides (31).
Acknowledgments
We thank Donald Rau for many stimulating discussions and expert advice that made this work possible. This work was partly supported by the Office of Naval Research Grant N00014–91-F-0201.
References
- 1.Chapman G E, Danyluk S S, McLauchlan K A. Proc R Soc London B. 1971;178:465–476. doi: 10.1098/rspb.1971.0076. [DOI] [PubMed] [Google Scholar]
- 2.Grigera J R, Berendsen H J C. Biopolymers. 1979;18:47–57. [Google Scholar]
- 3.Luescher M, Ruegg M, Schindler P. Biopolymers. 1974;13:2489–2503. doi: 10.1002/bip.1974.360131208. [DOI] [PubMed] [Google Scholar]
- 4.Nomura S, Hiltner A, Lando J B, Baer E. Biopolymers. 1977;16:231–246. doi: 10.1002/bip.1977.360160202. [DOI] [PubMed] [Google Scholar]
- 5.Sasaki N, Shiwa S, Yagihara S, Hikichi K. Biopolymers. 1983;22:2539–2547. doi: 10.1002/bip.360221208. [DOI] [PubMed] [Google Scholar]
- 6.Cusak S, Lees S. Biopolymers. 1984;23:337–351. doi: 10.1002/bip.360230212. [DOI] [PubMed] [Google Scholar]
- 7.Peto S, Gillis P, Henri V P. Biophys J. 1990;57:71–84. doi: 10.1016/S0006-3495(90)82508-X. [DOI] [PMC free article] [PubMed] [Google Scholar]
- 8.Shinyashiki N, Asaka N, Mashimo S, Yagihara S, Sasaki N. Biopolymers. 1990;29:1185–1191. doi: 10.1002/bip.360290809. [DOI] [PubMed] [Google Scholar]
- 9.Fraser R D B, MacRae T P. Conformation in Fibrous Proteins. New York: Academic; 1973. [Google Scholar]
- 10.Bella J, Eaton M, Brodsky B, Berman H M. Science. 1994;266:75–81. doi: 10.1126/science.7695699. [DOI] [PubMed] [Google Scholar]
- 11.Bella J, Brodsky B, Berman H. Structure (London) 1995;3:893–906. doi: 10.1016/S0969-2126(01)00224-6. [DOI] [PubMed] [Google Scholar]
- 12.Leikin S, Rau D C, Parsegian V A. Proc Natl Acad Sci USA. 1994;91:276–280. doi: 10.1073/pnas.91.1.276. [DOI] [PMC free article] [PubMed] [Google Scholar]
- 13.Leikin S, Rau D C, Parsegian V A. Nat Struct Biol. 1995;2:205–210. doi: 10.1038/nsb0395-205. [DOI] [PubMed] [Google Scholar]
- 14.Kuznetsova N, Rau D C, Parsegian V A, Leikin S. Biophys J. 1997;72:353–362. doi: 10.1016/S0006-3495(97)78674-0. [DOI] [PMC free article] [PubMed] [Google Scholar]
- 15.Walrafen G E, Yang W-H, Chu Y C, Hokmabadi M S. J Phys Chem. 1996;100:1381–1391. [Google Scholar]
- 16.Mudd C P, Tipton H, Parsegian V A, Rau D C. Rev Sci Instrum. 1987;58:2110–2114. [Google Scholar]
- 17.Walrafen G E, Hokmabadi M S, Yang W-H. J Chem Phys. 1986;85:6964–6969. [Google Scholar]
- 18.Walrafen G E, Fisher M R, Hokmabadi M S, Yang W-H. J Chem Phys. 1986;85:6970–6982. [Google Scholar]
- 19.Susi H, Ard J S, Carroll R J. Biopolymers. 1971;10:1597–1604. doi: 10.1002/bip.360100913. [DOI] [PubMed] [Google Scholar]
- 20.Brodsky-Doyle B, Bendit E G, Blout E R. Biopolymers. 1975;14:937–957. doi: 10.1002/bip.1975.360140505. [DOI] [PubMed] [Google Scholar]
- 21.Yee R Y, Englander S W, von Hippel P H. J Mol Biol. 1974;83:1–16. doi: 10.1016/0022-2836(74)90420-3. [DOI] [PubMed] [Google Scholar]
- 22.Walrafen G E, Chu Y C. J Phys Chem. 1995;99:11225–11229. [Google Scholar]
- 23.Angell C A, Oguni M, Sichina W J. J Phys Chem. 1982;86:998–1002. [Google Scholar]
- 24.Leikin S, Parsegian V A, Rau D C, Rand R P. Annu Rev Phys Chem. 1993;44:369–395. doi: 10.1146/annurev.pc.44.100193.002101. [DOI] [PubMed] [Google Scholar]
- 25.McIntosh T J, Simon S A. Annu Rev Biophys Biomol Struct. 1994;23:27–51. doi: 10.1146/annurev.bb.23.060194.000331. [DOI] [PubMed] [Google Scholar]
- 26.Israelachvili J, Wennerstrom H. Nature (London) 1996;379:219–225. doi: 10.1038/379219a0. [DOI] [PubMed] [Google Scholar]
- 27.Badger J, Caspar D L D. Proc Natl Acad Sci USA. 1991;88:622–626. doi: 10.1073/pnas.88.2.622. [DOI] [PMC free article] [PubMed] [Google Scholar]
- 28.Parsegian V A, Rand R P. In: Structure and Dynamics of Membranes. Lipowsky R, Sackmann E, editors; Lipowsky R, Sackmann E, editors. 1B. Amsterdam: Elsevier; 1995. pp. 643–690. [Google Scholar]
- 29.Rau D C, Lee B, Parsegian V A. Proc Natl Acad Sci USA. 1984;81:2621–2625. doi: 10.1073/pnas.81.9.2621. [DOI] [PMC free article] [PubMed] [Google Scholar]
- 30.Mariani P, Saturni L. Biophys J. 1996;70:2867–2874. doi: 10.1016/S0006-3495(96)79856-9. [DOI] [PMC free article] [PubMed] [Google Scholar]
- 31.Rau D C, Parsegian V A. Science. 1990;249:1278–1281. doi: 10.1126/science.2144663. [DOI] [PubMed] [Google Scholar]