Abstract
Targeting of many secretory and membrane proteins to the inner membrane in Escherichia coli is achieved by the signal recognition particle (SRP) and its receptor (FtsY). In E. coli SRP consists of only one polypeptide (Ffh), and a 4.5S RNA. Ffh and FtsY each contain a conserved GTPase domain (G domain) with an α-helical domain on its N terminus (N domain). The nucleotide binding kinetics of the NG domain of the SRP receptor FtsY have been investigated, using different fluorescence techniques. Methods to describe the reaction kinetically are presented. The kinetics of interaction of FtsY with guanine nucleotides are quantitatively different from those of other GTPases. The intrinsic guanine nucleotide dissociation rates of FtsY are about 105 times higher than in Ras, but similar to those seen in GTPases in the presence of an exchange factor. Therefore, the data presented here show that the NG domain of FtsY resembles a GTPase–nucleotide exchange factor complex not only in its structure but also kinetically. The I-box, an insertion present in all SRP-type GTPases, is likely to act as an intrinsic exchange factor. From this we conclude that the details of the GTPase cycle of FtsY and presumably other SRP-type GTPases are fundamentally different from those of other GTPases.
Secretory and membrane proteins face similar problems early in their life cycle of how to reach their final destination by crossing a membrane or being inserted into a membrane (1). The signal recognition particle (SRP) and its receptor form a ubiquitous system for targeting these proteins to the translocation machinery at the endoplasmic reticulum membrane in eukaryotes and at the inner membrane in prokaryotes (2). The process is regulated by GTPases present as distinct domains (G domains) in the SRP and its receptor. In Escherichia coli, the SRP consists of only one protein, the Ffh (fifty four homologue, P48, or SRP54 homologue) and a 4.5S RNA (3, 4). The protein FtsY has been identified as the functional homologue of the eukaryotic SRP receptor SRα (5). Ffh and FtsY both contain G domains. Recently, it has been shown that FtsY is important for the expression and the insertion of a subset of membrane proteins in E. coli (refs. 6 and 7; for a recent review, see ref. 8). In the presence of GTP, Ffh/4.5S RNA forms a complex with FtsY, leading to a reciprocal stimulation of both GTPases (9–11). This observation led to the proposal that Ffh and FtsY are GTPase-activating proteins (GAPs) for each other (11). So far, all known GAPs have been proteins that themselves have no GTPase activity.
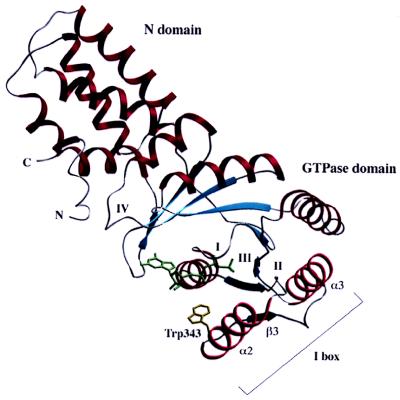
GTPases of the SRP family form a distinct subfamily of GTPases that share a number of similarities with the Ras superfamily of GTPases but also display distinct differences (12, 13). SRP GTPases such as Ffh consist of three domains: an N domain (about 100 residues) of unknown function, the G domain (about 200 residues), and the methionine-rich M domain, which binds both signal peptides and the SRP RNA. The SRP-receptor proteins SRα and FtsY do not contain an M domain. Instead, a highly charged domain is present at the N terminus of the NG domain that might be involved in membrane association. Relatively little information has been available at the molecular level on the structure of SRP-GTPases and their GTPase cycle. Recently, the structures of two SRP-type GTPases have been solved by x-ray crystallography, the NG domains of the SRP receptor FtsY from E. coli (ref. 14, Fig. 1) and of the SRP54 homologue from Thermus aquaticus (15). Both NG structures are without nucleotide and are remarkably similar. The N domain appears as a four-helix bundle, whereas the G domain has the overall fold of Ras-type GTPases and contains the four consensus regions (G1–G4) for guanine nucleotide binding (12, 14). SRP GTPases have an α-β-α insertion in the effector region, which has been named the “I-box.” On the basis of a number of interactions between the I-box and the G2 region (Thr-331), the I-box has been proposed to be a built-in effector that stabilizes the nucleotide-free form of the protein and contributes to the low affinity for GTP (14). The binding site of FtsY is opened up in comparison with that of Ras-like proteins in their nucleotide-bound state, and a number of rearrangements would be necessary to bind the nucleotide. These involve mainly the G4 and G2 regions.
Figure 1.
Cα ribbon representation of the structure of the NG domain of FtsY. The single tryptophan residue used for the fluorescence is shown with its side chain (Trp-343). The N and G domains are marked as well as the four consensus elements of GTP binding (I-IV) (14). The I-box (insertion consisting of α2-β3-α3) is indicated.
GTPases cycle between two conformational states, the GTP-bound on state and the GDP-bound off state (12, 13). The interconversion between these two states is controlled by the dissociation rate of the nucleotide and the GTPase activity (rate of hydrolysis). Exchange factors, GAPs, and other regulatory proteins control the activity of GTPases (16). Nucleotide exchange factors seem to stabilize the nucleotide-free form of the GTPase by decreasing the affinity for GDP. No detailed kinetic analysis of the interaction of nucleotides or regulatory proteins with SRP-type GTPases has yet been reported. The quantitative analysis presented here for FtsY forms the basis for understanding the mode of action of this family of GTPases and of their regulation by interacting with other GTPases during the targeting process. Using the methods for FtsY as described previously for Ras (17), elongation factor EF-Tu (18), and Rab5 (19) allows a detailed comparison with these proteins and their GTPase cycles.
EXPERIMENTAL PROCEDURE
Expression and Purification.
The NG domain of FtsY was expressed and purified using a C-terminal His tag as previously described (20). HPLC analysis showed that the protein was free of nucleotides. The XTP-specific mutation Asp-449 → Asn was obtained by site-directed mutagenesis using the PCR with a single mutagenic primer (5′-AACGAAACTGAACGGCACG-3′) and two primers flanking the FtsY-NG fragment (5′-GACTCACTATAGGGAGACC-3′ and 5′-CCAACTCAGCTTCCTTTCG-3′), as described by ref. 21. The purity of the proteins was 95%, as judged from SDS/polyacrylamide gel electrophoresis followed by Coomassie blue staining. The protein concentration was determined with the Bradford assay using bovine serum albumin as a standard (22).
Nucleotides.
Methylanthraniloyl (mant) derivatives of GDP, GTP, and XTP were prepared as described (17). Nucleotides were separated analytically by HPLC as previously described (17, 23).
Fluorescence Measurements.
Fluorescence titration measurements were performed with an SLM 8000 spectrophotometer (Aminco, Silver Spring, MD). An excitation wavelength of 297 nm and an emission wavelength of 340 nm were used. In spite of the long excitation wavelength, loss of fluorescence intensity due to absorption of exciting light by GDP or GTP was noticeable at higher concentrations. Titrations were therefore continued to concentrations that were higher than would normally be used to obtain data to allow fitting of the inner filter effect (see below under data evaluation).
Both equilibrium and kinetic experiments were performed at 20°C in 20 mM Tris⋅HCl, pH 7.5/50 mM NaCl/5 mM MgCl2 buffer.
Stopped-Flow Fluorescence Measurements.
Rapid kinetics were measured by using a stopped-flow apparatus (High Tech Scientific, Salisbury, U.K.) with protein concentrations of 2.0 μM. Excitation of tryptophan fluorescence was at 295 nm, with detection through a 320-nm cut-off filter. Fluorescence of mant nucleotides was excited either directly at 366 nm or by means of fluorescence resonance energy transfer (FRET) at 290 nm, with emission through a 389-nm cut-off filter. An instrumental electronic time constant was used to eliminate rapid noise after checking for the presence of very fast signal changes. This constant was chosen to be more than one order of magnitude less than the time constant of the fastest process being observed. Normally, several stopped-flow traces (up to 10) were averaged before analysis.
Data Evaluation.
Titration data were evaluated with the program grafit 3.0 (Erithacus Software, Staines, U.K.). Data were fitted to a quadratic equation describing the binding behavior. In addition, a linear term was included in the fitting equation to allow for loss of intensity due to the inner filter effect (absorption of exciting light by added nucleotides).
Data collection and primary analysis for determination of rate constants in stopped-flow experiments were performed with the package from High Tech Scientific, while secondary analysis was with grafit 3.0.
RESULTS
Determination of the Affinity of GDP and GTP to the NG Domain of FtsY.
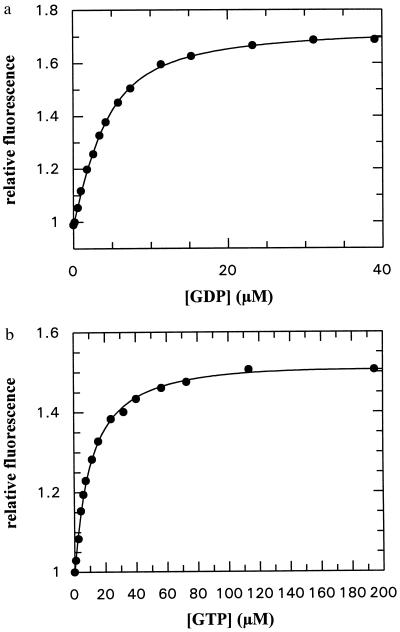
On interaction of GDP or GTP with the NG fragment, there is a significant increase in the fluorescence of the single tryptophan residue (see Fig. 1). This has been used to determine the affinity of the nucleotides, as shown in Fig. 2. Fitting a quadratic equation to the points obtained in a fluorescent titration of GDP with the protein gave the solid line shown in Fig. 2a and resulted in a value of 2.14 μM for the Kd. The increase in fluorescence was 76%, suggesting a large change in environment of the tryptophan residue, possibly moving to a position in which solvent quenching is less than in the free protein. In Fig. 2b, a titration of GTP is shown. The Kd value in this case was 10.7 μM and the fluorescence change was 57%. Thus, GDP binds about 5-fold more strongly than GTP, and there is a larger change in the environment of the tryptophan.
Figure 2.
(a) Titration of GDP with the NG fragment of FtsY (3.6 μM), using tryptophan fluorescence as a signal of binding (excitation wavelength 297 nm, detection at 340 nm). The solid line shows the fit to the data obtained by using the quadratic equation describing the binding equilibrium. The fitted Kd value was 2.14 ± 0.22 μM. Conditions were as described in the text. (b) Titration of GTP with the NG fragment of FtsY (1 μM). Conditions as in a. Fitted Kd value = 10.7 ± 0.45 μM.
Kinetics of GDP Interaction with the NG Domain of FtsY.
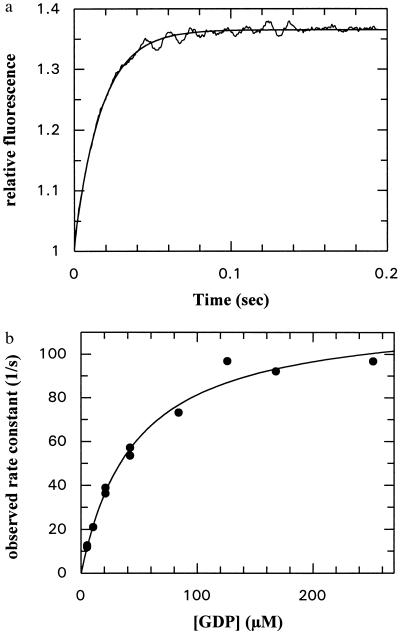
The fluorescence change occurring on association of NG with GDP or GTP can be used to monitor the kinetics of the binding reaction in a stopped-flow apparatus, and an example is shown for GDP in Fig. 3a. The data could be fitted with a single exponential term when pseudo-first-order conditions were used (large excess of GDP over protein), and the fitted rate constant was concentration dependent, initially increasing linearly with nucleotide concentration. However, as is apparent from Fig. 3b, the slope decreases at higher concentrations, and the dependence can be well described by a hyperbolic equation. This behavior is similar to that seen with other GTPases, including Ras (17), EF-Tu (18), and Rab5 or Rab7 (19), and has been interpreted as arising from a two-step binding mechanism as shown in Scheme S1:
Figure 3.
(a) Time dependence of the association between GDP (42 μM) and the NG fragment of FtsY (2 μM) monitored by tryptophan fluorescence in a stopped-flow apparatus. The smooth line shows a single exponential fit to the data and corresponds to a pseudo-first-order rate constant of 56.8 ± 0.42 s−1. (b) Concentration dependence of the pseudo-first-order rate constant for GDP association to the NG fragment of FtsY. The solid line shows the best fit to a hyperbolic curve that defines the apparent Kd of GDP in the monitored step as 44.9 ± 9.3 μM and the maximal rate constant of the fluorescence change as 119 s−1.
The monitored change in fluorescence occurs in the second step.
The data obtained can be explained by this model if we assume that the first step is in rapid equilibrium with respect to the second step, or more exactly that k−1 is much larger than the sum of k+2 and k−2 and that the fluorescence change occurs in the second step (24). The relationship between the observed rate constant and the GDP concentration is then given by Eq. 1:
 |
1 |
Fitting the data to this equation leads to a value of 2.15 × 10⁴ M−1 for K1 and 119 s−1 for k+2. The accuracy of the data at low concentrations was not sufficient to determine k−2, so that we conclude only that it is very much smaller than k+2.
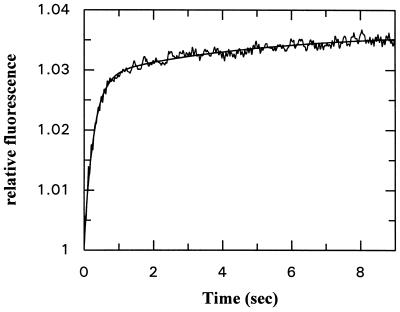
The kinetics of dissociation of GDP from its complex with NG could be examined directly in a different type of experiment. Although it was technically easier to monitor the dissociation of a fluorescent GDP derivative (mantGDP) by displacement with unlabeled GDP, it was important to establish parameters for the natural ligand GDP. This could be done by taking advantage of energy transfer from tryptophan to the mant group. This occurs when a mant nucleotide is bound to the protein because of the proximity of the two fluorescent moieties and the spectral overlap of the tryptophan emission spectrum and the mant excitation spectrum. Since the mant fluorescence is only weakly excited at the tryptophan excitation wavelength (290 nm), a large excess of mantGDP can be used to displace GDP from its complex with NG. Fig. 4 shows the results of such an experiment. It can be seen that the dissociation reaction is biphasic and can be described as the sum of two components with rate constants of 3.7 and 0.21 s−1. A possible explanation for this behavior is that bound GDP is distributed between two states. If we assume that these interconvert directly, which is very likely, we must extend Scheme S1 by an additional step, as shown in Scheme S2,
Figure 4.
Dissociation kinetics of GDP from its complex with FtsY NG fragment. The complex between the NG fragment and GDP was generated by premixing 33.6 μM GDP with 2.2 μM NG fragment in one syringe of a stopped-flow apparatus and mixing with 500 μM mantGDP in the other syringe in the actual experiment. Excitation was at 295 nm, and fluorescence was detected above 389 nm. The continuous line shows a double-exponential fit to the data with rate constants of 3.74 ± 0.10 and 0.21 ± 0.02 s−1.
and assign the slower rate constant to k−3, and the faster one to k−2. The relative amplitudes of the two phases (about 4:1, fast to slow) reflects the magnitude of K3, which is calculated to be 0.25. Thus, this step has little influence on the overall affinity of GDP, which is given by K1[1 + K2(1 + K3)] and calculated to be 8.9 × 10⁵ M−1, or expressed as a Kd value, 1.1 μM. This is somewhat lower than that determined by equilibrium titration, but the agreement is good enough to conclude that the results from the titration and transient kinetic experiments are consistent.
Kinetics of GTP Interaction with the NG Domain of FtsY.
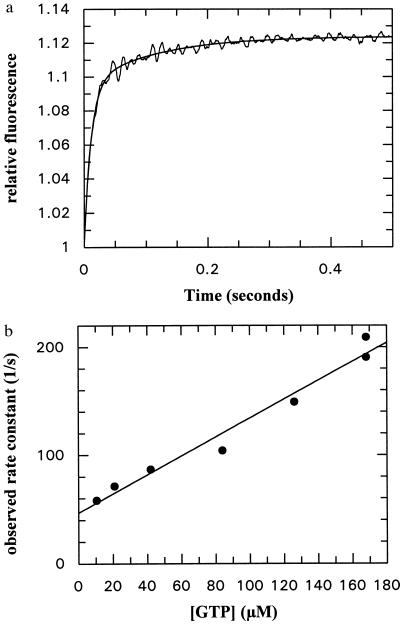
The kinetics of the GTP association reaction were more complex than those of GDP. Whereas the GDP association transients followed a single-exponential course under pseudo-first-order conditions, GTP binding showed biexponential behavior (Fig. 5a). Whereas the second phase stayed approximately constant at a rate of about 10 s−1, the first phase was concentration dependent, varying in a linear fashion with the GTP concentration (Fig. 5b). The slope of the fitted straight line gives the apparent second-order rate constant for the association reaction (8.8 × 10⁵ M−1⋅s−1). In contrast to the situation with GDP, where the corresponding plot started essentially at zero, there is a well defined intercept with the y-axis at 46.6 s−1. In the simplest case, this would represent the dissociation rate constant, but if the binding mechanism is more complex, as is apparent from the transients seen, it is likely to represent the sum of the dissociation rate constant and the rate of equilibration of the next step in the mechanism. Assuming that this is given by the 10 s−1 seen for the second phase in the binding transient, we tentatively assign a value of 36.6 s−1 to the dissociation rate constant of GTP. The ratio of this constant and the slope of the line in Fig. 5b gives the apparent Kd value for GTP (42 μM).
Figure 5.
(a) Association kinetics of GTP and the NG fragment of FtsY. Conditions as in Fig. 3a. The smooth line shows a double-exponential fit to the data with rate constants of 87.6 ± 2.5 and 8.80 ± 0.45 s−1. (b) GTP concentration dependence of the pseudo-first-order rate constant for the first phase of the association reaction with NG fragment. The fitted straight line has a slope of 8.8 ± 0.7 × 10⁵ M−1⋅s−1 and an intercept of 46.63 ± 7.33 s−1.
In contrast to the experiments with GDP, in which the amplitude of the fluorescence transient did not vary significantly with variation of the GDP concentration between 5 and 250 μM, in keeping with the Kd value for GDP (about 2 μM), there was a marked dependence of the amplitude of the transient on the GTP concentration. Plotting the amplitude of the first phase as a function of the GTP concentration led to a hyperbolic dependence with an apparent Kd value of 24 μM. This should correspond to the Kd value calculated from the ratio of the dissociation and association rate constants as described above (42 μM). This agreement is acceptable in view of the probable errors involved, particularly in the measurement of amplitudes in the stopped-flow machine. The amplitude of the second phase stayed approximately constant at 1% of the total signal (maximum for the first phase about 7%). Plotting the total amplitude against the GTP concentration gave a slightly lower value of Kd (15.7 μM), presumably because a second step in the binding was included. This is in reasonable agreement with the value of 10 μM obtained from the equilibrium titration shown in Fig. 2b. Comparison of the values for the Kd calculated for the first phase with the value from both phases or from the equilibrium titration suggests that K2 has a value of about 0.5.
Dissociation of GTP could be monitored directly in the manner described above for GDP. The process was biphasic, with rate constants of 35 s−1 and 5 s−1 for the two phases. We conclude that the first phase corresponds to dissociation of GTP from the first bound state in a two-step mechanism, and corresponds to the value of 36.6 s−1 obtained from the association kinetics. In principle, we can explain the GTP binding and dissociation kinetics with two steps, but it is very unlikely that the value of 8 × 10⁵ M−1⋅s−1 obtained for the association reaction is a genuine second-order association rate constant, since it is several orders of magnitude lower than the diffusion-controlled limit. We therefore conclude, also in analogy to the situation with GDP, that there is a three-step binding mechanism for GTP, as shown in Scheme S2 for GDP.
In the case of GTP, the value of 8.7 × 10⁵ M−1⋅s−1 is assigned to K1 × k+2, with k+2 > 200 s−1 (from the data of Fig. 5b), k−2 = 35 s−1, and k−3 = 5 s−1. We do not have a direct estimate of k+3, but the second phase in the association transients should be determined by the sum of k+3 and k−3. Since the rate of the second phase was ≈10 s−1, we assign a value of ≈5 to the forward rate constant as well. This determines the equilibrium constant of the third step to near unity, which is in agreement with the observation that calculation of the affinity of GTP to FtsY using amplitude data from the association reaction was only slightly affected by including both phases in the titration instead of just the first phase, corresponding to the first two steps in the model.
Kinetics of Interaction of an XTP-Specific Mutant of the NG Domain of FtsY with XDP and XTP.
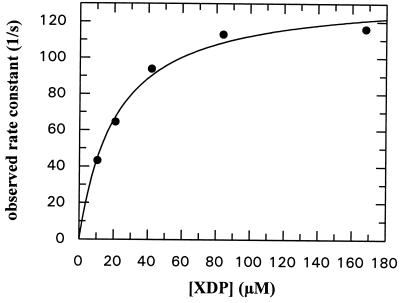
XTP-specific mutants of several GTPases have been prepared and used to investigate the cell biological roles of the respective proteins (11, 25–27). The change in specificity can be accomplished by mutation of the key aspartate in the G4 consensus region (Asp-119 in Ras) to asparagine. The corresponding mutation was introduced at Asp-449 in the NG fragment, and the interaction with XDP and XTP was investigated. XDP association kinetics were similar to those of GDP with wild-type protein, and there was again a hyperbolic dependence of the pseudo-first-order rate constant on the nucleotide concentration (Fig. 6). Using Scheme S1 to describe the binding process, K1 is estimated to be 4.7 × 10⁴ M−1 and k+2 to be 135.9 s−1. Thus, the mutant shows somewhat enhanced binding kinetics with XDP compared with GDP with wild-type protein. No interaction of the mutant could be detected with GDP, just as no interaction of wild-type protein with XDP could be seen. XTP association with the mutant was almost indistinguishable from GTP interaction with wild-type protein, as seen in the very similar values for k+1 (9 × 10⁵ M−1⋅s−1) and the y-axis intercept (49 s−1). Again, the association kinetics were biphasic, with the second phase having a value of ≈8 s−1 in this case. Dissociation kinetics were not examined in detail due to the unavailability of mantXDP, but the dissociation rate constant for mantXTP could be easily measured by displacement with XDP. The value of the rate constant obtained (21 s−1) was very similar to that seen for mantGTP with wild-type protein (23 s−1).
Figure 6.
Concentration dependence of the pseudo-first-order rate constant for the first phase of association of XTP with the Asp-449 → Asn mutant of the NG fragment of FtsY. The fitted hyperbola corresponds to an apparent Kd value of 21.3 ± 3.2 μM and a maximal rate of 135.9 ± 6.1 s−1. Conditions as in Fig. 3.
We conclude from these experiments that, as with several other GTPases, mutation of the aspartate group involved in base recognition to asparagine results in complete and quantitative change of specificity from GTP to XTP. The structure of the NG domain of the mutant Asp-449 → Asn of FtsY does not display any difference from the wild-type structure except for the mutated residue (G. Montoya, O.M. and I.S., unpublished results).
DISCUSSION
The presence of a tryptophan residue in the NG domain of FtsY provides a potential monitor for the interaction of the protein with nucleotides. Equilibrium fluorescence titrations showed that the binding of both GDP and GTP results in an increase in tryptophan fluorescence, and such titrations showed that both nucleotides are bound with very low affinity in comparison with other GTPases, such as the heterotrimeric G proteins or members of the Ras superfamily.
The change in tryptophan fluorescence can also be used to study the kinetics of interaction of FtsY with nucleotides, and application of the stopped-flow method has led to the conclusion that binding of both GDP and GTP is a multistep process. Other GTPases that have been investigated at this level all show at least two-step binding of nucleotides. The association kinetics of GDP with FtsY initially appear very similar to those of Ras (17), EF-Tu (18), and Rab (19), with a weak but rapid initial binding step being followed by a relatively slow isomerization reaction. The rates of this step (k+2 in Scheme S1) are approximately 20 s−1 (Ras), 400 s−1 (EF-Tu), and 80 s−1 (Rab7), compared with 119 s−1 for FtsY. There is, however, a major difference in the reverse rate constant for this step (k−2 in Scheme S1) in FtsY compared with the other GTPases. Whereas this rate constant has a value of 10−3 to 10−5 s−1 for the other proteins, it is 3.7 s−1 for FtsY. The high value of this rate constant is the reason for the low affinity of FtsY for GDP (Kd ≈ 2 μM; compare 10−11 M for Ras). There is evidence from the dissociation kinetics that there is at least one more step involved in the binding reaction of GDP, but this appears to have a low equilibrium constant and therefore have little affect on the affinity.
Experiments with GTP show that this is bound less strongly than GDP (Kd ≈ 10 μM). As with GDP, the binding mechanism is complex and also appears to involve three steps. There is an even higher rate of GTP dissociation from the main species present at equilibrium (≈35 s−1), and this, coupled with the slow effective rate of binding, leads to a very low value of the affinity compared with other GTPases.
The kinetics of interaction of GDP and GTP with FtsY are quantitatively different from those of other GTPases. However, they are similar to those seen with other GTPases in the presence of an exchange factor (Table 1). A well documented example of this is that of Ran with its exchange factor RCC1. Ran binds GTP, and particularly GDP, with very high affinity (1010 and 1011 M−1, respectively; ref. 28). In the ternary complex with the RCC1, these affinities are reduced to about 105 and 104 M−1 respectively. Interestingly, this reduction of affinity is achieved by increasing the dissociation rate of the nucleotides by many orders of magnitude to about 20 s−1. The association rate constants are not dramatically different in the presence and absence of exchange factors and are much too slow to be diffusion controlled, again suggesting a complex binding mechanism. New evidence on EF-Tu (S. Nock, J. Simon, M. Sprinzl, and R.S.G., unpublished data) and Ras (R. H. Cool, C. Lenzen, H. Prinz, and A. Wittinghofer, personal communication) indicates that the situation is very similar with the exchange factors for these GTPases. Previous work has suggested that the dissociation rate constants of GDP and GTP from the EF-Tu/EF-Ts complex are several orders of magnitude higher than from EF-TU (29). Thus, the kinetics of interaction of FtsY with guanosine nucleotides are qualitatively and quantitatively similar to those of other GTPases as complexes with their exchange factors. This suggests a fundamental difference in the details of the GTPase cycle with FtsY in comparison with the other GTPases.
The recently determined structure of the NG domain of FtsY gives some indications for the reasons for the low affinity for nucleotides (14). As pointed out, in comparison to Ras with a bound nucleotide, the GTP binding site in FtsY is opened up in the sense that the conserved sequence elements responsible for GTP and GDP binding are spread out. G1 (the P-loop) superimposes well for the two structures, as does G3 (382DTAGR386). However, the aspartate residue of G4 (446TKLD), the main determinant of base specificity, would have to move ≈2.5 Å to interact with the guanine base. This in turn would involve a movement of the N terminus of the N domain, a process that presumably costs energy and therefore results in a lowering of affinity. The G2 region (330DTFRAA) contains the threonine that is equivalent to Thr-35 in Ras, and it is known that this residue interacts with the Mg2+ ion and the γ-phosphate of GTP, but moves away and is not involved with nucleotide binding in the GDP form. As already concluded (14), because Thr-331 appears to be fixed in this position by interactions with an insertion in this region (the I-box), this could contribute to decreased affinity of GTP compared with GDP. The I-box is present in all SRP-type GTPases, and therefore we expect similar kinetics for other SRP-receptor proteins as well as for SRP54 homologues. Since the I-box is inserted into the G domain in a way that is reminiscent of the interaction between the ras-binding-domain (RBD) of Raf kinase in complex with Rap1A (30), we have previously concluded that it might be a built-in effector (14). However, considering the results presented here, it seems more likely that the I-box plays the role of a nucleotide exchange factor. So far, there is only one x-ray structure of a GTPase in complex with a nucleotide exchange factor known, the EF-Tu/EF-Ts complex from E. coli without bound nucleotide (31). Here, the major effect of complex formation on the structure of EF-TU has been described as the disruption of the Mg2+ binding site, thereby decreasing the affinity for guanine nucleotides. The interaction of EF-Ts with the switch II region (adjacent to G3) of EF-TU leads to a displacement of helix B. The corresponding helix (α4) in FtsY is stabilized by interactions with α3 of the I-box. A superposition with FtsY shows that part of the I-box corresponds to the C terminus of the exchange factor EF-Ts (a more detailed comparison of the different structures will be presented elsewhere).
The complex binding mechanism for nucleotides to FtsY is easily understood in general terms on the basis of the “open” structure of the active site. Presumably, when nucleotide is bound, the individual groups and regions discussed above must move into positions that are essentially identical with those seen in the other GTP-binding proteins. Because these interactions cannot all take place in a single step, it is logical that they should occur stepwise. For Ras, detailed kinetic investigations have led to the suggestion that the first interaction might occur between the protein and the oxygen at position 6 of the guanine base, and that in a step or steps following this, further interactions with the base and the phosphates are made (32). Based on the structure of nucleotide-free FtsY, this would involve pulling the components of the binding site together in this particular case. The fact that this costs energy means that the tendency to open is high, which presumably leads to the high dissociation rate constant. Our working hypothesis for the SRP cycle is that the I-box in FtsY moves upon complex formation with Ffh. The closed form of the GTP binding site is stabilized, thus increasing the nucleotide affinity. This hypothesis will be tested in future experiments. Most GTPases have low dissociation rate constants for GDP (see Table 1), which explains the need for exchange factors. So far, the low affinity of SRP GTPases was not well understood and no exchange factor for SRP GTPases has been identified. Our results show that this puzzling difference is at least in part due to a built-in exchange factor. The remaining puzzle concerns the manner in which FtsY and Ffh activate each other’s GTPase and which parts of these proteins serve as the GAPs.
Table 1.
Nucleotide binding to the NG domain of FtsY and comparison with other GTPases
| Protein | Nucleotide | K1, M−1 | k+2, s−1 | k−2, s−1 | Kd, M |
|---|---|---|---|---|---|
| NG FtsY | GDP (20°C) | 2.15 × 10⁴ | 119 | 3.7 | 2.14 × 10⁻⁶* |
| GTP (20°C) | 2.37 × 10⁴ | >200 | 35 | 10.7 × 10⁻⁶* | |
| Ras-p21 (17) | GDP (25°C) | 5.7 × 10⁴ | 14.8 | 1.8 × 10⁻⁵ | 2.17 × 10⁻¹¹ |
| GTP (25°C) | 1.25 × 10⁵ | 16.7 | 1.7 × 10⁻⁵ | 8.14 × 10⁻¹² | |
| Ran (28) | GDP (25°C) | 1.5 × 10⁻⁵ | 6 × 10⁻¹² | ||
| GTP (25°C) | 11 × 10−5 | 3.8 × 10⁻¹¹ | |||
| Ran/RCC1 (28) | GDP (25°C) | 21.1 | 8.06 × 10⁻⁷ | ||
| GTP (25°C) | 19 |
Measurements from equilibrium titrations.
Acknowledgments
We thank Cecilia Svensson for excellent technical assistance, Guillermo Montoya for many helpful discussions and suggestions, and Andrea Beste for preparation of mant nucleotides. C.M. is supported by the European Union Grant ERBCHBGCT920072. O.M. is supported by a TMR-Network Grant to I.S. (ERBFMRXCT-960035).
Footnotes
This paper was submitted directly (Track II) to the Proceedings Office.
Abbreviations: SRP, signal recognition particle; GAP, GTPase-activating protein; mant, methylanthraniloyl.
References
- 1.Bukau B, Hesterkamp T, Luirink J. Trends Cell Biol. 1996;6:480–486. doi: 10.1016/0962-8924(96)84946-4. [DOI] [PubMed] [Google Scholar]
- 2.Lütcke H. Eur J Biochem. 1995;228:531–550. doi: 10.1111/j.1432-1033.1995.tb20293.x. [DOI] [PubMed] [Google Scholar]
- 3.Poritz S, Bernstein H D, Strub K, Zopf D, Wilhelm H, Walter P. Science. 1990;250:1111–1117. doi: 10.1126/science.1701272. [DOI] [PubMed] [Google Scholar]
- 4.Ribes V, Roemisch K, Giner A, Dobberstein B, Tollervey D. Cell. 1990;63:591–600. doi: 10.1016/0092-8674(90)90454-m. [DOI] [PubMed] [Google Scholar]
- 5.Luirink J, ten Hagen-Jongman C, van der Weijden C C, Oudega B, High S, Dobberstein B, Kusters R. EMBO J. 1994;13:2289–2296. doi: 10.1002/j.1460-2075.1994.tb06511.x. [DOI] [PMC free article] [PubMed] [Google Scholar]
- 6.Seluanov A, Bibi E. J Biol Chem. 1996;272:2053–2055. doi: 10.1074/jbc.272.4.2053. [DOI] [PubMed] [Google Scholar]
- 7.Ulbrandt N D, Newitt J A, Bernstein H D. Cell. 1997;88:187–196. doi: 10.1016/s0092-8674(00)81839-5. [DOI] [PubMed] [Google Scholar]
- 8.DeGier J-W L, Valent G A, von Heijne G, Luirink J. FEBS Lett. 1997;408:1–4. doi: 10.1016/s0014-5793(97)00402-x. [DOI] [PubMed] [Google Scholar]
- 9.Miller J D, Bernstein H D, Walter P. Nature (London) 1994;367:657–659. doi: 10.1038/367657a0. [DOI] [PubMed] [Google Scholar]
- 10.Kusters R, Lentzen G, Eppens E, van Geel A, van der Weijden C C, Wintermeyer W, Luirink J. FEBS Lett. 1995;372:253–258. doi: 10.1016/0014-5793(95)00997-n. [DOI] [PubMed] [Google Scholar]
- 11.Powers T, Walter P. Science. 1995;269:1422–1424. doi: 10.1126/science.7660124. [DOI] [PubMed] [Google Scholar]
- 12.Bourne H R, Sanders D A, McCormick F. Nature (London) 1991;349:117–127. doi: 10.1038/349117a0. [DOI] [PubMed] [Google Scholar]
- 13.Bourne H R, Sanders D A, McCormick F. Nature (London) 1990;348:125–132. doi: 10.1038/348125a0. [DOI] [PubMed] [Google Scholar]
- 14.Montoya G, Svensson C, Luirink J, Sinning I. Nature (London) 1997;385:365–368. doi: 10.1038/385365a0. [DOI] [PubMed] [Google Scholar]
- 15.Freymann D M, Keenan R J, Stroud R M, Walter P. Nature (London) 1997;385:361–364. doi: 10.1038/385361a0. [DOI] [PubMed] [Google Scholar]
- 16.Boguski M S, McCormick F. Nature (London) 1993;366:643–653. doi: 10.1038/366643a0. [DOI] [PubMed] [Google Scholar]
- 17.John J, Sohmen R, Feuerstein J, Linke R, Wittinghofer A, Goody R S. Biochemistry. 1990;29:6058–6065. doi: 10.1021/bi00477a025. [DOI] [PubMed] [Google Scholar]
- 18.Wagner A, Simon I, Sprinzl M, Goody R S. Biochemistry. 1995;34:12535–12542. doi: 10.1021/bi00039a007. [DOI] [PubMed] [Google Scholar]
- 19.Simon I, Zerial M, Goody R S. J Biol Chem. 1996;271:20470–20478. doi: 10.1074/jbc.271.34.20470. [DOI] [PubMed] [Google Scholar]
- 20.Montoya G, Svensson C, Luirink J, Sinning I. Proteins. 1997;28:285–288. doi: 10.1002/(sici)1097-0134(199706)28:2<285::aid-prot15>3.0.co;2-e. [DOI] [PubMed] [Google Scholar]
- 21.Landt O, Grunert H-P, Hahn U. Gene. 1990;96:125–128. doi: 10.1016/0378-1119(90)90351-q. [DOI] [PubMed] [Google Scholar]
- 22.Bradford M M. Anal Biochem. 1976;72:248–254. doi: 10.1016/0003-2697(76)90527-3. [DOI] [PubMed] [Google Scholar]
- 23.Tucker J, Sczakiel G, Feuerstein J, John J, Goody R S, Wittinghofer A. EMBO J. 1986;5:1351–1358. doi: 10.1002/j.1460-2075.1986.tb04366.x. [DOI] [PMC free article] [PubMed] [Google Scholar]
- 24.Bagshaw C E, Eccleston J F, Eckstein F, Goody R S, Gutfreund H, Trentham D R. Biochem J. 1974;141:351–364. doi: 10.1042/bj1410351. [DOI] [PMC free article] [PubMed] [Google Scholar]
- 25.Hwang Y-W, Miller D L. J Biol Chem. 1987;262:13081–13087. [PubMed] [Google Scholar]
- 26.Schmidt G, Lenzen C, Simon I, Deuter R, Cool R H, Goody R S, Wittinghofer A. Oncogene. 1996;12:87–96. [PubMed] [Google Scholar]
- 27.Rybin V, Ullrich O, Rubino M, Alexandrov K, Simon I, Seabra C, Goody R S, Zerial M. Nature (London) 1996;383:266–269. doi: 10.1038/383266a0. [DOI] [PubMed] [Google Scholar]
- 28.Klebe C, Bischoff F R, Ponstingl H, Wittinghofer A. Biochemistry. 1995;34:639–647. doi: 10.1021/bi00002a031. [DOI] [PubMed] [Google Scholar]
- 29.Romero G, Chau V, Biltonen R L. J Biol Chem. 1985;260:6167–6174. [PubMed] [Google Scholar]
- 30.Nassar N, Horn G, Herrmann C, Scherer A, McCormick F, Wittinghofer A. Nature (London) 1995;375:554–560. doi: 10.1038/375554a0. [DOI] [PubMed] [Google Scholar]
- 31.Kawashima T, Berthet-Colominas C, Wulff M, Cusack S, Leberman R. Nature (London) 1996;379:511–518. doi: 10.1038/379511a0. [DOI] [PubMed] [Google Scholar]
- 32.Rensland H, John J, Linke R, Simon I, Schlichting I, Wittinghofer A, Goody R S. Biochemistry. 1995;34:593–599. doi: 10.1021/bi00002a026. [DOI] [PubMed] [Google Scholar]


