

Abstract
Cytokines and microglia have been implicated in anxiety, depression, neurodegeneration as well as the regulation of alcohol drinking and other consumatory behaviors, all of which are associated with alcoholism. Studies using animal models of alcoholism suggest that microglia and proinflammatory cytokines contribute to alcoholic pathologies (Crews et al., 2006). In the current study, human postmortem brains from moderate drinking controls and alcoholics obtained from the New South Wales Tissue Resource Center were used to study the cytokine, monocyte chemoattractant protein 1 (MCP-1,CCL2) and microglia markers in various brain regions. Since MCP-1 is a key proinflammatory cytokine induced by chronic alcohol treatment of mice, and known to regulate drinking behavior in mice, MCP-1 protein levels from human brain homogenate were measured using ELISA, and indicated increased MCP-1 concentration in ventral tegmental area (VTA), substantia nigra (SN), hippocampus and amygdala of alcoholic brains as compared with controls. Immunohistochemistry was further performed to visualize human microglia using ionized calcium binding adaptor protein-1 (Iba-1), and Glucose transporter-5 (GluT5). Alcoholics were found to have brain region-specific increases in microglial markers. In cingulate cortex, both Iba-1 and GluT5 were increased in alcoholic brains relative to controls. Alternatively, no detectable change was found in amygdala nuclei. In VTA and midbrain, only GluT5, but not Iba-1 was increased in alcoholic brains. These data suggest that the enhanced expression of MCP-1 and microglia activities in alcoholic brains could contribute to ethanol-induced pathogenesis.
Keywords: Alcohol, MCP-1, microglia, Iba-1, GluT5, human
Introduction
Alcohol (ethanol) is a common dietary constituent that modulates the immune system. Although moderate alcohol consumption has a protective effect on heart diseases and appears to have health benefits, heavy drinking increases mortality by escalating the risk of many diseases, especially disorders of the central nervous system (Nelson and Kolls, 2002). In humans, chronic alcohol consumption is associated with increases in serum proinflammatory cytokines including TNFα and IL-1β (McClain and Cohen, 1989; McClain et al., 1999). Monocytes isolated from the blood of alcoholics produce greater amounts of TNFα, a proinflammatory cytokine, spontaneously and in response to endotoxin challenge (McClain et al., 2004). The current study is designed to further investigate the roles of microglial recruitment and activation in alcohol induced inflammatory neurodegeneration (Lee et al., 2004; Crews et al., 2006; Pascual et al., 2007).
Microglia, as the resident monocyte/macrophage in CNS parenchyma (Gehrmann et al., 1995), play an important role in the brain having both a beneficial healing and a toxic inflammatory role. Under resting conditions, microglia exhibit a quiescent phenotype as indicated by a ramified morphology, and constitutive expression of macrophage antigens such as ionized calcium binding adaptor protein –1 (Iba-1) (Ladeby et al., 2005). In response to a multitude of CNS pathological conditions and systemic infectious processes, microglia transform from a resting to an active state characterized by cellular enlargement, amoeboid morphology, increased membrane ruffles and projections and upregulation of several cell surface molecules and proteins (Block et al., 2007). Iba-1 is a microglia/macrophage-specific protein that participates in the ruffling and phagocytosis of activated microglia in human, rats and mice (Ohsawa et al., 2004). Glucose transporter type 5 (GluT5) is another microglia specific protein (Horikoshi et al., 2003; Sasaki et al., 2004), whose expression contributes to the kinetics of cerebral metabolism (Vannucci et al., 1997). Thus, studying the expression of Iba-1 and GluT5 can provide critical information on microglia recruitment, morphological transformation and functional activation after life-long alcohol exposure in human alcoholic brains.
Furthermore, monocyte chemoattractant protein-1 (MCP-1, also known as CCL2) is a key cytokine mediating CNS inflammation and alcohol drinking behavior (Blednov et al., 2005). As a predominant chemoattractant, MCP-1 causes the migration and activation of microglia (McManus et al., 2000), whose secretions of proinflammatory cytokines can be neurotoxic (Kaul et al., 2001; Little et al., 2002; Mahad and Ransohoff, 2003; Persidsky and Gendelman, 2003). As a potential neurotoxin, enhanced expression of MCP-1 increases the volume of an infarct after middle cerebral artery (MCA) occlusion (Chen et al., 2003), whereas MCP-1 knockout mice have smaller infarcts and less neuronal loss compared to their wild-type controls (Hughes et al., 2002). The production of the proinflammatory cytokines such as IL-1β (interleukin-1 beta) and TNFα (tumor necrosis factor alpha) is significantly reduced in MCP-1 knockout mice challenged with LPS (lipopolysaccharide) (Rankine et al., 2006). These knockout mice also exhibit a substantial reduction in alcohol consumption and preference (Blednov et al., 2005). Therefore, the level of MCP-1 expression in human alcoholic brain is critical for further understanding the mechanisms of alcohol-induced neuroinflammation.
The current study was designed to investigate the inflammatory status in postmortem alcoholic brains by determining microglial activities using Iba-1 and GluT5 labeling, and the key inflammatory cytokine, MCP-1, expression. Results indicate increased MCP-1 protein levels in ventral tegmental area (VTA), substantia nigra (SN), hippocampus and amygdala of alcoholic brains compared to controls. Furthermore, increased microglia expressions of Iba-1 and/or GluT5 in specific regions of alcoholic brain were found.
Methods
Tissue Source
Human postmortem brain tissue was obtained from the New South Wales Tissue Resource Center in Australia [ethics committee approval number: HREC2002/2/3.14 (1441) and X03-0117]. Both paraffin sections for microglial staining and fresh frozen brain tissue for ELISA were used in this study. The detailed patients’ medical history is presented in tables 1 and 2.
Table 1.
Case characteristics of subjects used for immunohistochemical analyses of the Cingulate Cortex.
| Patient ID | Groups | Age | Sex | PMI | Clinical cause of death | Smoking | Daily intake/type |
|---|---|---|---|---|---|---|---|
| A094 | Control | 55 | Male | 20 | Cardiac arrest | Ex smoker | Nil |
| A211 | Control | 50 | Male | 29 | Ischaemic Heart Disease | Nil | Nil |
| A239 | Control | 37 | Male | 24 | Electrocution | Unknown | Nil |
| A247 | Control | 46 | Male | 25 | Mitral valve prolapse | Unknown | Nil |
| B180 | Alcoholic | 34 | Male | 8.5 | Hanging | 1 pkt/day | 160 gms |
| B201 | Alcoholic | 46 | Male | 24 | Alcohol toxicity | Unknown | 150g beer |
| B210 | Alcoholic | 51 | Male | 27 | Gastrintestinal Haemorrhage | 1 pkt/day | 150g beer/spirits |
| B221 | Alcoholic | 61 | Male | 28 | Multiple Organ failure | Unknown | > 80g beer |
| B238 | Alcoholic | 52 | Male | 35 | Alcohol toxicity | Nil | 300g spirits |
PMI: post-mortem interval
Table 2.
Case characteristics of subjects used for immunohistochemical analyses of Midbrain, VTA, Amygdala, and for ELISA analyses of VTA, SN, Amygdala and Hippocampus.
| Patient ID | Groups | Age | Sex | PMI | Clinical cause of death | Smoking | Daily intake/type |
|---|---|---|---|---|---|---|---|
| A312 | Control | 82 | Male | 23.5 | Multiple organ failure | Unknown | <20g beer |
| A317 | Control | 78 | Female | 37 | Acute myocardial infarction | Unknown | Nil |
| A339 | Control | 56 | Male | 37 | Left ventricular scarring, hypertension, and cardiomegaly | 15 cigs/day | 10g |
| A357 | Control | 66 | Female | 6 | Pneumonia and multiple CVA’s | Nil | Nil |
| A367 | Control | 57 | Male | 18 | Ischemic heart disease | Ex smoker | 10g |
| A384 | Control | 60 | Male | 25 | carcinomatosis, gastrointestinal stomach tumor | Nil | 20g beer |
| A395 | Control | 60 | Male | 28 | Ischemic heart disease | Nil | 20g beer |
| A398 | Control | 54 | Male | 29 | Coronary artery atheroma | Nil | <20g beer |
| B315 | Alcoholic | 52 | Male | 45.5 | Lobar pneumonia and chronic Alcoholism | 1 pkt/day | 500g spirits |
| B221 | Alcoholic | 61 | Male | 28 | Multiple Organ Failure | Unknown | >80g beer |
| B253 | Alcoholic | 56 | Male | 22 | Coronary artery disease & upper gastro-intestinal hemorrhage | 1 pkt/day | 80g wine |
| B285 | Alcoholic | 67 | Female | 68 | Hepatic & renal failure | Nil | 80g beer |
| B298 | Alcoholic | 80 | Male | 28 | Cardiopulmonary arrest | 5 pkt/day | >80g beer |
| B322 | Alcoholic | 56 | Male | 29–31 | Complications of liver disease | 1 pkt/day | 100 g beer |
| B401 | Alcoholic | 60 | Male | 51 | Hepatic cirrhosis and its Consequences | Nil | >80g |
| B402 | Alcoholic | 75 | Female | 9 | Hepatic encephalopathy and spontaneous bacterial peritonitis, | Nil | 120 g beer |
PMI: post-mortem interval; VTA: ventral tegmental area; SN: substantia nigra; ELISA: enzyme-linked immunosorbent assay.
Enzyme-Linked Immunosorbent Assay (ELISA)
Frozen brain samples were homogenized in the buffer containing: 20mM Tris, 0.25mM sucrose, 2mM EDTA, 10mM EGTA, and 1% Triton X-100. One protease inhibitor cocktail tablet (Roche Diagnostics, Germany) was added into each 10ml of the homogenization buffer. The homogenate was then centrifuged at 100,000g (Beckman Ultracentrifuge) for 45 min at 4°C and supernatants were collected and total protein content was determined by using BCA protein Assay Reagent Kit (Pierce, Rockfold, IL) to ensure that an equal amount of protein from each sample was used for the assay. The MCP-1 ELISA was conducted using Human MCP-1 immunoassay kit (R&D systems, Minneapolis, MN) and the manufacture’s protocol was followed. The optical density of each sample was determined using Spectra Max microplate reader (Molecular Devices, Sunnyvale, CA) and the concentration of MCP-1 was calculated based on standards and expressed in pg/mg of total protein content.
Immunohistochemistry
Paraffin sections were deparaffinized in Xylene for 30 min and rehydrated in a series of ethanol from 100% to 50%. The slices were then washed in Tris-buffered saline (TBS) buffer for 15min. Antigen retrieval was done by incubating the section in Citra solution (BioGenex, San Ramon, CA) in a steamer for 30min. The antibodies against rabbit Iba-1 (Wako Pure Chemical Industries, Japan) or rabbit-GluT5 (IBL, Japan) were used at a dilution of 1:400 and 1:20 respectively with overnight incubation at 4°C. Sections were then rinsed TBS, and incubated with biotinylated goat anti-rabbit secondary antibody (Vector Laboratories, Burlingame, CA, USA) at a dilution of 1:200 at room temperature for 2hr. Subsequently, avidin-biotin-peroxidase complex (ABC Elite Kit, Vector Laboratories) was applied for 1hr at room temperature. Finally, the positive cells were visualized using nickel-enhanced diaminobenzidine (DAB) as a chromagen.
Microscopic Quantification
Both Iba-1 and GluT5 (Glucose transporter 5) positive cells were quantified using image analysis software (Bioquant Nova Advanced Image Analysis, R&M Biometric, Nashville, TN). Images were captured on an Olympus BX50 microscope and Sony DCX-390 video camera at 40X. Light levels were normalized to preset levels and the microscope, camera, and software were background corrected to ensure reliability of image acquisition (Crews et al., 2004). In each region (cingulate cortex, midbrain, VTA, and amygdala), three random images from each brain sample were captured within a standard ROL (Region of Interest), and staining density was measured in pixels within this area (pixels/mm2). Subsequently, the average of the three measurements was used to represent the immunoreactivity of each sample.
Statistics
All values were reported as mean ± SEM, and analyzed by ANOVA, and Pearson correlation test using SPSS. Differences were considered significant if the p value was smaller than 0.05.
Results
The demographic characteristics of control and alcoholic subjects are given in Table 1 and 2. Mean ages in MCP-1 study using frozen brain homogenates were not significantly different being 60.8 ± 3.6 years old in controls and 63.8 ± 3.1 years old in alcoholics. The mean postmortem interval (PMI) was 29.0 ± 3.0 in controls and 36.6 ± 6.0 in alcoholics. One-way ANOVA analyses indicated no significant differences in age (F(1,13) = 0.38, p=0.55), or PMI (post-modem interval) (F(1,13) =0.96, p=0.35) between alcoholics and controls. For the study using cingulate cortex paraffin sections, the mean ages of the subjects were 47 ± 3.8yr in the control group and 49 ± 4.4yr in the alcoholic group. The average PMIs in these populations were 24.5 ± 1.8hr in controls and 24.5 ± 4.4hr in alcoholics. ANOVA indicated no significant differences in age (F(1,7) =0.89, p=0.77) or PMI (F(1,7) =0.00, p=1.0) between control and alcoholic groups. The mean ages of the subjects providing paraffin sections for VTA, midbrain, and amygdala were 64.1 ± 3.7yr in control group and 63.4 ± 3.5yr in alcoholic group. The average PMIs for these subjects were 25.4 ± 3.6hr in controls and 31.4 ± 7.9hr in alcoholics. No significant differences were found in age (F(1,14) =0.02, p=0.86) or PMI (F(1,14) =0.48, p=0.50) between control and alcoholic groups. In addition, we looked at smoking history and gender as factors. However, we were not able to analyze these variables separately due to the small sample size. These results suggest that neither age nor PMI were different between control and alcoholic groups.
Increased MCP-1 Protein Concentration in Various Regions of the Alcoholic Brains
The MCP-1 protein concentration (pg/mg of total protein) determined by ELISA was compared in each brain region between alcoholics and control brains (Fig. 1). In VTA, the average MCP-1 concentrations were 212.6 ± 43.5 pg/mg in alcoholic brains (n=7), and 90.2 ± 20.9 pg/mg in controls (n=6), and a significant two-fold increase in MCP-1 in alcoholic brains was detected by ANOVA (F(1,11) =5.8, p=0.035). In the substantia nigra (SN), the MCP-1 concentration was 314.04 ± 59.6 pg/mg in alcoholics (n=6), which is significantly higher than controls (121.0 ± 14.3 pg/mg in controls, n=5) [ANOVA (F(1,9) =8.3, p=0.018)]. In the hippocampus, MCP-1 levels were 243.14 ± 40.0 pg/mg in alcoholics (n=8) and 106.46 ± 24.1 pg/mg in controls (n=6) [ANOVA (F(1,13) =6.6, p=0.023]. Similarly, in the amygdala nuclei, the MCP-1 concentration in alcoholics was 322.55 ± 70.5 pg/mg (n=8), which is almost three-fold higher than that of the controls (113.26 ± 25.6 pg/mg, n=6) [ANOVA (F(1,12) =6.0, p=0.03)]. In addition, Pearson tests indicted no significant correlations were found between MCP-1 concentrations and age or PMI in all regions studied (p values > 0.05). These data indicate that alcoholic brains have significantly higher MCP-1 levels than those of controls across multiple limbic brain regions.
Fig. 1.
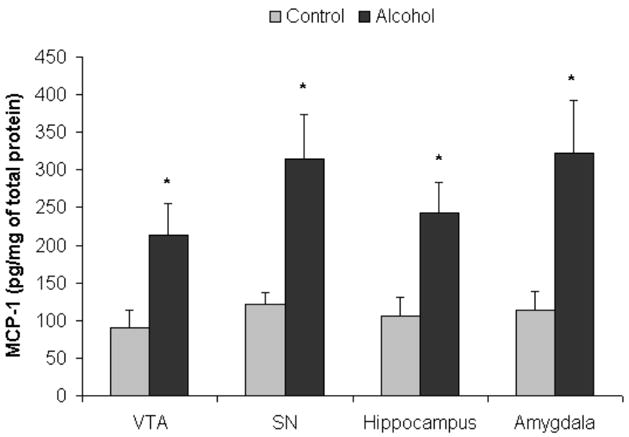
Increased MCP-1 protein concentrations in alcoholic brains. MCP-1 protein concentrations (pg/mg of total protein) from brain homogenate were measured using ELISA represented as mean ± SEM. Using ANOVA, significantly increased MCP-1 expression was detected in alcoholics as compared to control of in VTA (ventral tegmental area) of alcoholics as compared with controls (*, p<0.05, N=5 controls, N=7 alcoholics), in substantia nigra (SN) (* p<0.05, N=5 controls, N=6 alcoholics), in hippocampus (*, p<0.05, N=6 controls, N=8 alcoholics), and in amygdala (*, p<0.05, N=6 controls, N=8 alcoholics).
Increased Microglial Expression of Iba-1 and GluT5 in Different Brain Regions of the Alcoholic Brains
To investigate microglia in various brain regions, the immunoreactivity of two specific microglia markers: Iba-1 and GluT5 were determined. Stages of microglia activation were assessed based on their morphological characteristics from ramified resting stage to bushy-looking early activation, and then to activated ameboid-like brain macrophages (Ladeby et al., 2005). In both controls and alcoholic brains, microglia were found in all stages of activation (Fig.2). Within all brain regions examined, many of the microglia had a variable morphology but there were no clear differences between control and alcoholic brains in degree of microglial activation, as indicated by morphology. However, alcoholic brains had considerable upregulation in microglial marker immunoreactivity in several brain regions when measured with image analysis software (BioQuant). In cingulate cortex (Fig. 3, Table 3), the immunoreactive density (pixel/mm2) of alcoholics was significantly increased for 214 ± 11% in Iba-1 (F(1,7) =11.7, p=0.01) and 194 ± 25% in GluT5 (F(1,7) =9.9, p=0.016). In VTA (Fig. 4, Table 3), GluT5 immunoreactivity was increased significantly in alcoholics for 175 ± 17% (F(1,14) =12.5, p=0.003) compared to controls, but no statistical difference in Iba-1 was found (F(1,14) =1.18, p=0.30). Similarly, in the midbrain (Fig. 5, Table 3), alcoholics had increased GluT5 immunoreactivity for 156 ± 13% (F(1,9) =22.66, p=0.01), but not Iba-1 (F(1,9) =0.48, p=0.51) as compared with controls. In amygdala nuclei (Fig. 6, Table 3), the immunoreactivity to neither Iba-1 (F(1,14) =0.32, p=0.58) nor GluT5 (F(1,14) =0.58, p=0.46) was significantly different between alcohol and control brains. In addition, none of these immunoreactive measures was significantly correlated with either age or PMI by Pearson tests (p values > 0.05). Taken together, these data indicated that the expression of the specific microglial markers in alcoholics is increased in cingulate cortex, but not in amygdala, as compared to controls. In VTA and midbrain, enhanced GluT5 staining was found in alcoholic brains.
Fig.2.
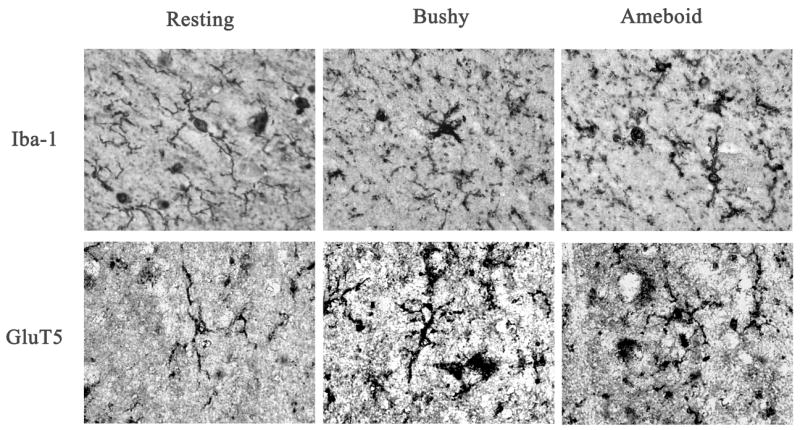
Representative pictures of different stages of microglia activation. Ramified microglial cells are believed to be in the resting stage; the bushy-looking microglia indicates early activation; ameboid microglia represent fully activated brain macrophages.
Fig. 3.
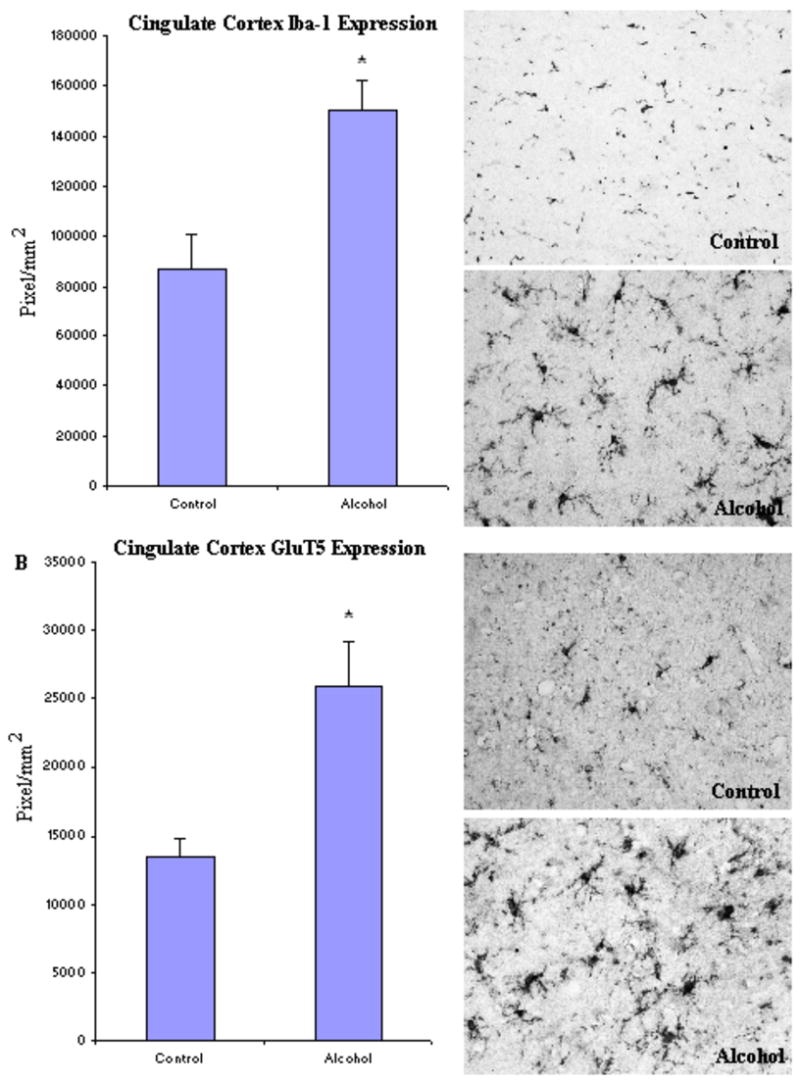
In cingulate cortex, the expression of both Iba-1 and GluT5 was significantly increased in the alcoholic brains (N=5) as compared to the controls (N=4). The level of immunoreactive density was quantified by BioQuant Nova analysis system as described in the Methods and presented as mean ± SEM in pixel/mm2. ANOVA indicated significant differences in immunoreactive density of both Iba-1 and GluT5 between control and alcoholic groups (*, p<0.05).
Table 3.
Immunoreactivity of Iba-1 and GluT5 in various brain regions
| Regions | Control Group Mean ± SEM; N | Alcoholic Group Mean ± SEM; N | P value T Test |
|---|---|---|---|
| Iba-1 Immunoreactivity(pixel/mm2 X103) | |||
| Cingulate | 70.0 ± 13.7
N = 4 |
150.1 ± 12.3
N = 5 |
P = 0.01 * |
| VTA | 277.9 ± 31.4
N = 8 |
340.9 ± 48.8
N = 8 |
P = 0.30 |
| Midbrain | 172.8 ± 21.9
N = 6 |
152.7 ± 17.4
N = 5 |
P = 0.50 |
| Amygdala | 217.7 ± 18.5
N = 8 |
230.3 ± 12.7
N = 8 |
P = 0.58 |
|
| |||
| GluT5 Immunoreactivity (pixel/mm2 X103) | |||
| Cingulate | 13.4 ± 1.4
N = 4 |
26.0 ± 3.3
N = 5 |
P = 0.02 * |
| VTA | 25.7 ± 3.3
N = 8 |
45.0 ± 4.3
N = 8 |
P = 0.003 * |
| Midbrain | 32.1 ± 3.2
N = 6 |
50.1 ± 1.6
N = 5 |
P = 0.01 * |
| Amygdala | 28.4 ± 3.6
N = 8 |
32.1 ± 3.3
N = 8 |
P = 0.46 |
The immunoreactive density measured by BioQuant Nova systems as described in the Methods and presented as mean ± SEM in pixel/mm2. ANOVA was conducted in each region and p values are reported.
: p<0.05 indicating statistical significance. Iba-1: ionized calcium binding adaptor protein-1; GluT5: Glucose transporter-5; VTA: ventral tegmental area.
Fig. 4.
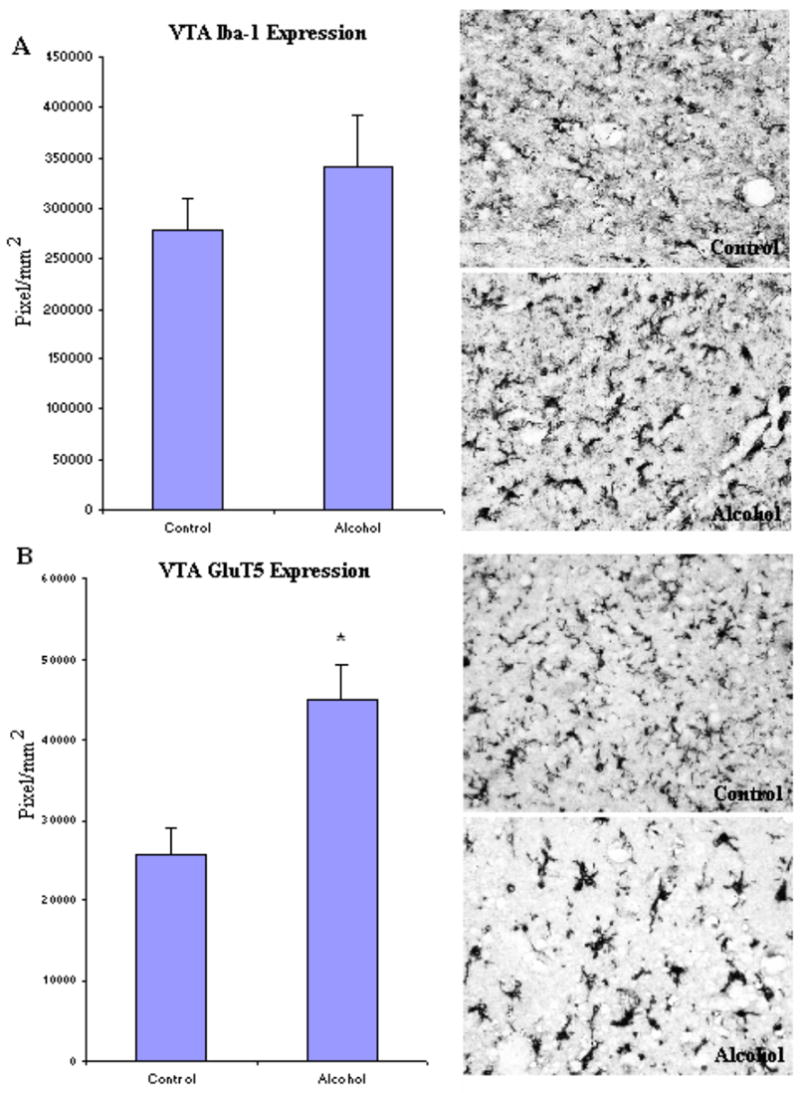
In VTA, the expression of GluT5, but not Iba-1 was significantly higher in the alcoholic brains (N=8) than controls (N=8). The immunoreacitve density was measured by BioQuant Nova analysis system as described in the Methods and presented as mean ± SEM in pixel/mm2. ANOVA indicated a significant increase in GluT5 immunoreactivity, but not Iba-1, in alcoholics as compared to controls (*, p<0.05).
Fig. 5.
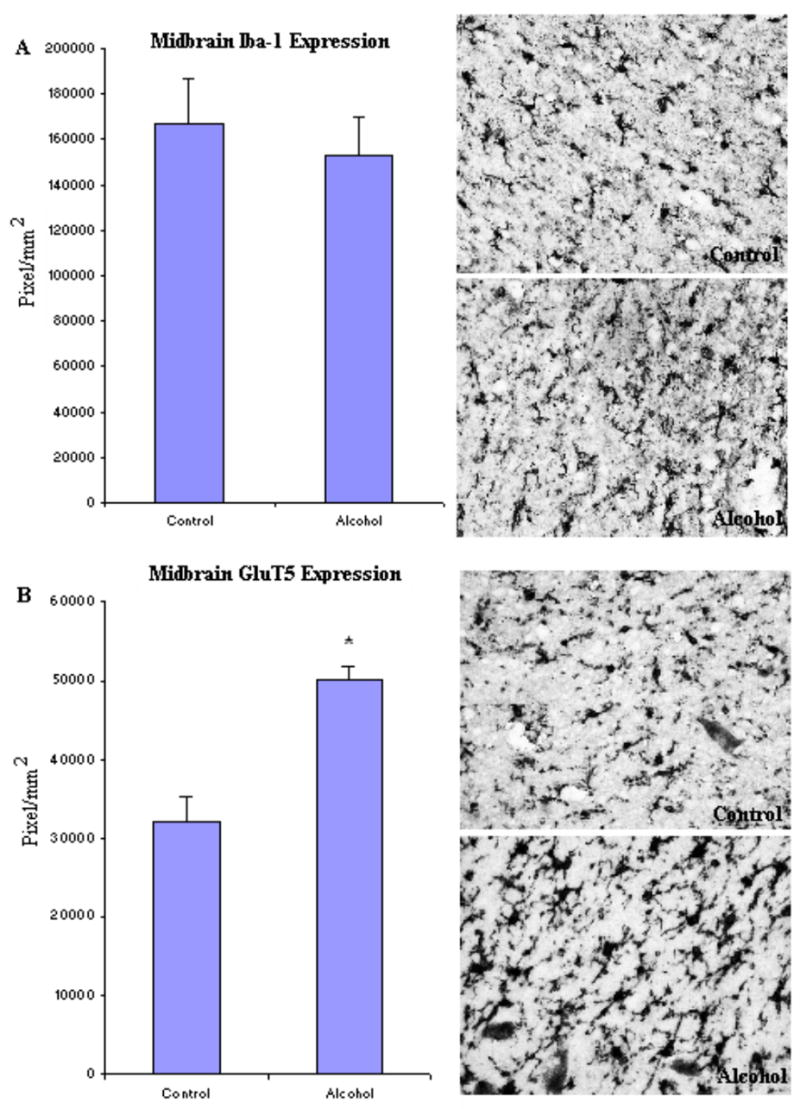
In Midbrain, the expression of GluT5, but not Iba-1 was significantly higher in the alcoholic brains (N=6) as compared to controls (N=5). The immunoreactive density was measured by BioQuant Nova analysis system as described in the Methods and presented as mean ± SEM in pixel/mm2. ANOVA indicated a significant increase in GluT5 immunoreactivity, but not Iba-1, in alcoholics as compared to controls (*, p<0.05).
Fig. 6.
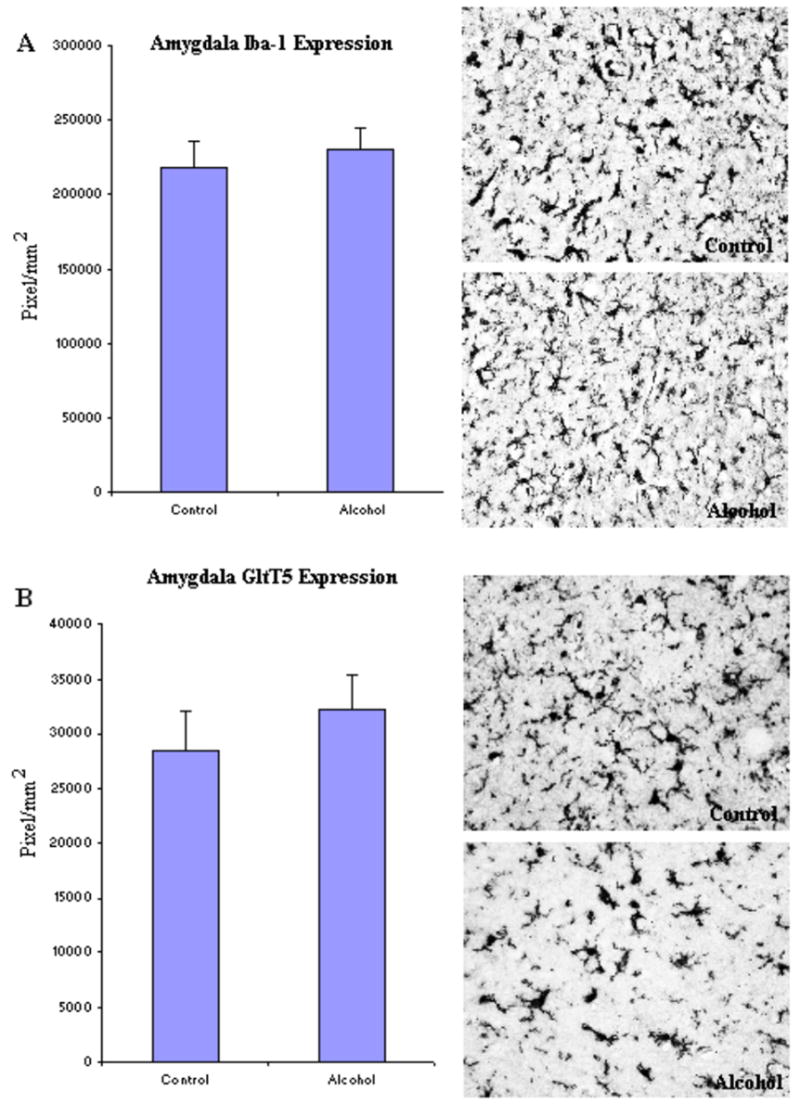
In Amygdala, no significant difference was detected in either Iba-1 or GluT5 expression between alcoholic (N=8) and control brains (N=8). The immunoreactive density measured by BioQuant Nova systems as described in the Methods and presented as mean ± SEM in pixel/mm2. ANOVA indicated no significant differences in either marker between alcoholic and control groups.
Discussion
We report here, for the first time, significantly increased MCP-1(CCL2) across multiple alcoholic brain regions. MCP-1 is a member of the Beta chemokine subfamily that signals through a G protein coupled receptor, CCR2 (Banisadr et al., 2002). Within the brain, MCP-1 is produced mostly by activated astrocytes and microglia (Glabinski et al., 1996). The impact of MCP-1 on neuroinflammation involves multiple pathways. As a classic chemoattractant, MCP-1 plays an important role in driving monocyte recruitment to injured tissue (Lu et al., 1998), possibly by increasing the permeability of the blood-brain-barrier (BBB) (Yamamoto et al., 2005; Stamatovic et al., 2003; Stamatovic et al., 2005). The subsequent migration and activation of these monocytes (microglia in the brain) leads to excessive production of proinflammatory/neurotoxic cytokines such IL-1β and TNFα (Kaul et al., 2001; Mahad and Ransohoff, 2003; Persidsky and Gendelman, 2003). Mice that overexpress MCP-1 show increased Iba-1 immunoreactivity and accelerated senescent neurodegeneration (Yamamoto et al., 2005). Moreover, the upregulation of MCP-1 in CNS tissue can exacerbate neuronal death and other pathologies occurs before the detectable monocyte recruitment (Rankine et al., 2006), indicating that the contributions of MCP-1 to neuroinflammation are far beyond its role as a chemoattractant (Hughes et al., 2002; Rankine et al., 2006). A recent study found that trimethyltin induced hippocampal degeneration involved marked MCP-1 induction, without TNFα, IL-1, IL-6, or other proinflammatory cytokines (Little et al., 2002). Endogenous MCP-1 is also known to directly induce neuronal apoptosis (Kalehua et al., 2004). Thus, increased MCP-1 in alcoholic brains could directly cause neuronal damage, and could be one of the mechanisms contributing to alcohol-related neuronal loss and brain atrophy (Brooks, 2000; Harper et al., 2003; Ikegami et al., 2003). Lastly, it has been proposed that MCP-1 can act as a “priming” stimulus for microglia (lowering their “threshold sensitivity”), enhancing their synthesis of proinflammatory cytokines in response to subsequent stimulation (Rankine et al., 2006). This priming of microglia can occur as a consequence of a wide range of CNS diseases and other stressors including alcohol exposure. Interestingly, transgenic mouse studies have indicated that downregulation of MCP-1 expression increases hypnotic response and decreases alcohol preference (Blednov et al., 2005). These data consistently indicate an association between the level of MCP-1 expression and alcoholic pathologies. Taken together, the current findings of increased MCP-1 in human alcoholic brain further support the critical involvement of neuroinflammation in both behavioral and neurodegenerative pathologies associated with alcoholism.
Since enhanced levels of MCP-1 expression can lead to activation or migration of microglia, we chose two specific microglial markers, Iba-1 and GluT5 to identify and study microglia in alcoholic brains as compared to controls. Microglia undergo a series of characteristic morphological transformations that are thought to represent stages of increasing proinflammatory and phagocytic activity that coincide with induction of many proteins, including the constitutively expressed microglial markers, Iba-1 and GluT5. Morphologically, we observed all forms of microglia: ramified (resting), activated, and ameboid (phagocytic) microglia in both alcoholic brains and controls across multiple brain regions. Microglia are known to have increasingly diverse morphologies, including the highly activated phagocytic phenotypes in normal senescent brains as well as increased numbers of activated monocytes in degenerative diseases. Our tissues used for histochemistry are from patients with ages ranging from 52–82 years at death. We could not detect differences between alcoholic and control brains in the spectrum of microglial morphologies. However, the advanced age of our subjects may have masked alcohol induced changes.
We found increased microglial markers, both Iba-1 and GluT5 immunoreactivity, in cingulate cortex of alcoholics. Cingulate cortex, along with prefrontal areas, contribute to the frontal attention system with cingulate cortex representing a cross road between the limbic system and frontal cortex (Fuster, 1997). It has been suggested that the disruption of cognitive function by alcohol exposure could be due to its effects on frontal cortical areas (Tu et al., 2007). Increases in microglial immunoreactivity indicate the enhanced microglia number or their activation in this region. Increases in microglial specific staining could be due to more microglia and/or larger activated microglia. Since we did not see significant changes in morphology, these findings likely indicated that the cingulate cortex of alcoholics has about 2-fold more microglia than moderate drinking controls. This could at least partially result from the increased MCP-1 expression, which in turn leads to the migration and/or proliferation of microglia in cingulate cortex.
In VTA and midbrain, we found a significant increase in GluT5 staining, but not Iba-1. This discrepancy could be the result of the higher sensitivity with human-specific GluT5 antibody as compared to Iba-1, which identifies microglia from human, mouse and rat (Ohsawa et al., 2004). Microglia are known to alter expression of multiple proteins as they progress through various states of activation. However, both Iba-1 and GluT5 are microglia markers that are expressed at all stages of microglial activation, although their expression increases with activation. It is possible that alcohol-induced changes in VTA and midbrain GluT5 are relatively subtle, which can be detected only by the more sensitive GluT5 marker, but not by Iba-1. Regardless, the increase in VTA and midbrain GluT5 staining is consistent with increased microglia activation. Although the precise role of VTA in drinking behavior is not known, studies have suggested the dopamine D2 receptors in VTA neurons are responsible for drinking behaviors (Eiler and June, 2007). However, these receptors are also expressed on microglia in VTA (Farber et al., 2005), which imply the involvement of VTA microglia in alcohol-related pathogenesis. Thus, increased VTA microglia activation could one of the mechanisms contributing to alcoholism. In amygdala, no detectable differences were found in the immunoreactivity of either GluT5 or Iba-1 between alcoholic and control groups. Although studies have shown that amygdala is a key region medicating anxiety-like behaviors associated with chronic alcohol exposure and withdrawal (Knapp et al., 2007; Lack et al., 2007), the functional roles of the microglia in this region are unknown.
Taken together, the current findings indicate a region specific increase in microglia activities. Although the exact mechanisms of this regional discrepancy are unclear, we speculate that the increase in microglia in the cingular cortex reflexes higher vulnerability of this region to alcohol-induced inflammatory changes. Chronic alcohol exposure to mice has been shown to cause cellular changes in cingular cortex (Marrero-Gordillo et al., 1998) and to disrupt cognitive function (Tu et al., 2007). Furthermore, although the exact mechanism of increased microglial activation is not known, our data suggest that elevated MCP-1 levels could at least partially, contribute to increased microglia staining intensity. As the first responder to environmental insults, microglia are believed to play dual roles in both neurodegeneration and neuroprotection (Nimmerjahn et al., 2005). While local microglia activation at the injured site might be neuro-destructive by releasing cytotoxins (Meda et al., 1995; Brown et al., 1996; Barger and Harmon, 1997; McDonald et al., 1997), the delayed accumulation and activation of microglia resulting from MCP-1 could contribute to elimination of cellular debris and may be involved in neuroprotection by producing neurotrophic factors (Hermann et al., 2001; Laurenzi et al., 2001; Hashimoto et al., 2005; Lu et al., 2005 ). Although the relationship between microglia activation and MCP-1 expression in humans requires further investigation, our animal studies have found that chronic ethanol induces brain MCP-1 in mice (Qin et al., 2007) and binge alcohol withdrawal increases microglia in rat brains (Nixon and Crews, 2004). Even though many studies have found volume reduction in alcoholic brain, the specific loss of neurons in humans remains controversial (Harper, 1998). One study using unbiased sampling found a selective loss of superior frontal cortical neurons, particularly large pyramidal neurons in alcoholics (Kril et al., 1997). Our findings of increased MCP-1 and microglial markers could either contribute to or result from alcoholic neurodegeneration indicated by brain shrinkage and neuronal loss in human alcoholics. Altogether, our current findings support the role of inflammatory neurodegeneration in alcohol-related neuropathology of humans.
Acknowledgments
“Tissues were received from the Australian Brain Donor Programs NSW Tissue Resource Center which is supported by The University of Sydney, National Health and Medical Research Council of Australia, Schizophrenia Research Institute, National Institute of Alcohol Abuse and Alcoholism (NIAAA) and NSW Department of Health”. We would also like to thank Drs. Kimberly Nixon, Joyce Besheer, Clive Harpe, Donna Sheedy, and Therese Garrick for their scientific input and editorial support.
Footnotes
Publisher's Disclaimer: This is a PDF file of an unedited manuscript that has been accepted for publication. As a service to our customers we are providing this early version of the manuscript. The manuscript will undergo copyediting, typesetting, and review of the resulting proof before it is published in its final citable form. Please note that during the production process errors may be discovered which could affect the content, and all legal disclaimers that apply to the journal pertain.
References
- Banisadr G, Queraud-Lesaux F, Boutterin MC, Pelaprat D, Zalc B, Rostene W, Haour F, Parsadaniantz SM. Distribution, cellular localization and functional role of CCR2 chemokine receptors in adult rat brain. J Neurochem. 2002;81:257–269. doi: 10.1046/j.1471-4159.2002.00809.x. [DOI] [PubMed] [Google Scholar]
- Barger SW, Harmon AD. Microglial activation by Alzheimer amyloid precursor protein and modulation by apolipoprotein E. Nature. 1997;388:878–881. doi: 10.1038/42257. [DOI] [PubMed] [Google Scholar]
- Blednov YA, Bergeson SE, Walker D, Ferreira VM, Kuziel WA, Harris RA. Perturbation of chemokine networks by gene deletion alters the reinforcing actions of ethanol. Behav Brain Res. 2005;165:110–125. doi: 10.1016/j.bbr.2005.06.026. [DOI] [PMC free article] [PubMed] [Google Scholar]
- Block ML, Zecca L, Hong JS. Microglia-mediated neurotoxicity: uncovering the molecular mechanisms. Nat Rev Neurosci. 2007;8:57–69. doi: 10.1038/nrn2038. [DOI] [PubMed] [Google Scholar]
- Brooks PJ. Brain atrophy and neuronal loss in alcoholism: a role for DNA damage? Neurochem Int. 2000;37:403–412. doi: 10.1016/s0197-0186(00)00051-6. [DOI] [PubMed] [Google Scholar]
- Brown DR, Schmidt B, Kretzschmar HA. Role of microglia and host prion protein in neurotoxicity of a prion protein fragment. Nature. 1996;380:345–347. doi: 10.1038/380345a0. [DOI] [PubMed] [Google Scholar]
- Chen Y, Hallenbeck JM, Ruetzler C, Bol D, Thomas K, Berman NE, Vogel SN. Overexpression of monocyte chemoattractant protein 1 in the brain exacerbates ischemic brain injury and is associated with recruitment of inflammatory cells. J Cereb Blood Flow Metab. 2003;23:748–755. doi: 10.1097/01.WCB.0000071885.63724.20. [DOI] [PubMed] [Google Scholar]
- Crews FT, Nixon K, Wilkie ME. Exercise reverses ethanol inhibition of neural stem cell proliferation. Alcohol. 2004;33:63–71. doi: 10.1016/j.alcohol.2004.04.005. [DOI] [PubMed] [Google Scholar]
- Crews FT, Bechara R, Brown LA, Guidot DM, Mandrekar P, Oak S, Qin L, Szabo G, Wheeler M, Zou J. Cytokines and alcohol. Alcohol Clin Exp Res. 2006;30:720–730. doi: 10.1111/j.1530-0277.2006.00084.x. [DOI] [PubMed] [Google Scholar]
- Eiler WJ, 2nd, June HL. Blockade of GABA(A) receptors within the extended amygdala attenuates D(2) regulation of alcohol-motivated behaviors in the ventral tegmental area of alcohol-preferring (P) rats. Neuropharmacology. 2007 doi: 10.1016/j.neuropharm.2007.03.001. [DOI] [PMC free article] [PubMed] [Google Scholar]
- Farber K, Pannasch U, Kettenmann H. Dopamine and noradrenaline control distinct functions in rodent microglial cells. Mol Cell Neurosci. 2005;29:128–138. doi: 10.1016/j.mcn.2005.01.003. [DOI] [PubMed] [Google Scholar]
- Fuster JM. The prefrontal cortex: anatomy, physiology, and neuropsychology of the frontal lobe. New York: Raven Press; 1997. [Google Scholar]
- Gehrmann J, Matsumoto Y, Kreutzberg GW. Microglia: intrinsic immuneffector cell of the brain. Brain Res Brain Res Rev. 1995;20:269–287. doi: 10.1016/0165-0173(94)00015-h. [DOI] [PubMed] [Google Scholar]
- Glabinski AR, Balasingam V, Tani M, Kunkel SL, Strieter RM, Yong VW, Ransohoff RM. Chemokine monocyte chemoattractant protein-1 is expressed by astrocytes after mechanical injury to the brain. J Immunol. 1996;156:4363–4368. [PubMed] [Google Scholar]
- Harper C. The neuropathology of alcohol-specific brain damage, or does alcohol damage the brain? J Neuropathol Exp Neurol. 1998;57:101–110. doi: 10.1097/00005072-199802000-00001. [DOI] [PubMed] [Google Scholar]
- Harper C, Dixon G, Sheedy D, Garrick T. Neuropathological alterations in alcoholic brains. Studies arising from the New South Wales Tissue Resource Centre. Prog Neuropsychopharmacol Biol Psychiatry. 2003;27:951–961. doi: 10.1016/S0278-5846(03)00155-6. [DOI] [PubMed] [Google Scholar]
- Hashimoto M, Nitta A, Fukumitsu H, Nomoto H, Shen L, Furukawa S. Involvement of glial cell line-derived neurotrophic factor in activation processes of rodent macrophages. J Neurosci Res. 2005;79:476–487. doi: 10.1002/jnr.20368. [DOI] [PubMed] [Google Scholar]
- Hermann DM, Kilic E, Kugler S, Isenmann S, Bahr M. Adenovirus-mediated glial cell line-derived neurotrophic factor (GDNF) expression protects against subsequent cortical cold injury in rats. Neurobiol Dis. 2001;8:964–973. doi: 10.1006/nbdi.2001.0448. [DOI] [PubMed] [Google Scholar]
- Horikoshi Y, Sasaki A, Taguchi N, Maeda M, Tsukagoshi H, Sato K, Yamaguchi H. Human GLUT5 immunolabeling is useful for evaluating microglial status in neuropathological study using paraffin sections. Acta Neuropathol (Berl) 2003;105:157–162. doi: 10.1007/s00401-002-0627-4. [DOI] [PubMed] [Google Scholar]
- Hughes PM, Allegrini PR, Rudin M, Perry VH, Mir AK, Wiessner C. Monocyte chemoattractant protein-1 deficiency is protective in a murine stroke model. J Cereb Blood Flow Metab. 2002;22:308–317. doi: 10.1097/00004647-200203000-00008. [DOI] [PubMed] [Google Scholar]
- Ikegami Y, Goodenough S, Inoue Y, Dodd PR, Wilce PA, Matsumoto I. Increased TUNEL positive cells in human alcoholic brains. Neurosci Lett. 2003;349:201–205. doi: 10.1016/s0304-3940(03)00826-7. [DOI] [PubMed] [Google Scholar]
- Kalehua AN, Nagel JE, Whelchel LM, Gides JJ, Pyle RS, Smith RJ, Kusiak JW, Taub DD. Monocyte chemoattractant protein-1 and macrophage inflammatory protein-2 are involved in both excitotoxin-induced neurodegeneration and regeneration. Exp Cell Res. 2004;297:197–211. doi: 10.1016/j.yexcr.2004.02.031. [DOI] [PubMed] [Google Scholar]
- Kaul M, Garden GA, Lipton SA. Pathways to neuronal injury and apoptosis in HIV-associated dementia. Nature. 2001;410:988–994. doi: 10.1038/35073667. [DOI] [PubMed] [Google Scholar]
- Knapp DJ, Overstreet DH, Angel RA, Navarro M, Breese GR. The amygdala regulates the antianxiety sensitization effect of flumazenil during repeated chronic ethanol or repeated stress. Alcohol Clin Exp Res. 2007;31:1872–1882. doi: 10.1111/j.1530-0277.2007.00514.x. [DOI] [PMC free article] [PubMed] [Google Scholar]
- Kril JJ, Halliday GM, Svoboda MD, Cartwright H. The cerebral cortex is damaged in chronic alcoholics. Neuroscience. 1997;79:983–998. doi: 10.1016/s0306-4522(97)00083-3. [DOI] [PubMed] [Google Scholar]
- Lack AK, Diaz MR, Chappell A, Dubois DW, McCool BA, Knapp DJ, Overstreet DH, Angel RA, Navarro M, Breese GR. Chronic Ethanol and Withdrawal Differentially Modulate Pre- and Post-synaptic Function at Glutamatergic Synapses in Rat Basolateral Amygdala The amygdala regulates the antianxiety sensitization effect of flumazenil during repeated chronic ethanol or repeated stress. J Neurophysiol. 2007;31:1872–1882. [Google Scholar]
- Ladeby R, Wirenfeldt M, Garcia-Ovejero D, Fenger C, Dissing-Olesen L, Dalmau I, Finsen B. Microglial cell population dynamics in the injured adult central nervous system. Brain Res Brain Res Rev. 2005;48:196–206. doi: 10.1016/j.brainresrev.2004.12.009. [DOI] [PubMed] [Google Scholar]
- Laurenzi MA, Arcuri C, Rossi R, Marconi P, Bocchini V. Effects of microenvironment on morphology and function of the microglial cell line BV-2. Neurochem Res. 2001;26:1209–1216. doi: 10.1023/a:1013911205494. [DOI] [PubMed] [Google Scholar]
- Lee H, Jeong J, Son E, Mosa A, Cho GJ, Choi WS, Ha JH, Kim IK, Lee MG, Kim CY, Suk K. Ethanol selectively modulates inflammatory activation signaling of brain microglia. J Neuroimmunol. 2004;156:88–95. doi: 10.1016/j.jneuroim.2004.07.008. [DOI] [PubMed] [Google Scholar]
- Little AR, Benkovic SA, Miller DB, O’Callaghan JP. Chemically induced neuronal damage and gliosis: enhanced expression of the proinflammatory chemokine, monocyte chemoattractant protein (MCP)-1, without a corresponding increase in proinflammatory cytokines(1) Neuroscience. 2002;115:307–320. doi: 10.1016/s0306-4522(02)00359-7. [DOI] [PubMed] [Google Scholar]
- Lu B, Rutledge BJ, Gu L, Fiorillo J, Lukacs NW, Kunkel SL, North R, Gerard C, Rollins BJ. Abnormalities in monocyte recruitment and cytokine expression in monocyte chemoattractant protein 1-deficient mice. J Exp Med. 1998;187:601–608. doi: 10.1084/jem.187.4.601. [DOI] [PMC free article] [PubMed] [Google Scholar]
- Lu YZ, Lin CH, Cheng FC, Hsueh CM. Molecular mechanisms responsible for microglia-derived protection of Sprague-Dawley rat brain cells during in vitro ischemia. Neurosci Lett. 2005;373:159–164. doi: 10.1016/j.neulet.2004.10.004. [DOI] [PubMed] [Google Scholar]
- Mahad DJ, Ransohoff RM. The role of MCP-1 (CCL2) and CCR2 in multiple sclerosis and experimental autoimmune encephalomyelitis (EAE) Semin Immunol. 2003;15:23–32. doi: 10.1016/s1044-5323(02)00125-2. [DOI] [PubMed] [Google Scholar]
- Marrero-Gordillo N, Perez-Delgado MM, Carmona-Calero E, Perez-Gonzalez H, Ferres-Torres R, Castaneyra-Perdomo A. Effects of alcohol and aging on the cingular (area 24) and frontal (area 6) cortical areas of the mouse. Histol Histopathol. 1998;13:611–617. doi: 10.14670/HH-13.611. [DOI] [PubMed] [Google Scholar]
- McClain CJ, Cohen DA. Increased tumor necrosis factor production by monocytes in alcoholic hepatitis. Hepatology. 1989;9:349–351. doi: 10.1002/hep.1840090302. [DOI] [PubMed] [Google Scholar]
- McClain CJ, Barve S, Deaciuc I, Kugelmas M, Hill D. Cytokines in alcoholic liver disease. Semin Liver Dis. 1999;19:205–219. doi: 10.1055/s-2007-1007110. [DOI] [PubMed] [Google Scholar]
- McClain CJ, Song Z, Barve SS, Hill DB, Deaciuc I. Recent advances in alcoholic liver disease. IV. Dysregulated cytokine metabolism in alcoholic liver disease. Am J Physiol Gastrointest Liver Physiol. 2004;287:G497–502. doi: 10.1152/ajpgi.00171.2004. [DOI] [PubMed] [Google Scholar]
- McDonald DR, Brunden KR, Landreth GE. Amyloid fibrils activate tyrosine kinase-dependent signaling and superoxide production in microglia. J Neurosci. 1997;17:2284–2294. doi: 10.1523/JNEUROSCI.17-07-02284.1997. [DOI] [PMC free article] [PubMed] [Google Scholar]
- McManus CM, Liu JS, Hahn MT, Hua LL, Brosnan CF, Berman JW, Lee SC. Differential induction of chemokines in human microglia by type I and II interferons. Glia. 2000;29:273–280. [PubMed] [Google Scholar]
- Meda L, Cassatella MA, Szendrei GI, Otvos L, Jr, Baron P, Villalba M, Ferrari D, Rossi F. Activation of microglial cells by beta-amyloid protein and interferon-gamma. Nature. 1995;374:647–650. doi: 10.1038/374647a0. [DOI] [PubMed] [Google Scholar]
- Nelson S, Kolls JK. Alcohol, host defence and society. Nat Rev Immunol. 2002;2:205–209. doi: 10.1038/nri744. [DOI] [PubMed] [Google Scholar]
- Nimmerjahn A, Kirchhoff F, Helmchen F. Resting microglial cells are highly dynamic surveillants of brain parenchyma in vivo. Science. 2005;308:1314–1318. doi: 10.1126/science.1110647. [DOI] [PubMed] [Google Scholar]
- Nixon K, Crews FT. Temporally specific burst in cell proliferation increases hippocampal neurogenesis in protracted abstinence from alcohol. J Neurosci. 2004;24:9714–9722. doi: 10.1523/JNEUROSCI.3063-04.2004. [DOI] [PMC free article] [PubMed] [Google Scholar]
- Ohsawa K, Imai Y, Sasaki Y, Kohsaka S. Microglia/macrophage-specific protein Iba1 binds to fimbrin and enhances its actin-bundling activity. J Neurochem. 2004;88:844–856. doi: 10.1046/j.1471-4159.2003.02213.x. [DOI] [PubMed] [Google Scholar]
- Pascual M, Blanco AM, Cauli O, Minarro J, Guerri C. Intermittent ethanol exposure induces inflammatory brain damage and causes long-term behavioural alterations in adolescent rats. Eur J Neurosci. 2007;25:541–550. doi: 10.1111/j.1460-9568.2006.05298.x. [DOI] [PubMed] [Google Scholar]
- Persidsky Y, Gendelman HE. Mononuclear phagocyte immunity and the neuropathogenesis of HIV-1 infection. J Leukoc Biol. 2003;74:691–701. doi: 10.1189/jlb.0503205. [DOI] [PubMed] [Google Scholar]
- Qin L, Wu X, Block ML, Liu Y, Breese GR, Hong JS, Knapp DJ, Crews FT. Systemic LPS causes chronic neuroinflammation and progressive neurodegeneration. Glia. 2007;55:453–462. doi: 10.1002/glia.20467. [DOI] [PMC free article] [PubMed] [Google Scholar]
- Rankine EL, Hughes PM, Botham MS, Perry VH, Felton LM. Brain cytokine synthesis induced by an intraparenchymal injection of LPS is reduced in MCP-1-deficient mice prior to leucocyte recruitment. Eur J Neurosci. 2006;24:77–86. doi: 10.1111/j.1460-9568.2006.04891.x. [DOI] [PubMed] [Google Scholar]
- Sasaki A, Yamaguchi H, Horikoshi Y, Tanaka G, Nakazato Y. Expression of glucose transporter 5 by microglia in human gliomas. Neuropathol Appl Neurobiol. 2004;30:447–455. doi: 10.1111/j.1365-2990.2004.00556.x. [DOI] [PubMed] [Google Scholar]
- Stamatovic SM, Keep RF, Kunkel SL, Andjelkovic AV. Potential role of MCP-1 in endothelial cell tight junction ‘opening’: signaling via Rho and Rho kinase. J Cell Sci. 2003;116:4615–4628. doi: 10.1242/jcs.00755. [DOI] [PubMed] [Google Scholar]
- Stamatovic SM, Shakui P, Keep RF, Moore BB, Kunkel SL, Van Rooijen N, Andjelkovic AV. Monocyte chemoattractant protein-1 regulation of blood-brain barrier permeability. J Cereb Blood Flow Metab. 2005;25:593–606. doi: 10.1038/sj.jcbfm.9600055. [DOI] [PubMed] [Google Scholar]
- Tu Y, Kroener S, Abernathy K, Lapish C, Seamans J, Chandler LJ, Woodward JJ. Ethanol inhibits persistent activity in prefrontal cortical neurons. J Neurosci. 2007;27:4765–4775. doi: 10.1523/JNEUROSCI.5378-06.2007. [DOI] [PMC free article] [PubMed] [Google Scholar]
- Vannucci SJ, Maher F, Simpson IA. Glucose transporter proteins in brain: delivery of glucose to neurons and glia. Glia. 1997;21:2–21. doi: 10.1002/(sici)1098-1136(199709)21:1<2::aid-glia2>3.0.co;2-c. [DOI] [PubMed] [Google Scholar]
- Yamamoto M, Horiba M, Buescher JL, Huang D, Gendelman HE, Ransohoff RM, Ikezu T. Overexpression of monocyte chemotactic protein-1/CCL2 in beta-amyloid precursor protein transgenic mice show accelerated diffuse beta-amyloid deposition. Am J Pathol. 2005;166:1475–1485. doi: 10.1016/s0002-9440(10)62364-4. [DOI] [PMC free article] [PubMed] [Google Scholar]